Article

A Variational Mode Snake-Optimized Neural Network Prediction Model for Agricultural Land Subsidence Monitoring Based on Temporal InSAR Remote Sensing

1
Jiangxi Institute of Natural Resources Mapping and Monitoring, Nanchang 330002, China
2
School of Geomatics and Urban Spatial Informatics, Beijing University of Civil Engineering and Architecture, Beijing 102616, China
3
International Joint Laboratory of Safety and Energy Conservation for Ancient Buildings, Ministry of Education, Beijing 100044, China
*
Author to whom correspondence should be addressed.
Processes 2025, 13(11), 3480; https://doi.org/10.3390/pr13113480
Submission received: 1 October 2025 / Revised: 21 October 2025 / Accepted: 25 October 2025 / Published: 29 October 2025
(This article belongs to the Section AI-Enabled Process Engineering)

Abstract

Interferometric Synthetic Aperture Radar (InSAR) technology is crucial for large-scale land subsidence analysis in cultivated areas within hilly and mountainous regions. Accurate prediction of this subsidence is of significant importance for agricultural resource management and planning. Addressing the limitations of existing subsidence prediction methods in terms of accuracy and model selection, this paper proposes a deep neural network prediction model based on Variational Mode Decomposition (VMD) and the Snake Optimizer (SO), termed VMD-SO-CNN-LSTM-MATT. VMD decomposes complex subsidence signals into stable intrinsic components, improving input data quality. The SO algorithm is introduced to globally optimize model parameters, preventing local optima and enhancing prediction accuracy. This model utilizes time–series subsidence data extracted via the SBAS-InSAR technique as input. Initially, the original sequence is decomposed into multiple intrinsic mode functions (IMFs) using VMD. Subsequently, a CNN-LSTM network incorporating a Multi-Head Attention mechanism (MATT) is employed to model and predict each component. Concurrently, the SO algorithm performs global optimization of the model hyperparameters. Experimental results demonstrate that the proposed model significantly outperforms comparative models (traditional Long Short-Term Memory (LSTM) neural network, VMD-CNN-LSTM-MATT, and Sparrow Search Algorithm (SSA)-optimized CNN-LSTM) across key metrics: Mean Absolute Error (MAE), Root Mean Square Error (RMSE), and Mean Absolute Percentage Error (MAPE). Specifically, the reductions achieved are minimum improvements of 29.85% for MAE, 8.42% for RMSE, and 33.69% for MAPE. This model effectively enhances the prediction accuracy of land subsidence in cultivated hilly and mountainous areas, validating its high reliability and practicality for subsidence monitoring and prediction tasks.

1. Introduction

In hilly and mountainous areas, monitoring cropland subsidence is not only an indicator of agricultural technological advancement but also a crucial component of sustainable resource management. The complex and varied terrain in these regions poses significant challenges for monitoring surface changes, particularly subtle ground subsidence. Subsidence refers to the gradual downward displacement of the Earth’s surface due to natural or anthropogenic factors such as groundwater extraction, soil compaction, mining, or tectonic activity. In agricultural regions, it is often induced by excessive irrigation, drainage, or the overexploitation of groundwater, which leads to soil consolidation and surface elevation decline. This phenomenon can negatively affect farmland productivity, infrastructure safety, and ecological stability. The conflict between urban construction land and agricultural productive land is becoming increasingly prominent. In the study area of Yanshan County, the occurrence of agricultural land subsidence is mainly attributed to the overexploitation of groundwater for irrigation, the seasonal fluctuation of the phreatic level, and the repeated wetting–drying cycles of clay-rich soils. These processes lead to soil compaction and structural weakening of the subsurface layers, gradually resulting in cumulative ground lowering. In addition, the hilly terrain accelerates surface runoff and intensifies uneven settlement in valley zones with soft soil and frequent hydrological activity. The negative consequences of subsidence include reduced arable land productivity, damage to agricultural infrastructure such as irrigation channels and roads, groundwater storage loss, and potential ecological imbalance due to surface waterlogging and soil degradation. Accurately predicting cropland surface subsidence in advance is of great importance for agricultural resource management and regional sustainable development [1]. Conventional ground subsidence monitoring and analysis methods—such as leveling, GNSS, and acceleration sensors—are limited by low spatial resolution, difficulties in deploying target monitoring points, and high operational costs, making it challenging to achieve large-scale and high-spatial-resolution deformation monitoring and analysis. Interferometric Synthetic Aperture Radar (InSAR) technology, with its unique broad spatial coverage and high-resolution imaging capabilities, can provide continuous surface subsidence monitoring data [2,3,4,5], which is essential for predicting and managing agricultural irrigation, land use, and ecological conservation measures. Differential InSAR (DInSAR) typically uses SAR images from two time points to calculate ground deformation [6,7,8,9], while the Small Baseline Subset (SBAS-InSAR) technique analyzes small baseline subsets of multiple SAR images in a time series to better mitigate spatiotemporal decorrelation and provide continuous ground displacement monitoring [10,11,12].
Previous studies [6,7,8,9] have employed various InSAR techniques, such as PS-InSAR and SBAS-InSAR, to monitor land subsidence in agricultural and urban regions. These studies mainly focused on spatial deformation mapping and temporal trend extraction, achieving high precision in estimating surface displacement. However, most of them lacked predictive capability and did not incorporate intelligent optimization or deep learning frameworks to forecast future subsidence evolution.
In contrast, this study extends InSAR applications from static deformation monitoring to dynamic prediction. We integrate SBAS-InSAR-derived time-series deformation with a hybrid deep learning architecture that combines Variational Mode Decomposition (VMD), Convolutional Neural Networks (CNN), Long Short-Term Memory (LSTM), and Multi-Head Attention (MATT). Furthermore, the Snake Optimizer (SO) is introduced to globally optimize model parameters, enhancing convergence and prediction accuracy. This integrated framework effectively bridges the gap between traditional InSAR monitoring and intelligent subsidence prediction, demonstrating improved reliability and applicability for agricultural land deformation forecasting.
In terms of data processing and prediction models, numerical simulations such as finite element analysis are used to simulate complex geological structures, while data-driven approaches, especially machine learning and deep learning techniques, are emerging as new trends in predicting surface subsidence [13,14]. These methods can uncover complex patterns of surface change by analyzing large volumes of historical data, thereby improving prediction accuracy. Among them, the Long Short-Term Memory (LSTM) network model possesses long-term memory capability, making it well-suited for predicting seasonal and periodic data. Although LSTM demonstrates excellent performance in training and predicting time-series data, its prediction accuracy and generalization ability are still influenced by parameters such as learning rate, number of iterations, and number of neurons in the hidden layer [15]. Convolutional Neural Networks (CNN), with their design of convolutional and pooling layers, can automatically learn and extract local features from input data. When combined with LSTM, the structure of CNN reduces the number of model parameters, enhances generalization capability, and overcomes the issue of insufficient prediction accuracy in LSTM models [16,17,18]. Reference [19] proposed a landslide displacement prediction model combining isolation forest anomaly detection, ensemble Empirical Mode Decomposition, CNN, and LSTM, which significantly reduces overfitting and improves prediction accuracy. Reference [20] introduced a novel unified CNN with peephole LSTM (CNN-PhLSTM), integrating time-series InSAR deformation data with temporal distributed convolutional segmentation and stacked PhLSTM into a unified network model for predicting mining area subsidence. Combined forecasting models effectively address the limitations of single models in handling complex data by integrating multiple algorithms and techniques, synthesizing the advantages of different models to provide more accurate and robust prediction results. However, although CNN and LSTM excel at capturing spatial and temporal features, they encounter difficulties when dealing with highly nonlinear and non-stationary signals. The combined use of CNN and LSTM may lead to a significant increase in the number of model parameters, which not only raises training costs but may also cause overfitting.
VMD as an advanced signal processing technique, can decompose complex time-series data into several intrinsic mode functions, each representing an independent frequency component within the data. This overcomes the limitations of traditional statistical methods in modeling the complex nonlinear time series of surface subsidence and offers a more precise solution [21,22,23,24]. Unlike traditional Wavelet or Empirical Mode Decomposition (EMD) methods, which may suffer from mode mixing and sensitivity to noise, VMD adaptively separates complex non-stationary signals into a finite number of stable subcomponents through constrained variational optimization. This makes VMD more suitable for decomposing InSAR-derived time-series deformation data with irregular fluctuations. To address model overfitting and parameter optimization issues, the Snake Optimization (SO) algorithm—a global optimization algorithm—can help identify better model parameters and reduce local optima problems. It is suitable for solving complex optimization problems and offers advantages such as fast convergence, stable performance, strong robustness, and accurate results [25,26]. Compared with conventional metaheuristic algorithms such as Particle Swarm Optimization (PSO) or Genetic Algorithm (GA), SO exhibits stronger global search capability and faster convergence due to its adaptive position-update mechanism inspired by the motion behavior of snakes. This advantage allows SO to efficiently avoid local minima and achieve more stable parameter optimization for complex nonlinear prediction models.
In hilly cropland areas, monitoring and predicting land subsidence face specific challenges due to terrain heterogeneity and diverse land use. Based on the above analysis, and aiming to address issues such as strong non-stationarity of signals, difficulty in selecting prediction model parameters, and weak spatiotemporal feature extraction capability in predicting cropland surface subsidence in hilly and mountainous regions, this paper innovatively proposes a hybrid deep learning prediction model that integrates VMD, Snake Optimization (SO), Multi-Head Attention Mechanism (MATT), and CNN-LSTM. The specific innovations are as follows: (1) VMD is used to decompose the original non-stationary InSAR time-series signals into multiple frequency components to enhance input data stability; (2) SO is introduced to globally optimize the hyperparameters of the CNN-LSTM-MATT model, avoiding local optima and improving model generalization performance; (3) CNN is utilized to extract spatial local features, LSTM to model temporal dependencies, and MATT to enhance the modeling capability of key time steps, forming a synergistic mechanism that combines the advantages of multiple models suitable for dynamic prediction of cropland subsidence under nonlinear and multi-frequency interference backgrounds. Compared with traditional single-head attention mechanisms, the Multi-Head Attention (MATT) mechanism enables the model to capture feature dependencies across multiple subspaces simultaneously, improving its capacity to learn long-range temporal relationships and highlight key deformation stages. This allows the network to dynamically assign different attention weights to diverse temporal features, effectively enhancing interpretability and prediction stability in nonlinear time-series modeling. Similar approaches have demonstrated strong performance in spatiotemporal prediction tasks involving environmental and geophysical time series [16,18].
In summary, VMD adaptively decomposes non-stationary InSAR time-series signals into several intrinsic mode functions to extract stable features for modeling. The CNN-LSTM-MATT framework jointly captures spatial correlations, temporal dependencies, and attention-weighted key time steps, thereby improving the model’s ability to learn complex deformation patterns. Meanwhile, the Snake Optimizer (SO) algorithm efficiently performs global parameter tuning to enhance model convergence and prevent overfitting. This integrative framework ensures robust and accurate prediction of nonlinear, multi-frequency subsidence processes.
Compared to traditional single-structure prediction models, this research offers stronger robustness and higher accuracy in terms of network structure optimization, data preprocessing, and nonlinear feature modeling.

2. Design of Subsidence Prediction Network for Hilly and Mountainous Area

Due to the strong nonlinearity, high non-stationarity, and complex driving factors of cropland subsidence in hilly and mountainous regions, traditional statistical modeling and single neural networks exhibit limited performance and insufficient prediction accuracy when processing subsidence data. To address these issues, this paper constructs a hybrid deep learning model for subsidence prediction. By integrating signal decomposition, deep neural networks, and metaheuristic optimization algorithms, the model effectively handles data instability and difficulties in model parameter selection for subsidence forecasting.
First, the VMD algorithm is employed to decompose time-series InSAR subsidence data in the frequency domain. The original subsidence signal is adaptively decomposed into several intrinsic mode functions (IMFs), each representing an independent frequency band. Compared to traditional decomposition methods such as EMD, VMD offers greater mathematical rigor, effectively suppresses mode mixing, and reveals temporal characteristics of surface deformation across different frequency levels [21,23]. The VMD algorithm was employed to decompose InSAR time-series data into several intrinsic mode functions, each representing an independent frequency band. This provides a more stable and low-dimensional feature representation for model inputs.
To model multimodal subsidence features and temporal dependencies, a hybrid CNN-LSTM-MATT network architecture is designed. The CNN layer extracts local spatial features from the subsidence data, enhancing the model’s perception of local deformation patterns. The LSTM layer captures nonlinear dependencies in long time series, adapting to periodic or trend changes. The Multi-Head Attention (MATT) mechanism further explores weight differences among key time steps, enhancing the contribution of important inputs to prediction output through attention weighting [16]. This structure jointly models the subsidence evolution process from spatial, temporal, and weighting dimensions.
To mitigate the instability caused by hyperparameter selection in deep networks, SO is introduced to perform a global search for key parameters in the CNN-LSTM-MATT network, including the learning rate, number of LSTM neurons, attention head dimension, and regularization factors. By simulating snake foraging behavior, the SO efficiently explores the global search space to identify optimal parameter combinations, thereby improving model training effectiveness and generalization capability [15,21].
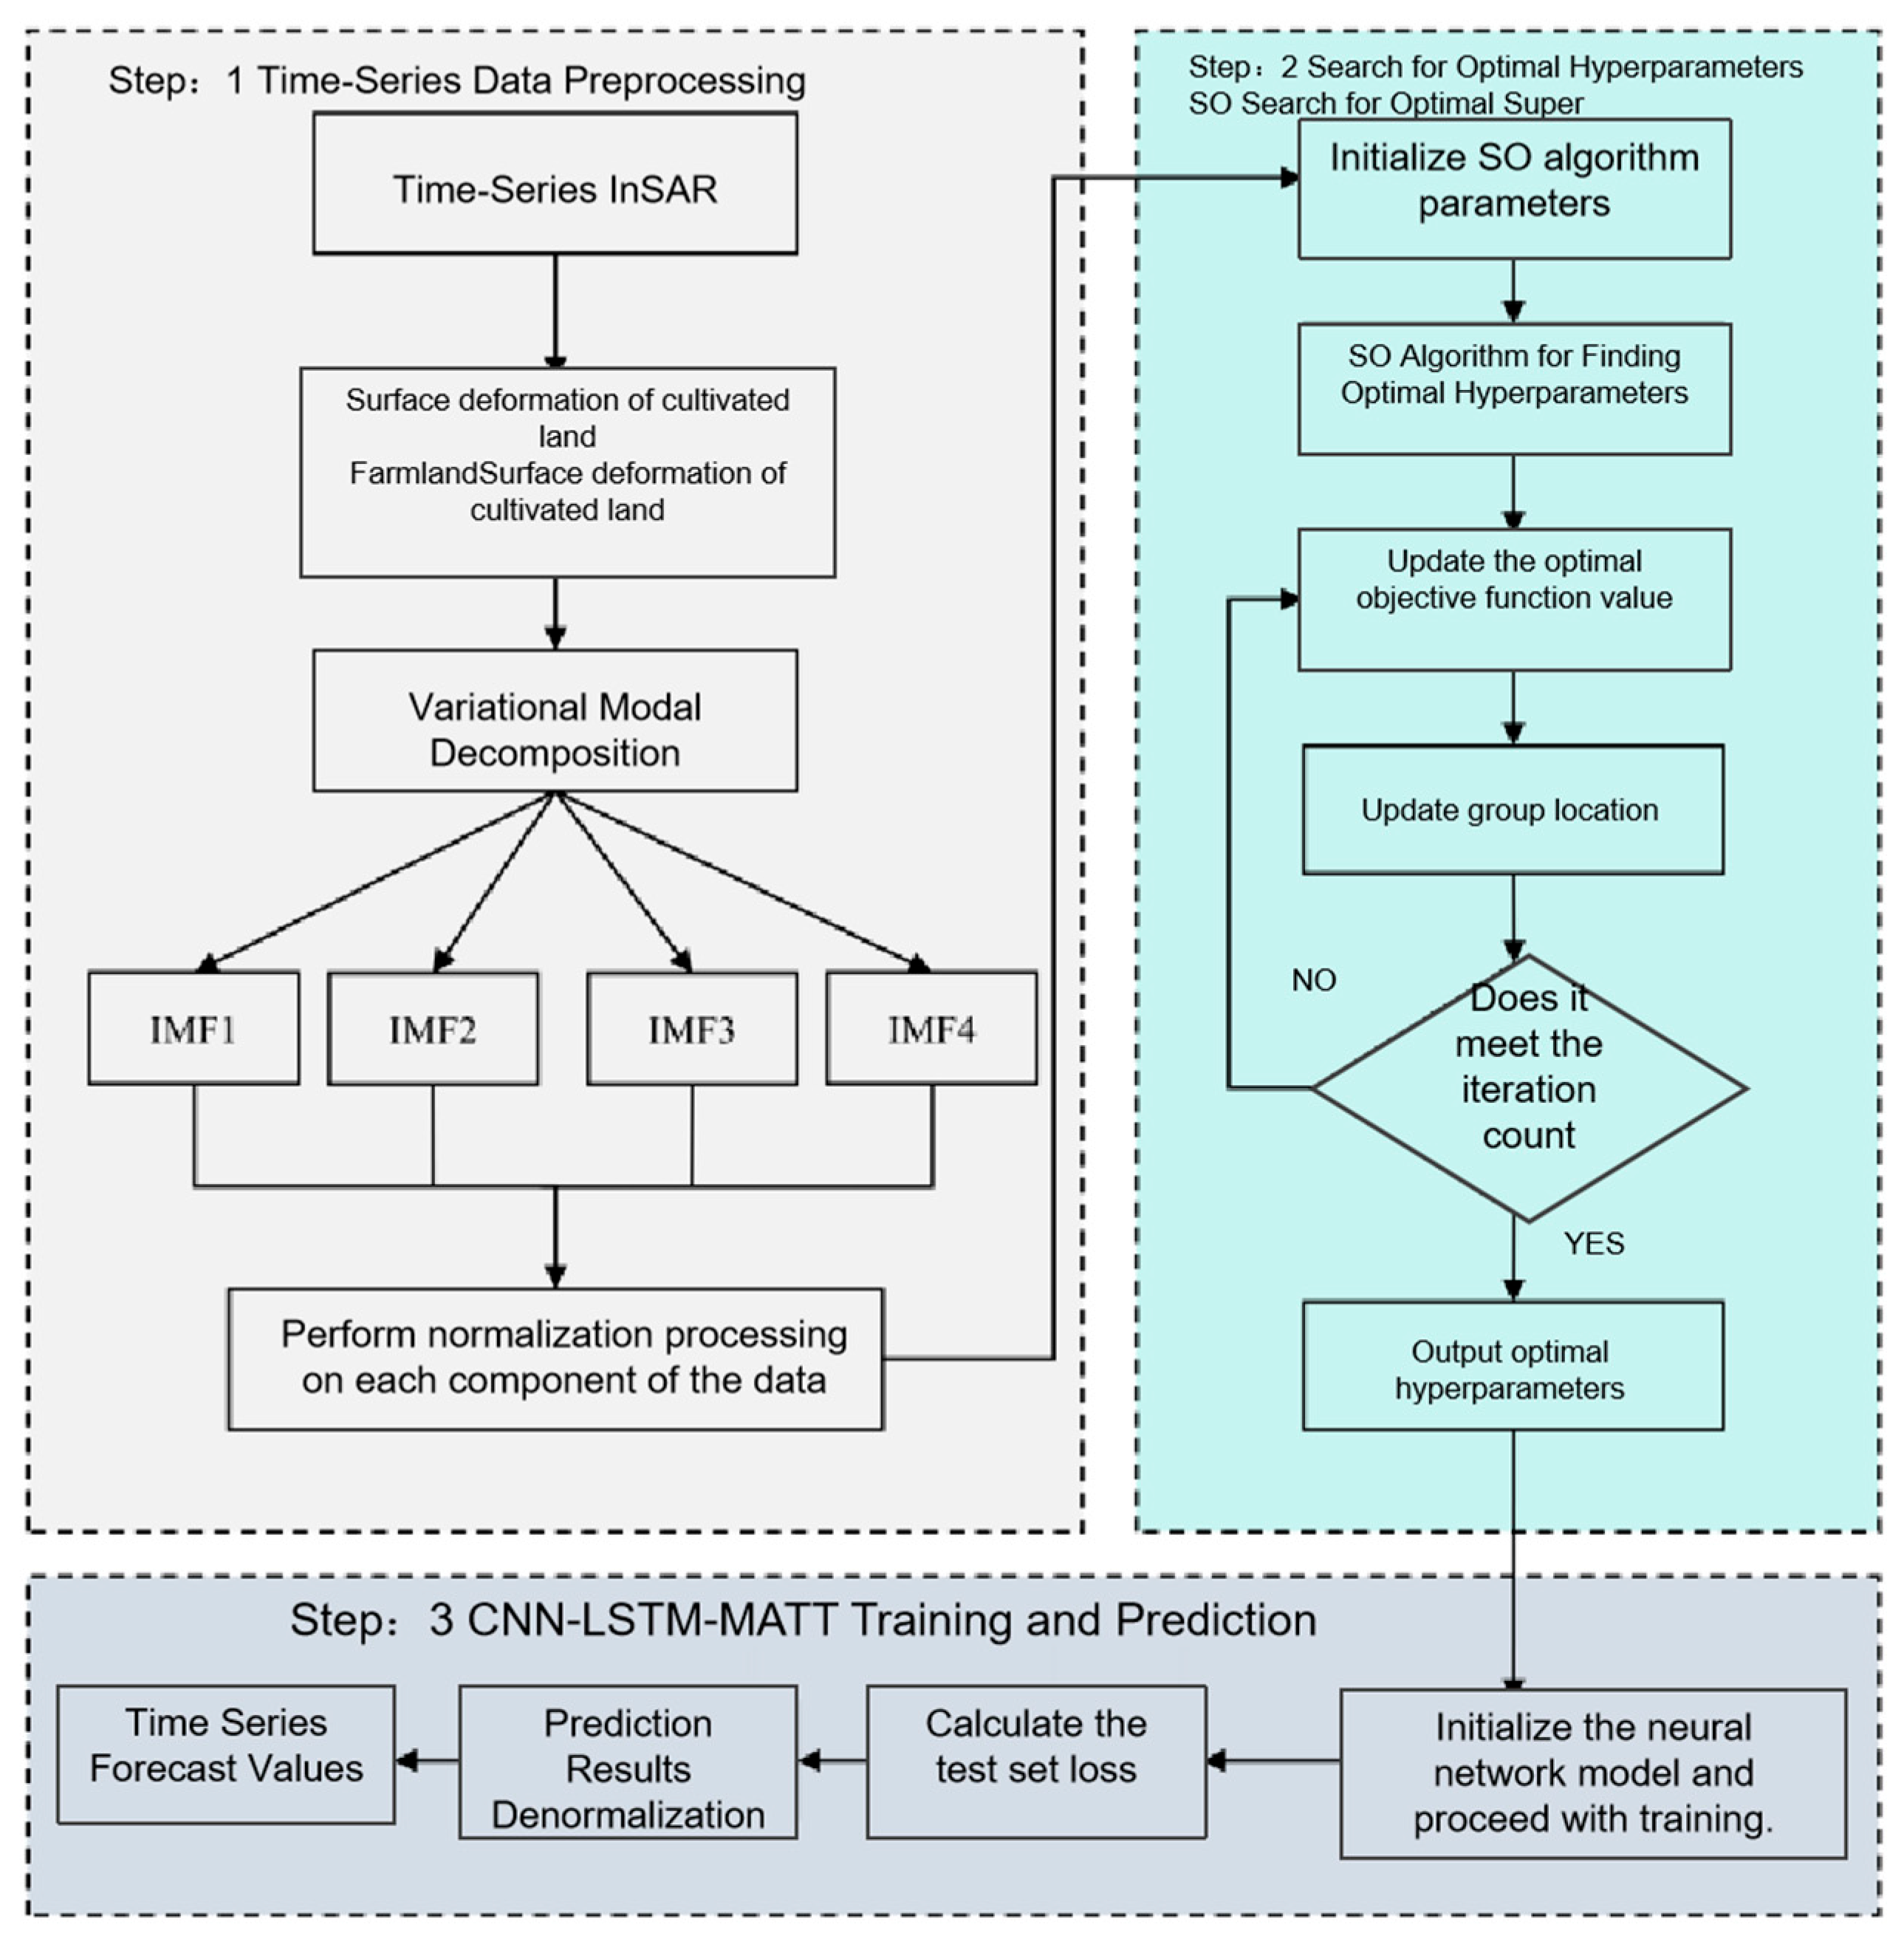
Integrating the above modules, the proposed VMD-SO-CNN-LSTM-MATT model structurally achieves a four-level synergistic mechanism: “non-stationary signal decomposition → deep spatiotemporal modeling → attention mechanism optimization → hyperparameter tuning.” This forms a subsidence prediction framework suitable for nonlinear, long-term, and multi-interference scenarios. The overall technical workflow is illustrated in Figure 1.
The initial stage of the model consists of a convolutional layer with 16 filters, each of size [3, 1] and a stride of [1, 1]. This stage also includes a batch normalization layer and an ReLU activation layer to enhance the network’s ability to process nonlinear data. By introducing a max-pooling layer with a size of [2, 1], the feature dimensions are further reduced, significantly decreasing the number of model parameters and computational complexity. The features processed by the CNN are passed to an LSTM layer with 25 units. The CNN layer automatically extracts spatial features from the surface subsidence data, while the LSTM layer captures temporal dependencies within these data. The gating mechanism of the LSTM finely regulates information flow, effectively managing complexity during learning and preventing overfitting.
The model incorporates a multi-head attention layer with eight heads, each with a dimension of 64, resulting in an overall input feature dimension of 512. This allows the model to focus more on key time steps that influence prediction outcomes. The design enables the model to learn information from the input sequence across multiple dimensions by computing weighted attention outputs to adjust the weights of key time steps in the LSTM layer. The self-attention computation process is replicated h times, each time using different linear transformations for queries, keys, and values. Finally, the outputs of these heads are concatenated and passed through a linear transformation to produce the final output, as shown in Equation (1):
M u l t i H e a d ( Q , K , V )   =   C o n c a t ( h e a d 1 ,   h e a d 2 ,   ,   h e a d h ) · W O
Here, each h e a d i represents the output of the self-attention mechanism, and h e a d i is a learnable linear transformation matrix. Each head independently computes its query, key, and value matrices, enabling the model to capture different aspects of the input data in parallel. To enhance the generalization capability of the model, a dropout layer is incorporated with a dropout rate of 0.2, meaning there is a 20% probability of discarding a portion of the attention weights, thereby improving the model’s generalization performance. To ensure a comprehensive description of the model architecture, the following elaborations on the network design are provided:
(1)
In the VMD module, the original InSAR cumulative subsidence time series is decomposed into four IMF components with distinct frequency characteristics. The model input consists of the normalized time series of each modality, and the output is the predicted subsidence value for future time steps. The residual term does not participate in the prediction process; the overall subsidence prediction is obtained by summing the predicted values of all modalities.
(2)
In the CNN-LSTM-MATT network structure, in addition to the main layers, a dropout layer is added to suppress overfitting, with a dropout rate set to 0.2 and applied after the multi-head attention output.
(3)
Considering the characteristics of InSAR data, the subsidence time series exhibits periodic trends. CNN is suitable for capturing spatial neighborhood features, LSTM is effective for modeling temporal dependencies, and MATT enhances the influence of key time windows. Together, they form a deep prediction framework tailored for non-stationary surface deformation scenarios.
In optimization problems, traditional optimization algorithms often struggle to effectively avoid local optima and exhibit low computational efficiency when dealing with high-dimensional and complex problems. This study employs the Snake Optimizer (SO), which first generates a uniformly distributed random population and classifies and selects each solution based on its fitness [15,21,23]. Inefficient solutions are eliminated through competitive behavior.
The initial population can be obtained using the following equation:
X i = X m i n + r · X m a x X m i n
In this context, X i denotes the position of the first individual, r is a random number between 0 and 1, while X m i n and X m a x represent the lower and upper bounds of the problem, respectively. X i , m signifies the position of a male during the exploration phase, X i , f represents the position of a female during the exploration phase, and X i , j indicates the position of a snake individual during the exploitation phase. Within the SO algorithm, the population is divided into male and female groups. Individuals (solutions) within each group interact based on their fitness (i.e., efficiency in solving the problem).
If Q < 0.25Q < 0.25, the snakes search for solutions by selecting any random position and updating the best solution space region. The update for the male snake’s solution space region is as follows:
X i , m t + 1 = X r a n d , m ( t ) ± c 2 · A m · ( ( X m a x X m i n ) · r a n d + X m i n
The update for the female snake’s best solution space region is as follows:
X i , f = X r a n d , f ( t + 1 ) ± c 2 × A f · ( ( X m a x X m i n ) · r a n d + X m i n
If Q > 0.25Q > 0.25 and the temperature Temp > 0.6Temp > 0.6, the snakes only move toward potential solutions:
X i , j t + 1 = X f o o d ± c 3 · T e m p · r a n d · ( X f o o d X i , j ( t ) )
Depending on the phase and conditions, each snake updates its position in the search space. This process is repeated for a set number of iterations or until the convergence criteria are met. The optimal solution (the snake with the highest fitness) is considered the best solution to the problem. For detailed procedures, refer to references [21,27].
In this model, the Snake Optimizer primarily optimizes the following four hyperparameters: the learning rate, the number of LSTM neurons, the key dimensions of the attention mechanism, and the regularization parameter. It iteratively searches for the optimal parameter combination by simulating the foraging behavior of snakes. The technical workflow is illustrated in Figure 2.
Due to the complex instability and nonlinearity of farmland surface subsidence data in hilly and mountainous areas, directly predicting subsidence monitoring results often fails to achieve the desired outcomes. This paper proposes a novel neural network model with the following steps:
First, VMD is applied to decompose the original time-series data into multiple sub-signals with intrinsic frequencies. The purpose of this step is to extract more stable and interpretable components from the complex dataset.
Based on the decomposed modes obtained from VMD, a feature set for machine learning is constructed. This includes statistical features, frequency-domain features, and others. The most predictive features are selected, while redundant and irrelevant features are removed. Considering that a wide data span may affect the model’s convergence speed and prediction accuracy, the decomposed modal components are normalized [28,29].
Normalization helps unify the data scale, reduce numerical instability, and accelerate convergence during model training, thereby improving generalization and prediction stability [30,31].
x * = ( y m a x y m i n ) · ( x - x m i n ) ( x m a x x m i n ) + y m i n
Equation (6): in Equation (6), x represents a modal component, and the dataset is normalized into the interval [ymin, ymax].
A deep learning network architecture is then designed, where a Convolutional Neural Network (CNN) is used to automatically extract spatiotemporal features, and an LSTM is employed to capture long-term dependencies in time-series data. The Snake Optimization Algorithm is applied to optimize the hyperparameters of the CNN-LSTM-MATT model, thereby enhancing prediction performance.
The CNN-LSTM-MATT model is trained using the training dataset, with the Snake Optimization Algorithm continuously optimizing model parameters during the training process to ensure that the best network structure and parameter settings are achieved.
Finally, the subsidence prediction results of different models are compared with actual InSAR monitoring values to evaluate prediction accuracy.

3. Identification of Farmland Surface Subsidence in Hilly Areas Based on SBAS-InSAR

3.1. Study Area Overview and Data Sources

The study area selected is Yanshan County, Jiangxi Province, as shown in the left part of Figure 3. Yanshan is located in Shangrao City, Jiangxi Province, situated within the Wuyi Mountains. The northern part along the Xinjiang River contains small plains, the central part is predominantly hilly, and the southern part is mountainous. Yanshan County was selected as the study area because it represents a typical hilly agricultural region in southeastern China that has undergone rapid groundwater extraction and intensive irrigation practices over the past decade. These anthropogenic activities, combined with seasonal rainfall infiltration and compressible Quaternary clay layers, have triggered gradual ground subsidence and localized collapses [31,32]. Studying this region is crucial for understanding the mechanisms of farmland deformation and for developing predictive models to support sustainable agricultural management and land-use planning. The land-use distribution in Yanshan County for 2023 is illustrated in Figure 3, where the farmland area is relatively smaller than the forested area. The land-use data are derived from reference [33].
The Shuttle Radar Topography Mission (SRTM) 30 m digital elevation model was selected because it provides globally consistent and validated topographic data suitable for large-area InSAR processing. Compared with higher-resolution DEMs such as the 10 m ALOS AW3D30, the 30 m SRTM dataset offers higher temporal completeness, fewer voids in vegetated or mountainous terrain, and ensures phase stability in SBAS-InSAR processing for wide-coverage hilly regions [34]. Hence, the 30 m resolution was chosen to balance data accessibility, computational efficiency, and accuracy requirements for regional-scale deformation analysis.
The dataset used in this study was obtained from the Sentinel-1A satellite, which provides high-resolution radar imagery. Its revisit cycle is 12 days, and the observation period spans from October 2022 to May 2024. Precise orbit files and SRTM data with a resolution of 30 m were used to correct orbital errors and remove topographic phase effects.
To ensure the reliability and accuracy of the InSAR monitoring data, systematic preprocessing and quality assessment of the time-series images were conducted before data processing. First, system errors and topographic distortions were eliminated through DORIS orbital refinement and terrain correction. Second, to reduce noise caused by temporal and spatial decorrelation, the Goldstein filtering algorithm was applied for phase smoothing, and low-coherence pixels were masked to remove outliers. Meanwhile, to validate the accuracy of the InSAR results, several sites within the study area with ground-based GNSS observation records were selected as references for comparative analysis with the InSAR-derived deformation values. The results show that the deviation in the annual average subsidence rate between InSAR and GNSS is less than ±4 mm, which meets the accuracy requirements for surface subsidence prediction. This provides a reliable data foundation for subsequent model training and predictive analysis.

3.2. Monitoring, Identification, and Analysis of Farmland Subsidence in Hilly Areas of Yanshan County

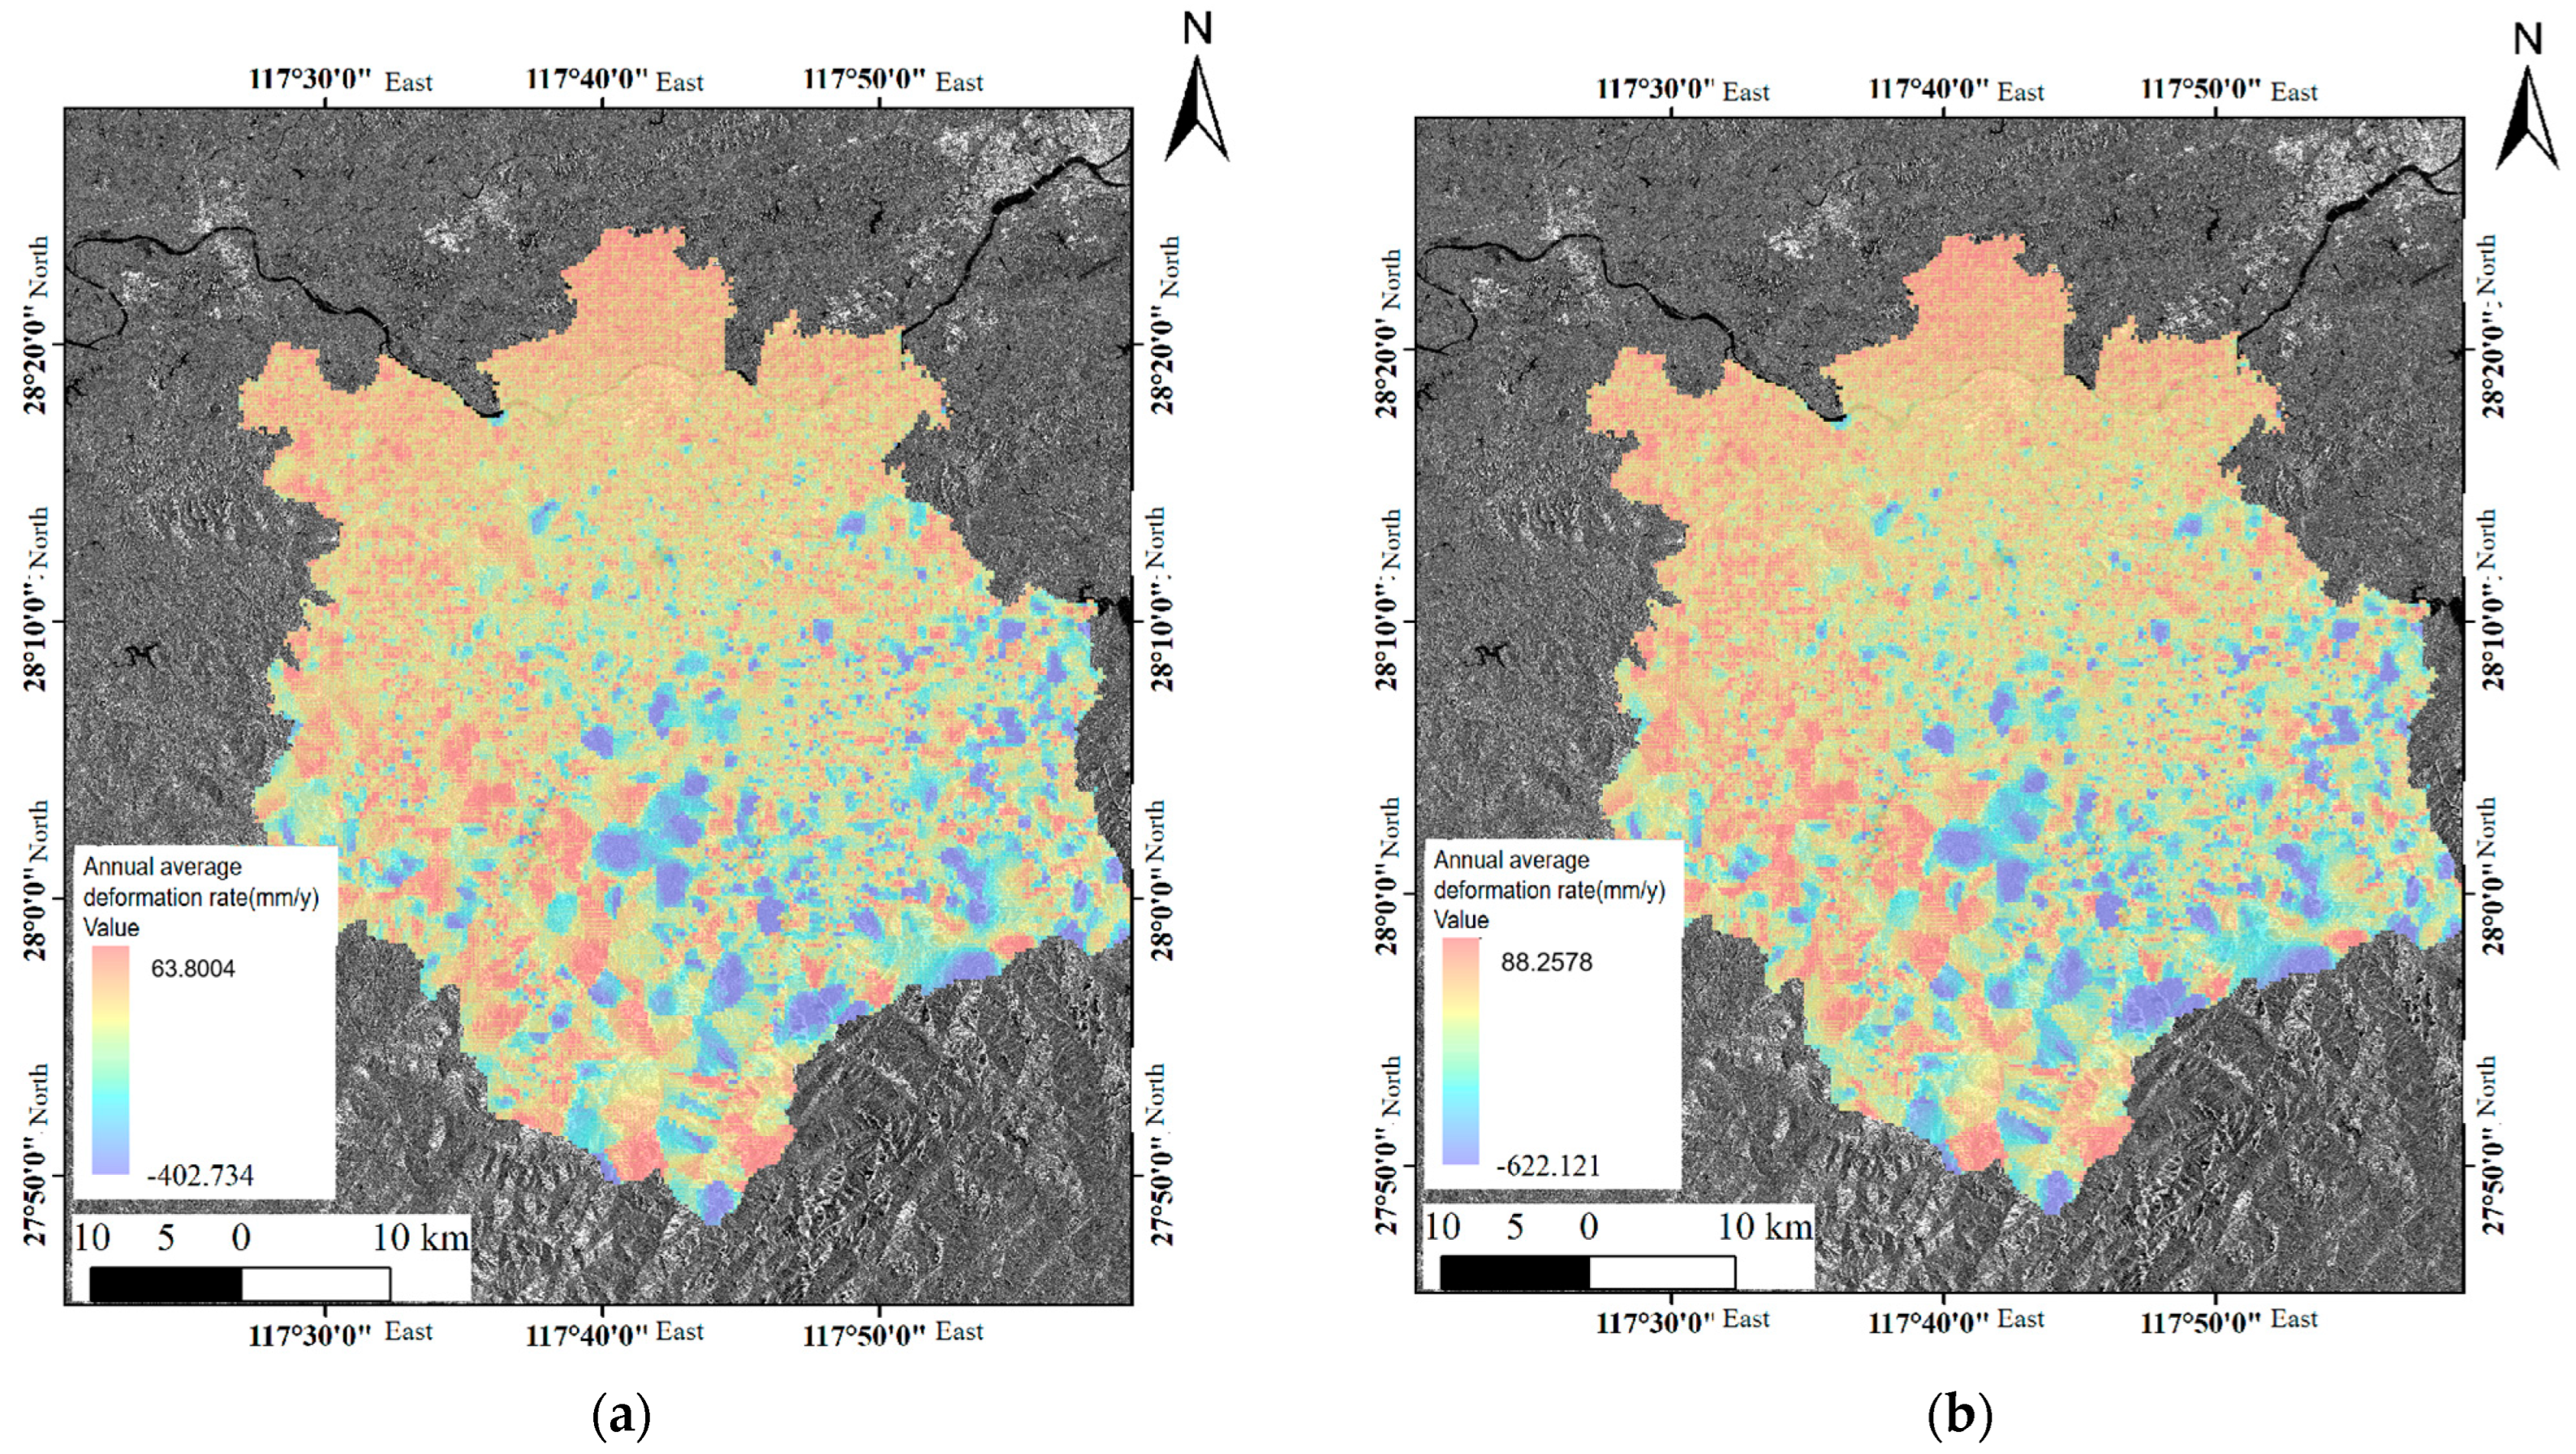
Based on SBAS-InSAR technology, Sentinel-1 images of the county were processed to obtain the overall subsidence from 2022 to 2024 and the subsidence rate map calculated by SBAS-InSAR, as shown in Figure 4. The experimental results indicate that, after Kriging interpolation, the annual average deformation rate along the LOS direction in Yanshan County ranges from −402.7 mm/y to −63.8 mm/y, with cumulative deformation between −622.1 mm and −88.2 mm. Subsidence-affected areas account for 74% of the county’s total area, among which most subsidence rates fall between −34.9 mm/y and −17.9 mm/y, covering 26% of the county and 35% of the subsidence area. The maximum subsidence rate can reach 402.7 mm/y.
As shown in Figure 4, subsidence in Yanshan County is mainly concentrated in valley areas, while only a small portion of flat areas exhibits subsidence.
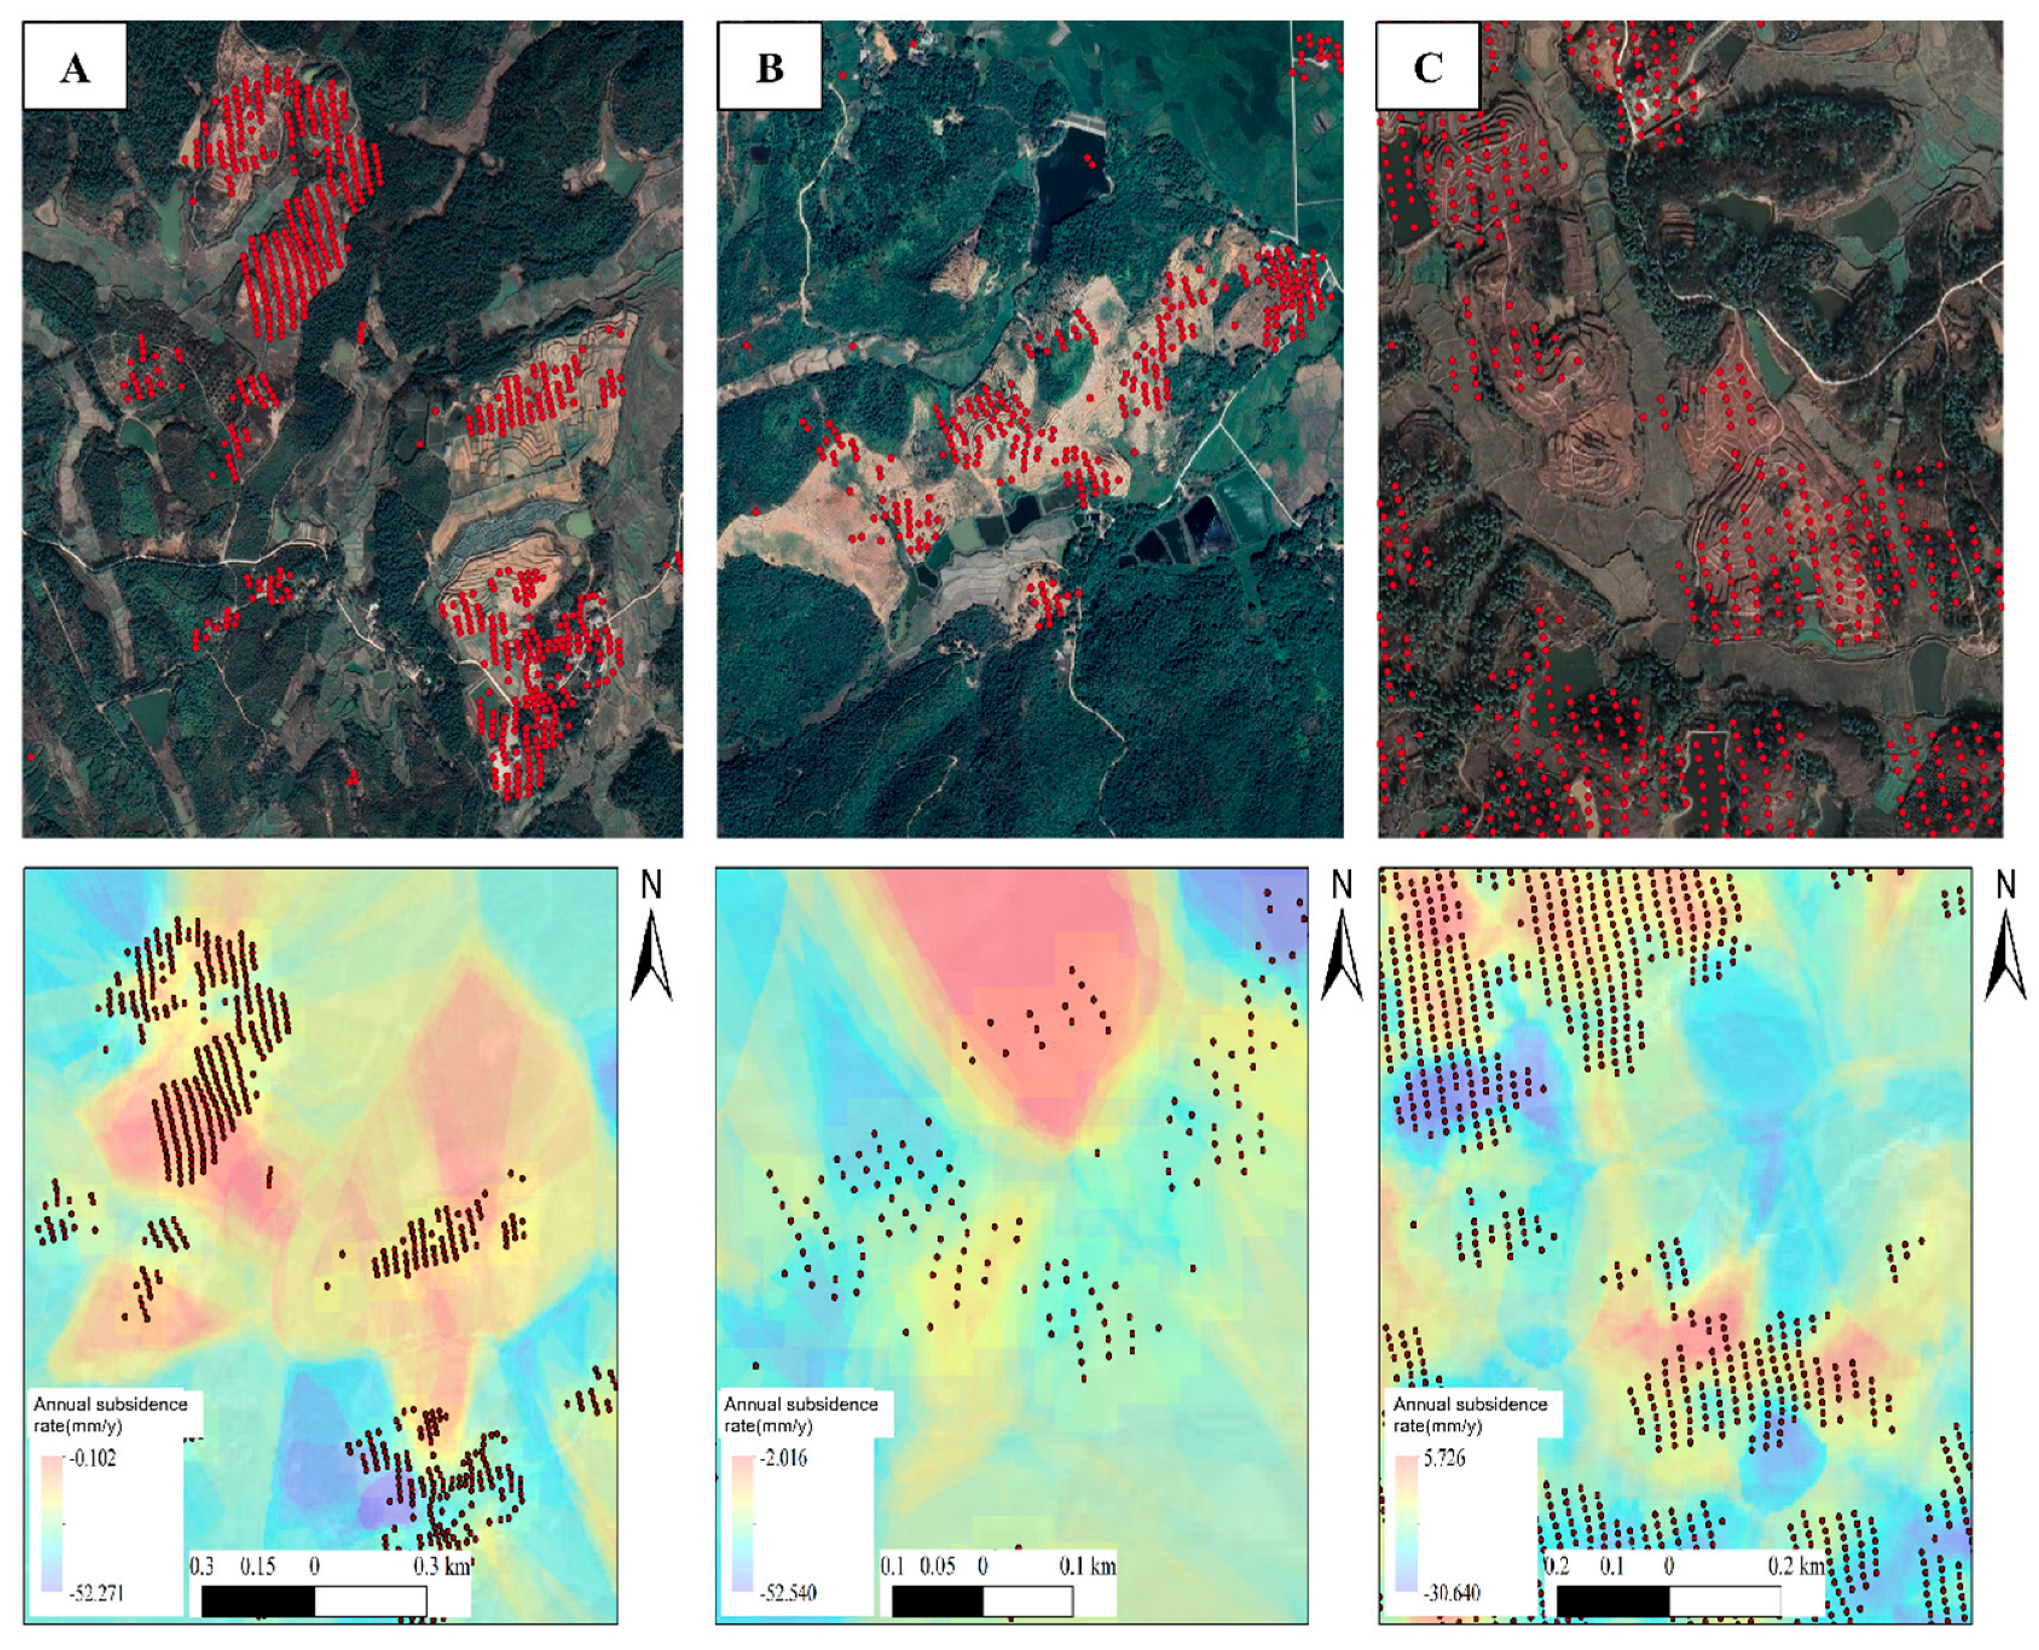
By processing Sentinel-1 images with SBAS-InSAR technology, the LOS-direction average subsidence rates of three farmland areas (A, B, and C) were obtained, as shown in Figure 5. The experimental results during the monitoring period indicate that all three farmlands exhibit significant subsidence, with maximum annual subsidence rates of −52.2 mm/y, −52.5 mm/y, and −30.6 mm/y, respectively. The two farmlands with more severe subsidence are located in valley zones characterized by loose geological structures and frequent hydrological activity; groundwater fluctuations caused by agricultural irrigation and soil compaction are the main factors driving the subsidence. In contrast, the farmland with less pronounced subsidence is situated in a piedmont transition zone, where slow subsidence may be induced by topographic water accumulation and the intensity of land development.
Kriging interpolation was used because it provides a statistically optimal estimation of spatially correlated variables by minimizing the prediction variance. The general Kriging equation can be expressed as follows:
Z ^ ( x 0 ) = i = 1 n λ i Z ( x i )
where Z ^ ( x 0 ) is the predicted value at location x 0 ,   Z ( x i ) are the known sample points, and λ i are the weights determined based on the spatial covariance (semivariogram) structure. Compared with the Inverse Distance Weighting (IDW) method, Kriging not only considers the distance between sample points but also their spatial autocorrelation, providing smoother and more reliable interpolation surfaces for deformation fields.
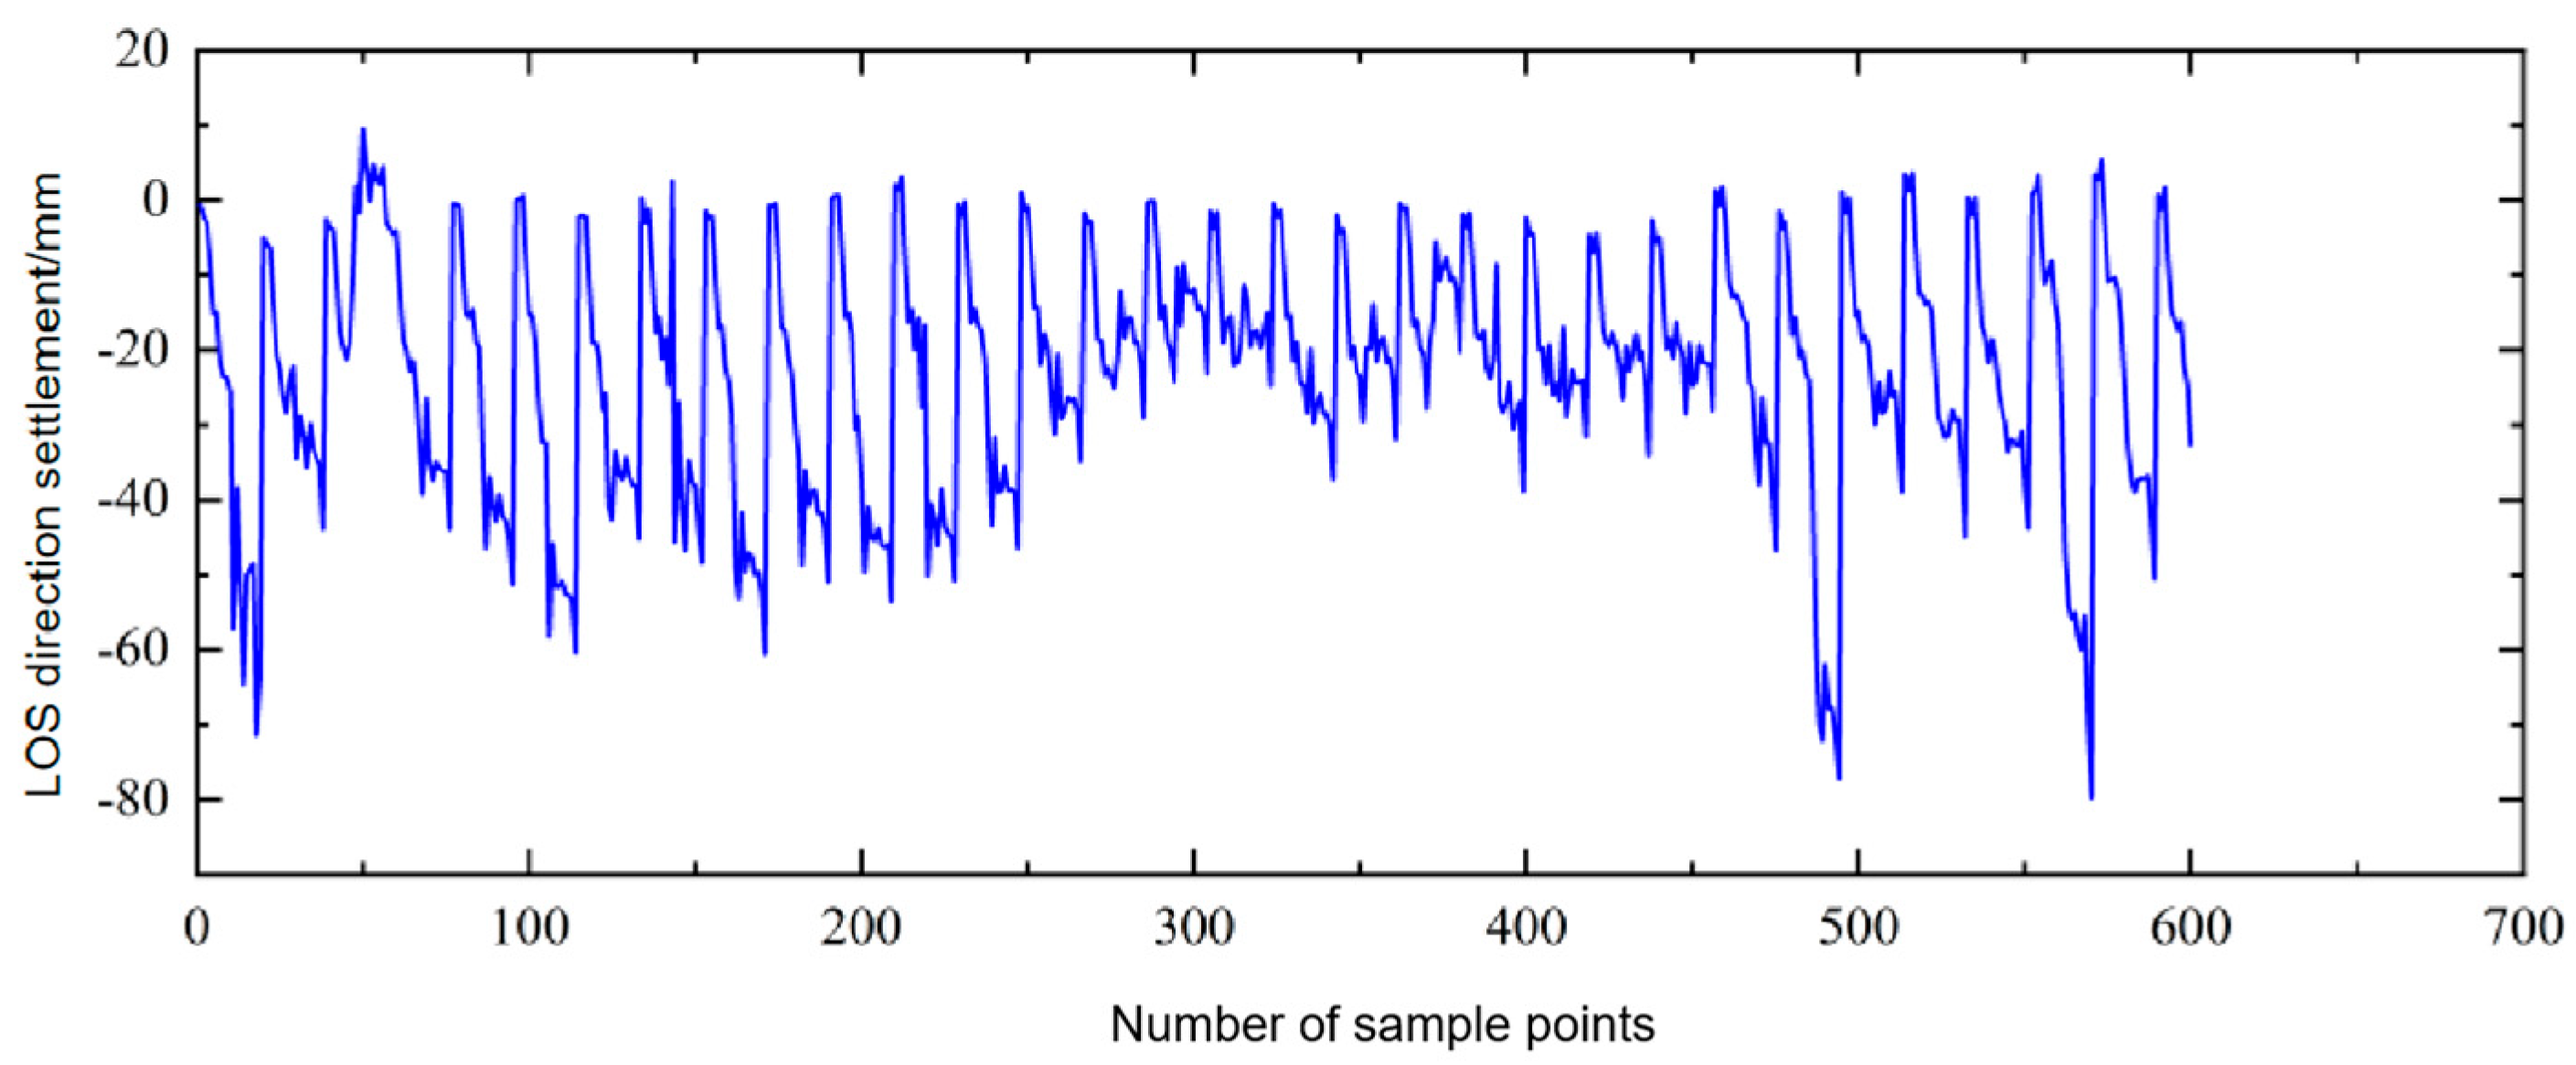
From the SBAS-InSAR monitoring results of Area A, 600 high-coherence pixels with larger cumulative subsidence were extracted as learning samples for model training and validation. The coherence threshold was set at 0.8, meaning only stable points with a coherence coefficient greater than 0.8 were retained. These points were then ordered according to their latitude and longitude coordinates to construct the time-series input sequence. The dataset was divided into a training set (the first 540 sample points) and a test set (the remaining 60 sample points) at a ratio of 9:1. The linear sequence of cumulative subsidence for these sample points is shown in Figure 6.

4. Farmland Surface Subsidence Prediction in Hilly Areas Based on the VMD-SO-CNN-LSTM-MATT Model

4.1. Experimental Analysis of VMD Decomposition

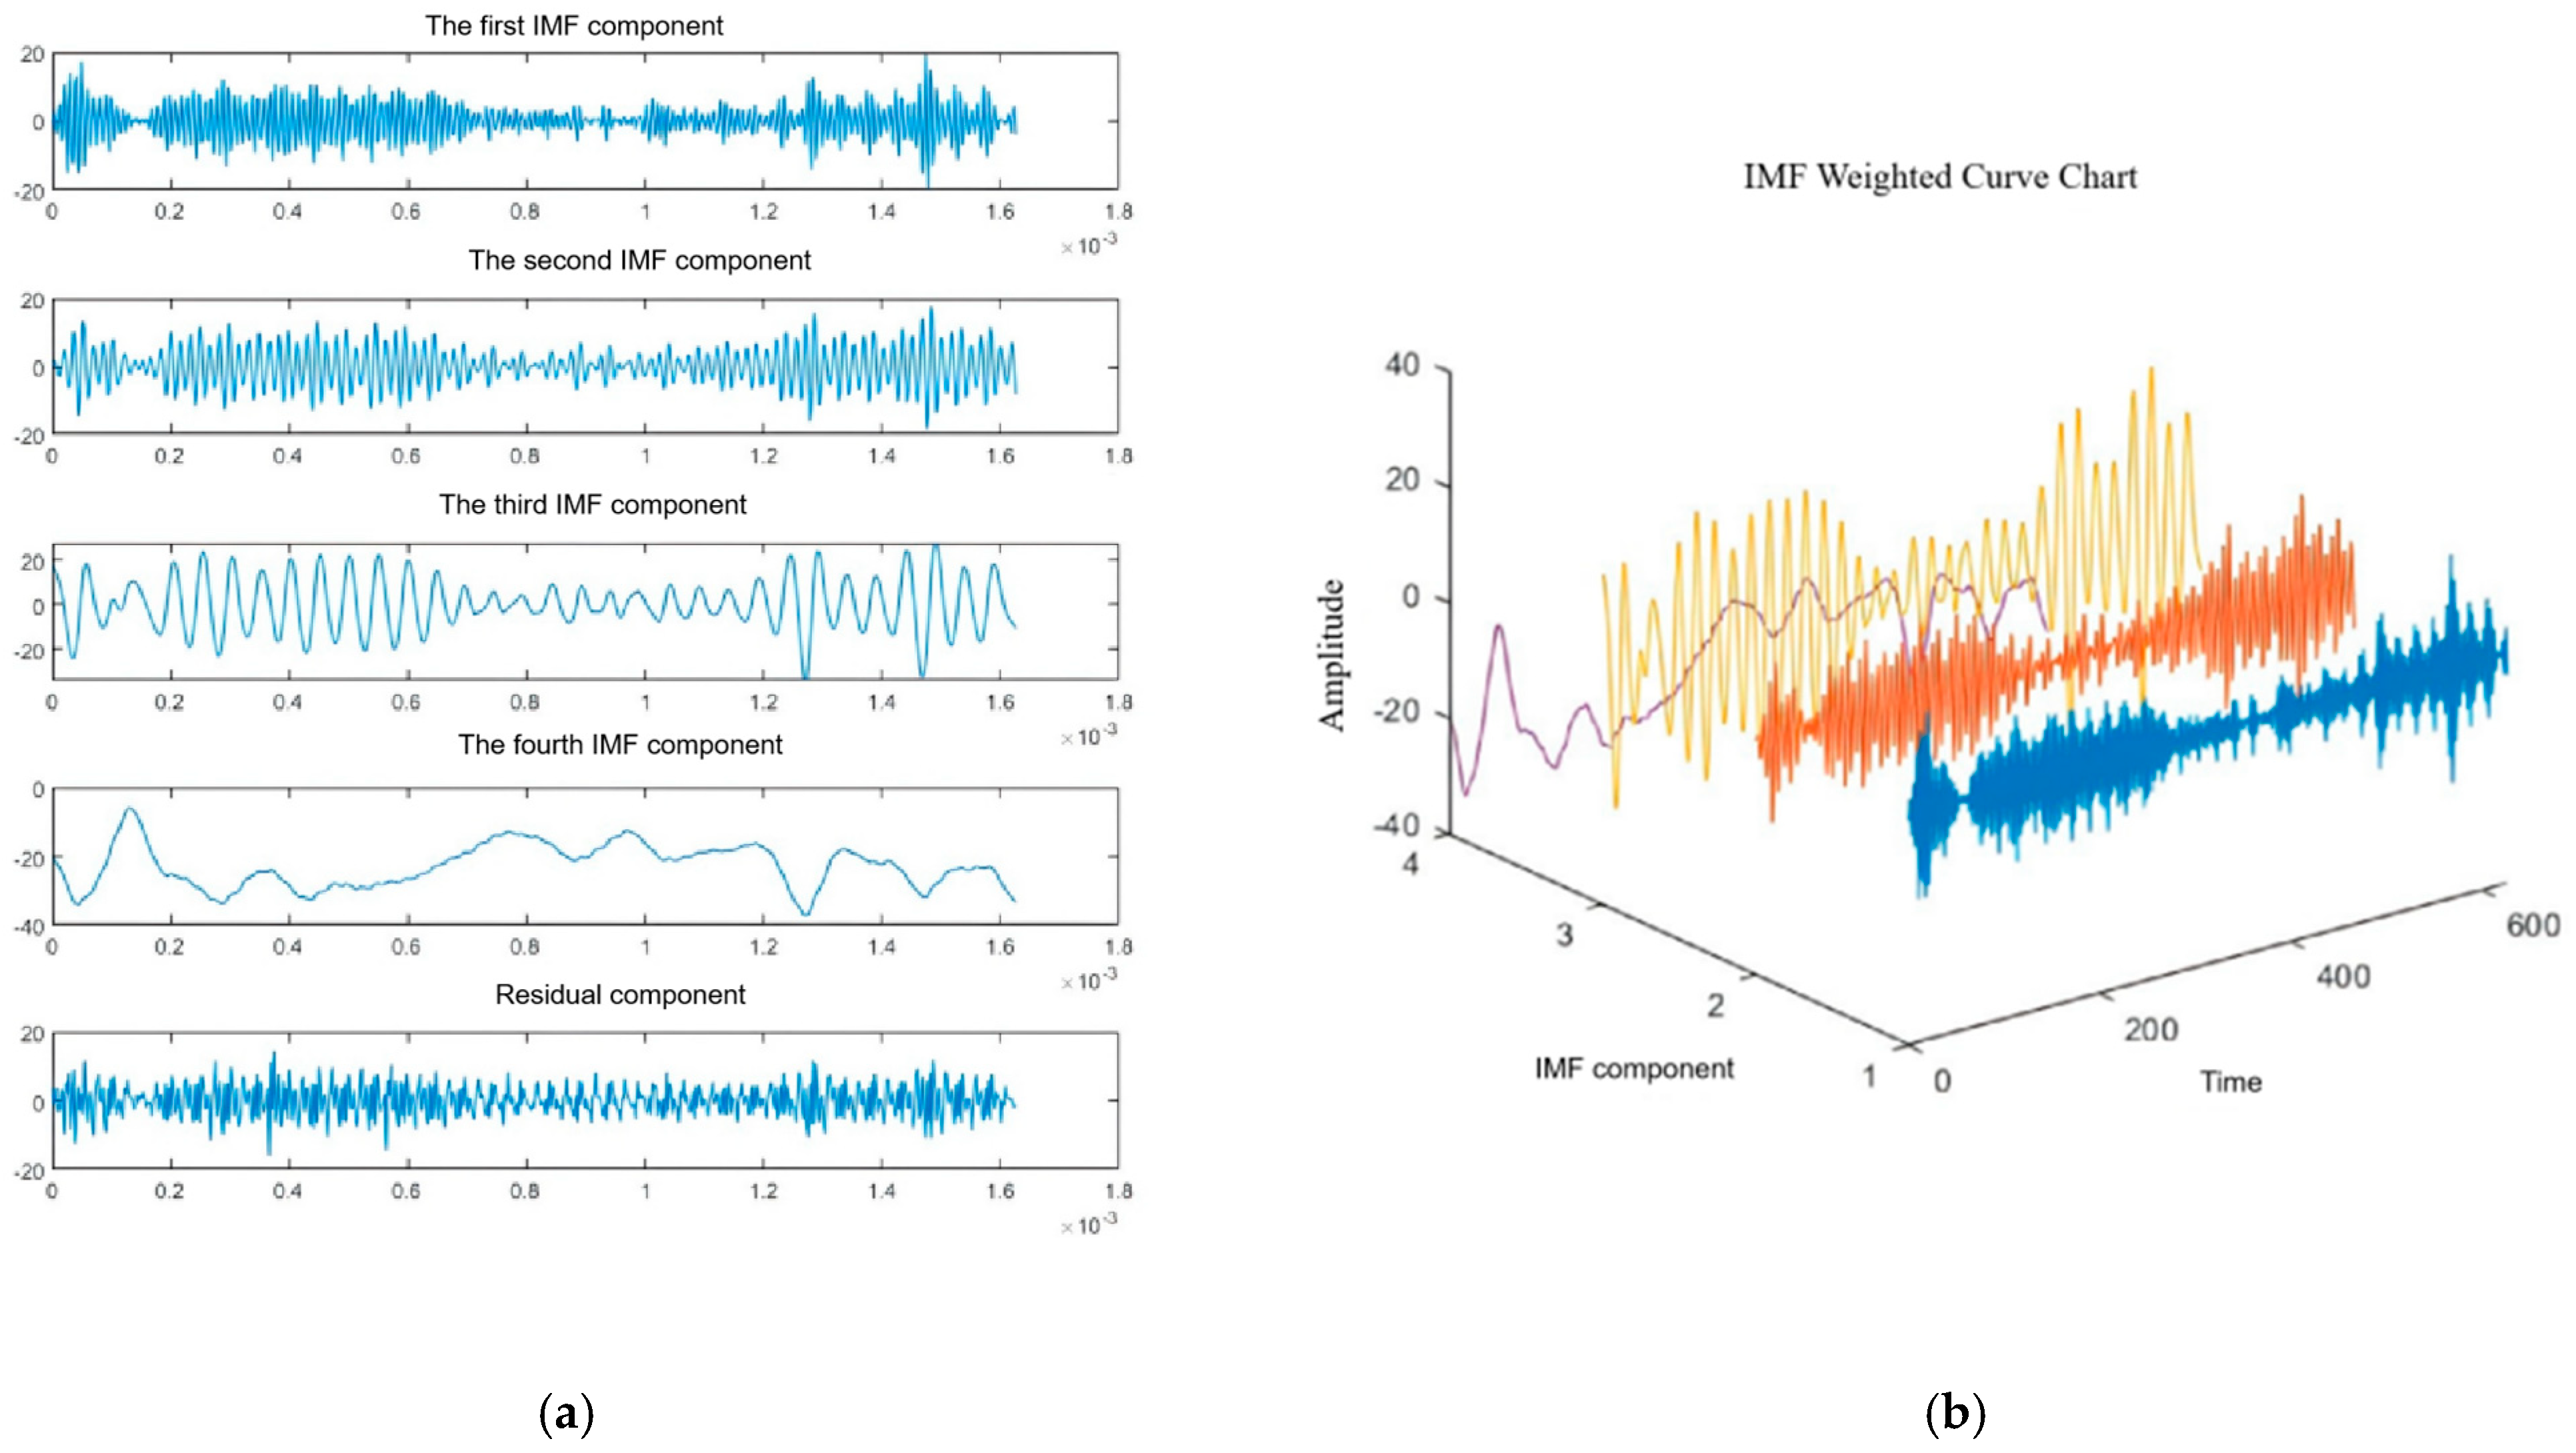
In this study, representative farmland areas were selected for surface subsidence prediction. The cumulative subsidence linear sequence was decomposed into four modal components using the VMD method, effectively reducing data non-stationarity. Before applying the VMD algorithm, it is necessary to determine the number of modes (k), as the choice of k directly affects the decomposition results. The value of k was determined by observing the variation in central frequencies. Starting from k = 2, the value was gradually increased, and the changes in central frequency were analyzed, as shown in Table 1. When the number of modes exceeded four, the central frequency of the last component consistently remained around 0.183. Increasing k further could introduce additional noise components. Therefore, the optimal number of modes k for VMD in this study was determined to be four. The results of VMD decomposition for farmland A sample point subsidence data are shown in Figure 7.
In this study, k denotes the number of modes used in the VMD decomposition, and each IMFi (i = 1, 2, …, k) represents an intrinsic mode function corresponding to a specific frequency component.

4.2. SO-CNN-LSTM-MATT Model Prediction and Analysis

4.2.1. Evaluation Metrics

Mean Squared Error (MSE), Root Mean Squared Error (RMSE), Mean Absolute Error (MAE), and Mean Absolute Percentage Error (MAPE) were adopted as evaluation metrics for the prediction model.
RMSE is defined as the square root of the mean of the squared deviations between predicted and observed values. It is a commonly used method to measure the magnitude of prediction error. A smaller RMSE indicates better model performance with smaller deviations.
MAE is the average of absolute errors, where the absolute error is the absolute difference between predicted and actual values. Compared with RMSE, MAE is less sensitive to large errors since it does not involve squaring. A lower MAE value indicates better model performance.
MAPE represents the percentage error. It is calculated by dividing the absolute error of each prediction by the corresponding actual value, averaging these ratios, and multiplying by 100%. It provides a percentage-based representation of error magnitude, which facilitates comparison across datasets of different scales. A smaller MAPE value indicates higher prediction accuracy.
The expressions of these error functions are as follows:
E m s e = 1 m 1 m y i ~ y i 2
E r m s e = 1 m 1 m y i ~ y i 2
E m a e = 1 m 1 m y i ~ y i
E m a p e = 100 % m i = 1 m y i ~ y i y i
In the equations, m represents the number of samples; denotes the actual subsidence value of sample I; and denotes the predicted subsidence value of sample i. In subsidence prediction, smaller values of the four aforementioned metrics indicate smaller differences between predicted and actual subsidence values, thus reflecting higher prediction accuracy; conversely, larger values indicate lower accuracy. Specifically, the lower the values of RMSE, MAE, and MAPE approach zero, the more consistent the model predictions are with the observed deformation, indicating minimal residual error and superior predictive reliability. These metrics are widely adopted in evaluating subsidence and deformation models due to their interpretability and sensitivity to deviation trends [15,21,23].
In this study, 90% of the dataset was used as the training set. After constructing the prediction model, the training parameters of the proposed model are listed in Table 2.

4.2.2. Accuracy Assessment

The VMD-SO-CNN-LSTM-MATT model demonstrates clear superiority in key performance metrics. Its Root Mean Squared Error (RMSE) is 4.3813 mm, representing reductions of 34.82% and 60.14% compared with the VMD-CNN-LSTM-MATT model (6.7246 mm) and the standalone LSTM model (10.9966 mm), respectively, showing a significant decrease in error. The Mean Absolute Error (MAE) is 3.7236 mm, which is 29.85% and 56.97% lower than that of the VMD-CNN-LSTM-MATT (5.3089 mm) and LSTM (8.6513 mm) models, respectively. In addition, the Mean Absolute Percentage Error (MAPE) is 10.52%, much better than the VMD-CNN-LSTM-MATT (15.85%) and LSTM (34.94%) models, with reductions of 33.69% and 69.89%, respectively. The Mean Squared Error (MSE) is 19.1955, also significantly lower than that of the other models. Although an independent SO-LSTM configuration was not separately tabulated due to space constraints, preliminary tests confirmed that SO optimization alone improved the convergence stability and reduced RMSE and MAE compared with the basic LSTM. Nevertheless, the full integration with VMD, CNN, and MATT modules provided substantially higher overall prediction accuracy, validating the synergistic effect of the combined model. Compared with the VMD-SSA-CNN-LSTM model, the VMD-SO-CNN-LSTM-MATT achieves reductions of 8.42% and 17.55% in RMSE and MAE, respectively, and a 59.76% reduction in MAPE, highlighting its overall advantages in prediction accuracy and stability. The specific error metrics of each model are shown in Table 3.
Although the proposed model achieves superior overall accuracy, some extreme subsidence values, particularly in the rapidly varying segments shown in Figure 8b, were not fully captured. This limitation arises mainly because deep learning models tend to smooth abrupt temporal fluctuations when optimizing toward global error minimization. In addition, the sparse spatial distribution of high-magnitude deformation samples limits the model’s ability to learn such extreme events effectively. Future improvements could involve introducing hybrid loss functions that emphasize peak errors or integrating physical constraints into the network to enhance sensitivity to extreme deformation phenomena [15,21,23].
Compared with existing models such as VMD-SSA-LSTM [16] and VMD-PSO-CNN-LSTM [21,23], the proposed VMD-SO-CNN-LSTM-MATT model demonstrates enhanced adaptability and robustness for complex, non-stationary subsidence signals. SSA and PSO algorithms can improve parameter optimization but often exhibit slower convergence or susceptibility to local minima in high-dimensional spaces. By contrast, SO achieves faster global convergence and maintains balance between exploration and exploitation, leading to higher prediction stability. The integration of the MATT mechanism further enhances sensitivity to temporal dependencies and key time steps, which are often overlooked in traditional hybrid models. In practice, however, SO-based optimization requires additional computational cost during training, and its performance may depend on parameter tuning. Future research could focus on lightweight or adaptive SO variants to improve efficiency. Overall, the proposed model strikes a favorable balance between prediction accuracy and computational complexity, offering strong potential for large-scale agricultural subsidence monitoring and early-warning applications.

5. Conclusions

In response to the challenges of low accuracy and difficulty in parameter selection in existing farmland subsidence prediction methods for hilly regions, this study takes a representative farmland as the research object and proposes a prediction method that integrates SBAS-InSAR technology with the VMD-SO-CNN-LSTM-MATT model. This approach enables large-scale monitoring and predictive analysis of farmland subsidence. The main conclusions are as follows:
SBAS-InSAR monitoring of farmland in the hilly areas of Yanshan County revealed the deformation rates and cumulative deformation from 2022 to 2024. Subsidence phenomena were particularly concentrated in valley zones prone to settlement, providing critical geographic information for subsequent preventive measures and mitigation strategies.
VMD was applied to process cumulative subsidence data, effectively reducing data non-stationarity and improving the quality of input data for the prediction model. The optimal number of modes was determined to be four, laying a solid foundation for high-accuracy subsidence prediction.
Superior performance of the VMD-SO-CNN-LSTM-MATT model was demonstrated across key performance metrics. Compared with VMD-CNN-LSTM-MATT, standalone LSTM, and VMD-SSA-CNN-LSTM models, the proposed model exhibited consistently lower error rates in terms of RMSE, MAE, and MAPE. Specifically, RMSE and MAE were reduced by 8.42% and 17.55% compared with the VMD-SSA-CNN-LSTM, while MAPE decreased by 59.76%. These substantial improvements highlight the comprehensive advantages of the VMD-SO-CNN-LSTM-MATT model in enhancing prediction accuracy and stability.

Author Contributions

Z.W. contributed to InSAR data processing methodology. H.H. specialized in prediction model development. R.W. conceived the study, developed the methodology, conducted programming, performed field data collection, and wrote the original draft. M.G. supervised the research and provided critical revision of the manuscript. L.L. assisted with programming, data validation, and field investigations. Y.T. and Y.Z. provided critical field data and validation support. All authors have read and agreed to the published version of the manuscript.

Funding

This research was funded by the National Natural Science Foundation of China, grant number 42171416.

Data Availability Statement

The raw data supporting the conclusions of this article will be made available by the authors on request.

Acknowledgments

We acknowledge the European Space Agency (ESA) for providing the Sentinel-1 satellite data. The views and conclusions contained herein are solely those of the authors and should not be interpreted as necessarily representing the official policies, either expressed or implied, of the funding agencies.

Conflicts of Interest

The authors declare no conflicts of interest.

References

  1. Huang, Q.; Mou, F.; Zhang, Y.; Yang, M.; Chen, L.; Wang, J.; Tian, T.; He, Q. Evolution and prediction of cultivated land landscape pattern in multi-level watersheds of Chongqing based on ANN-CA model. Res. Soil Water Conserv. 2023, 30, 379–387. [Google Scholar] [CrossRef]
  2. Jiang, H.; Balz, T.; Cigna, F.; Tapete, D.; Li, J.; Han, Y. Multi-sensor InSAR time series fusion for long-term land subsidence monitoring. Geo-Spat. Inf. Sci. 2023, 27, 1424–1440. [Google Scholar] [CrossRef]
  3. Zhao, Y.; Zhou, L.; Wang, C.; Li, J.; Qin, J.; Sheng, H.; Huang, L.; Li, X. Analysis of the Spatial and Temporal Evolution of Land Subsidence in Wuhan, China from 2017 to 2021. Remote Sens. 2023, 14, 3142. [Google Scholar] [CrossRef]
  4. Raspini, F.; Caleca, F.; Del Soldato, M.; Festa, D.; Confuorto, P.; Bianchini, S. Review of satellite radar interferometry for subsidence analysis. Earth-Sci. Rev. 2022, 235, 104239. [Google Scholar] [CrossRef]
  5. Guo, M.; Zhou, Y.; Zhou, T.; Pan, D. Dynamic change monitoring of Qianlong Garden rockery in the Forbidden City based on InSAR and LIDAR technology. ISPRS Arch. 2020, 43, 1455–1463. [Google Scholar] [CrossRef]
  6. Eskandari, R.; Scaioni, M. Validation of full-resolution DInSAR-derived vertical displacement in cultural heritage monitoring: Integration with geodetic levelling measurements. ISPRS Ann. 2023, X-M-1–2023, 79–86. [Google Scholar] [CrossRef]
  7. Crosetto, M.; Solari, L.; Mróz, M.; Balasis-Levinsen, J.; Casagli, N.; Frei, M.; Oyen, A.; Anders Moldestad, D.; Bateson, L.; Guerrieri, L.; et al. The evolution of wide-area DInSAR: From regional and national services to the European Ground Motion Service. Remote Sens. 2020, 12, 2043. [Google Scholar] [CrossRef]
  8. Chen, Y.; Yu, S.; Tao, Q.; Liu, G.; Wang, L.; Wang, F. Accuracy verification and correction of D-InSAR and SBAS-InSAR in monitoring mining surface subsidence. Remote Sens. 2021, 13, 4365. [Google Scholar] [CrossRef]
  9. Sun, H.; Peng, H.; Zeng, M.; Wang, S.; Pan, Y.; Pi, P.; Xue, Z.; Zhao, X.; Zhang, A.; Liu, F. Land subsidence in a coastal city based on SBAS-InSAR monitoring: A case study of Zhuhai, China. Remote Sens. 2023, 15, 2424. [Google Scholar] [CrossRef]
  10. Tian, H.; Tao, Y.; Kou, P.; Alonso, A.; Luo, X.; Gong, C.; Fan, Y.; Lei, C.; Gou, Y. Monitoring and evaluation of gully erosion in China’s largest loess tableland based on SBAS-InSAR. Nat. Hazards 2023, 117, 2435–2454. [Google Scholar] [CrossRef]
  11. Ren, Z.; Zhang, S.; Si, J.; Hui, W.; Li, S. Hu Deformation interpretation of Ankang expansive soil airport using integrated SBAS-InSAR and CR-InSAR. J. Geod. Geodyn. 2023, 43, 1112–1116+1128. [Google Scholar] [CrossRef]
  12. Dong, J.; Niu, R.; Li, B.; Xu, H.; Wang, S. Potential landslides identification based on temporal and spatial filtering of SBAS-InSAR results. Geomat. Nat. Hazards Risk 2023, 14, 52–75. [Google Scholar] [CrossRef]
  13. Liu, Y.; Zhang, J. Integrating SBAS-InSAR and AT-LSTM for time-series analysis and prediction method of ground subsidence in mining areas. Remote Sens. 2023, 15, 3409. [Google Scholar] [CrossRef]
  14. Wang, T.; Zhang, Q.; Wu, Z. A deep-learning-facilitated, detection-first strategy for operationally monitoring localized deformation with large-scale InSAR. Remote Sens. 2023, 15, 2310. [Google Scholar] [CrossRef]
  15. Gan, M.; Pan, H.; Chen, Y.; Zhang, S. Application of the Variational Mode Decomposition (VMD) method to river tides. Estuar. Coast. Shelf Sci. 2021, 261, 107570. [Google Scholar] [CrossRef]
  16. Sun, J.; Ren, H.; Duan, Y.; Yang, X.; Wang, D.; Tang, H. Fusion of Multi-Layer Attention Mechanisms and CNN-LSTM for Fault Prediction in Marine Diesel Engines. Mar. Sci. Eng. 2024, 12, 990. [Google Scholar] [CrossRef]
  17. Ullah, K.; Ahsan, M.; Hasanat, S.M.; Haris, M.; Yousaf, H.; Raza, S.F.; Tandon, R.; Abid, S.; Ullah, Z. Short-term load forecasting: A comprehensive review and simulation study with CNN-LSTM hybrids approach. IEEE Access 2024, 12, 111858–111881. [Google Scholar] [CrossRef]
  18. Shi, H.; Wei, A.; Xu, X.; Zhu, Y.; Hu, H.; Tang, S. A CNN-LSTM based deep learning model with high accuracy and robustness for carbon price forecasting: A case of Shenzhen’s carbon market in China. J. Environ. Manag. 2024, 352, 120131. [Google Scholar] [CrossRef] [PubMed]
  19. Liu, H.; Chen, W.; Li, Y.; Xu, Z.; Li, X. Application of integrated model based on EEMD-CNN-LSTM for landslide-displacement prediction. J. Geomech. 2024, 30, 145–158. [Google Scholar] [CrossRef]
  20. He, Y.; Yan, H.; Yang, W.; Yao, S.; Zhang, L.; Chen, Y.; Liu, T. Time-series analysis and prediction of surface deformation in the Jinchuan mining area, Gansu Province, by using InSAR and CNN–PhLSTM network. IEEE J. Sel. Top. Appl. Earth Obs. Remote Sens. 2022, 15, 6732–6751. [Google Scholar] [CrossRef]
  21. Guo, X.; Hua, D.; Bao, P.; Li, T.; Yao, N.; Cao, Y.; Wang, Y.; Zhang, T.; Hu, P. A short-term electricity price forecasting method based on improved VMD-PSO-CNN-LSTM. J. Electr. Power Sci. Technol. 2024, 39, 35–43. [Google Scholar] [CrossRef]
  22. Wang, X.; Li, J.; Shao, L.; Liu, H.; Ren, L.; Zhu, L. Short-term wind power prediction by an extreme learning machine based on an improved Hunter–Prey Optimization Algorithm. Sustainability 2023, 15, 991. [Google Scholar] [CrossRef]
  23. Shi, X.; Zhang, X.; Guo, L. Ultra-short-term wind power prediction based on VMD-SO-BP. Hongshui River 2023, 42, 50–54+59. [Google Scholar]
  24. Luo, X.; Huang, X.; Tang, W. Prediction method for sandstone fracture process based on improved VMD and GA-BP neural network. Nonferrous Met. Sci. Eng. 2021, 12, 99–107. [Google Scholar] [CrossRef]
  25. Li, J.; Liu, R.; He, Y.; Zhang, C.; Geng, J.; Wang, P.; Zhao, R. Research on fault diagnosis of optical fiber composite submarine cable based on VMD and SO optimized SVM. Electron. Meas. Technol. 2023, 46, 8–16. [Google Scholar]
  26. Hashim, F.A.; Hussien, A.G.; Mabrouk, M.S.; Al-Atabany, W.; Mirjalili, S. Snake Optimizer: A Metaheuristic Algorithm Inspired by Snake Behavior. Comput. Ind. Eng. 2022, 172, 108646. [Google Scholar] [CrossRef]
  27. Hashim, F.A.; Hussien, A.G. Snake Optimizer: A novel meta-heuristic optimization algorithm. Knowl. Based Syst. 2022, 242, 108320. [Google Scholar] [CrossRef]
  28. Li, H.; Feng, J.; Wang, P.; Rong, H.; Chai, Y. Research on photovoltaic power prediction model based on TDE-SO-AWM-GRU. China Electr. Power 2024, 57, 41–49. [Google Scholar] [CrossRef]
  29. Ioffe, S.; Szegedy, C. Batch normalization: Accelerating deep network training by reducing internal covariate shift. In Proceedings of the 32nd International Conference on Machine Learning, Lille, France, 6–11 July 2015; pp. 448–456. Available online: https://dl.acm.org/doi/10.5555/3045118.3045167 (accessed on 24 June 2025).
  30. Han, J.; Kamber, M.; Mining, D. Concepts and Techniques; Morgan Kaufmann: Burlington, MA, USA, 2006; Volume 340, pp. 94104–103205. ISBN 978-0-12-381479-1. [Google Scholar]
  31. Zhang, M.; Pan, J.; Ma, P.; Lin, H. Identification and Analysis on Surface Deformation in the Urban Area of Nanchang Based on PS-InSAR Method. Remote Sens. 2025, 17, 157. [Google Scholar] [CrossRef]
  32. Xiao, B.; Zhao, J.; Li, D.; Zhao, Z.; Xi, W.; Zhou, D. The monitoring and analysis of land subsidence in Kunming (China) supported by time series InSAR. Sustainability 2022, 14, 12387. [Google Scholar] [CrossRef]
  33. Li, Z.; He, W.; Cheng, M.; Hu, J.; Yang, G.; Zhang, H. SinoLC-1: The first 1 m resolution national-scale land-cover map of China created with a deep learning framework and open-access data. Earth Syst. Sci. Data 2023, 15, 4749–4780. [Google Scholar] [CrossRef]
  34. Takaku, J.; Tadono, T.; Tsutsui, K. Generation of High Resolution Global DSM from ALOS PRISM. Int. Arch. Photogramm. Remote Sens. Spat. Inf. Sci. 2014, 40, 243–248. [Google Scholar] [CrossRef]
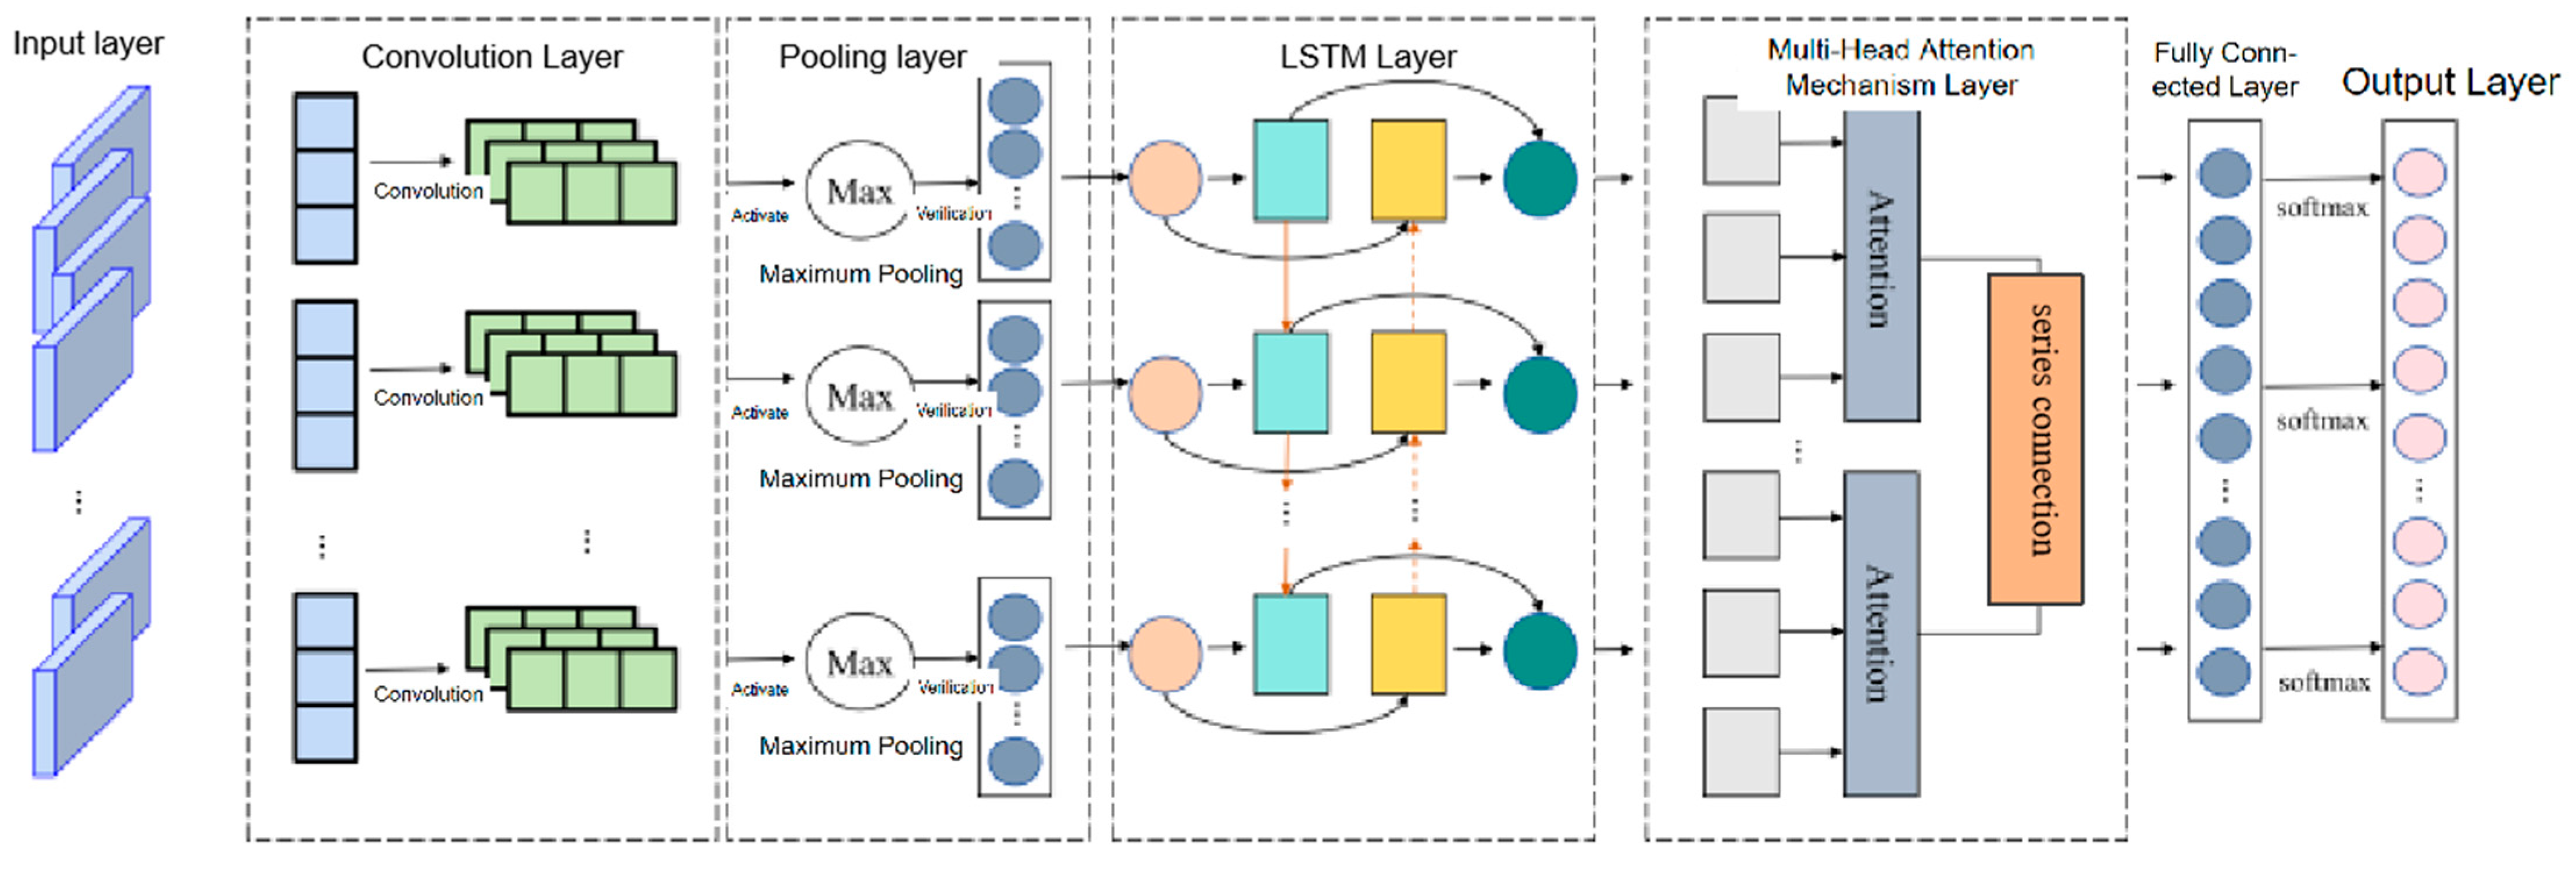
Figure 1. Network architecture diagram.
Processes 13 03480 g001
Figure 2. SO-CNN-LSTM-MATT prediction workflow.
Processes 13 03480 g002
Figure 3. Study area.
Processes 13 03480 g003
Figure 4. LOS-direction annual average deformation rate and cumulative deformation in Yanshan County. (a) Annual average deformation rate. (b) Cumulative deformation.
Processes 13 03480 g004
Figure 5. (AC) Annual subsidence rate of farmland. The red dots represent ground subsidence monitoring points obtained through InSAR technology.
Processes 13 03480 g005
Figure 6. Linear sequence of cumulative subsidence at sample points.
Processes 13 03480 g006
Figure 7. IMF components obtained from VMD decomposition. (a) IMF frequency spectrum of subsidence data after VMD decomposition. (b) IMF component curves (each curve from bottom to top corresponds sequentially to the first to the fourth IMF components shown from top to bottom in Figure (a)).
Processes 13 03480 g007
Figure 8. Performance comparison of different models. (a) Comparison between VMD-SO-CNN-LSTM-MATT and VMD-CNN-LSTM-MATT models. (b) Comparison between VMD-SO-CNN-LSTM-MATT and LSTM models. (c) Comparison between VMD-SO-CNN-LSTM-MATT and VMD-SSA-LSTM models.
Processes 13 03480 g008
Table 1. Central frequency observation method.
kIMF1IMF2IMF3IMF4IMF5IMF6
210.77 × 10−50.535
310.76 × 10−50.3360.624
410.74 × 10−50.3210.6150.183
510.71 × 10−50.3280.6100.2050.183
610.71 × 10−50.3240.6030.9520.1540.185
Table 2. Parameter description.
Parameter NameNoteParameter NameNote
Maximum number of training iterations300Gradient threshold1
Initial learning rate0.001Initial population size20
Regularization parameter0.0005Maximum evolutionary generations10
Table 3. Model error metric values.
Prediction ModelRMSE/mmMAE/mmMAPE/%MSE
VMD-SO-CNN-LSTM-MATT4.38133.723610.5219.1955
VMD-CNN-LSTM-MATT6.72465.308915.8545.2203
LSTM10.99668.651334.94120.9256
VMD-SSA-CNN-LSTM4.78374.515326.1521.5032
Disclaimer/Publisher’s Note: The statements, opinions and data contained in all publications are solely those of the individual author(s) and contributor(s) and not of MDPI and/or the editor(s). MDPI and/or the editor(s) disclaim responsibility for any injury to people or property resulting from any ideas, methods, instructions or products referred to in the content.