Article

Genesis of Meniscus Dynamic Distortions (MDDs) in a Medium Slab Mold Driven by Unstable Upward Flows

by
Eriwiht Dominic Tello-Cabrera
1,
Saúl García-Hernández
1,*,
Enif Gutierrez
1,
Rodolfo Morales Dávila
2,
Jose de Jesus Barreto
1 and
Rumualdo Servín-Castañeda
3
1
Metallurgy Graduate Center, TecNM—Instituto Tecnológico de Morelia, Av. Tecnologico No. 1500, Col. Lomas de Santiguito, Morelia 58120, Michoacan, Mexico
2
Department of Metallurgy and Materials Engineering, Instituto Politécnico Nacional—ESIQIE, Ed. 7 UPALM, Col. Zacatenco, Mexico 07338, Mexico
3
Mechanical Engineering Department, Universidad Autónoma de Coahuila (UAdeC)/FIME UN, Barranquilla S/N, Col. Guadalupe, Monclova 27750, Coahuila, Mexico
*
Author to whom correspondence should be addressed.
Processes 2025, 13(11), 3425; https://doi.org/10.3390/pr13113425
Submission received: 18 September 2025 / Revised: 19 October 2025 / Accepted: 19 October 2025 / Published: 25 October 2025

Abstract

To better understand the relationship between meniscus instabilities and the high levels of turbulence in the fluid dynamics of a continuous medium slab mold, this study investigates the magnitudes of meniscus dynamics distortions and their fluid dynamic origin using a full-scale water modeling experiment and mathematical simulations. The three-dimensional mathematical model is composed of the continuity and momentum equations, together with the standard k-ε turbulence model and the volume of fluid model, to track the dynamics of the steel interface. The results show that the medium slab mold shares flow patterns common to both conventional slab molds and funnel thin slab molds, making its fluid dynamics more complex. Despite this, the fluid dynamics within the mold do not develop a dynamic distortion phenomenon but induce upward stream flows with instability and high velocities, which generate an unstable meniscus behavior characterized by significant surface oscillations, variations in velocity, and high deformations. These latter flow characteristics are the origin of meniscus dynamic distortion (MDD), which shows a constant frequency with non-constant periodicity and different median lifecycle ranges.

1. Introduction

The technological improvements in steel production through continuous casting have constantly evolved from the slab mold to the funnel thin slab mold and, more recently, to the medium slab mold. One of the greatest advantages of thin slab casting is the direct rolling process. The medium slab mold takes advantage of this, operating with a thickness that falls between the thicknesses of the slab and the thin slab mold. It employs casting velocities higher than those used in conventional slab molds and changes the funnel shape of the thin slab mold to feature straight walls. Since the medium slab mold combines characteristics of the previously mentioned molds, it is expected that many of the flow phenomena that occur in those molds will take place in the medium slab mold: for instance, meniscus instabilities, level fluctuations, fluid flow asymmetry, poor temperature distribution, strong turbulence, and entrapment of slag, among others [1,2,3,4]. Many efforts have been made to study and control them. For example, Li [1] and Liu [2] analyzed, using large eddy simulations, how the characteristics of unsteady turbulent flows can induce the periodicity of asymmetrical flows that can lead to slag entrapment and the formation of intermittent chaotic vortices at the meniscus. These turbulent flows have been studied by many authors [3,4,5,6,7], who attempted to explain the origin and effects of the high levels of turbulence that develop in funnel mold types. They found that bifurcated nozzles tend to create two unstable and oscillating discharging jets that produce large gradients of Reynolds stresses at their boundaries, with the surrounding flow producing flow distortions with instantaneous imbalances with respect to turbulent kinetic energy, manifesting flows with high-velocity gradients that directly affect the meniscus’s stability. Complementary studies on meniscus fluctuations found that the meniscus wave height mainly depends on the impinging jet depths and the circulation of the center position [8,9]. Moreover, the quality of the flow feeding the meniscus depends on the submerged entry nozzle (SEN) depth, SEN offset, and the SEN port design. As the number of recirculation regions increases, the quality of the flow that influences the meniscus is reduced [10,11,12,13]. Since the high level of turbulence is the reason for the nature of these phenomena, some alternative solutions have arisen, such as the use of an electromagnetic brake. This tool provided a suppressive effect on the intensity of jets, counteracted the turbulence induced by the difference in the mass flow rate of SEN ports, and reduced the impact of the dynamic distortion phenomenon, allowing all these to achieve flatter jets and better uniformity in the temperature distribution and solidification shell [14,15,16,17]. Nevertheless, the development of all these works was based on thin slab molds, and there is very little research focused on the occurrence of these phenomena in medium–thin slab molds [18,19,20,21]. Some efforts are based on the redesign of the nozzle using physical modeling [18] and mathematical simulations [19]. The first modification increases the number of SEN ports, resulting in a reduction in meniscus velocity and the stabilization of double flow rolls, while the second achieves similar results by modifying the port area and port angle. In other studies, mold-level fluctuations were investigated by numerical simulations [20] and industrial testing [21], considering the interfacial behavior between molten steel and the liquid slag layer with argon gas. Their results indicate that interfacial fluctuations are stronger with gas injection, and they can be reduced with an adequate SEN design. Considering all this information and the fact that China has assembled more than twenty medium–thin slab casters [19], information about how fluid dynamics develops and the consequences of the different phenomena on flow behavior is urgently needed to improve efficiency. Therefore, the present research aims to analyze the magnitudes of meniscus dynamic distortions and their fluid dynamic origin in a medium–thin slab mold using both physical and mathematical simulations.

2. Materials and Methods

2.1. Experimental Procedure

To perform the physical experiments, a full-scale physical model of the mold prototype, equipped with a bifurcated SEN, was constructed from transparent plastic. Since this model is built 1:1, the Reynolds and Froude similarity criteria requirements are satisfied, ensuring a proper balance between inertial, viscous, and gravitational forces. This means that what is observed in the water model reasonably represents the phenomena that occur in the prototype [10,13]. Figure 1 illustrates the details of both the mold and SEN designs, along with a schematic of the physical model. In the physical model, water is poured into a tundish, located on the upper part of the mold–SEN system, with a bath level equal to that in the actual tundish. Later, the tundish water, controlled by a plastic rod with the same geometry as the actual stopper rod, feeds the mold system to maintain the casting velocity. The water leaving the mold is contained in a pit, where it is subsequently pumped to the elevated tundish. The flow is measured by a flow meter and controlled by a precision valve. The water flow used during the experiments was equal to 0.41376 m3/min to maintain the real casting velocity reported in Table 1. Once the physical model setup was ready, the experimental techniques employed to study the flow included running the model for at least five minutes to reach a steady-state condition. At this point, a pulse of red dye was added to observe the flow patterns inside the mold. The red dye used was of vegetal origin; its concentrated state was solid, and it was later dissolved in water at a concentration of 78 g per liter. From this dissolution, an aliquot of 20 mL was used for each experiment. It is important to note that the concentration of the red dye was carefully selected to ensure that the effect of the tracer buoyancy was neutral. To study the behavior of the flow in detail, the tracer dispersion was recorded on video using a Canon EOS Rebel T3i full HD (Canon Inc., Melville, NY, USA) video camera with 18 MP and 3.7 frames per second. The tracer dispersion pattern and flow behavior observed in the physical experiments were compared qualitatively with those obtained from the mathematical simulation, which corresponds to the method used to validate the mathematical model results.

2.2. Mathematical Model

To predict the movement of an unsteady system composed of three-dimensional immiscible fluids, it is necessary to solve the continuity, momentum, and energy equations, known as governing equations or as Navier–Stokes equations [22,23,24]. Nevertheless, due to the complexity of its solutions, many assumptions are introduced to simplify the equations and make them solvable for the current research.

2.2.1. Basic Assumptions

This research is based on the following assumptions to solve the Navier–Stokes equations: the system is solved using 3D Cartesian coordinates, with gravity acting in the casting direction. The steel is assumed to be a homogeneous incompressible Newtonian fluid under isothermal conditions; thus, its physical properties are constant. The system is simulated considering unsteady conditions. No-slip condition is set for all mold walls. A pressure inlet of 101.32 kPa is applied at the mold top to simulate a system open to the atmosphere. The continuous phase is a multiphase steel–air system, whose interaction is modeled using the Volume of Fluid (VOF) model.
The current mathematical model is composed of the continuity and the momentum equations for incompressible viscous flow, utilizing the VOF model in conjunction with the standard k-ε turbulent model, which, after considering the above assumptions, can be expressed as follows:
Continuity equation.
· u = 0
Momentum equation.
ρ u t + ρ · u u = P + μ e f f 2 u + ρ g
where the effective viscosity, μ e f f =   μ + μ t , is the sum of the molecular viscosity and the turbulent viscosity, μ t = ρ C μ k 2 ε .
The turbulent kinetic energy, k, and the dissipation rate of this energy, ε, both included in the turbulent viscosity, µt, obey the classical convective–diffusive equations. Both are solved by the equations of the turbulence model, known as the k-ε standard [24,25].
ρ k t + ρ k u i x i = x j μ + μ i σ k k x j + G k ρ ε
ρ ε t + ρ ε u i x i = x j μ + μ i σ ε k x j + C 1 ε ε k G k C 2 ε ρ ε 2 k
where the model constants are the assigned values proposed by Launder and Spalding [25]: C1ε = 1.44, C2ε = 1.92, σk = 1.0, σε = 1.3, and Cμ = 0.09.
The standard k-ε turbulence model was employed in this study due to its robustness, numerical stability, and extensive validation within the field of computational fluid dynamics. Although it presents certain limitations when compared with more advanced turbulence models, it provides reliable predictions of the overall flow behavior with acceptable accuracy at a reasonable computational cost. These attributes make it particularly well suited for analyzing meniscus dynamics.
The Volume of Volume (VOF)
The VOF model, designed for incompressible, immiscible fluids with no mass transfer interchange, offers an integrated framework that couples the classical VOF approach with the Eulerian multiphase model, enabling advanced simulation of interfacial dynamics in multiphase systems. This hybrid model is particularly suited for capturing the transient behavior of the interface between the steel free surface and the surrounding air. This model formulation allows the local material properties to be computed as weighted averages, based on the volume fractions of each fluid phase present within computational cells. This treatment enables precise tracking of the interface and accurate prediction of surface instabilities, wave motion, and mold level fluctuations [26,27].
The effective fluid properties within each cell can be expressed as:
ρ m i x = α ρ ρ ρ + 1 α q ρ ρ
μ m i x = α ρ μ ρ + 1 α q μ ρ
A continuity equation applicable to transient systems has been derived, with its structure contingent upon the number of phases present within the system.
1 ρ q t   α q ρ q + · α q ρ q v = S α q + p = 1 n m ˙ p q m ˙ q p
where a source term, denoted as Sαq, is introduced to represent interphase mass transfer dynamics.
The volume fraction of the secondary phase (air in this case) is determined by solving Equation (7), which governs its temporal and spatial evolution within the system. In contrast, the volume fraction of the primary phase is evaluated by enforcing a constraint condition, ensuring that the sum of volume fractions for all phases remains conserved, typically satisfying
q = 1 n α q = 1      
A unified set of momentum equations is solved across the entire computational domain, ensuring consistency in the treatment of fluid motion. The momentum equation incorporates phases (dependent properties), which are weighted by the corresponding volume fractions of each phase. This formulation enables the accurate representation of multiphase dynamics and interfacial momentum exchange.
α q n + 1   ρ q n + 1 α q n ρ q n Δ t   V + f ρ q U f n α q · f n = S α q + p = 1 n m ˙ p q m ˙ q p V
t ρ m i x v + · ρ m i x v v = p + μ m i x v + u + ρ g + S σ  
Boundary Conditions and Numerical Details
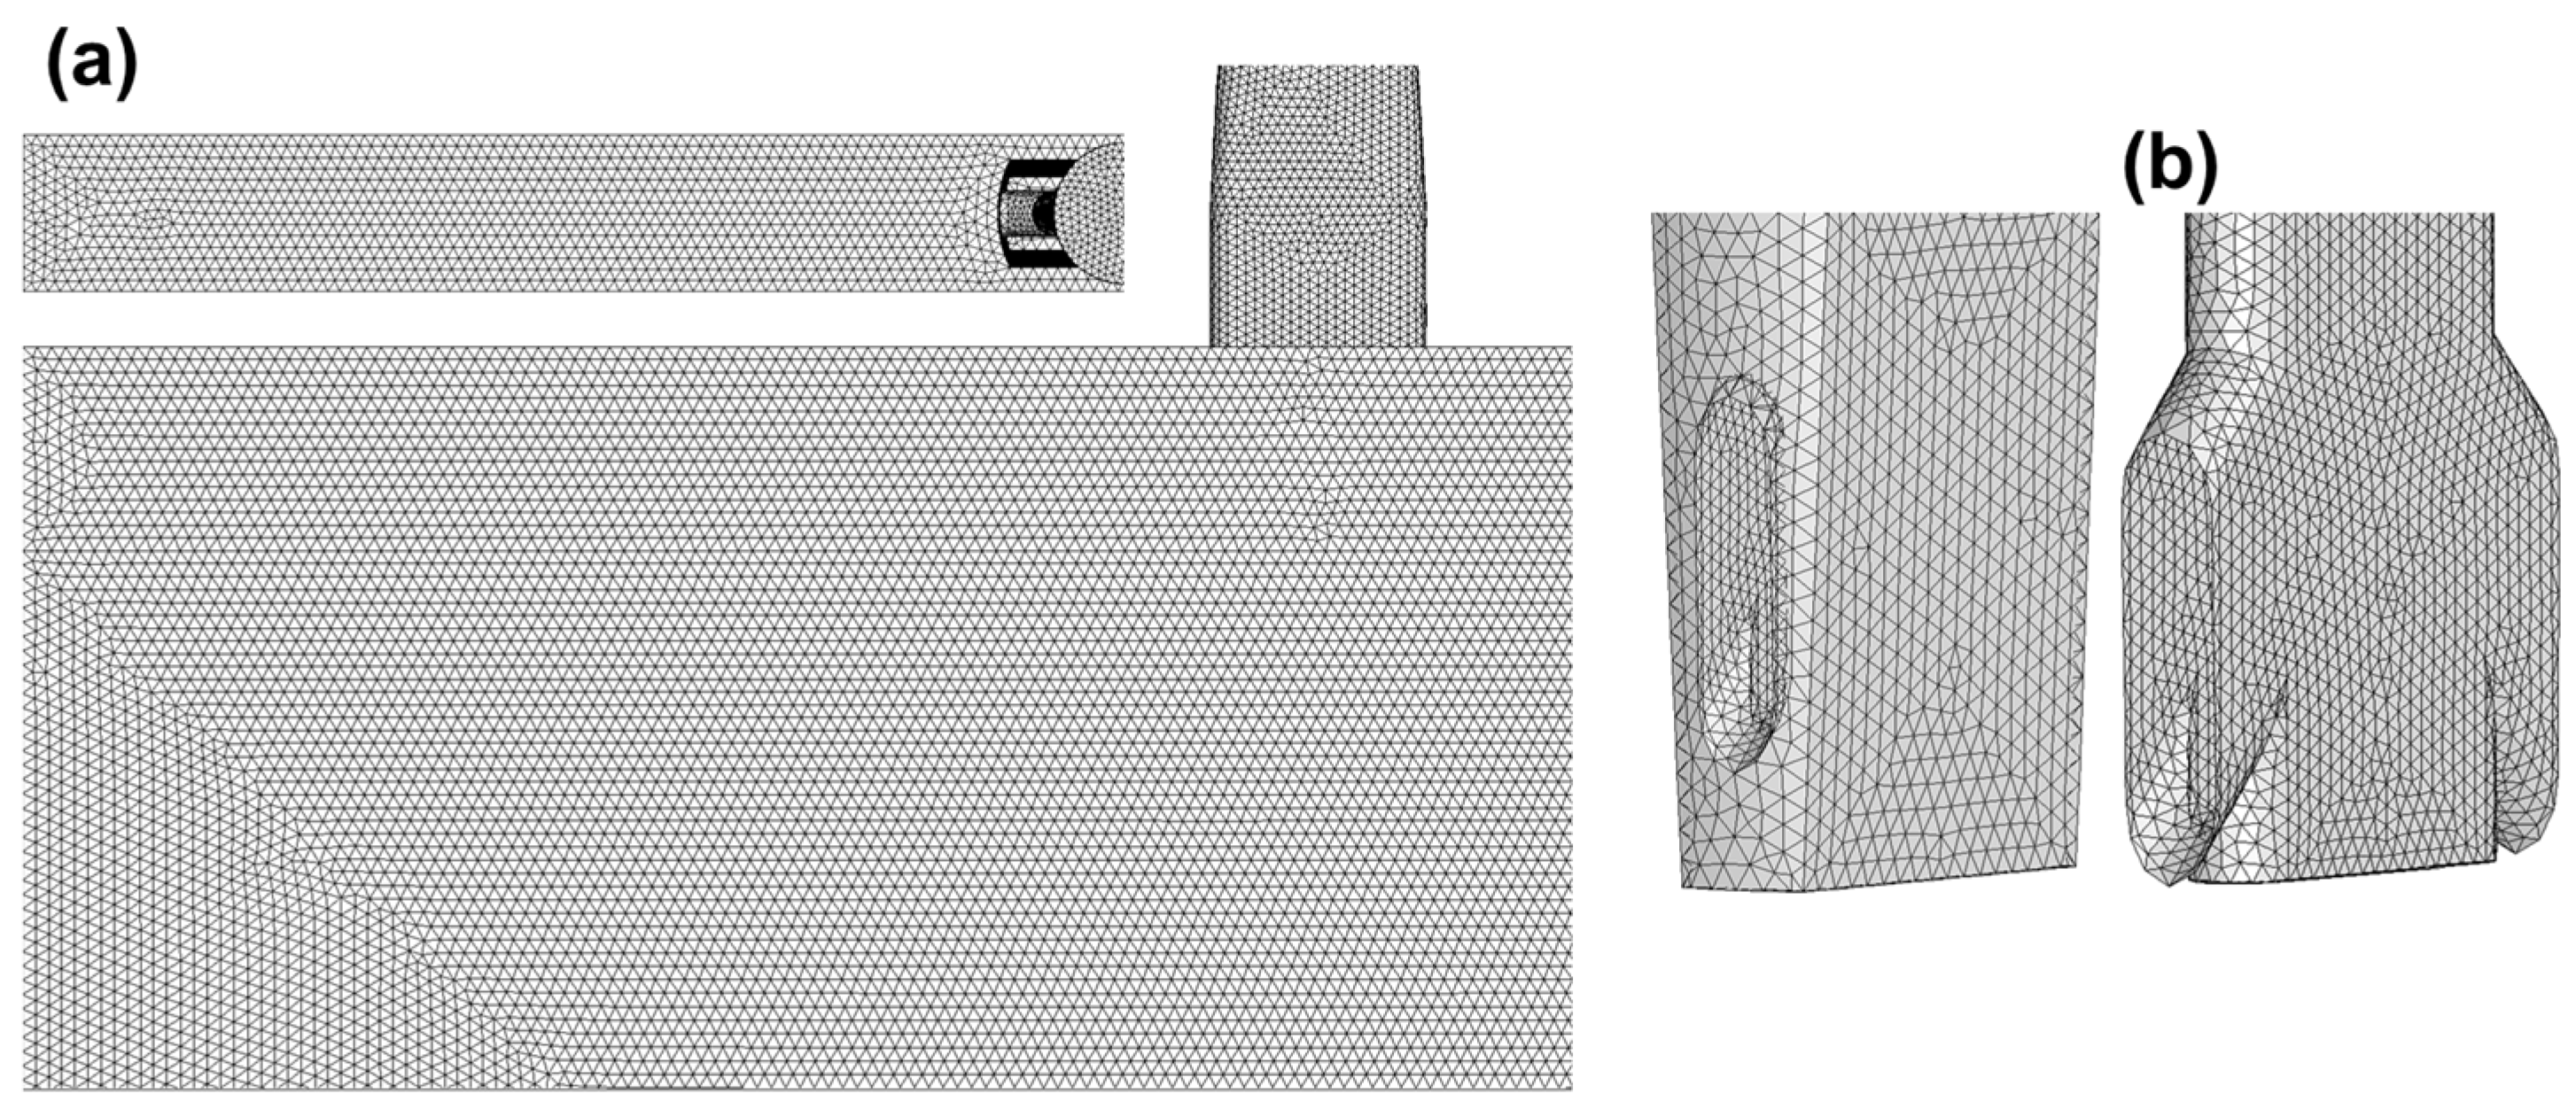
A three-dimensional model was developed to study the fluid dynamics in the medium–thin slab mold and the SEN, considering two SEN immersions: deep and shallow. The model was created using the CAD software SolidWorks 2023 and subsequently discretized into 2,500,000 unstructured elements, with a maximum element deformation of 0.76. The final mesh is shown in Figure 2. The phases steel and air for the multiphase system are immiscible fluids, allowing the tracking of their interphase throughout the VOF model, considering a Geo-Reconstruct scheme for tracking the volume fraction. This model has been utilized in numerous previous works and can be found in greater detail in the open literature [17,18]. The physical properties of the employed phases are in Table 1. Both the SEN inlet and the mold outlet are defined as “Velocity Inlet”, which is a specific boundary condition of CFD software, where a positive or negative value indicates the direction of the fluid. For the current work, negative values are used since they act in the opposite direction to the positive y-coordinate. Additionally, their values are calculated from the employed casting velocity to maintain flow equilibrium. The solution of all the equations that form the present model uses the commercial ANSYS-FLUENT® package (version 16). The following conditions apply to this solution: the governing equations are linearized using the implicit approach, the discretization employs a Second-Order Upwind scheme for the momentum, and the pressure–velocity coupling algorithm uses the PISO scheme, together with the PRESTO! method for spatial discretization. After a simulation of 180 s, the model reached a quasisteady state. The time step constant value during the simulation was equal to 0.005 s. Convergence occurred when the residuals of the output variables reached values smaller than 1 × 10⁻⁴.

3. Results and Discussion

3.1. Model Validation

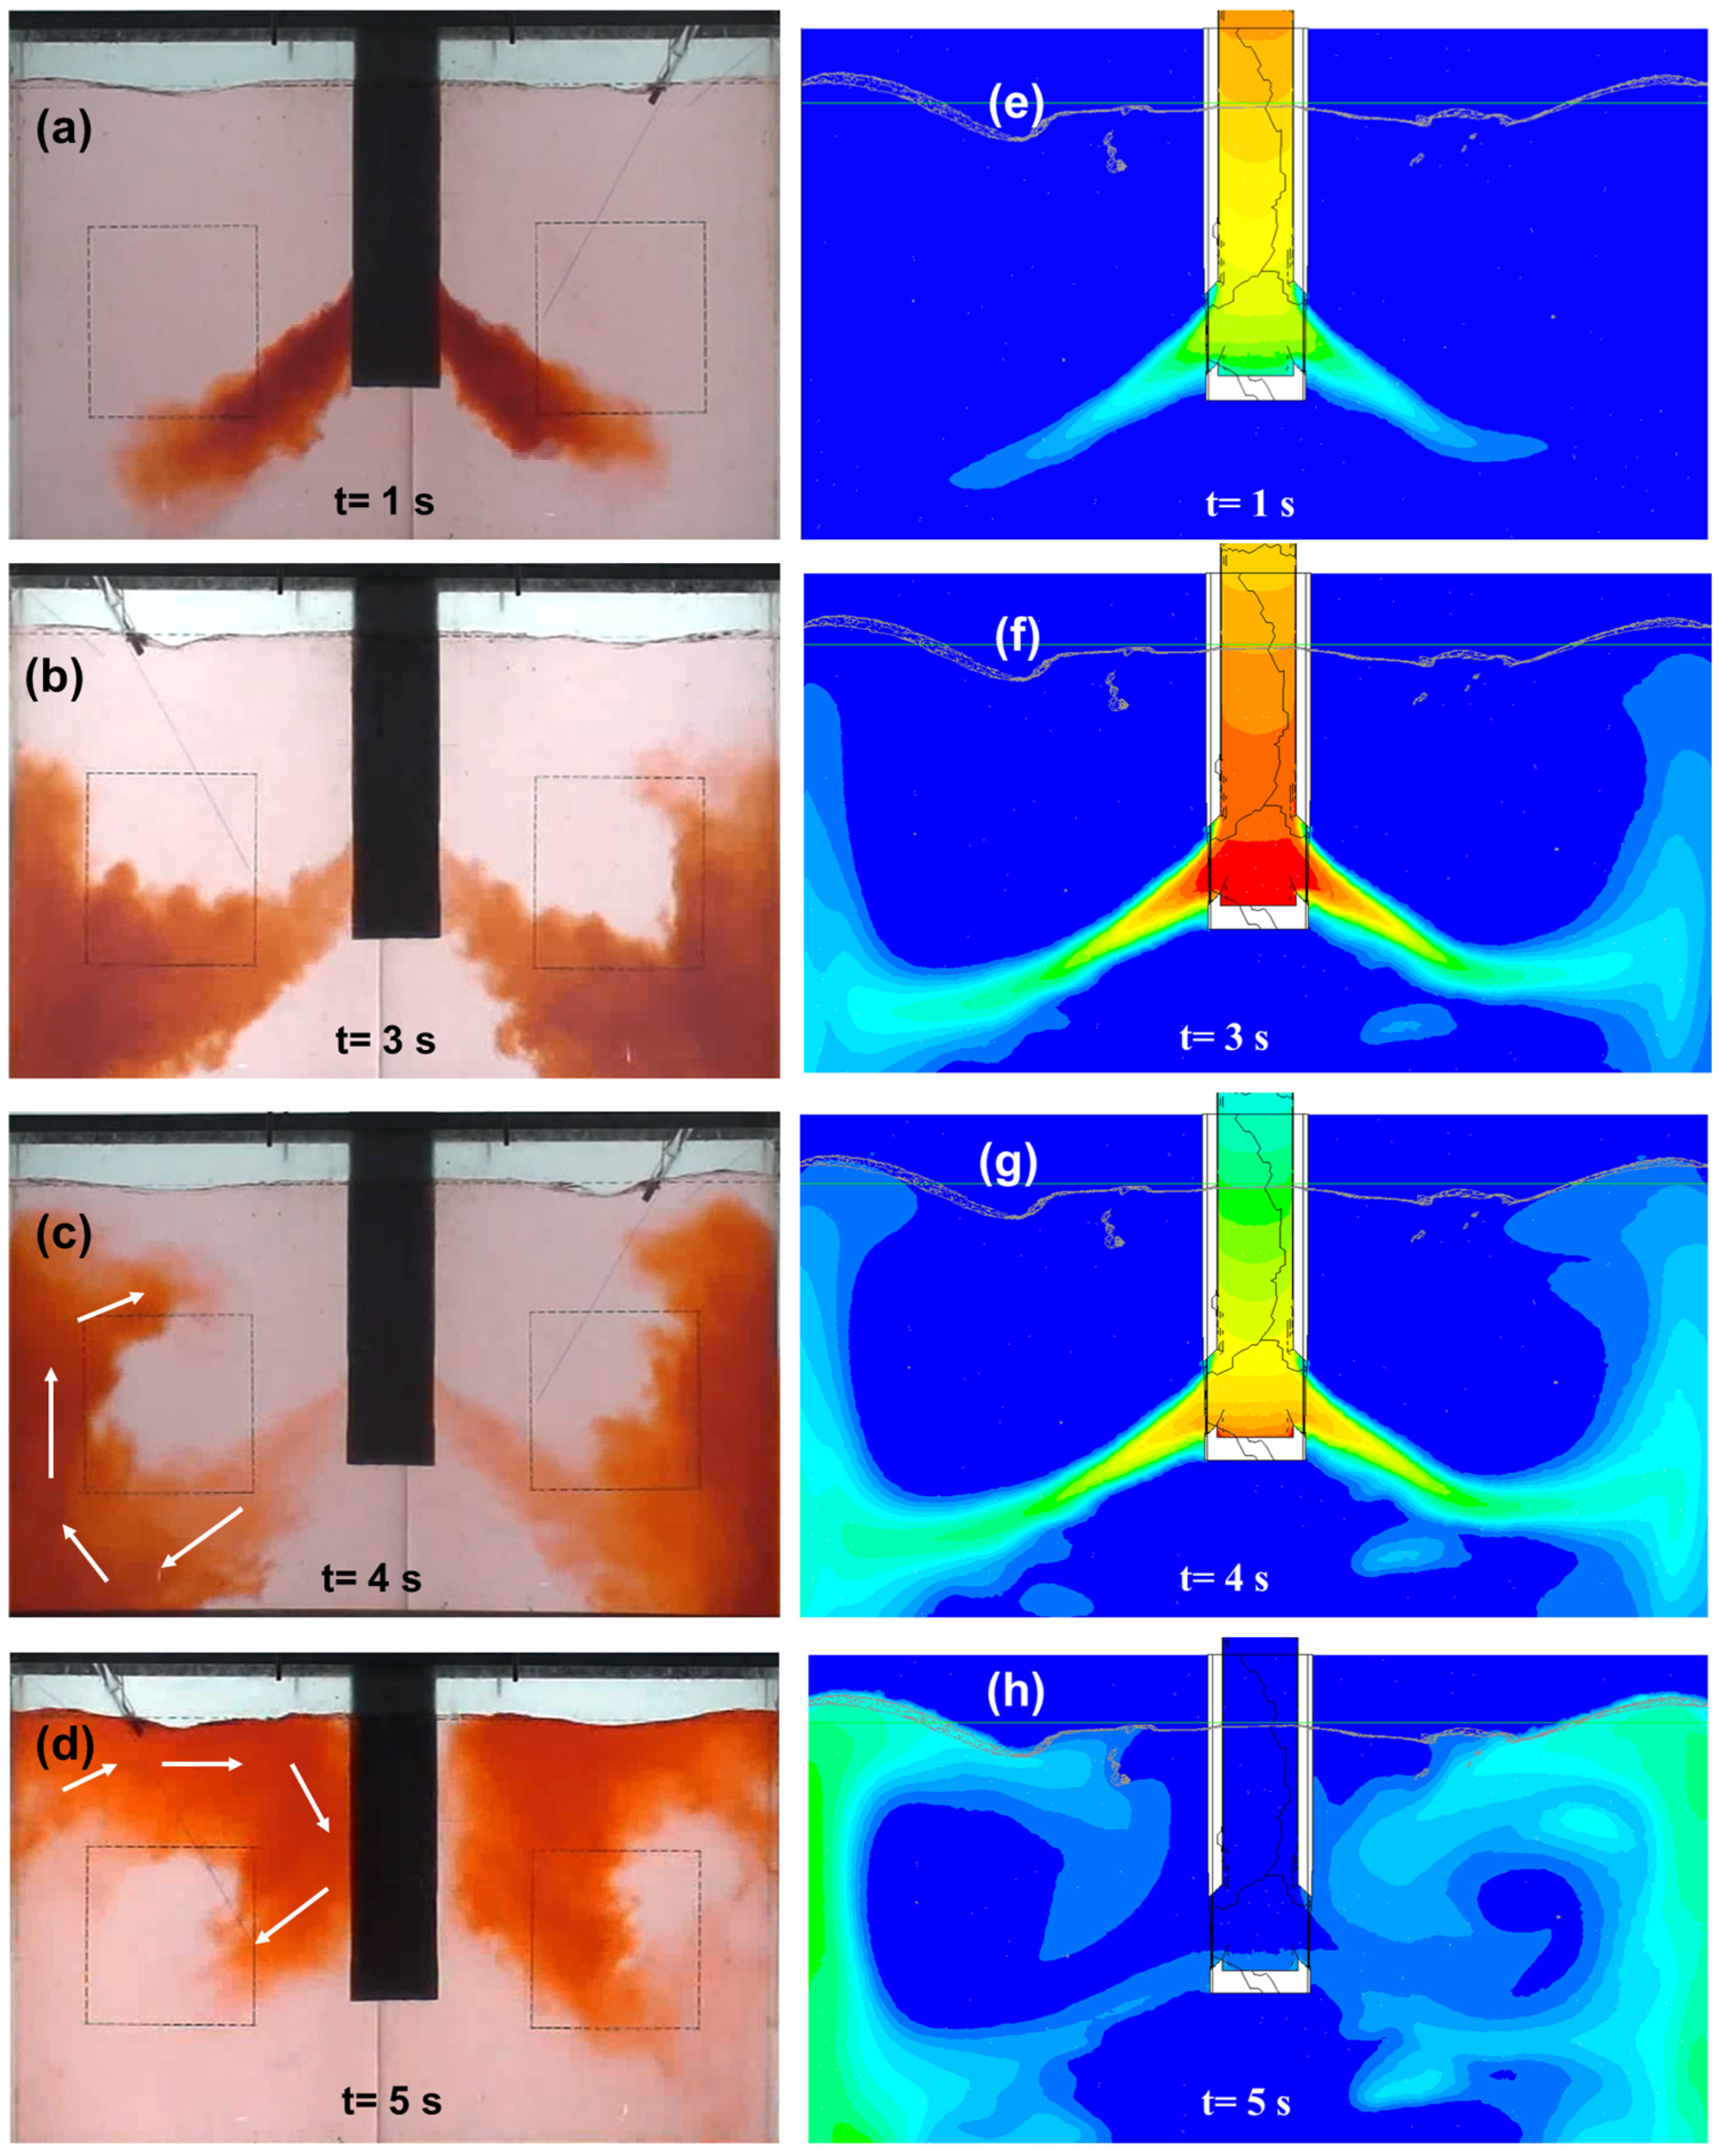
One of the fundamental steps is to verify the reliability of the mathematical simulation results. To achieve this, the fluid flow produced by the mathematical simulation was compared with the flow patterns observed in the physical model. To obtain the results from the physical model, a pulse of 20 mL of a red dye solution was supplied at the SEN top entry in the physical model, and the flow patterns shown by its dispersion throughout the model were recorded in a video. From the video, several images were selected that illustrated the fluid flow behavior described by the tracer movement. Simultaneously, in the mathematical model at its quasisteady state, an impulse of a tracer with the same physical properties as the fluid used during the simulation was injected at the SEN top entry, and its dispersion movement was calculated and saved in a video. Later, from this second video, several images were selected at time intervals corresponding to the physical experiments, showing the fluid flow behavior described by the tracer movement. These tracer images were acquired for both SEN immersions, and the results are presented in Figure 3 and Figure 4.
The first dye flow pattern described is for the SEN in the deep position. Figure 3a–d, from the physical results, show that at 1 s, once the tracer leaves the SEN ports, it moves faster on the left side. This is attributed to the longer length of the left jet in comparison to the right one. At 3 s, both jets impinge on the narrow mold faces and split into two streams. One stream moves towards the end of the mold, while the other moves towards the meniscus position. In this instant, the tracer displacement, which shows both jets and the ascending streams, does not present a clear difference in their behavior. At 4 s, the tracer flow pattern reveals differences once again. Although both ascending streams have reached the meniscus level, the right stream rotates slightly faster than the left one, and its lateral dispersion indicates that this ascending stream is wider. At 5 s, the tracer movement completed the expected upper flow pattern. In this final image, the tracer clearly shows the expected upper roll flows on both sides of the SEN. Nevertheless, the asymmetry between the two roll flows is more notorious. The tracer following the right upper roll flow has completed a cycle of revolution, while the tracer in the left upper roll flow has not yet finished its rotation. Now, when the mathematical results of the tracer behavior are analyzed by Figure 3e–h, it is clear that the numerical model accurately predicts the same flow pattern observed in the physical modeling, since all the previously noted flow observations are equally evident.
Secondly, the dye flow pattern for the SEN in the shallow position is analyzed. Similar to the SEN deep position, the analysis begins by examining the results of the tracer behavior in the physical model, which are shown in Figure 4a–d. The detailed flow pattern described for the dye tracer in the previous immersion is also seen in this shallow position, though some differences need to be highlighted. Initially, the tracer displacement indicates that both jets are quite similar. However, once they impact the narrow walls and split, the left jet shows an evidently higher velocity because it started its rotational movement earlier than the right side. This tendency persists even after the tracer reveals both upper roll flows. In addition, the upper roll flows, with the SEN positioned shallow, show a smaller volume of fluid compared to those observed with the deep position. This difference is evident because the sizes of the roll flows in the shallow position are smaller. When comparing the behavior of the tracer in the physical modeling to the tracer dispersion results from the mathematical model, as shown in Figure 4e–h, it is clear that the numerical model accurately predicts the same flow pattern observed in the physical modeling.
Since the current mathematical model effectively reproduces the flow patterns observed during the physical experiments through tracer movement, it can be confirmed that the mathematical model is both validated and reliable. Moreover, previous studies in the literature on conventional slab molds or thin slab molds [28,29,30,31] have performed mesh sensitivity analyses using meshes with lower densities than those used in the present work, which supports the adequacy of the selected mesh. For these reasons, a separate mesh-independence study was not carried out.

3.2. Fluid Flow Characteristics in a Quasisteady State Considering Both SEN Immersions

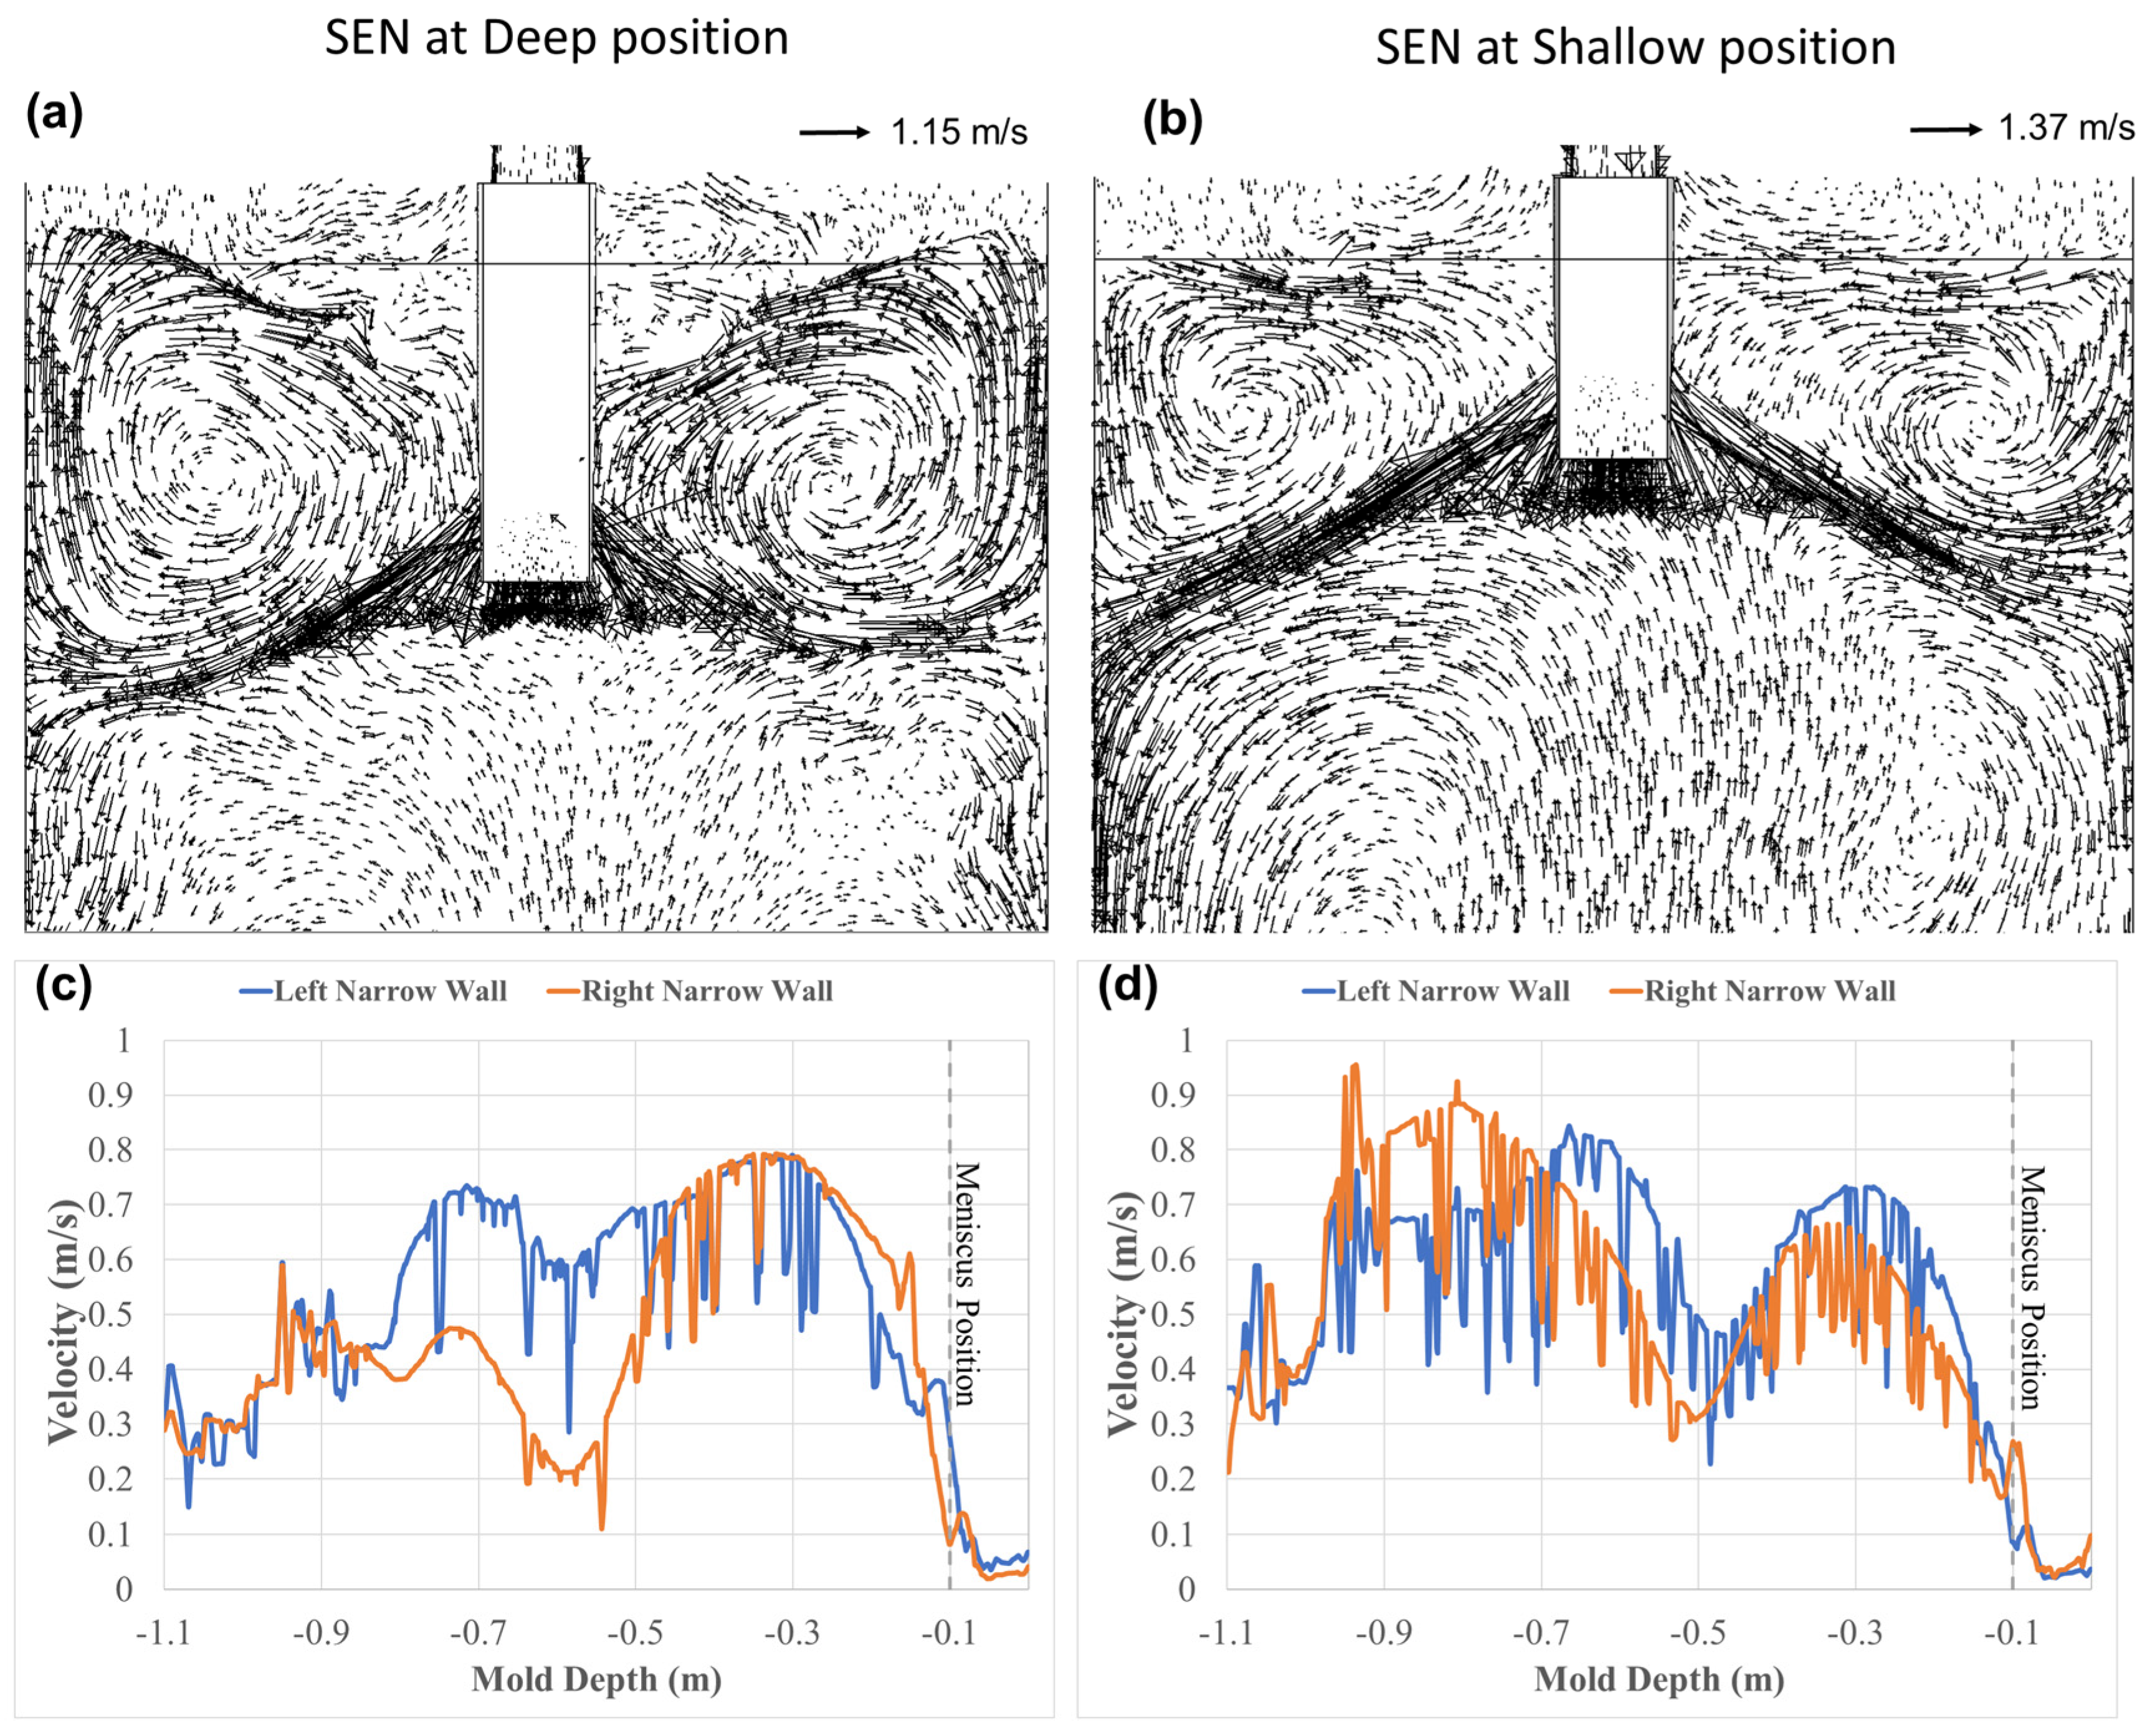
The fluid dynamic analysis begins when the mathematical model simulation reaches a quasisteady state, which occurs after 180 s of simulation. Figure 5 shows velocity vector fields at the central symmetrical plane of the mold for both SEN immersions. Additionally, this figure also shows the velocity magnitudes along a vertical line, positioned five millimeters away from the narrow mold walls and at the center of those walls.
The results indicate that, regardless of the SEN immersion, both jets consistently exhibit a distinctive straight trajectory. After impacting the narrow mold walls, the jets split into two streams, which develop upper and lower roll flows, as illustrated in Figure 5a,b. Additionally, despite the small mold thickness, the dynamic distortions typically seen in funnel thin slab molds were not detected. These flow characteristics closely resemble those commonly observed in conventional slab molds. Nevertheless, Figure 5c,d indicate that the streams generated after the jets split present higher velocities compared to those observed in conventional slab molds. Particularly, the velocity of the ascending streams that feed the meniscus and form the upper roll flows is significantly high. To understand how these high velocities affect the meniscus, the velocity magnitudes at the meniscus along a longitudinal line positioned 10 mm below the meniscus and an iso-surface of it with its corresponding velocity contours over it were calculated, which are shown in Figure 6. The results in this figure clearly demonstrate the high level of involvement of the meniscus. The meniscus shows high velocities, noticeable velocity fluctuations, and considerable deformations. All these flow characteristics are typically observed in thin slab molds. At this point, it is remarkable how the fluid dynamics of this medium–thin slab mold show flow characteristics similar to both types of molds, making its own flow patterns more interesting to study and to understand.
Even more important than the similarities in flow characteristics are the observations that the meniscus shows very high velocities, reaching up to 0.87 m/s for the deep SEN immersion and up to 0.72 m/s for the shallow immersion. These elevated velocities have two important consequences: first, they lead to an unstable meniscus with considerable deformations, and second, there is a high possibility of slag entrapment. The origin of meniscus affectations is the upward streams near the narrow walls of the mold. These streams reach the meniscus at high velocities, pushing it upward and causing positive deformation of up to 40 mm and up to 24 mm for the SEN at the deep and shallow positions, respectively. After causing these deformations, the stream rotates towards the SEN, initially moving downward before shifting to an oscillating motion. The downward movement creates negative meniscus deformations of up to −50 mm and up to −27 mm for the SEN at the deep and shallow positions, respectively. Afterward, just small meniscus undulations are observed. The high velocities in the meniscus not only cause its deformation but also may trap the slag. This phenomenon occurs when the interface between two density-stratified fluids in relative motion becomes unstable due to a sufficiently large velocity difference. Such instability is known as Kelvin–Helmholtz instability (KHI) [32]. This shear instability mechanism is more likely to occur when the critical velocity difference exceeds the values obtained through Equation (11).
Δ V c r i t = 4 g ρ l ρ u Γ u l 1 ρ u + 1 ρ l 2 4
where g is the gravity force, ρ l is the steel density, ρ u is the slag density, and Γ u l is the interphase tension.
As the current model does not consider the slag phase, the calculation of the critical velocity difference is based on the slag density value reported by Yu et al. [20], along with other values obtained from the present research. The calculated critical velocity difference is 0.518 m/s, which is considerably lower than the maximum meniscus velocities previously reported. Therefore, if the current mathematical model had included the slag phase, the phenomenon of slag dragging would have occurred.
Since meniscus deformations are not a permanent phenomenon, it is essential to study how these positive and negative meniscus deformations evolve, in search of the phenomenon of meniscus dynamic distortion. This study will be developed in the next section.

3.3. Study of the Fluid Dynamics Involved in the Transient Meniscus Instability

Research on the stability of the meniscus in thin slab molds has identified a close relationship between meniscus fluctuations and the stability of the jets. Based on this understanding, the initial analysis focuses on the behavior of the jets, specifically examining the mass flow rate delivered by the SEN to each jet. Figure 7 shows the mathematical mass flow rate calculated for each monitored port of the SEN over a 60 s period. This data is available for both SEN immersions. The results indicate that this SEN design tends to deliver a higher mass flow rate through the left port of the SEN, regardless of the SEN immersion. Nevertheless, there are significant variations associated with each SEN immersion that need to be indicated.
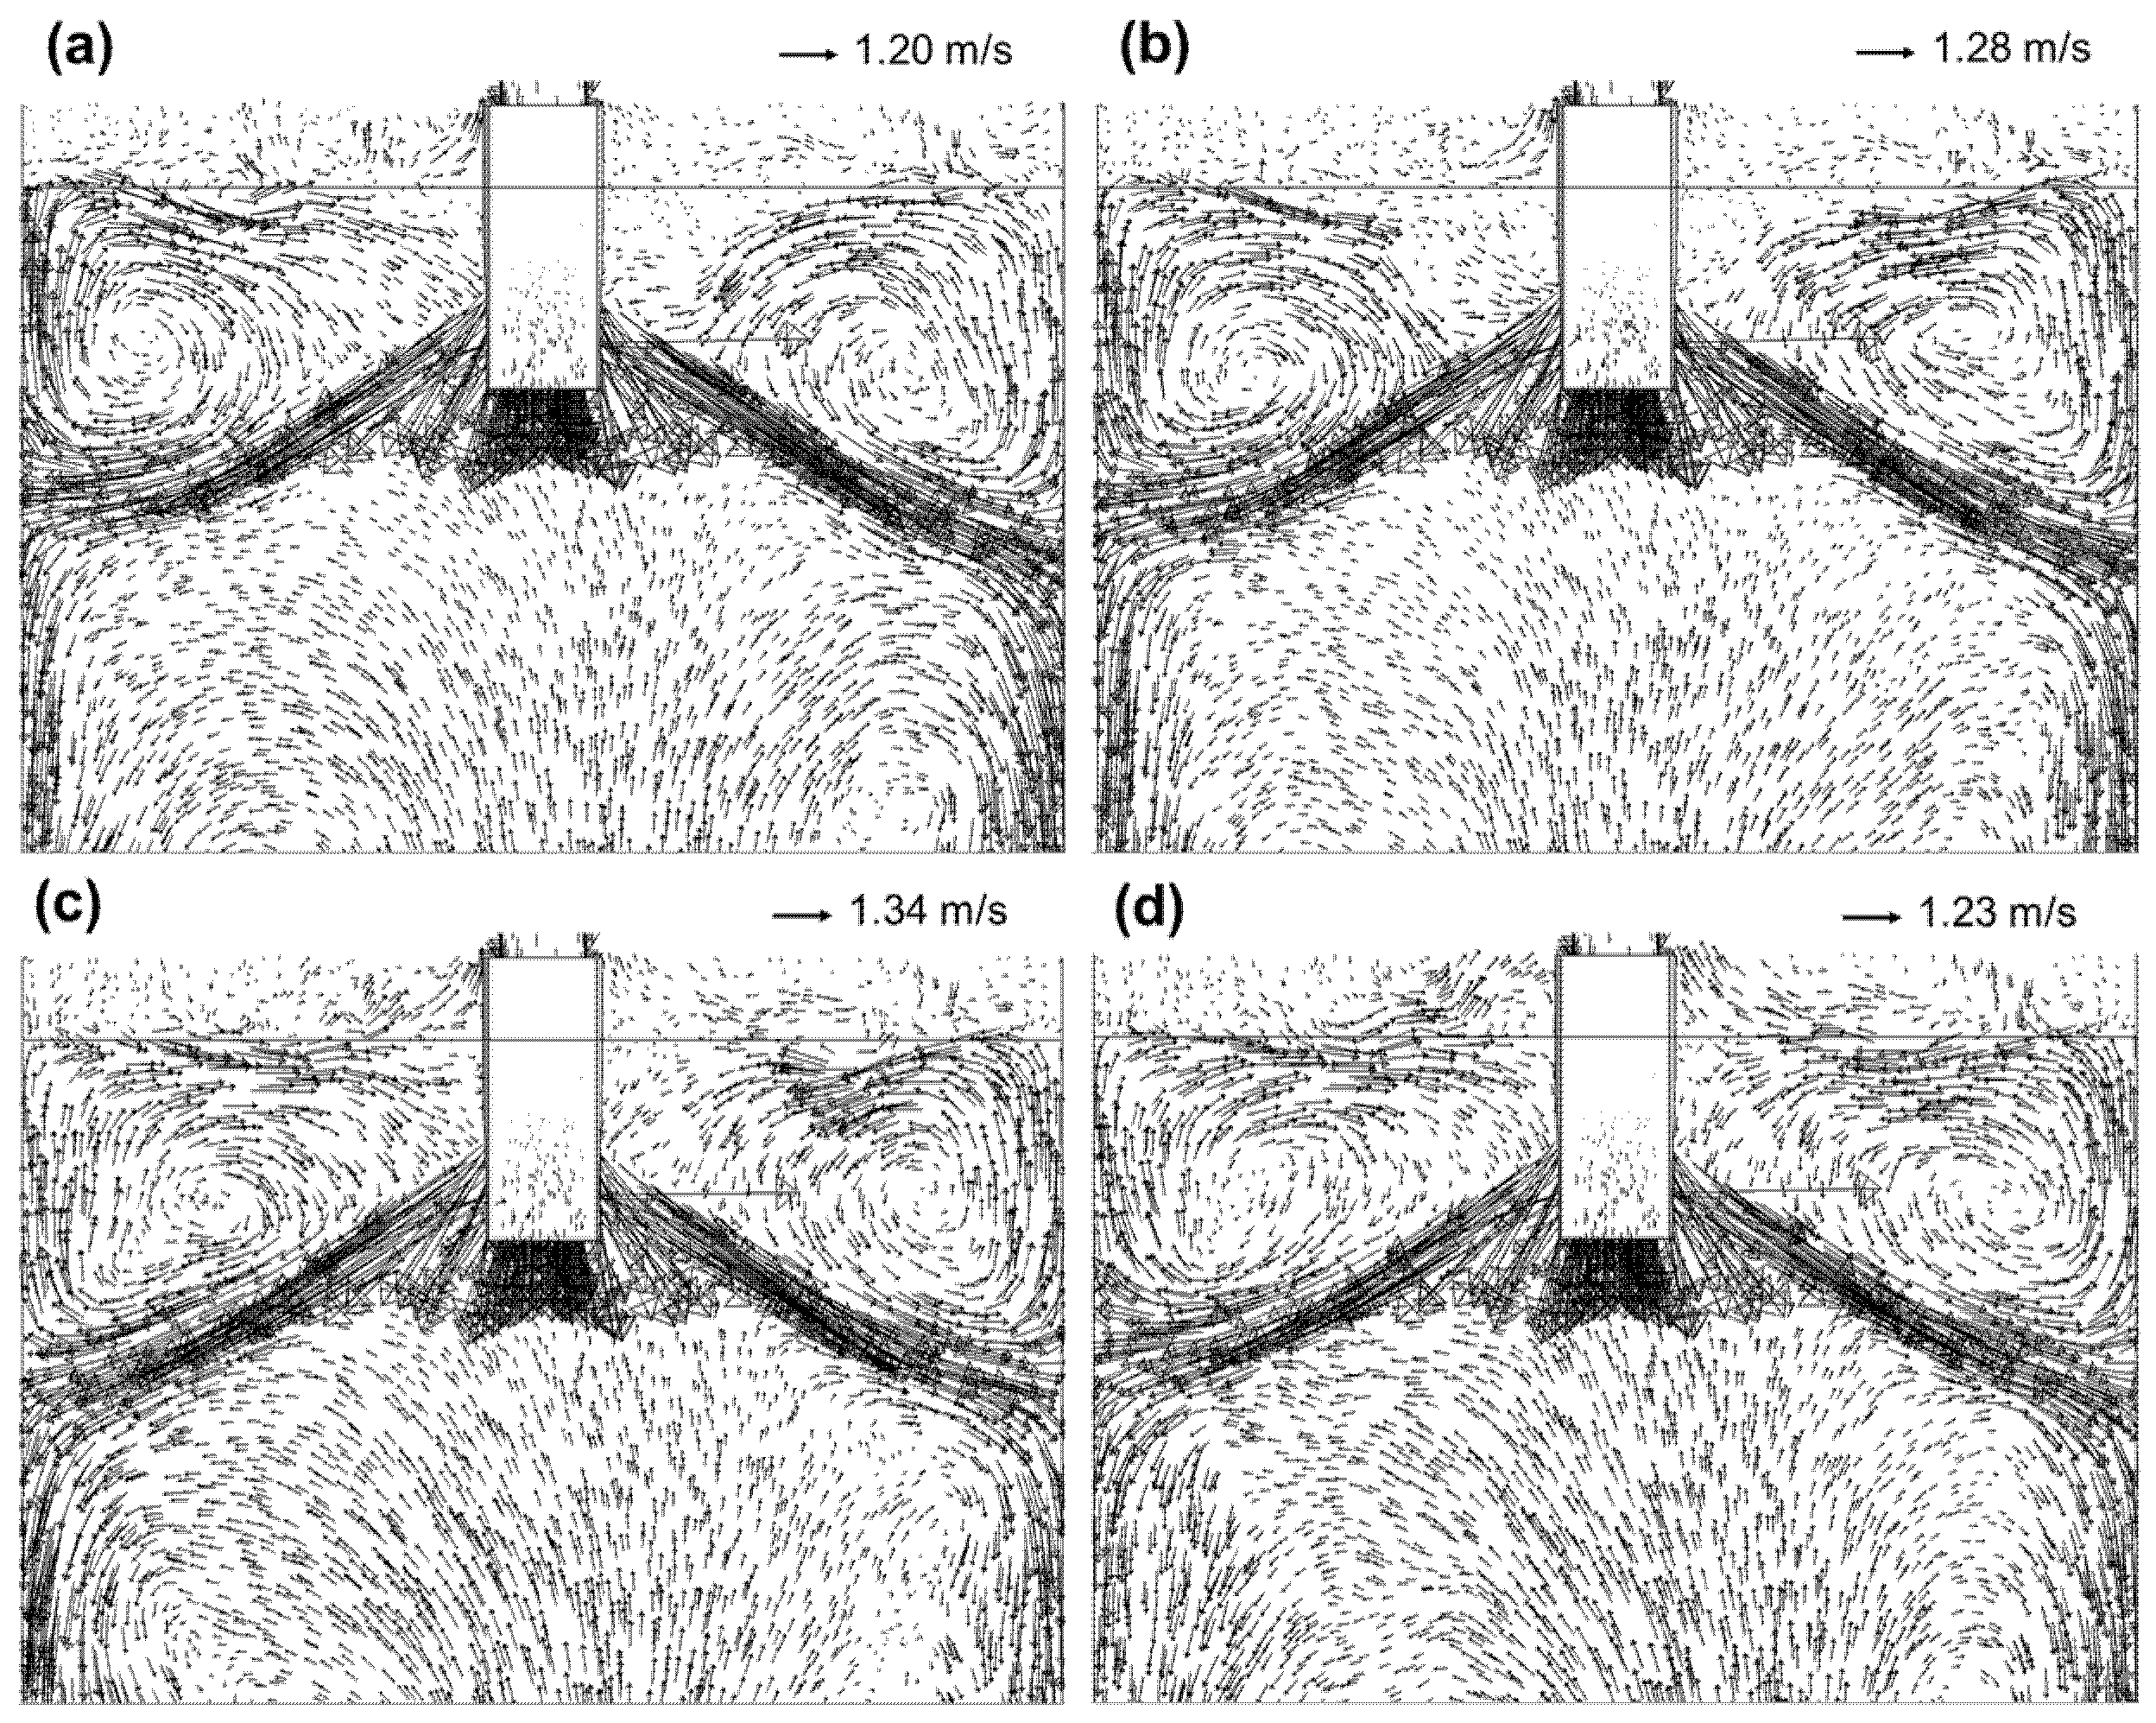
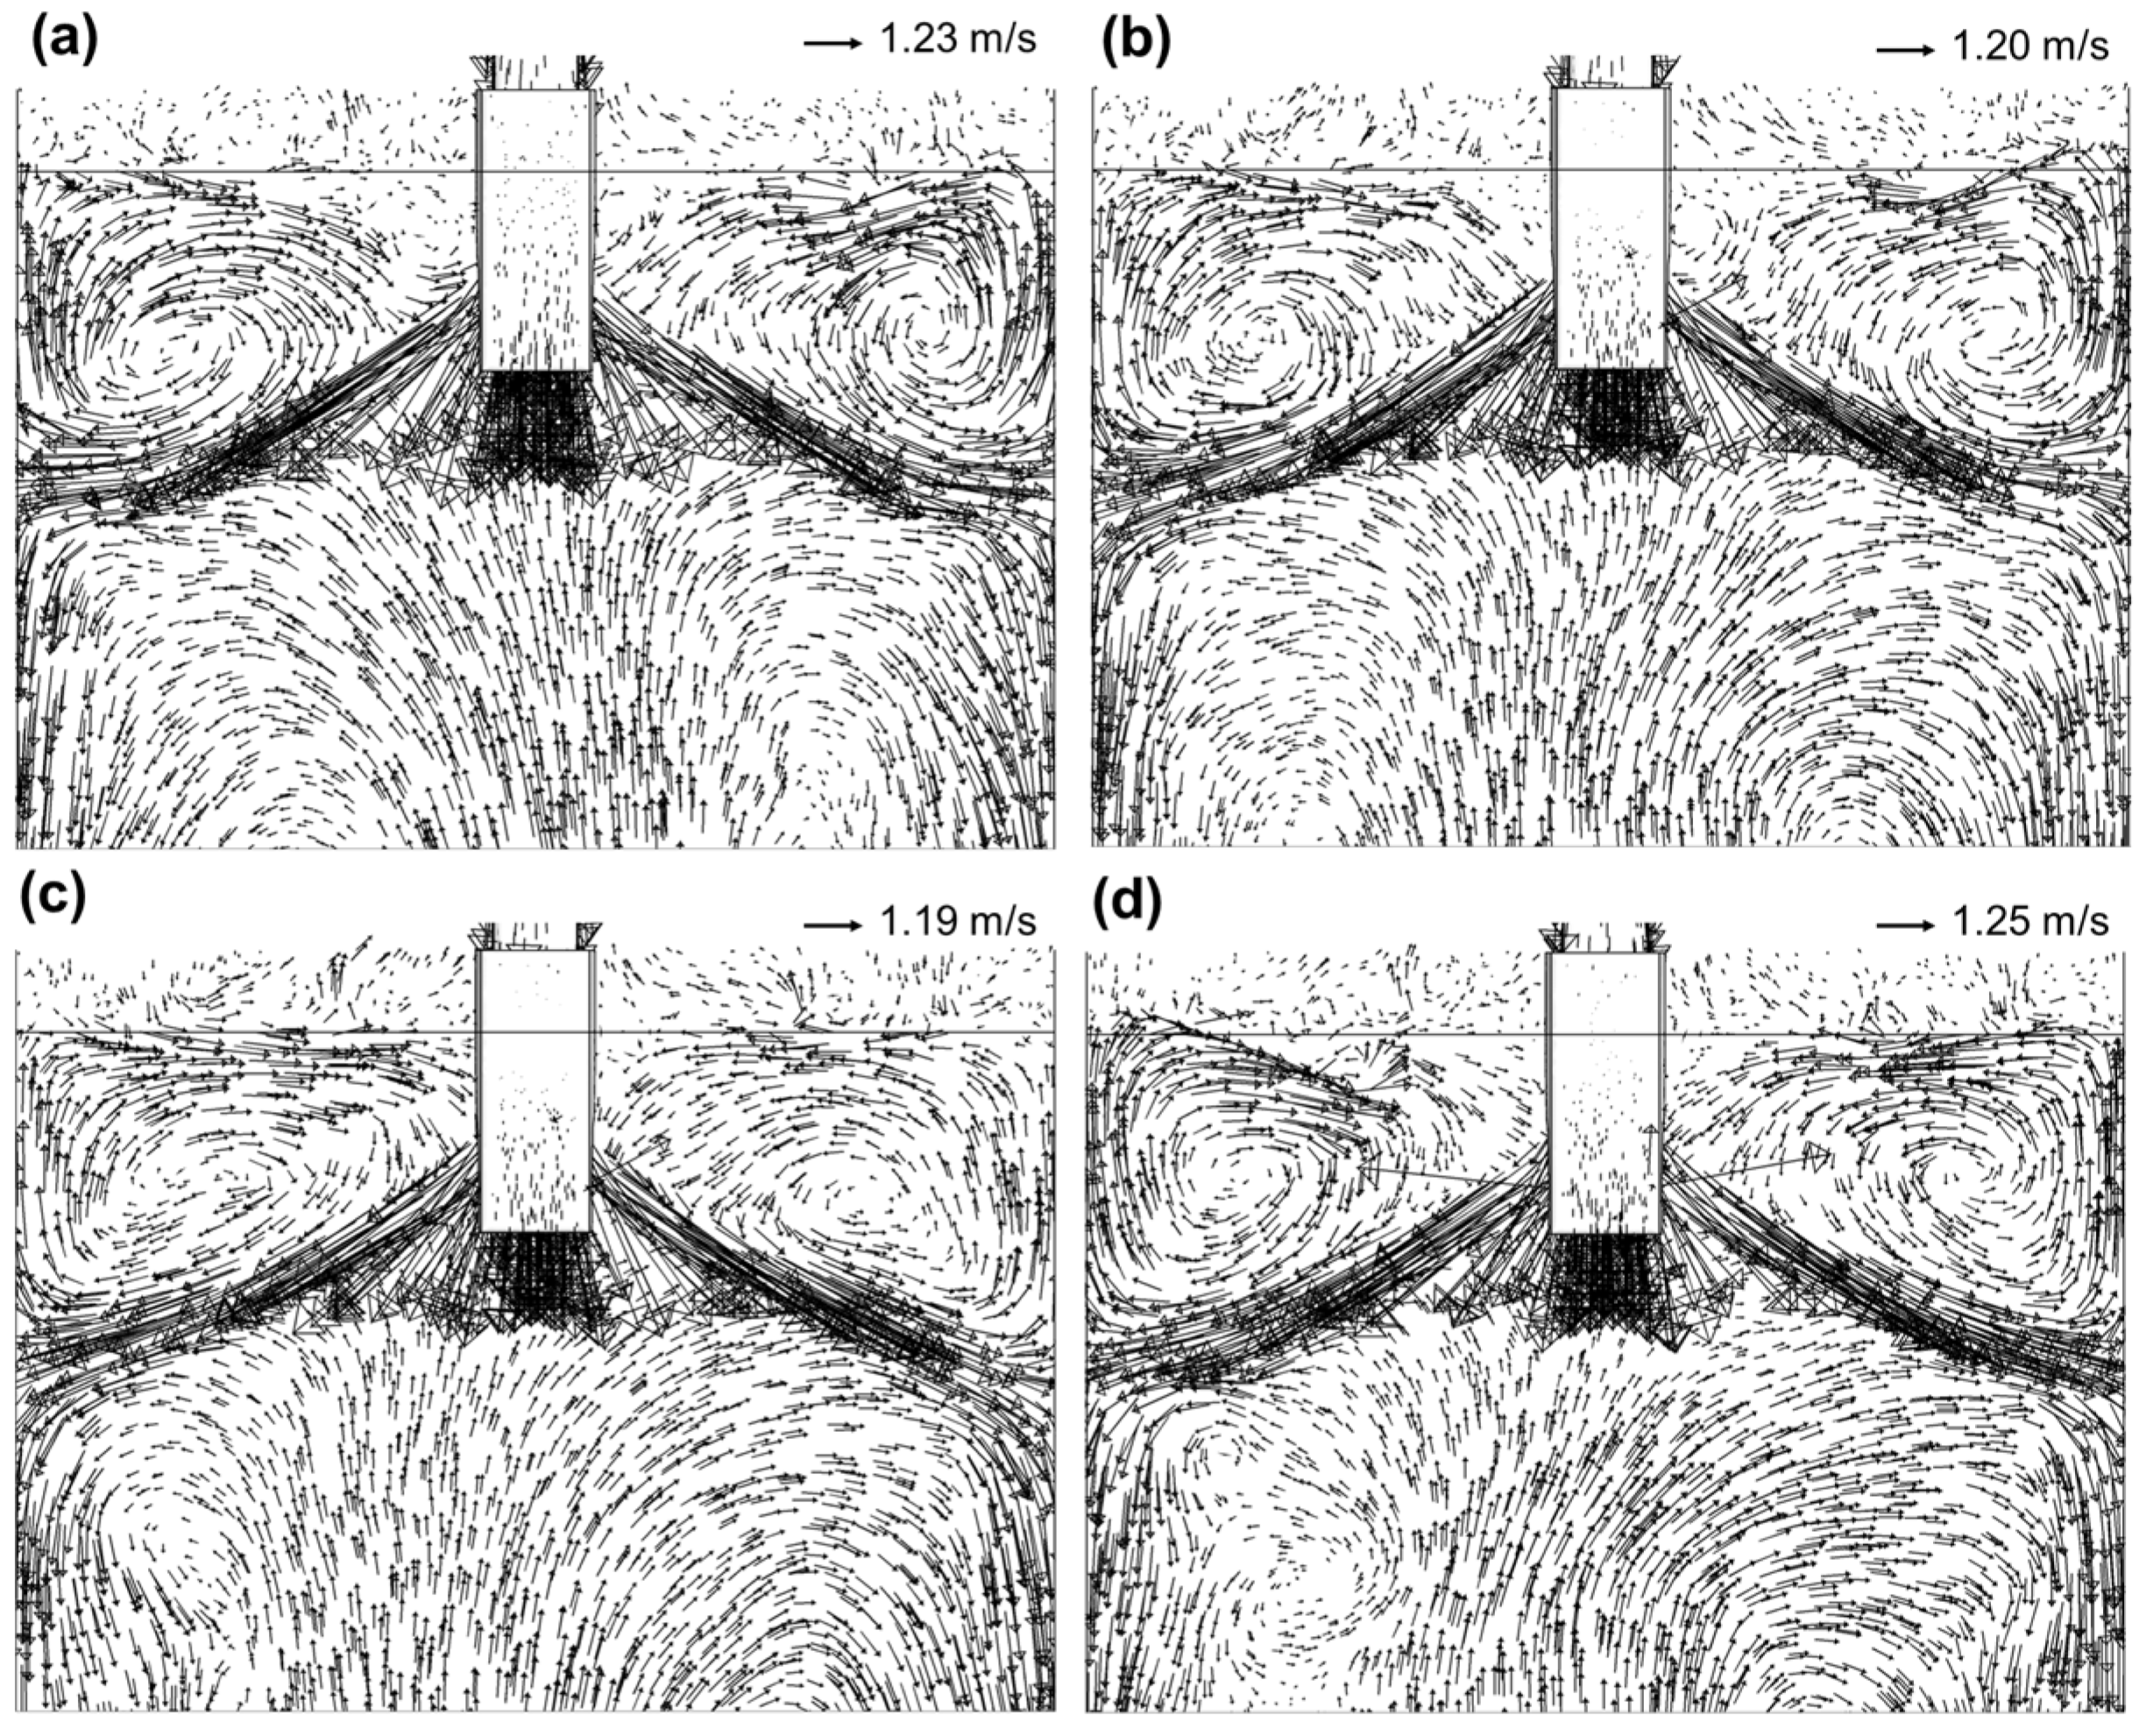
For the deep immersion, as shown in Figure 7a, there are two periods that cycle. During the first period, observed from 185 to 200 s, the difference in mass flow rate is the largest, averaging around 1.5 kg/s. In the second period, observed from 205 to 220 s, this difference tends to decrease, averaging around 1.2 kg/s. Regardless of the period, the right SEN port never delivers a mass flow rate greater than the left one. On the other hand, for the SEN at shallow immersion, as shown in Figure 7b, there is only one cycling period. This period shows many small oscillations, with only one being the largest. In this case, the mass flow rates at the right and left ports can exceed each other, but with the right port generally showing higher values. During the small oscillations, the average difference in mass flow rate is around 0.009 kg/s, while for the larger oscillations, the average difference is about 0.23 kg/s. This must affect the fluid dynamics inside the mold for each period. To analyze how the flow changes, velocity vector profiles are calculated in a longitudinal central plane at four different time points throughout the period. Figure 8 and Figure 9 show these profiles for the SEN at the deep immersion, while Figure 10 and Figure 11 display them for the SEN at the shallow immersion.
For the SEN at the deep position, the first noticeable observation was that the lower roll flows always maintain large sizes with relatively small velocities throughout the 60 s of the studied transient period. This particular flow behavior is very common in conventional slab molds, where the angles of the SEN ports direct the jets more towards the narrow mold walls than towards the end of the mold, resulting in the jets being far apart from each other and avoiding any interaction between them [1,33,34,35]. Contrary to what occurs in funnel thin slab molds with a bifurcated SEN design, where both jets are located close to each other with a more descending trajectory, allowing interaction between their surrounding flow [3,4,5,6,8,9,10,11,14,36]. Consequently, for this medium slab mold, the flow behavior of the jets is more like that in a conventional slab mold, and the expected cascade of vortex flows below the two discharging jets is not observed. Then, there are no shear stresses at the end of the jets acting on the surrounding fluid. Consequently, the expected instantaneous imbalance of the turbulent kinetic energy in the discharging jets does not occur, and neither does the phenomenon known as dynamic distortion.
In contrast, the upper section of the mold shows considerable variations in fluid dynamics during the two significant periods previously indicated in Figure 7a. For the first period with the SEN at the deep position, as shown in Figure 8, the excess mass flow rate delivered preferentially by the left port induces asymmetric upper roll flows, with the left upper roll flow maintaining a larger size and higher velocities throughout the period. This flow pattern generates, close to the left narrow mold wall, an ascending stream with significantly higher velocity, resulting in a meniscus with increased movement and an oscillating horizontal stream on the same mold side. In the second period with the SEN at the deep position, as shown in Figure 9, both upper roll flows show similar sizes and velocity intensities. Nevertheless, there are slight differences in their shape, which transition from circular to oval and back again. During these shape changes, the ascending streams near the narrow mold walls also experience variations in their velocity magnitude, with a clear aleatoric variation in their occurrence. As a result, the subsequent horizontal streams oscillate and constantly change their direction towards the SEN wall or towards the SEN ports. After this period of intense fluid dynamics, the mass flow rate at the left port becomes dominant once again, repeating the initial flow behavior, and so forth. These flow patterns generate a highly unstable meniscus with high velocity fluctuations along its length, which will be analyzed in more detail further.
In the case when the SEN is in a shallow position, the lower roll flows present the same characteristics as those observed during deep immersion of the SEN. Consequently, the dynamic distortion phenomenon does not occur either. Nevertheless, the upper section of the mold again shows considerable variations in fluid dynamics during the detected cyclic periods, as previously indicated in Figure 7b. The flow patterns that develop during this period are analyzed over two cycles to gain a better understanding, as shown in Figure 10 and Figure 11. The flow patterns of the upper zone of the mold in this case show some characteristics observed in the first immersion. These include the circular shape of the upper roll flows, upward streams near the narrow mold walls with high velocities even when they reach the meniscus level, and oscillating horizontal streams traveling from the narrow mold walls towards the SEN wall. Nevertheless, there are significant differences that need to be mentioned. The upper roll flow continuously shifts between circular and oval shapes, with the latter occurring more frequently. These flows are smaller in size compared to those in the previous immersion, indicating they have a reduced fluid volume. Although the upward streams still demonstrate high velocities, their intensities are lower than during the first immersion. The horizontal streams move more frequently towards the upper part of the jets, and although they oscillate horizontally, they do so with less intensity. Even though the fluid dynamics observed in both analyzed periods are similar, the second period exhibits higher velocities and more active horizontal streams; this implies that although the periods are similar in their mass flow rate variations, their potential effects on meniscus stability differ.
The results of the fluid dynamics analysis during a transient period indicate that variations in mass flow rate between each SEN port generate unstable flow patterns of the jets. However, these variations are insufficient to induce the phenomenon of dynamic distortion, regardless of the SEN immersion. Nevertheless, the high casting velocity induces upward streams with variable velocity intensities over time, which feed high-velocity flows with oscillating movements in the meniscus. These analyses confirm that the meniscus is highly affected, with detrimental results in its flow behavior. Now it remains to be determined whether these flow patterns can induce the meniscus dynamic distortions or whether they only deform the meniscus shape.

3.4. Analysis of the Meniscus Deformations

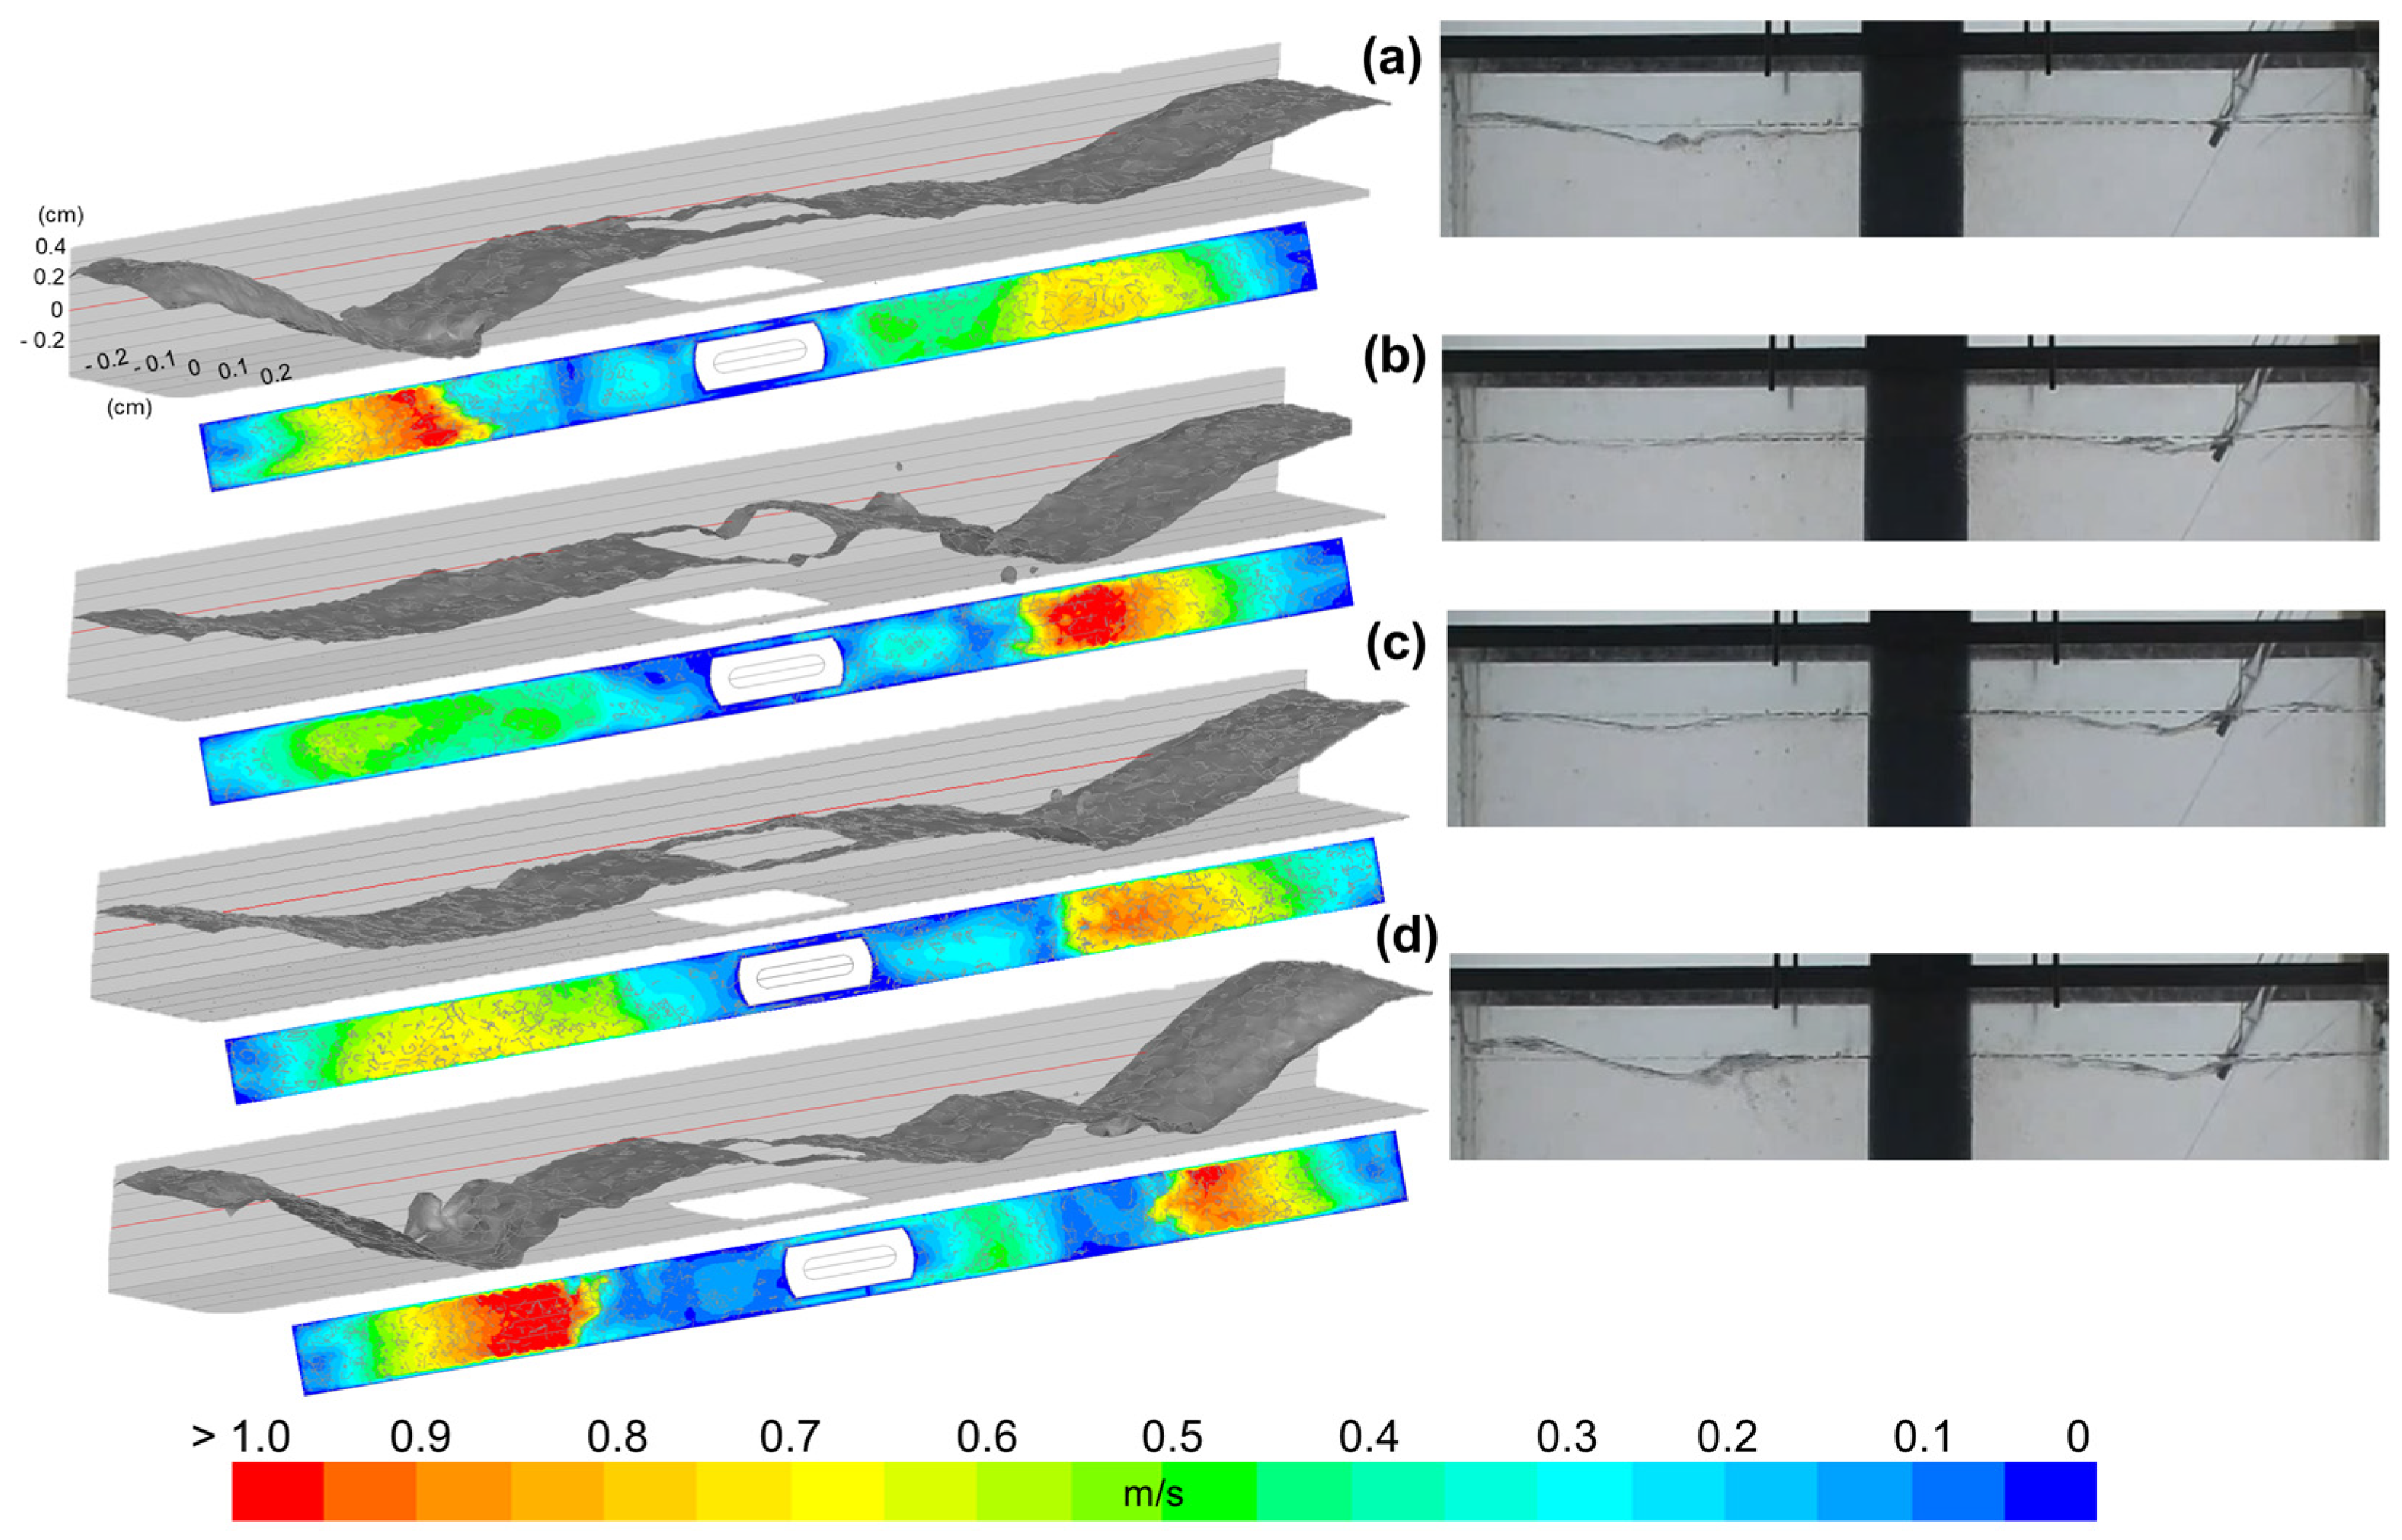
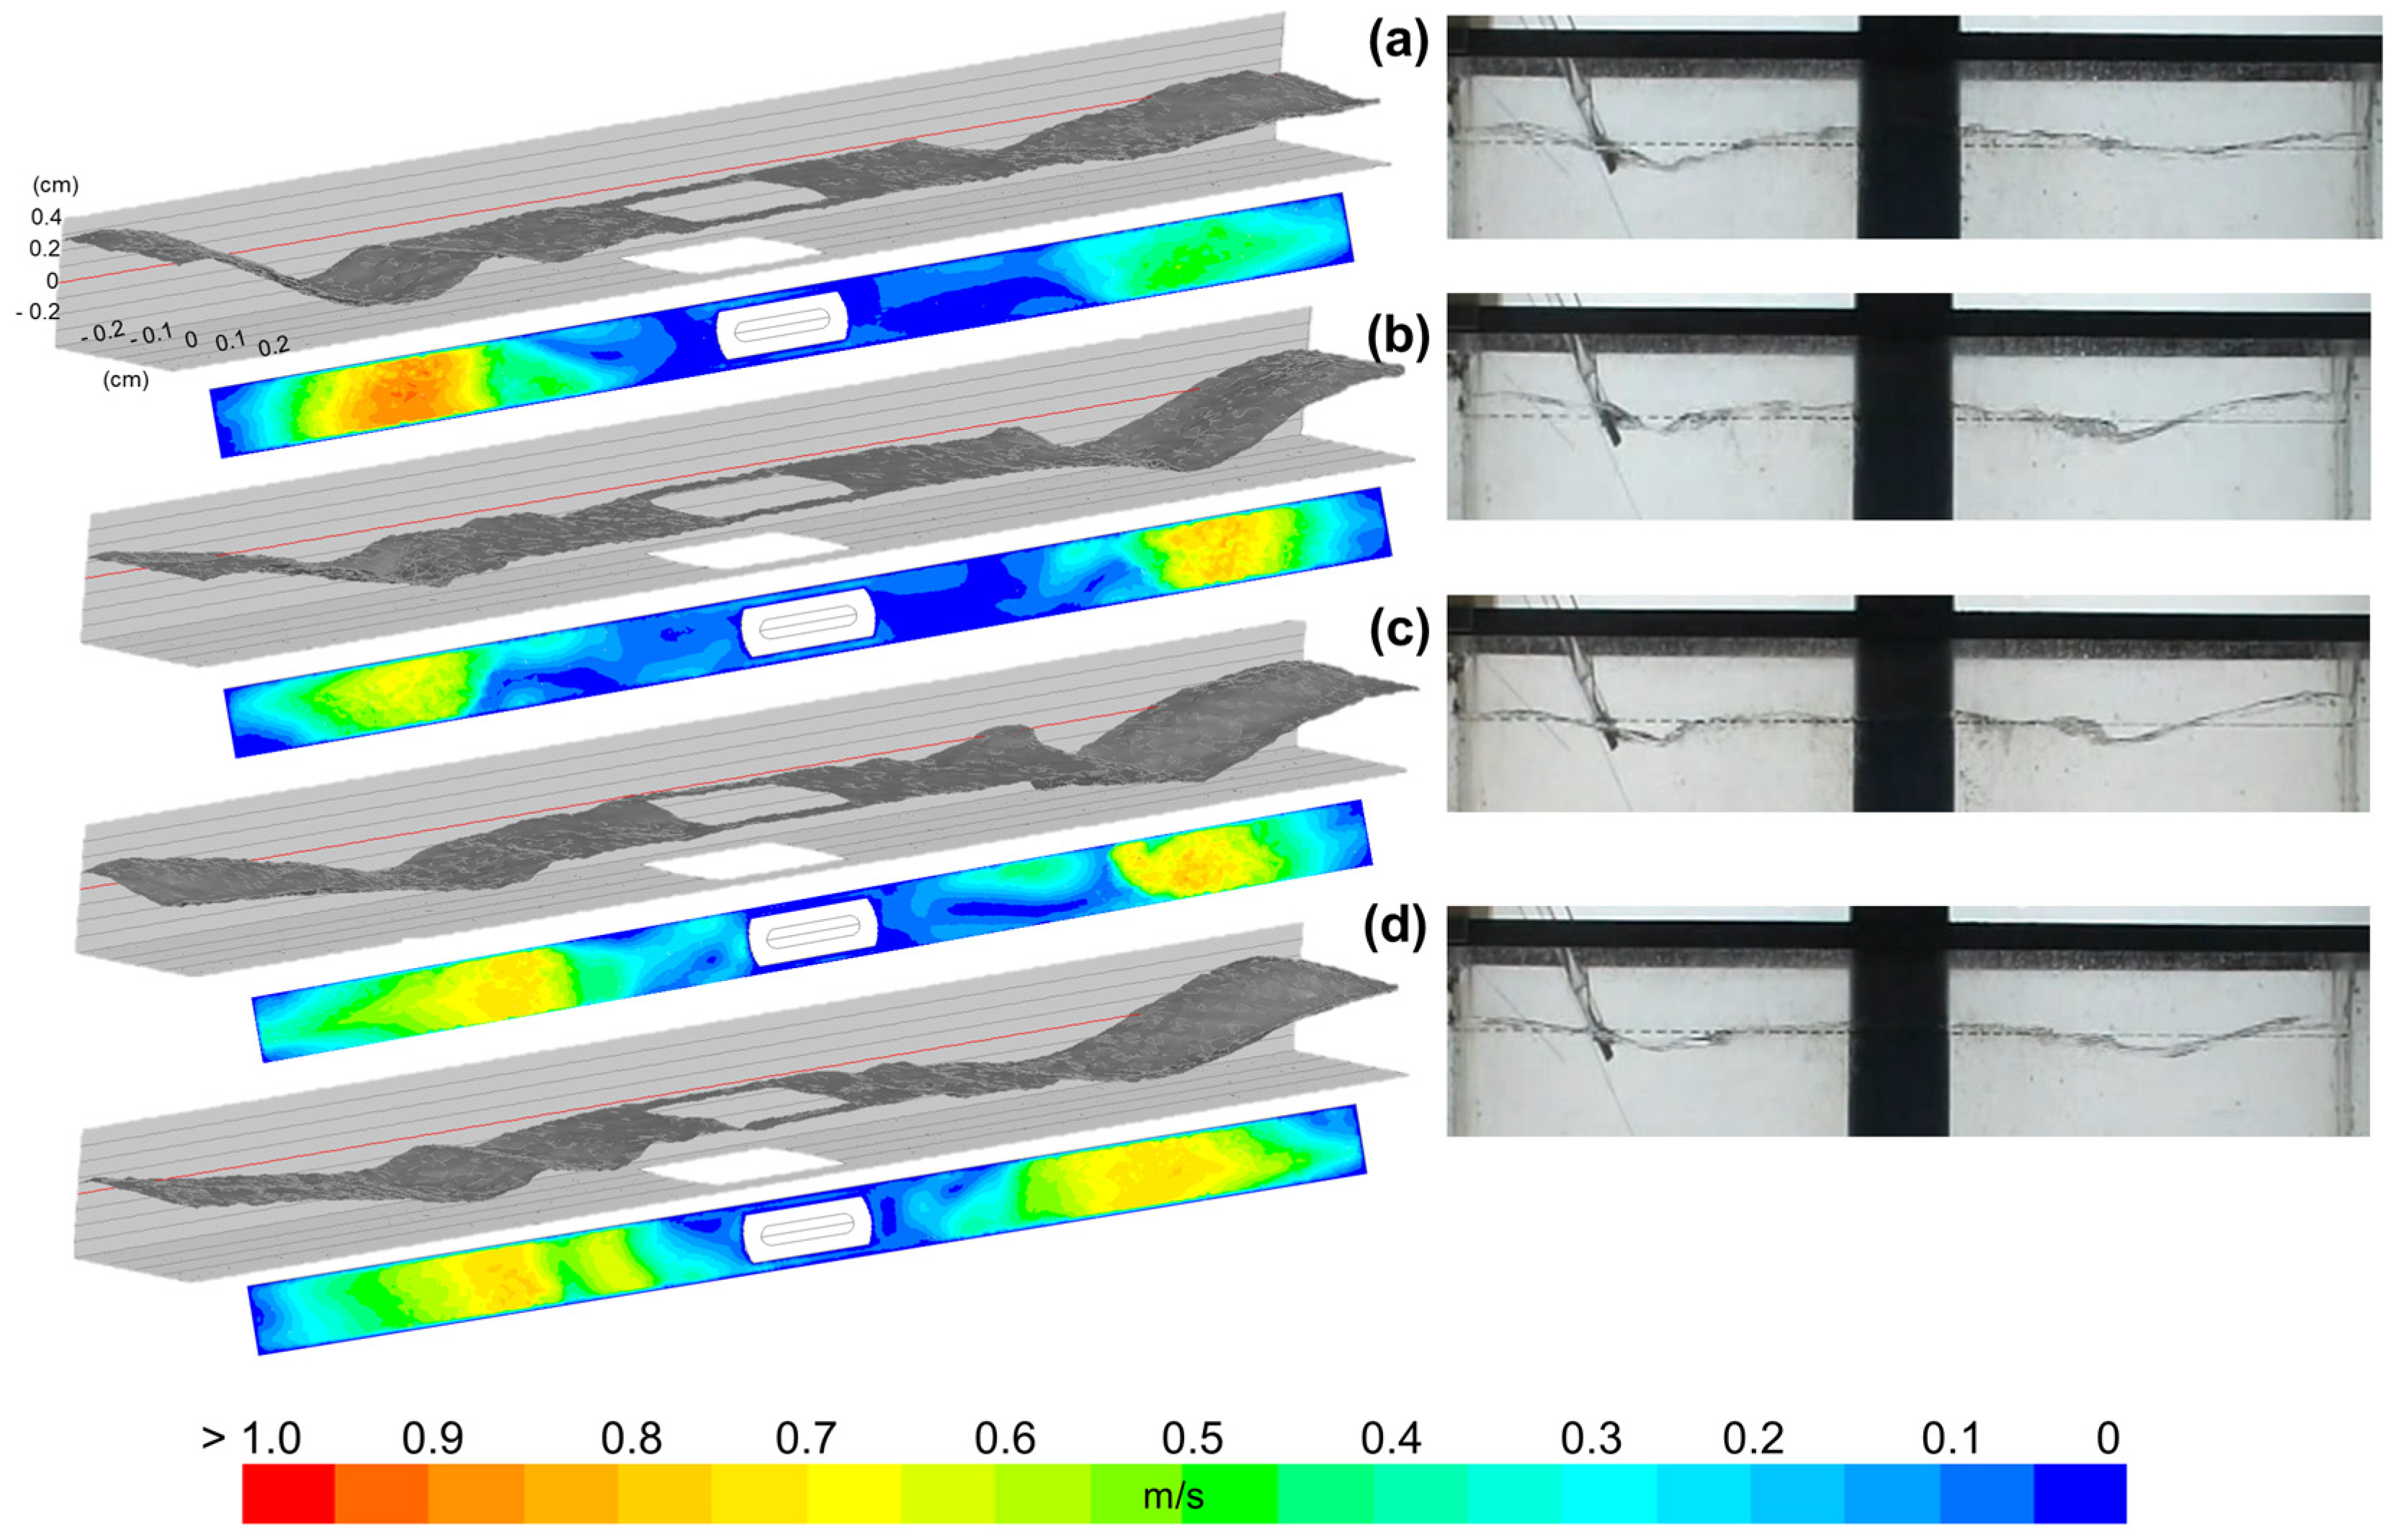
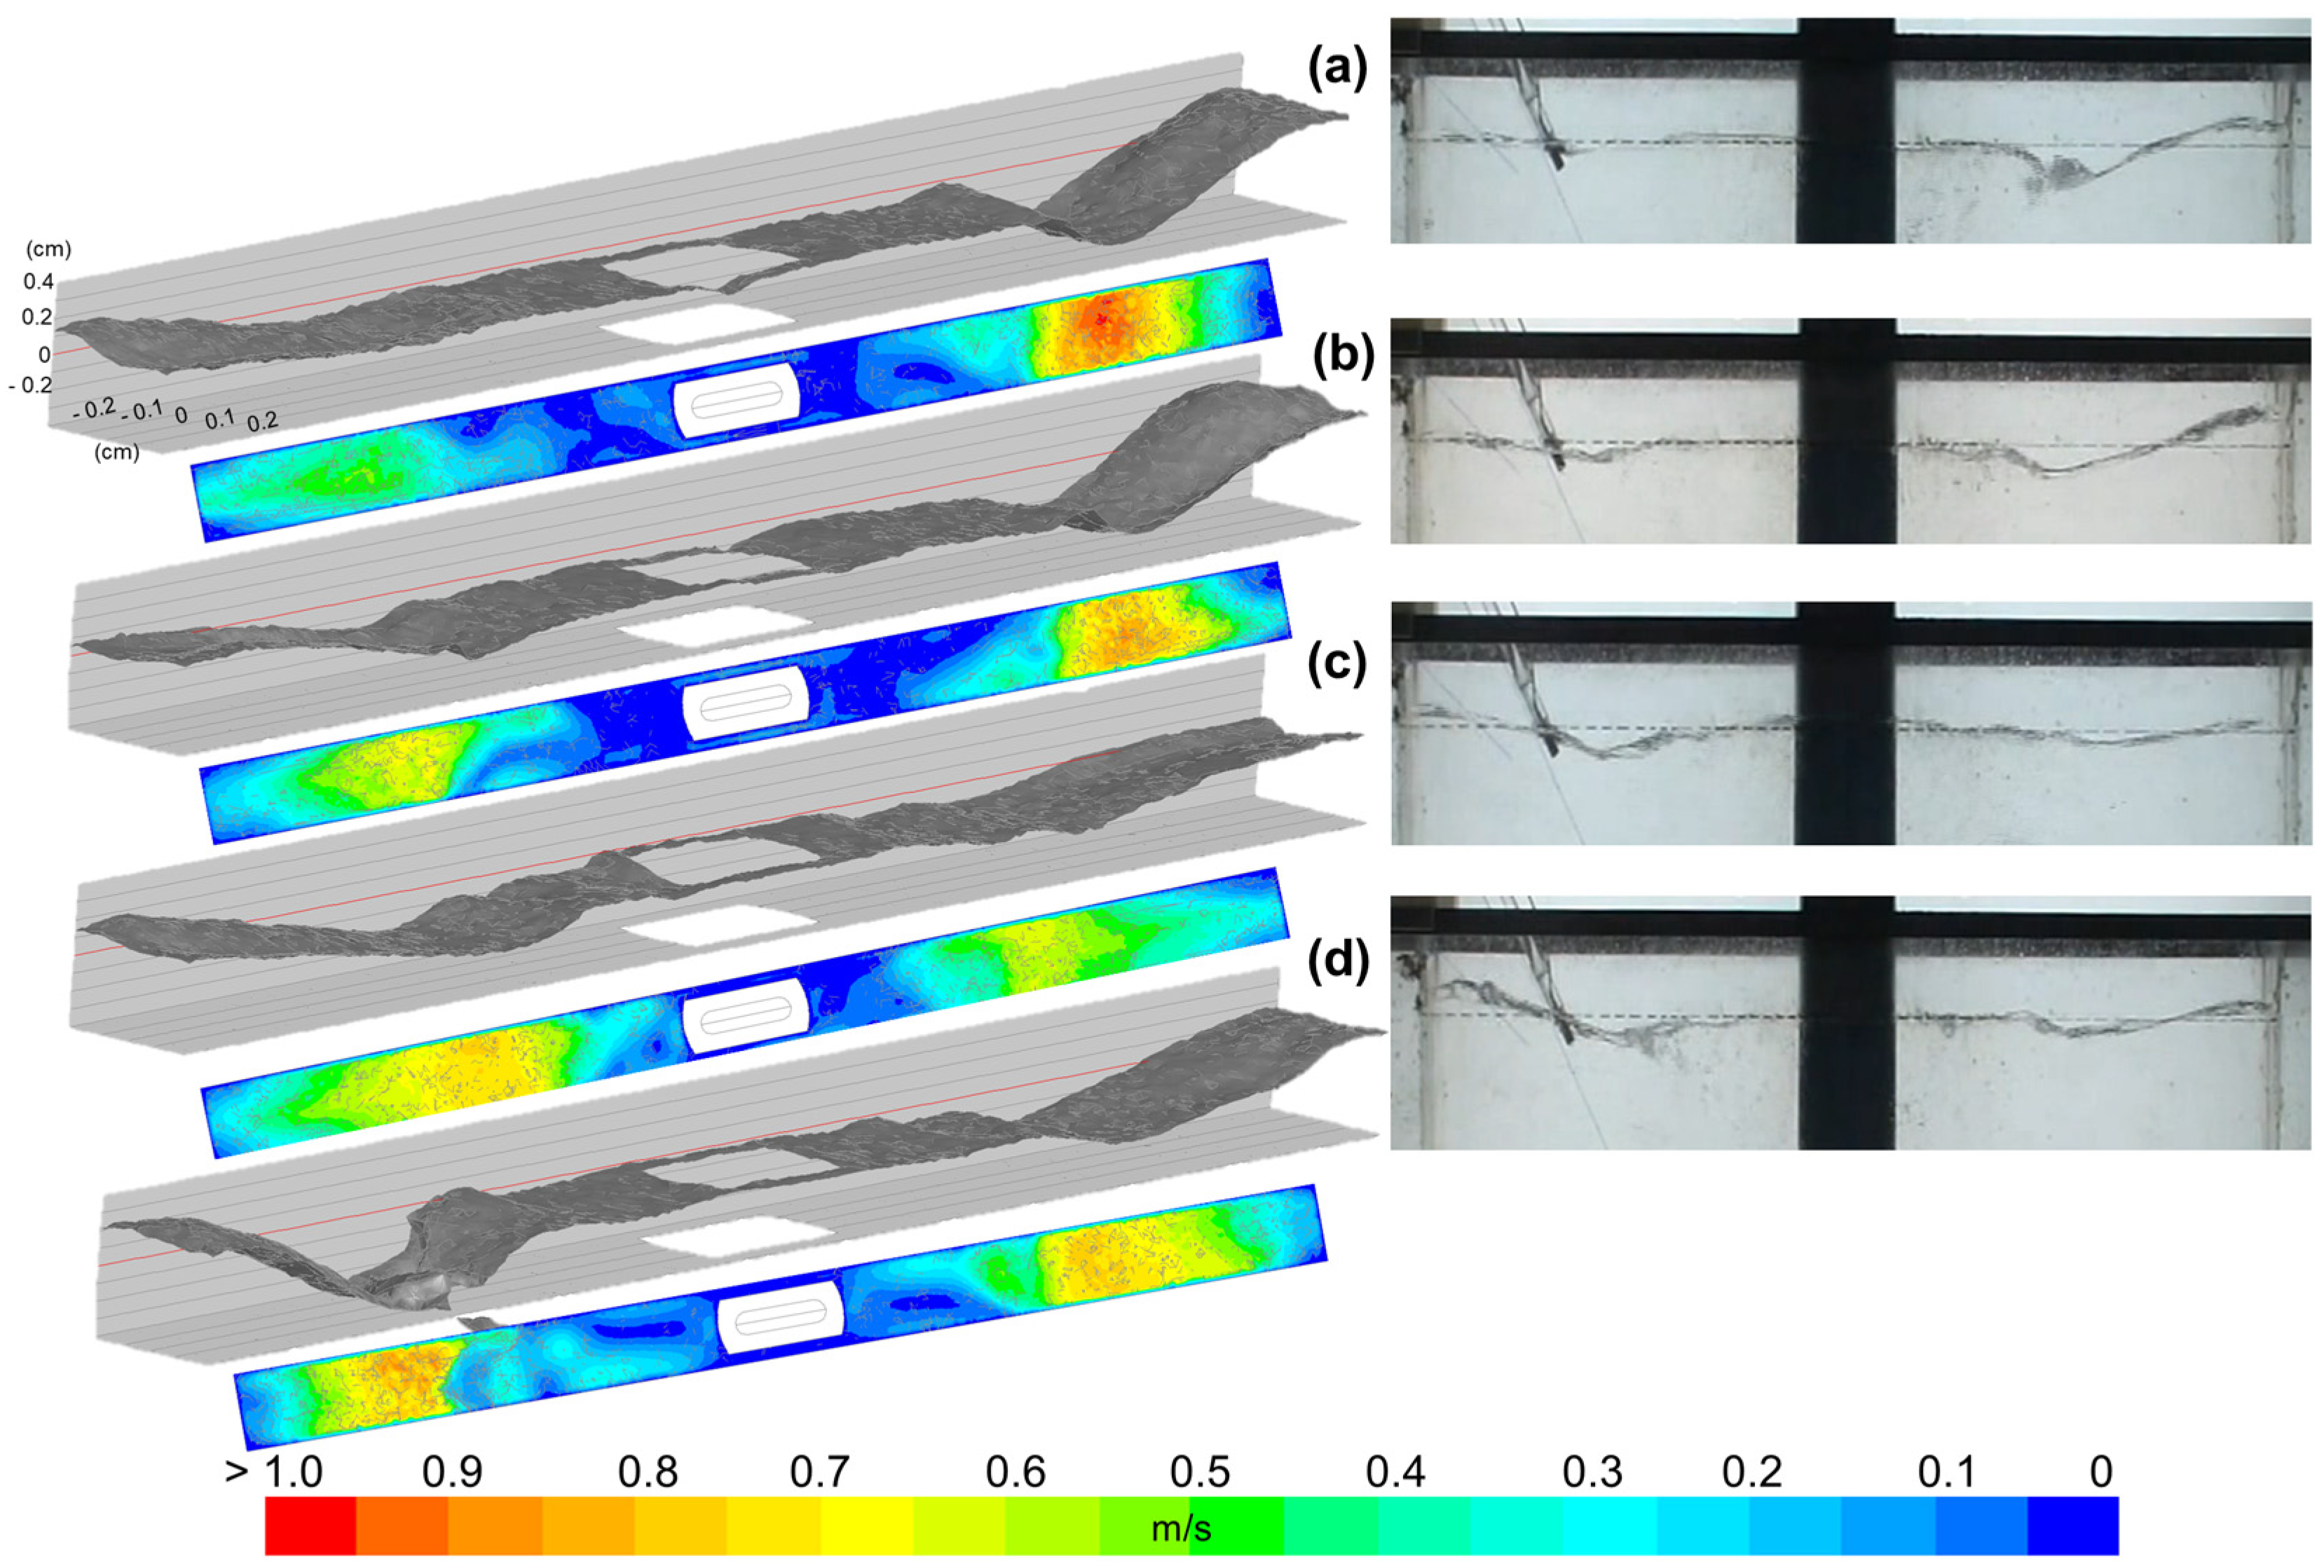
The final step of this research, after the fluid dynamic analysis within the mold, is to determine how the deformation of the meniscus evolves over the transient period under study. To achieve this, three sources of information were examined, namely, an iso-surface of the meniscus to develop its deformation magnitude, velocity contours calculated on the iso-surface, and images of the bath level oscillation taken from the physical model. Figure 12 and Figure 13 show the results for the SEN at the deep immersion, and Figure 14 and Figure 15 show the results for the SEN at the shallow immersion. These variables were obtained at the same times considered in the previous section to establish their relationship.
The figures present the results of the specified variables for both SEN immersions and the selected periods. However, some information applies to all of them. The meniscus level is the reference point with a zero value; any deformation that rises above this level is classified as positive deformation, while any deformation that is a depression below this position is categorized as negative deformation. The main positive deformations occur near the narrow mold walls, whereas the significant negative deformations are observed approximately at the half-distance between the narrow mold walls and the SEN wall. The positive meniscus deformations occur when upward stream flows push the meniscus upward near the narrow mold walls. The negative meniscus deformations result from these upward stream flows when they turn towards the SEN walls, creating a descending pattern that arises from the positive meniscus deformation. The higher flow velocities in the meniscus are always in the position of the negative deformations.
The phenomenon of meniscus dynamic distortion (MDD) is indeed present and occurs as follows. Initially, the meniscus remains relatively stable without deformations greater than 5 mm. Then, positive deformations begin to occur and increase rapidly in magnitude, while negative deformations also develop, increasing their magnitude at the same rate as the positive ones. Finally, the meniscus regains stability. This phenomenon was observed in both SEN immersions during the specified periods indicated in the figures. When the SEN is in deep immersion, during the first analyzed period (Figure 12), MDD is observed just on the left meniscus side because the upward streams on the right side do not have enough intensity to generate it. In contrast, during the second analyzed period (Figure 13), MDD occurs on both sides of the meniscus, as the effects of the upward streams are acting strongly on both mold sides. When the SEN is in shallow immersion, MDD is observed on both sides of the meniscus during the two periods analyzed (see Figure 14 and Figure 15), with a difference only in its intensity.
At this point, the observations made about the MDD phenomenon have been of a qualitative nature, and although the results between the two models clearly agree, it is necessary to support the findings of both models with quantitative comparisons. To achieve this, the MDD phenomenon was analyzed in both models, quantifying its frequency of occurrence and its median lifecycle ranges. These quantifications were performed over the entire 60 s period for both SEN immersions. The frequency of occurrence was calculated by determining the number of times the HDD was detected, and then this number was divided by the size of the analyzed period. The physical and mathematical results obtained indicate that the MDD phenomenon occurs at a frequency of 0.083 Hz, regardless of the SEN immersion. In addition, the MDD frequency was characterized by non-constant periodicity, as different median lifecycle ranges were obtained. In the deep immersion, the MDD median lifecycle ranges from 8 to 12 s, while in the shallow immersion, it ranges from 10 to 15 s.
As part of the phenomenon characterization, the amplitude of the meniscus deformation was measured for the physical model and calculated for the mathematical model. To obtain this information, the maximum positive meniscus deformation and the minimum meniscus depression were tracked along both mold sides without establishing a fixed measurement point; instead, the values were tracked regardless of their position. These values were acquired again over the entire 60 s period for both SEN immersions. Later, a single average amplitude of the meniscus deformation was calculated for each mold side, and the results are summarized in Table 2. The first observation is that the measured and calculated values have a good agreement between the two models, supporting the qualitative similarity observed in the results shown in Figure 12, Figure 13, Figure 14 and Figure 15. From the results, it is noted that the meniscus exhibits severe deformations, with mean positive deformations reaching up to 35 mm when the SEN is in a shallow position, and mean negative maximum deformations of up to −38 mm, despite the SEN immersion. These results illustrate how negative the presence of the MDD phenomenon can be.
Contrasting these results with the literature, the MDD phenomenon has been barely studied; just a few works have reported its presence with smaller values of its frequency of occurrence from 0.016 Hz [3,4] to 0.05 Hz [8,9,36], even when the employed SEN in all cases is a bifurcate design and the presence of interaction between the jets is present, with or without dynamic distortion of the jets detected. This confirms that the MDD origin is not only due to an imbalance of energy generated by the jets. Nevertheless, the meniscus stability has been analyzed more from the perspective of its level of fluctuation; in that sense, the reported values are considerable different, varying from 3.5 mm to 40 mm, with a dependency on many variables, such as the mold width, SEN immersion, casting velocity, mold thickness, funnel mold shape, and ports SEN design [3,4,8,9,10,14,19,20,21,36]. Such deformations occur even when MDD is not present in most cases. In comparison with this range of meniscus fluctuation, the current values are close to the higher values mentioned. However, it is essential to note that the highest reported values were observed for casting velocities exceeding 6 m/min, which is almost double the current casting velocity of 3.62 m/min, further underscoring the detrimental impact of the MDD phenomenon when it occurs.
The last variable analyzed was the average maximum velocity magnitude calculated mathematically in the meniscus. This variable is crucial since it provides information on the possibility of the slag dragging if it had been considered. It was calculated during the meniscus stability period and during the occurrence of MDD. The average values were 0.54 m/s and 1.03 m/s, respectively, regardless of the SEN immersion and the meniscus side. Evidently, both average maximum velocities are higher than the calculated critical velocity difference of 0.518 m/s. Nevertheless, with the first value, there is no fluid dynamic evidence to suggest the possibility of slag dragging since this velocity is mainly tangential to the meniscus surface. In contrast, the second value nearly doubles the reference value in terms of fluid velocities, and, additionally, the flow that forms the meniscus in that zone moves in a descending direction. These two characteristics induce the drag of small air bubbles into the bath consecutively. Therefore, if the slag phase had been present, it would undoubtedly have been dragged.

3.5. Future Work

The results presented in this work have shown that the meniscus in this medium slab mold is considerably turbulent, with intense meniscus deformation capable of dragging air bubbles into the bath as a consequence. Consequently, this turbulent meniscus undoubtedly will induce problems in mold slag stability, such as zones of slag aperture and slag entrapment induced by vortex suction or by the dragging effect of the tangential velocities that follow the meniscus movement. These phenomena are considerably detrimental in any mold and represent the next step in studying this medium slab mold, where their presence will be confirmed and quantified.

4. Conclusions

The medium slab mold shares flow patterns common to both conventional slab molds and funnel thin slab molds, making its fluid dynamics more complex and difficult to predict. This latter observation is particularly important in relation to the meniscus, which exhibited unstable behavior characterized by significant surface oscillations, variations in velocity, and both positive and negative high deformations.
The dynamic distortion phenomenon, which is very common in funnel thin slab molds, is not present in the medium slab mold, despite its small width and the use of a bifurcated SEN. The main reason is that the jets do not directly interact with each other because they move preferentially towards the narrow mold walls. Instead, the mass flow rate variations between the SEN ports induce upward stream flows with very high and oscillating velocities.
The origin of the meniscus dynamic distortion comes not only from the imbalance of turbulent kinetic energy generated by the dynamic distortion phenomenon of the jets, which is absent in the current case, but also arises from the instability and high velocities of the upward stream flows near the narrow mold walls. This generates mean positive deformations up to 35 mm when the SEN is in a shallow position and mean negative maximum deformations of up to −38 mm regardless of the SEN immersion.
The occurrence frequency of the MDD phenomenon is not affected by SEN immersion and variations in mass flow rate at the SEN ports, keeping a value of 0.083 Hz; however, these factors do impact its median lifecycle range, with a range from 8 to 12 s for the deep immersion and from 10 to 15 s for the shallow immersion, being valued considerably high for a casting velocity of 3.62 m/min.

Author Contributions

Conceptualization, S.G.-H., R.M.D., and E.G.; methodology, E.D.T.-C. and S.G.-H.; software, E.D.T.-C. and S.G.-H.; validation, E.D.T.-C. and R.M.D.; formal analysis, S.G.-H. and E.G.; investigation, E.D.T.-C., S.G.-H., and E.G.; resources; data curation, E.D.T.-C. and R.S.-C.; writing—original draft preparation, S.G.-H.; writing—review and editing, S.G.-H. and E.G.; visualization, E.D.T.-C. and R.M.D.; supervision, S.G.-H. and J.d.J.B.; project administration, S.G.-H.; funding acquisition. All authors have read and agreed to the published version of the manuscript.

Funding

This research received no external funding.

Data Availability Statement

The original contribution presented in this study is included in this article. Further inquiries can be directed to the corresponding author.

Acknowledgments

The authors thank TecNM-Instituto Tecnologico de Morelia and SNII for their permanent support of the Academic Research Group on Simulation of Materials Processing and Fluid Dynamics. The authors thank the Secretaria de Ciencias, Humanidades, Tecnología e Inovación (SECIHTI) and Program for the Professional Development of Teachers (PRODEP) for their continuous support.

Conflicts of Interest

The authors declare no conflicts of interest.

Abbreviations

The following abbreviations are used in this manuscript:
DDDynamic Distortion
MDDMeniscus Dynamic Distortion
VOFVolume of Fluid
SENSubmerged Entry Nozzle
KHIKelvin–Helmholtz instability

References

  1. Li, X.; Li, B.; Liu, Z.; Niu, R.; Liu, Y.; Zhao, C.; Huang, C.; Qiao, H.; Yuan, T. Large Eddy Simulation of Multi-phase flow and slag Entrapment in a Continuous Casting Mold. Metals 2019, 9, 7. [Google Scholar] [CrossRef]
  2. Liu, Z.; Li, B.; Tsukihashi, F. Instability and Periodicity of Asymmetrical Flow in a Funnel Thin Slab Casting Mold. ISIJ Inter. 2015, 55, 805–813. [Google Scholar] [CrossRef]
  3. Morales, R.D.; Garcia-Hernandez, S. Turbulent instabilities in a thin slab mold. In TMS, Jim Evans Honorary Symposium; Wiley: Hoboken, NJ, USA, 2010; pp. 87–94. [Google Scholar]
  4. Torres-Alonso, E.; Morales, R.D.; Garcia-Hernandez, S.; Palafox-Ramos, J. Cyclic Turbulent Instabilities in a Thin Slab Mold. Part I: Physical Model. Metall. Mater. Trans. B 2010, 41B, 583–597. [Google Scholar] [CrossRef]
  5. Torres-Alonso, E.; Morales, R.D.; Garcia-Hernandez, S. Cyclic Turbulent Instabilities in a Thin Slab Mold. Part II: Mathematical Model. Metall. Mater. Trans. B 2010, 41B, 675–690. [Google Scholar] [CrossRef]
  6. Torres-Alonso, E.; Morales, R.D.; Demedices, L.G.; Najera, A.; Palafox-Ramos, J. Flow Dynamics in Thin Slab Molds Driven by Sustainable Oscillating Jets from the Feeding SEN. ISIJ Inter. 2007, 47, 679–688. [Google Scholar] [CrossRef]
  7. Park, H.S.; Nam, H.; Yoon, J.K. Numerical Analysis of Fluid Flow and Heat Transfer in the Parallel Type Mold of a Thin Slab Caster. ISIJ Inter. 2001, 41, 974–980. [Google Scholar] [CrossRef]
  8. Shen, B.Z.; Shen, H.F.; Liu, B.C. Water Modelling of Level Fluctuation in thin Slab Continuous Casting Mould. Ironmak. Steelmak. 2009, 36, 33–38. [Google Scholar] [CrossRef]
  9. Shen, B.; Shen, H.; Liu, B. Instability of Fluid Flow and Level Fluctuation in Continuous Thin Slab Casting Mould. ISIJ Inter. 2007, 47, 427–432. [Google Scholar] [CrossRef]
  10. Hajari, A.; Meratian, M. Surface Turbulence in a Physical Model of a Steel Thin Slab Continuous Caster. Int. J. Miner. Metall. Mater. 2010, 17, 697–703. [Google Scholar] [CrossRef]
  11. Jeon, Y.J.; Sung, H.J.; Lee, S. Flow Oscillations and Meniscus Fluctuations in a Funnel-Type Water Mold Model. Metall. Mater. Trans. B 2010, 41B, 121–130. [Google Scholar] [CrossRef]
  12. Morales, R.D.; Tang, Y.; Nitzl, G.; Eglsaeer, C.; Hackl, G. Design of a Submerged Entry Nozzle for Thin Slab Molds Operating at High Casting Speeds. ISIJ Inter. 2012, 52, 1607–1615. [Google Scholar] [CrossRef]
  13. Xiao, P.; Wang, R.; Zhu, L.; Chen, C. Influence of Submerged Entry Nozzle Offset on the Flow Field in a Continuous Casting Mold. Metals 2025, 15, 575. [Google Scholar] [CrossRef]
  14. Garcia-Hernandez, S.; Gonzalez-Guzman, C.H.; Morales, R.D.; Barreto, J. de J.; Gutierrez, E.; Calderon-Ramos, I. Modeling Study of EMBr Effects on the Detrimental Dynamic Distortion Phenomenon in a Funnel Thin Slab Mold. Crystals 2020, 10, 958. [Google Scholar] [CrossRef]
  15. Wang, C.; Liu, Z.; Li, B. Combined Effects of EMBr and SEMS on Melt Flow and Solidification in a Thin Slab Continuous Caster. Metals 2021, 11, 948. [Google Scholar] [CrossRef]
  16. Vakhrushev, A.; Kharicha, A.; Karimi-Sibaki, E.; Wu, M.; Ludwig, A.; Nitzl, G.; Hackl, G.; Watzinger, J. Modeling Asymmetric Flow in the Thin-Slab Casting Mold Under Electromagnetic Brake. Steel Res. Inter. 2022, 93, 2200088. [Google Scholar] [CrossRef]
  17. Vakhrushev, A.; Kharicha, A.; Liu, Z.; Wu, M.; Ludwig, A.; Nitzl, G.; Tang, Y.; Hackl, G.; Watzinger, J. Optimizing the Flow Conditions in the Thin-Slab Casting Mold Using Electromagnetic Brake. In Proceedings of the 8th International Conference on Modeling and Simulation of Metallurgical Processes in Steelmaking, Toronto, ON, Canada, 13–15 August 2019; pp. 615–619. [Google Scholar] [CrossRef]
  18. Gutierrez-Montiel, Y.S.; Morales, R.D. Control of Meniscus Stability in Medium Thickness-straight Walls Slab Mould. ISIJ Inter. 2013, 53, 230–239. [Google Scholar] [CrossRef]
  19. Xuan, M.; Chen, M. Optimal Design of the Submerged Entry Nozzle for Thin Slab Continuous Casting Molds. Metals 2021, 11, 1223. [Google Scholar] [CrossRef]
  20. Hai-qi, Y.; Miao-Yong, Z.; Jun, W. Interfacial Fluctuation Behavior of Steel/Slag in a Medium-Thin Slab Continuous Mold With Argon Gas Injection. J. Iron Steel Res. Int. 2010, 17, 5–11. [Google Scholar] [CrossRef]
  21. Zhao, H.; Wang, X.; Zhang, J.; Wang, W. Effect of SEN Structure on the Mold Level Fluctuation and Heat Transfer for a Medium Thin Slab Caster. Metallurgy 2008, 15, 120–124. [Google Scholar] [CrossRef]
  22. Pope, S.B. Turbulent Flows; Cambridge University Press: London, UK, 2000; p. 358. [Google Scholar]
  23. Poirier, D.R.; Geiger, G.H. Transport Phenomena in Materials Processing; Springer: Cham, Switzerland, 1994; p. 39. [Google Scholar]
  24. ANSYS Inc. FLUENT 12.0, User’s Guide; Centerra Resource Park: Cavendish Court, Lebanon, 2009. [Google Scholar]
  25. Launder, B.E.; Spalding, D.B. The numerical computation of turbulent flows. Comp. Meth Appl. Mech. Eng. 1974, 3, 269–289. [Google Scholar] [CrossRef]
  26. Hirt, C.W.; Nichols, B.D. Volume of fluid (VOF) method for the dynamics of free boundaries. J. Comp. Phys. 1981, 39, 201–225. [Google Scholar] [CrossRef]
  27. Liovic, P.; Liow, J.L.; Rudman, M.A. Volume of Fluid (VOF) Method for the Simulation of Metallurgical Flows. ISIJ Int. 2001, 41, 225–233. [Google Scholar] [CrossRef]
  28. Barati, H.; Wu, M.; Kharicha, A.; Ludwig, A. Role of Solidification in Submerged Entry Nozzle Clogging during Continuous Casting of Steel. Steel Res. Int. 2020, 91, 2000230. [Google Scholar] [CrossRef]
  29. Lee, W.; Kim, J.G.; Jung, J.; Huh, K.Y. Prediction of Nozzle Clogging through Fluid–Structure Interaction in the Continuous Steel Casting Process. Steel Res. Inter. 2021, 92, 2000549. [Google Scholar] [CrossRef]
  30. Bai, H.; Ni, P.; Ersson, M.; Zhang, T.; Jönsson, P.G. Effect of swirling flow tundish submerged entry nozzle outlet design on multiphase flow and heat transfer in mould. Ironmak. Steelmak. 2019, 46, 911–920. [Google Scholar] [CrossRef]
  31. Xu, L.; Pei, Q.-W.; Han, Z.-F.; Yang, S.; Wang, J.-Y.; Yao, Y.-T. Modeling study on melt flow, heat transfer, and inclusion motion in the funnel-shaped molds for two thin-slab casters. Processes 2022, 10, 2738. [Google Scholar] [CrossRef]
  32. Hibbeler, L.C.; Thomas, B.G. Mold slag entrainment mechanisms in continuous casting molds. Iron Steel Technol. 2013, 10, 121–136. [Google Scholar]
  33. Lopez, A.; Gutierrez, E.; Garcia-Hernandez, S.; Morales, R.D.; Barreto, J.d.J. A Numerical Analysis of the Fluid Flow in a Slab Mold Considering a SEN with Real Clogging and with Symmetrical Reductions. Crystals 2025, 15, 777. [Google Scholar] [CrossRef]
  34. Ramos-Cardona, E.; Calderon-Ramos, I.; Morales, R.D.; Servin-Castañeda, R.; Perez-Alvarado, A.; Arreola-Villa, S.A.; Mendez-Gordillo, A.R.; Garcia-Hernandez, S. Internal SEN Design and Its Influence on Fluid Dynamics in Slab Molds: A Combined Numerical and Experimental Analysis. Metals 2025, 15, 1043. [Google Scholar] [CrossRef]
  35. Liu, J.Q.; Yang, J.; Ma, C.; Guo, Y.; He, W.Y.; Zhao, C.L.; Jiang, R.B.; Guo, Y.T. Effect of mold width on flow field in a slab continuous-casting mold with high-temperature velocity measurement and numerical simulation. Metals 2021, 11, 1943. [Google Scholar] [CrossRef]
  36. Wang, X.H.; Wang, X.H.; Zhang, J.M.; Jing, C.L. Water modeling study on the meniscus dynamic distortion of molten steel level in a CSP thin slab casting mould. J. Univ. Sci. Technol. Beijing 2009, 31, 234–239. [Google Scholar] [CrossRef]
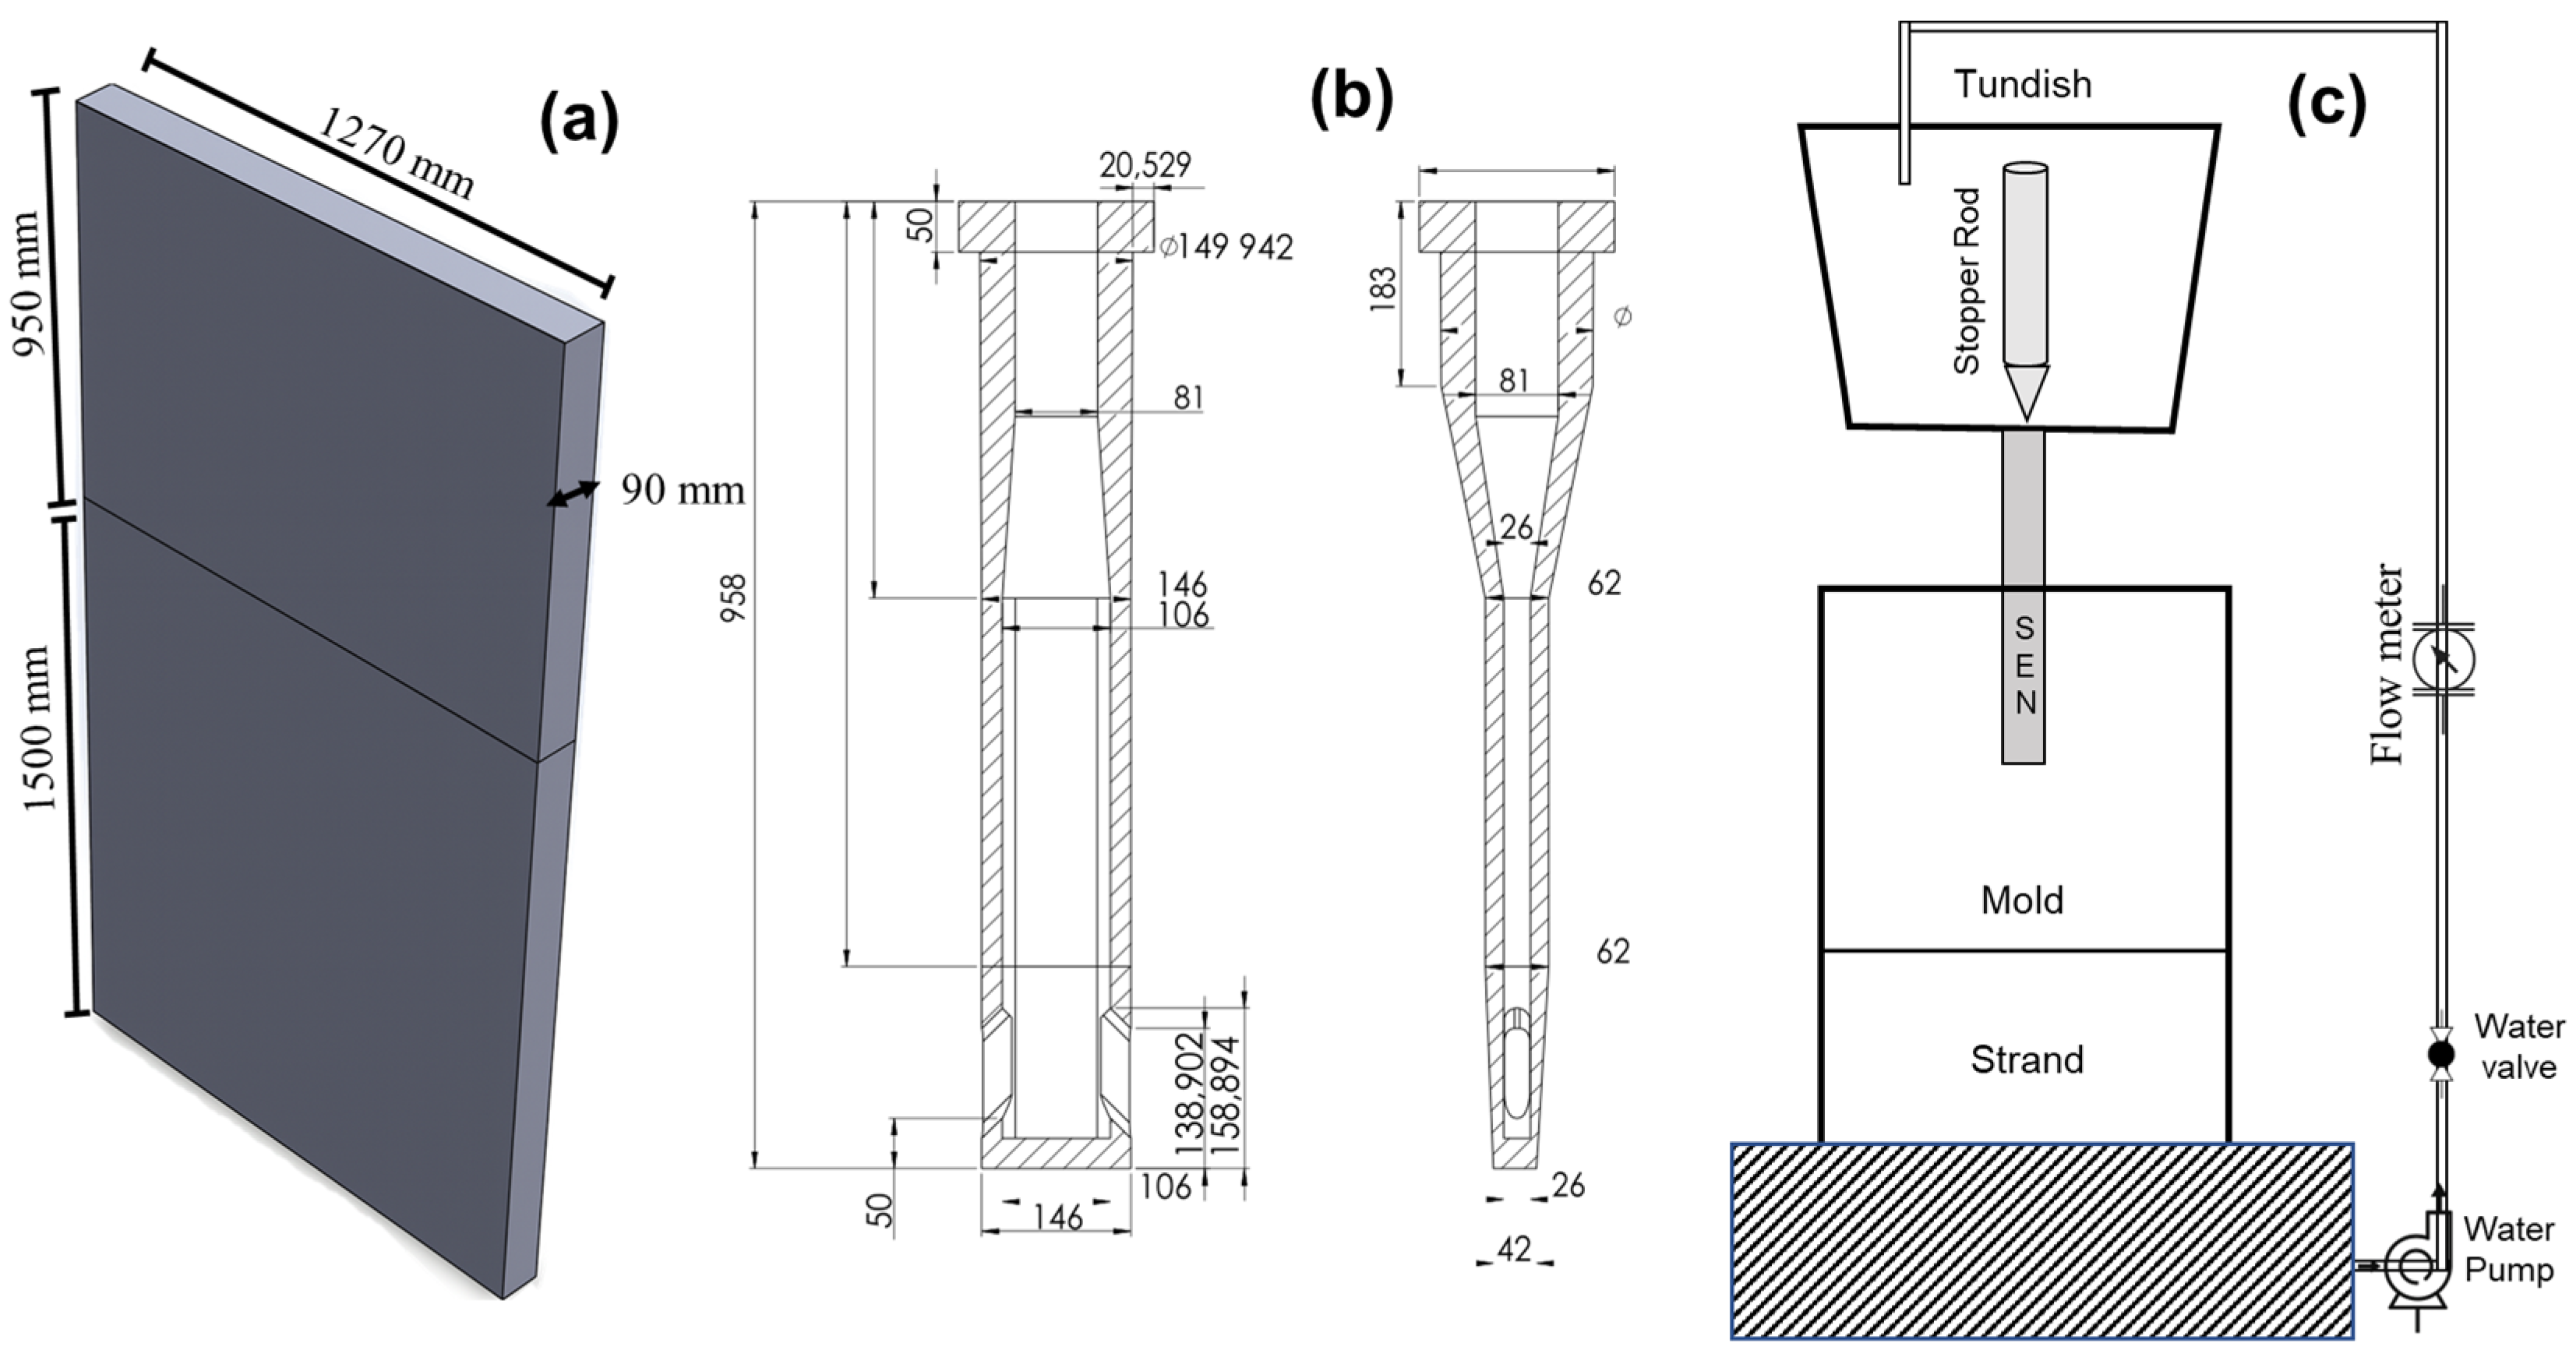
Figure 1. Geometric characteristics of the (a) mold and (b) SEN. (c) Schematic of the physical model.
Processes 13 03425 g001
Figure 2. Computational grid: (a) mold and (b) close-up of the SEN.
Processes 13 03425 g002
Figure 3. Tracer behavior when the SEN is in the deep position for (ad) physical modeling and (eh) mathematical modeling. The arrows illustrate the flow trajectory. The boxes are to center the video camera.
Processes 13 03425 g003
Figure 4. Tracer behavior when the SEN is in the shallow position for (ad) physical modeling and (eh) mathematical modeling. The arrows illustrate the flow trajectory. The boxes are to center the video camera.
Processes 13 03425 g004
Figure 5. (a,b) Velocity vector fields at the central symmetrical plane of the mold, and (c,d) velocity magnitude calculated along a vertical line in the center of narrow mold faces, for both SEN immersions. In this figure, the mold top begins at a mold depth of zero, and the negative values indicate a down position.
Processes 13 03425 g005
Figure 6. (a,b) Velocity magnitude along a line in the center meniscus and (c,d) iso-surface of the meniscus fluctuation and contours of velocity at the meniscus for both SEN immersions.
Processes 13 03425 g006
Figure 7. Mass flow rate delivered for each monitored port of the SEN during 60 s: (a) the SEN at the deep position and (b) the SEN at the shallow position.
Processes 13 03425 g007
Figure 8. Velocity vector profiles at the longitudinal center plane of the mold for different times, with the SEN at the deep position—first period observed, (a) 185 s, (b) 190 s, (c) 195 s, and (d) 200 s.
Processes 13 03425 g008
Figure 9. Velocity vector profiles at the longitudinal center plane of the mold for different times, with the SEN at the deep position—second period observed, (a) 205 s, (b) 210 s, (c) 215 s, and (d) 220 s.
Processes 13 03425 g009
Figure 10. Velocity vector profiles at the longitudinal center plane of the mold for different times, the SEN at the shallow position—first period observed, (a) 185 s, (b) 190 s, (c) 195 s, and (d) 200 s.
Processes 13 03425 g010
Figure 11. Velocity vector profiles at the longitudinal center plane of the mold for different times, with the SEN at the shallow position—second period observed, (a) 205 s, (b) 210 s, (c) 215 s, and (d) 220 s.
Processes 13 03425 g011
Figure 12. Iso-surface of the meniscus, velocity contours calculated on the iso-surface, and images of the meniscus deformation during the physical modeling, with the SEN at the deep position—first period observed, (a) 205 s, (b) 210 s, (c) 215 s, and (d) 220 s.
Processes 13 03425 g012
Figure 13. Iso-surface of the meniscus, velocity contours calculated on the iso-surface, and images of the meniscus deformation during the physical modeling, with the SEN at the deep position—second period observed, (a) 205 s, (b) 210 s, (c) 215 s, and (d) 220 s.
Processes 13 03425 g013
Figure 14. Iso-surface of the meniscus, velocity contours calculated on the iso-surface, and image of the meniscus deformation during the physical modeling, with the SEN at the shallow position—first period observed, (a) 205 s, (b) 210 s, (c) 215 s, and (d) 220 s.
Processes 13 03425 g014
Figure 15. Iso-surface of the meniscus, velocity contours calculated on the iso-surface, and image of the meniscus deformation during the physical modeling, with the SEN at the shallow position—second period observed, (a) 205 s, (b) 210 s, (c) 215 s, and (d) 220 s.
Processes 13 03425 g015
Table 1. Physical properties and casting parameters.
PhaseParameterValue
Air [14]Density (kg/m3)1.225
Viscosity (kg/m·s)1.7894 × 10−5
Steel [14]Density (kg/m3)7100
Viscosity (kg/m·s)0.0064
Air–Steel [14]Interphase tension (N/m)1.6
SEN
Position *
Deep (mm)396
Shallow (mm)245
Casting velocity ** (m/min)3.62
Thickness of the air phase ** (mm)50
* Measured values from the meniscus to the SEN tip. ** Specific to the current research.
Table 2. Average amplitudes of the meniscus deformations.
SEN ImmersionMeniscus SideMeniscus DeformationMathematical ModelPhysical Model
Deep LeftMax (mm)3029
Min (mm)−38−33
RightMax (mm)3128
Min (mm)−30−27
Shallow LeftMax (mm)3034
Min (mm)−35−38
Right Max (mm)3235
Min (mm)−29−29
Disclaimer/Publisher’s Note: The statements, opinions and data contained in all publications are solely those of the individual author(s) and contributor(s) and not of MDPI and/or the editor(s). MDPI and/or the editor(s) disclaim responsibility for any injury to people or property resulting from any ideas, methods, instructions or products referred to in the content.