Abstract
La3+/Bi3+ co-doped BaTiO3 ceramics were synthesized via ball milling followed by heat treatment at 1200 °C according to the Ba1−3xLa2xTi1−3xBi4xO3 formula, with dopant levels ranging from x = 0.0 to 0.006. X-ray diffraction and Rietveld refinement confirmed a ferroelectric tetragonal phase for all compositions, with the highest tetragonality (c/a = 1.009) observed for x = 0.001 exceeding that of pure BaTiO3 (1.0083). High-resolution electron microscopy analysis revealed faceted particles with mean sizes between 362.5 nm and 488.3 nm. Low-doped samples (x = 0.001 and 0.002) exhibited higher permittivity than undoped BaTiO3, with the maximum dielectric constant (εr = 2469.0 at room temperature and 7499.7 at the Curie temperature) recorded for x = 0.001 at 1 kHz. At x = 0.006, minimal permittivity variation indicated a stable dielectric response. A decrease in the Curie temperature was observed with increasing doping levels, indicating a progressive tendency toward the cubic phase. Critical exponent γ values (0.94–1.56) indicated a sharp phase transition for low-doped samples and a diffuse transition for highly doped BaTiO3. These results showed that La3+/Bi3+ co-doping effectively tunes the structural and dielectric properties of BaTiO3 ceramics.
1. Introduction
Tetragonal barium titanate (BaTiO3) is a ferroelectric perovskite and one of the most significant ceramic materials in electronic applications. At ambient conditions, BaTiO3 exhibits a tetragonal structure, which transitions to a cubic phase at approximately 120 °C. This transformation has been extensively investigated due to its connection with the change from ferroelectric to paraelectric behavior [1,2,3,4]. The crystal structure of BaTiO3 plays a critical role in determining its electrical properties. Notably, the substantial dielectric constant exhibited by BaTiO3 correlates directly with the degree of tetragonal distortion in its crystal structure [5,6].
The ferroelectric properties of BaTiO3 allow it to sustain a stable electric polarization, which can be reversed by an external electric field. This characteristic makes it essential for capacitors, multilayer ceramic capacitors (MLCCs), and energy storage applications [7]. For MLCC applications, dielectric materials must combine high electrical insulation with a substantial dielectric constant at room temperature, while maintaining stability across operational temperature ranges. However, the temperature-dependent nature of the dielectric properties of BaTiO3 and the sharp phase transition at its Curie temperature may affect its performance in applications requiring stable dielectric behavior across wide temperature ranges, motivating efforts for property optimization through controlled chemical modification [8,9,10].
Ionic substitution has emerged as the primary strategy for enhancing BaTiO3 properties, where the partial replacement of Ba2+ or Ti4+ ions with small concentrations of appropriately sized dopants can induce beneficial structural and microstructural modifications [11,12]. While individual doping with various ions has shown improvements, single-dopant systems often involve competing effects between different properties depending on the specific dopant, concentration, and processing conditions [13]. These limitations have motivated research into co-doping strategies that could potentially overcome single-dopant constraints.
The incorporation of rare-earth ions as dopants has been extensively studied to enhance dielectric performance of BaTiO3 ceramic materials [14,15]. The electrical behavior of BaTiO3 is highly influenced by the specific lattice sites these ions occupy within its structure [16]. Rare-earth ions with a greater ionic radius, such as Nd3+ and La3+, tend to replace Ba2+, exhibiting donor-like characteristics, whereas smaller ions like Yb3+ preferentially substitute Ti4+, resulting in acceptor-type doping [17,18].
According to the literature, trivalent species like La3+ and Bi3+ exhibit dual donor-acceptor behavior in BaTiO3, with their ionic radii governing the ultimate material characteristics [11,13]. La3+ and Bi3+ exhibit high solubility in BaTiO3 and are frequently used to improve its dielectric properties [19,20,21,22]. The valence state and ionic radii of La3+ (1.032 Å for a 6 coordination number, CN, or 1.36 Å for CN = 12) and Bi3+ (1.03 Å for a CN = 6) are intermediate between those of Ba2+ (1.61 Å for a CN = 12) and Ti4+ (0.605 Å for CN = 6) [23], indicating that La3+ and Bi3+ can substitute either Ba2+ or Ti4+ sites depending on the Ba/Ti molar ratio [24,25].
Doping BaTiO3 with La3+ or Bi3+ modifies the ferroelectric-to-paraelectric phase transition, commonly accompanied by a Curie temperature reduction. This transformation can be tailored to obtain desired material properties [19].
Despite extensive research on individual La3+ or Bi3+ doping of BaTiO3, systematic investigation of their combined effects, through controlled co-doping, remains limited. Previous studies have primarily focused on single-dopant systems, leaving a significant knowledge gap regarding the potential synergistic effects, optimal co-doping ratios, and underlying mechanisms of simultaneous La3+/Bi3+ incorporation. Understanding these aspects is crucial for developing next-generation BaTiO3-based materials with improved properties for advanced electronic applications.
In this study, the effects of controlled La3+/Bi3+ co-doping on the structural evolution and dielectric properties of BaTiO3 ceramics are investigated. The formula Ba1−3xLa2xTi1−3xBi4xO3 with varied dopant concentrations was employed to explore the potential synergistic effects of combining these two dopant ions. The synthesis was accomplished through solid-state processing using ball milling and controlled heat treatment, providing a scalable route for producing co-doped powders [26]. The characterization included structural analysis through X-ray diffraction and Rietveld refinement, microstructural evaluation via scanning electron microscopy, and dielectric measurements as a function of temperature and frequency.
2. Materials and Methods
BaTiO3 ceramics co-doped with La3+ and Bi3+ were synthesized according to the formula Ba1−3xLa2xTi1−3xBi4xO3, with doping concentrations of x = 0.0, 0.001, 0.002, 0.004, and 0.006. The synthesis process involved ball milling followed by heat treatment. The precursors—barium carbonate (BaCO3, 99.0% purity, CAS: 513-77-9, mean particle size dp = 7.69 µm), titanium dioxide (TiO2, 99.0% purity, CAS: 13463-67-7, dp = 0.76 µm), lanthanum oxide (La2O3, 99.9% purity, CAS: 1312-81-8, dp = 5.67 µm), and bismuth oxide (Bi2O3, 99.999% purity, CAS: 1304-76-3, dp = 15.03 µm)—were dried at 200 °C for 24 h to remove moisture. The dried precursors for each composition were placed in a cylindrical polypropylene container (44.8 mm diameter, 127.7 mm height) with zirconia balls of three different diameters (2.95, 5.05, and 6.48 mm) and acetone as a dispersion medium to improve homogeneity. A ball-to-powder weight ratio of 15:1 was used, with 5 g of powder precursors per batch. The Gaudin–Schumann equation was used to calculate the optimal ball charge distribution for the milling process [27].
where Y is the cumulative contribution of a ball of diameter d relative to the largest ball dmax. The mixture was milled for 6 h at a working speed (Ws) of 140 rpm, determined from:
where Cs is the critical speed (rpm) and D is the container diameter (m).
After milling, powders were allowed to settle for 24 h and dried under ambient conditions. They were then calcined in an Al2O3 crucible at 1200 °C for 5 h with heating and cooling rates of 4 °C/min. Crystalline phases were analyzed by X-ray diffraction (XRD, Inel Equinox 2000, Co Kα1, λ = 1.789 Å, 30 kV, 20 mA, 110° curved detector, resolution 0.095° FWHM, Artenay, France). Rietveld refinements were performed using FullProf 4.2 [28] with a pseudo-Voigt profile, and refinement quality was assessed via Rwp, Rexp, and χ2 [29].
Powder morphology and particle size were analyzed using high-resolution scanning electron microscopy (HRSEM, JEOL 6701F, JEOL Ltd., Tokyo, Japan) combined with image processing techniques. Feret diameter measurements were performed using ImageJ 1.54p software to determine the mean particle diameter [30].
Green pellets were prepared by placing the powders directly in an 8 mm die. A drop of acetone was added to improve compaction, and the pellets were then uniaxially pressed at 35 kN, producing pellets with a thickness of 3 mm. The green pellets were sintered in air atmosphere at 1250 °C for 6 h with heating and cooling rates of 4 °C/min. Surfaces were polished with SiC papers up to 2000 grit and ultrasonically cleaned in acetone. A commercial silver-platinum (Ag-Pt) paste was applied to both opposite surfaces as electrodes and cured at 200 °C for 30 min; subsequently, a thin platinum wire was attached to each surface for electrical contact. Capacitance measurements were performed using an LCR meter (East Tester ET4410) (Hangzhou, China) at 1 kHz and 100 kHz from 25 °C to 200 °C. The Curie temperature (Tc) was determined from the maximum of the dielectric constant vs. temperature curves, while the Curie–Weiss temperature (T0), the Curie constant (C), the critical exponent of nonlinearity (γ), and the Curie-like constant (C’) were obtained from the Curie–Weiss law and its modified form.
3. Results and Discussion
3.1. X-Ray Diffraction Analysis
The crystal structures of the ceramic samples with compositions x = 0.0, 0.001, 0.002, 0.004, and 0.006 were analyzed by X-ray diffraction (XRD). Figure 1 presents the diffraction patterns obtained for BaTiO3 powders. In all compositions, the XRD patterns revealed a crystalline phase consistent with that of pure BaTiO3 in its tetragonal phase at room temperature (JCPDS 96-152-5438), with characteristic diffraction peaks at 2θ ≈ 26.12°, 37.06°, 45.80°, 53.49°, 60.30°, 66.67°, 78.56°, 84.42°, 89.56°, and 90.44°. No secondary phases were detected, indicating the formation of a single-phase tetragonal structure.
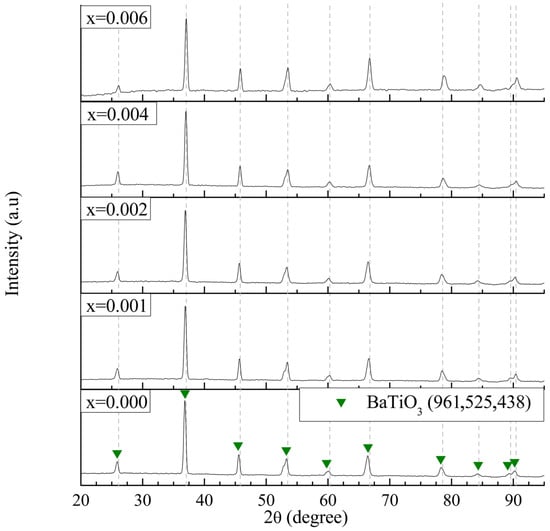
Figure 1.
XRD patterns of La3+/Bi3+ co-doped BaTiO3 powders calcined at 1200 °C for 5 h (0.0 ≤ x ≤ 0.006).
Figure 2 shows expanded views of the XRD patterns in the 2θ ranges of 52–54.5° and 88.5–92°. The crystallinity of BaTiO3 was identified by evaluating peak intensity and the characteristic splitting of the (200) reflection from cubic into tetragonal (200) and (002) components. As shown in Figure 2a, all samples exhibited the (200)/(002) peak splitting, confirming the presence of a tetragonal ferroelectric phase in the BaTiO3 crystal structure. However, for the sample with x = 0.006, a reduction in the intensity of the (002) peak was observed, indicating a progressive tendency toward the cubic phase with increasing dopant content.
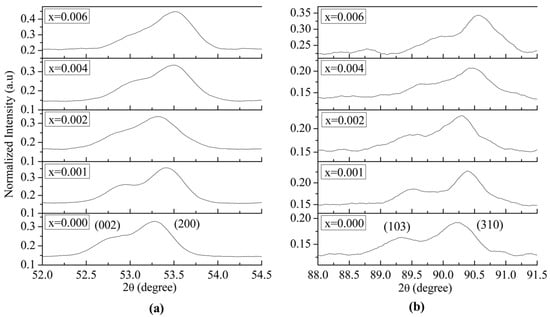
Figure 2.
Expanded view at (a) 2θ = 52–54.5°, and (b) 2θ = 88.5–92° of the XRD patterns of La3+/Bi3+ co-doped BaTiO3 powders (0.0 ≤ x ≤ 0.006).
Figure 2b reveals a decrease in the intensity of the peak corresponding to the (103) plane with increasing dopant content. These results align with literature reports indicating that the tetragonal-to-cubic phase transition, associated with the ferroelectric–paraelectric transformation, occurs at room temperature in BaTiO3 ceramics co-doped with high concentrations of La3+ or Bi3+ [31,32].
Changes in unit cell volume and lattice parameters (a and c) were evaluated to investigate the structural evolution of Ba1−3xLa2xTi1−3xBi4xO3 solid solutions. Table 1 presents the refined lattice parameters along with the reliability factors, including the goodness of fit (χ2) and profile R-factor (Rp), used to evaluate refinement accuracy. Rietveld refinement confirmed that all compositions within the range 0.0 ≤ x ≤ 0.006 crystallized in a pure tetragonal phase. A slight reduction in lattice parameters was observed in the ferroelectric tetragonal BaTiO3 samples co-doped with La3+ and Bi3+ at concentrations between 0.001 ≤ x ≤ 0.006, in comparison with the undoped BaTiO3 (x = 0.0). This reduction was associated with partial La3+ and Bi3+ incorporation into the BaTiO3 lattice. La3+ and Bi3+ ionic radii are considerably larger than that of Ti4+ but smaller than Ba2+, which significantly influenced the structural modifications. At equilibrium, La3+ and Bi3+ are expected to primarily substitute Ba2+ sites. Given their difference in valence, this substitution is predominantly compensated by cation vacancy formation [25,33,34]. Since the dopant ionic radii are smaller than Ba2+, lattice parameter contraction was expected. Additionally, the introduction of dopants and associated vacancies increases structural disorder in the perovskite lattice. This disorder progressively destabilizes the tetragonal phase, explaining the observed reduction in tetragonality at higher doping levels.

Table 1.
Structural parameters from Rietveld refinement of La3+/Bi3+ co-doped BaTiO3 powders (0.0 ≤ x ≤ 0.006).
Table 1 (fourth column) presents the tetragonality ratio (c/a) evolution, a key parameter related to the ferroelectric behavior of the ceramic. A value of 1 signifies cubic symmetry, indicating the absence of ferroelectricity characteristic of the tetragonal phase. An initial tetragonality enhancement was observed for x = 0.001, where the ratio rose from 1.0083 in the undoped sample to 1.009. This value surpasses the minimum tetragonality threshold (1.008) required for multilayer ceramic capacitors (MLCCs). However, as the dopant concentration increased (x = 0.004 and x = 0.006), the tetragonality ratio declined. This trend is consistent with the XRD data in Figure 2, which suggests the onset of a phase transition toward the cubic structure. Specifically, this transition is evidenced by a progressive reduction in the intensity of a characteristic BaTiO3 peak at 2θ ≈ 53.49°, typically associated with the tetragonal phase.
The unit cell volume (V) evolution for each sample is reported in Table 1. A reduction in unit cell volume was observed for all doped compositions relative to the undoped BaTiO3 (x = 0.0), which can be attributed to the decrease in lattice parameters, as previously discussed. This trend agrees with literature data on BaTiO3 doped with La3+ or Bi3+, where a gradual shift in diffraction peaks toward higher 2θ angles has been correlated with a reduction in unit cell volume [35,36].
3.2. Scanning Electron Microscopy
Figure 3 presents the HRSEM micrographs of BaTiO3 ceramics co-doped with La3+ and Bi3+, calcined at 1200 °C for 5 h. The micrographs were obtained at magnifications of 10,000× and 20,000×. The microstructure of the BaTiO3 powders with doping levels of x = 0.0, 0.001, 0.002, 0.004 and 0.006 revealed agglomerates of particles with varying sizes and morphologies. The results indicated that the incorporation of La3+ and Bi3+ at these concentrations did not produce significant alterations in the microstructure. In general, the particles exhibited a faceted morphology, a characteristic commonly observed in both doped and undoped BaTiO3 powders [13].
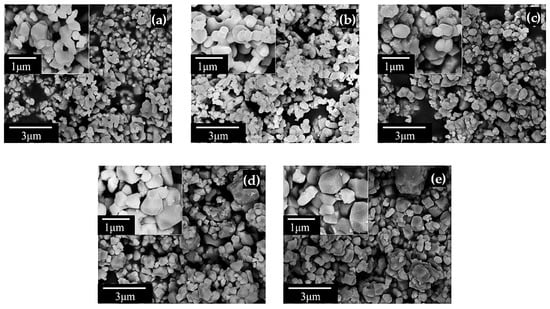
Figure 3.
HRSEM micrographs of La3+/Bi3+ co-doped BaTiO3 powders for (a) x = 0.0, (b) x = 0.001, (c) x = 0.002, (d) x = 0.004, and (e) x = 0.006.
The characterization of individual particles was performed using microscopy techniques, enabling visualization and dimensional analysis. ImageJ 1.54p software was employed to measure mean particle size via the Feret diameter method, offering precise dimensional data for individual particles [30]. The Feret diameter represents the linear distance between two parallel lines tangential to opposite sides of a particle, measured along a specific orientation. Since this value can vary depending on the direction, measurements were taken in two perpendicular directions to obtain a representative average. A total of 400 particles were analyzed from HRSEM micrographs corresponding to samples within the compositional range 0.0 ≤ x ≤ 0.006. The results, including mean particle diameter and standard deviation for each composition, are reported in Table 2.
Table 2.
Particle size distribution parameters of La3+/Bi3+ co-doped BaTiO3 powders (0.0 ≤ x ≤ 0.006).
The increase in mean particle size observed across the samples suggests that particle growth was promoted as the dopant concentration increased. Although previous studies have reported a reduction in particle size with increasing La3+ content in BaTiO3 [37], other reports indicate that Bi3+ doping at low concentrations results in grain growth, consistent with the trend observed in this work [20]. Thus, the particle growth observed in these samples appears to be primarily associated with the incorporation of Bi3+.
Particle shape can be quantitatively described through dimensionless parameters known as shape factors, which include metrics such as axial lengths, areas, perimeters, and geometric moments. One commonly used shape factor is the aspect ratio, defined as the ratio between the longest and shortest diameters of a particle, and is calculated according to the following expression:
where AR denotes the aspect ratio, dL corresponds to the largest diameter, and dS to the smallest diameter. The aspect ratio values are listed in Table 2, demonstrating that doped ceramics maintain relatively stable aspect ratios with increasing dopant content.
Furthermore, Figure 4 shows the elemental distribution maps corresponding to the composition with x = 0.006. These results provide additional evidence of uniform dopant incorporation within the BaTiO3 lattice.
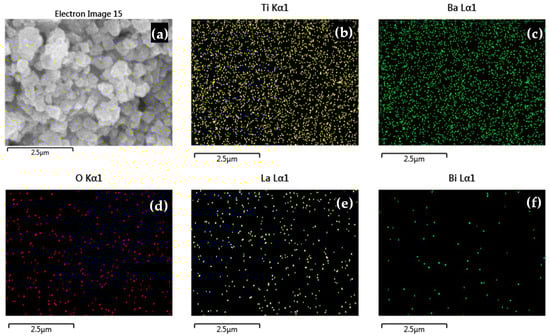
Figure 4.
Elemental distribution mapping analysis of La3+/Bi3+ co-doped BaTiO3 powders for x = 0.006: (a) electron image, (b) Ti, (c) Ba, (d) O, (e) La, and (f) Bi.
To confirm the successful incorporation of La3+ and Bi3+ dopants and verify the stoichiometry of the synthesized ceramics, semi-quantitative EDS analysis was performed for all compositions. Table 3 presents the elemental composition results, comparing experimental atomic percentages with theoretical values calculated from the formula Ba1−3xLa2xTi1−3xBi4xO3. The experimental values are in good agreement with the theoretical stoichiometry, confirming successful dopant incorporation into the BaTiO3 structure.
Table 3.
Semi-quantitative EDS analysis of La3+/Bi3+ co-doped BaTiO3 powders (0.0 ≤ x ≤ 0.006).
3.3. Electrical Properties
The dielectric properties were evaluated using capacitance measurements at fixed frequencies of 1 kHz and 100 kHz. The dielectric constant was calculated using the following formula [38]:
where d represents the pellet thickness, C is the capacitance, ε0 is the permittivity of free space, and A is the pellet area. The opposite faces of the sintered pellets were painted with silver-platinum paint, and a thin wire of platinum was placed on each side to act as electrodes to determine the electrical properties (Figure 5).
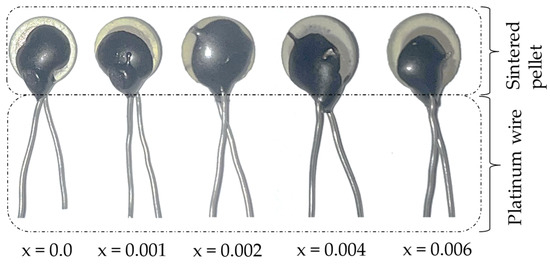
Figure 5.
Appearance of the manufactured capacitor devices.
The variation in the dielectric constant as a function of temperature was evaluated in the range of 25 °C to 200 °C at 1 kHz, and the results are presented in Figure 6a and Table 4. The dielectric permittivity as a function of temperature clearly illustrates significant differences in behavior between samples with low and high doping concentrations. The pure BaTiO3 ceramic sample (x = 0.0) and low-doped samples (x = 0.001, 0.002) displayed sharp peaks, indicating a well-defined ferroelectric-to-paraelectric phase transition at the Curie temperature. In contrast, highly doped samples (x = 0.004, 0.006) exhibited broadened peaks and more stable electrical behavior. These results are consistent with literature reports for La3+-doped BaTiO3, where permittivity initially increases with dopant concentration up to an optimal value (x = 0.001 in this study), beyond which it decreases, accompanied by progressively less pronounced peaks at the Curie temperature [10].
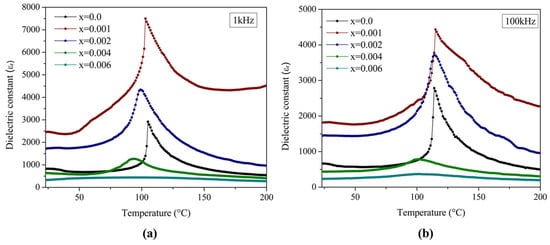
Figure 6.
Dielectric constant (εr) at (a) 1 kHz, and (b) 100 kHz as a function of temperature for capacitor devices prepared from La3+/Bi3+ co-doped BaTiO3 samples (0.0 ≤ x ≤ 0.006).
Table 4.
Dielectric parameters for La3+/Bi3+ co-doped BaTiO3 ceramics at 1 kHz and 100 kHz.
The dielectric constant reached maximum values for x = 0.001, with εr = 2469.0 at room temperature and εr = 7499.7 at the Curie temperature. The sample with x = 0.002 also exhibited enhanced permittivity (εr = 1740.3 and 4338.8, respectively). Both compositions surpassed undoped BaTiO3 across the entire temperature range. Beyond the optimal concentration (x = 0.001), the permittivity decreased progressively, reaching minimum values for x = 0.006 (εr = 334.8 and 442.4 at room temperature and Curie temperature, respectively).
A well-documented relationship exists between the tetragonality of BaTiO3 and its dielectric constant. The results obtained in this study reinforced this correlation, as the permittivity reached its maximum at x = 0.001—the same composition exhibiting the highest tetragonality. Beyond this critical concentration, both tetragonality and dielectric constant declined, with the effect being particularly evident at x = 0.006, where the permittivity was notably lower compared to the other compositions.
For samples with higher dopant concentrations (x = 0.006), dielectric permittivity exhibited minimal variation from room temperature up to the Curie temperature, maintaining an almost flat profile. Across the examined temperature range (25–200 °C), the total permittivity variation was below 33%, indicating nearly temperature-independent dielectric behavior. This characteristic is particularly relevant for applications requiring thermal stability in dielectric properties. The trend is quantified by the εmax/εmin ratio, which compares the maximum permittivity at the Curie temperature (εmax) to the permittivity at room temperature (εmin). This ratio decreased from 3.5 in undoped BaTiO3 (x = 0.0) to 1.3 for x = 0.006, confirming the suppression of permittivity variation at higher dopant levels.
The Curie temperature at 1 kHz, corresponding to the maximum dielectric constant observed in the permittivity-temperature curve, varied between 94 and 105 °C, decreasing with increasing La3+ and Bi3+ doping levels. This reduction in Tc is attributed to the smaller ionic radii of La3+ and Bi3+ compared to Ba2+. The partial substitution of these dopants for Ba2+ reduced the mean ionic radius, leading to paraelectric cubic phase stabilization at lower temperatures. Similar behavior has been documented by other researchers [19].
Polarization effects explain the dielectric behavior of the BaTiO3 system. Below the Curie temperature, the material becomes spontaneously polarized due to enhanced dipole interactions that lead to an internal field aligning the dipoles. At the Curie temperature, a phase transition from the ferroelectric to the paraelectric state occurs. Above Tc, the material enters the paraelectric phase, where elementary dipoles are randomly oriented [39]. As shown in Figure 6a, this transition becomes increasingly diffuse for highly doped samples (x = 0.006), reflecting the progressive disorder introduced into the perovskite structure by dopant incorporation.
The results for the dielectric constant as a function of temperature over the range of 25 °C to 200 °C at 100 kHz are presented in Figure 6b and Table 4. These results indicated a reduction in permittivity at both room temperature and the Curie temperature for all concentrations compared to the measurements at 1 kHz. In general, ferroelectric materials exhibit lower dielectric constants at higher frequencies because dipoles cannot follow the applied AC electric field. Conversely, at lower frequencies, interfacial and dipolar polarization contribute to higher dielectric constant values. Additionally, an increase in the Curie temperature (Tc) was observed for all concentrations compared to those measured at 1 kHz. This frequency-dependent shift occurs because ferroelectric domains require more thermal energy to respond as the frequency increases, resulting in an apparent displacement of the Curie temperature to higher values.
Dielectric parameters such as Curie constant (C) and Curie–Weiss temperature (T0) were calculated using the Curie–Weiss law
where C is the Curie constant, and T0 is the Curie–Weiss temperature, which is close to the Curie temperature.
T0 was obtained from the x-axis intercept of the linear extrapolation of 1/εr vs. T above Tc (Figure 7), while C was determined from the slope of this linear region. T0 decreased for all doped samples (Table 5), while the highest C value (39.6 × 10⁴ K) was measured for x = 0.001. The Curie constant is directly related to the strength of ferroelectric behavior and the degree of dipolar interactions within the material, with higher values indicating stronger ferroelectric coupling and more pronounced phase transitions. The significant increase in C for x = 0.001 suggests enhanced ferroelectric properties, consistent with this sample exhibiting the maximum dielectric constant. Notably, the concentration x = 0.006 does not follow the Curie–Weiss law, as evidenced by the negative T0 value in Table 5; therefore, the C value at this concentration is not physically meaningful.
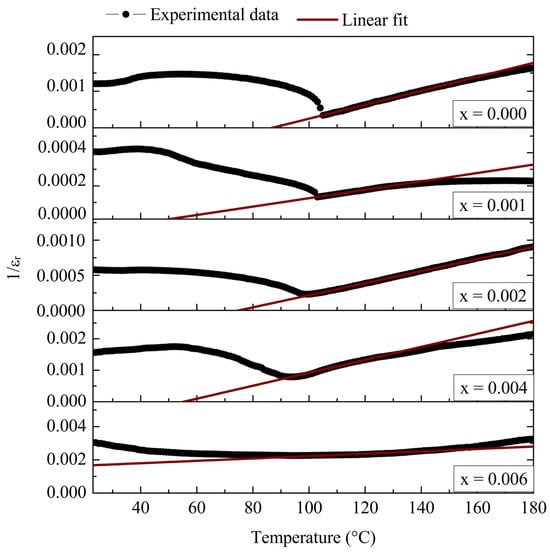
Figure 7.
Reciprocal value of εr as a function of temperature for La3+/Bi3+ co-doped BaTiO3 ceramics (0.0 ≤ x ≤ 0.006).
Table 5.
Dielectric parameters obtained from the Curie–Weiss law and its modified form for La3+/Bi3+ co-doped BaTiO3 ceramics at 1 kHz.
To quantify the diffuseness of the phase transition, the equation proposed by Uchino and Nomura [40] was used:
where εr is the dielectric constant, εmax is the maximum dielectric constant, Tmax is the temperature at which εmax occurs, γ represents the critical exponent of nonlinearity, and C’ the Curie-like constant. This equation constitutes a modified form of the Curie–Weiss law.
The calculated parameters are presented in Table 5. The critical exponent γ was obtained from the slope of the linear fit to the ln(1/εr − 1/εmax) vs. ln(T − Tmax) plot (Figure 8). The value of γ ranges from 1, indicating a sharp phase transition, to 2, characteristic of a diffuse phase transformation.
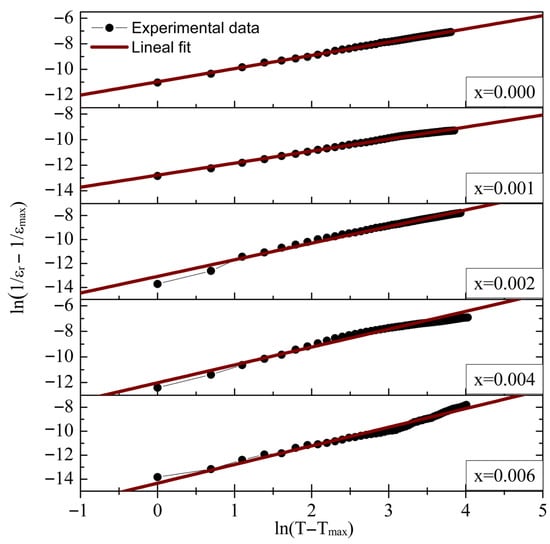
Figure 8.
The modified Curie–Weiss plot ln(1/εr − 1/εmax) vs. ln(T − Tmax) for La3+/Bi3+ co-doped BaTiO3 ceramics (0.0 ≤ x ≤ 0.006).
For low dopant concentration (x = 0.001), γ reached its minimum value of 0.94, consistent with the sharp ferroelectric-to-paraelectric phase transition observed in the εr vs. T plots. The critical exponent increased with dopant concentration, reaching its maximum value (γ = 1.56) for x = 0.006, indicating a diffuse phase transformation in heavily doped samples. As shown in Table 5, the Curie-like constant C’ generally increases with La3+ and Bi3+ content, with the highest value observed for the x = 0.006 sample.
The observed trends in the critical exponent γ are consistent with reports on La-doped BaTiO3 systems. Similar behavior has been documented for La-BaTiO3 [41], where increasing dopant concentration leads to a progressive transition from sharp to diffuse phase transformations, with γ values increasing as structural disorder intensifies.
4. Conclusions
XRD analysis confirmed the successful synthesis of single-phase tetragonal BaTiO3 for all compositions (0.0 ≤ x ≤ 0.006), with no secondary phases detected. The incorporation of La3+ and Bi3+ dopants significantly influenced the lattice parameters, causing a reduction in unit cell volume compared to undoped BaTiO3. The sample with x = 0.001 exhibited the highest tetragonality ratio (1.009), exceeding the minimum threshold required for multilayer ceramic capacitors. At higher doping levels, a gradual reduction in tetragonality was observed, indicating a progressive tendency toward cubic symmetry. HRSEM analysis revealed an increase in mean particle size from 362.5 nm (x = 0.0) to 488.3 nm (x = 0.006), with all samples exhibiting faceted morphology independent of dopant concentration.
Dielectric measurements demonstrated strong concentration-dependent behavior. The sample with x = 0.001 exhibited optimal performance with the highest dielectric constant at room temperature (εr = 2469.0) and Curie temperature (εr = 7499.7) at 1 kHz, confirming that controlled La3+/Bi3+ co-doping effectively enhances dielectric properties. At higher concentrations (x = 0.006), minimal permittivity variation (below 33%) from room temperature to the Curie temperature indicated nearly temperature-independent behavior suitable for applications requiring thermal stability. The Curie temperature decreased progressively with increasing dopant content at 1 kHz.
Analysis using the Curie–Weiss law showed that T0 decreased for all doped samples compared with undoped BaTiO3. The highest Curie constant (C = 39.6 × 10⁴ K) was measured for x = 0.001, consistent with enhanced ferroelectric properties. The critical exponent γ varied from 0.94 for x = 0.001, indicating a sharp ferroelectric-to-paraelectric phase transition, to 1.56 for x = 0.006, characteristic of a diffuse phase transition. These results confirm that La3+/Bi3+ co-doping offers a viable strategy for tailoring BaTiO3 properties to specific applications, enabling either enhanced dielectric performance at optimal doping levels or temperature-stable behavior at higher concentrations.
Author Contributions
Investigation, Formal analysis, writing—original draft, writing—review and editing, M.I.V.-C. and M.P.-L.; Methodology, Resources, Investigation. F.R.B.-H. and A.R.-S.; Methodology, Resources, I.M.-S., A.C.-R., M.U.F., M.R.-P. and J.C.J.-T. All authors have read and agreed to the published version of the manuscript.
Funding
This research received no external funding.
Data Availability Statement
The original contributions presented in this study are included in the article. Further inquiries can be directed to the corresponding author(s).
Acknowledgments
The authors would like to thank the Secretaria de Ciencia, Humanidades, Tecnología e Innovación (SECIHTI, México) and the Consejo de Ciencia, Tecnología e Innovación de Hidalgo, México (CITNOVA) for financial support and the Academic Area of Earth Sciences and Materials of the Autonomous University of Hidalgo State, México (AACTyM-UAEH) for technical support.
Conflicts of Interest
The authors declare no conflicts of interest.
References
- Atta, N.F.; Galal, A.; El-Ads, E.H. Perovskite nanomaterials–synthesis, characterization and applications; InTech: London, UK, 2016; pp. 107–151. [Google Scholar] [CrossRef]
- Yoon, D.H. Tetragonality of barium titanate powder for a ceramic capacitor application. J. Ceram. Process. Res. 2006, 7, 343–354. [Google Scholar]
- Vijatović, M.M.; Bobić, J.D.; Stojanović, B.D. History and challenges of barium titanate: Part II. Sci. Sinter. 2008, 40, 235–244. [Google Scholar] [CrossRef]
- Kuo, D.H.; Wang, C.H.; Tsai, W.P. Donor and acceptor cosubstituted BaTiO3 for nonreducible multilayer ceramic capacitors. Ceram. Int. 2006, 32, 1–5. [Google Scholar] [CrossRef]
- Cochran, W. Crystal stability and the theory of ferroelectricity. Adv. Phys. 1960, 9, 387–423. [Google Scholar] [CrossRef]
- Tsurumi, T.; Sekine, T.; Kakemoto, H.; Hoshina, T.; Nam, S.-M.; Yasuno, H.; Wada, S. Evaluation and statistical analysis of dielectric permittivity of BaTiO3 powders. J. Am. Ceram. Soc. 2006, 89, 1337–1341. [Google Scholar] [CrossRef]
- Pithan, C.; Hennings, D.; Waser, R. Progress in the synthesis of nanocrystalline BaTiO3 powders for MLCC. Int. J. Appl. Ceram. Technol. 2005, 2, 1–14. [Google Scholar] [CrossRef]
- Rödig, T.; Schönecker, A.; Gerlach, G.A. A survey on piezoelectric ceramics for generator applications. J. Am. Ceram. Soc. 2010, 93, 901–912. [Google Scholar] [CrossRef]
- Kozma, G.; Lipták, K.; Deák, C.; Rónavári, A.; Kukovecz, Á.; Kónya, Z. Conversion study on the formation of mechanochemically synthesized BaTiO3. Chemistry 2022, 4, 592–602. [Google Scholar] [CrossRef]
- Morrison, F.D.; Sinclair, D.C.; West, A.R. Doping mechanisms and electrical properties of La-doped BaTiO3. Int. J. Inorg. Mater. 2001, 3, 1205–1210. [Google Scholar] [CrossRef]
- Brajesh, K.; Kalyani, A.K.; Ranjan, R. Ferroelectric instabilities and enhanced piezoelectric response in Ce-modified BaTiO3 lead-free ceramics. Appl. Phys. Lett. 2015, 106, 1–6. [Google Scholar] [CrossRef]
- Yasmin, S.; Choudhury, S.; Hakim, M.A.; Bhuiyan, A.H.; Rahman, M.J. Structural and dielectric properties of pure and cerium doped barium titanate. J. Ceram. Process. Res. 2011, 12, 387–391. [Google Scholar] [CrossRef]
- Buscaglia, M.T.; Buscaglia, V.; Viviani, M.; Nanni, P.; Hanuskova, M. Influence of foreign ions on the crystal structure of BaTiO3. J. Eur. Ceram. Soc. 2000, 20, 1997–2007. [Google Scholar] [CrossRef]
- Paunovic, V.; Zivkovic, L.; Mitic, V. Influence of rare-earth additives (La, Sm, and Dy) on the microstructure and dielectric properties of doped BaTiO3 ceramics. Sci. Sinter. 2010, 42, 69–79. [Google Scholar] [CrossRef]
- Jung, Y.S.; Na, E.S.; Paik, U.; Lee, J.; Kim, J. A study on the phase transition and characteristics of rare-earth elements doped BaTiO3. Mater. Res. Bull. 2002, 37, 1633–1640. [Google Scholar] [CrossRef]
- Kishi, H.; Kohzu, N.; Iguchi, Y.; Sugino, J.; Kato, M.; Ohasato, H.; Okuda, T. Occupation sites and dielectric properties of rare-earth and Mn substituted BaTiO3. J. Eur. Ceram. Soc. 2001, 21, 1643–1647. [Google Scholar] [CrossRef]
- Park, K.J.; Kim, C.H.; Yoon, Y.J.; Song, S.M.; Kim, Y.T.; Hur, K.H. Doping behaviors of dysprosium, yttrium, and holmium in BaTiO3 ceramics. J. Eur. Ceram. Soc. 2009, 29, 1735–1741. [Google Scholar] [CrossRef]
- Gulwade, D.; Gopalan, P. Dielectric properties of A- and B-site doped BaTiO3: Effect of La and Ga. Phys. B 2009, 404, 1799–1805. [Google Scholar] [CrossRef]
- Vijatovic, M.; Stojanovic, B.; Bobic, J.; Ramoska, T.; Bowen, P. Properties of lanthanum doped BaTiO3 produced from nanopowders. Ceram. Int. 2010, 36, 1817–1824. [Google Scholar] [CrossRef]
- Wu, S.; Wei, X.; Wang, X.; Yang, H.; Gao, S. Effect of Bi2O3 additive on the microstructure and dielectric properties of BaTiO3-based ceramics sintered at a lower temperature. J. Mater. Sci. Technol. 2010, 26, 472–476. [Google Scholar] [CrossRef]
- Ali, A.I.; Kaytbay, S.H. Electrical transport properties of La-BaTiO3. Mater. Sci. Appl. 2011, 2, 716–720. [Google Scholar] [CrossRef][Green Version]
- Zdorovetsa, M.V.; Kozlovskiya, A.L. Study of the effect of La3+ doping on the properties of ceramics based on BaTiO3. Vacuum 2019, 168, 108838. [Google Scholar] [CrossRef]
- Shannon, R.D. Revised effective ionic radii and systematic studies of interatomic distances in halides and chalcogenides. Acta Crystallogr. Sect. A 1976, 32, 751–767. [Google Scholar] [CrossRef]
- Sareecha, N.; Shah, W.; Mirza, M.; Maqsood, A.; Awan, M. Electrical investigations of Bi-doped BaTiO3 ceramics as a function of temperature. Phys. B 2018, 530, 283–289. [Google Scholar] [CrossRef]
- Dunbar, T.D.; Warren, W.L.; Tuttle, B.A.; Randall, C.A.; Tsur, Y. Electron paramagnetic resonance investigations of lanthanide-doped barium titanate: Dopant site occupancy. J. Phys. Chem. B 2004, 108, 908–917. [Google Scholar] [CrossRef]
- Stojanovic, B.; Simoes, A.; Paiva-Santos, C.; Jovalekic, C.; Mitic, V.; Varela, J. Mechanochemical synthesis of barium titanate. J. Eur. Ceram. Soc. 2005, 25, 1985–1989. [Google Scholar] [CrossRef]
- Magdalinovic, N.; Trumic, M.; Trumuc, M.; Andric, L. The optimal ball diameter in a mill. Physicochem. Probl. Miner. Process. 2012, 48, 329–339. [Google Scholar] [CrossRef]
- Rodríguez-Carvajal, J. Recent advances in magnetic structure determination by neutron powder diffraction. Phys. B Condens. Matter 1993, 192, 55–69. [Google Scholar] [CrossRef]
- McCusker, L.B.; Von Dreele, R.B.; Cox, D.E.; Louër, D.; Scardi, P. Rietveld refinement guidelines. J. Appl. Cryst. 1999, 32, 36–50. [Google Scholar] [CrossRef]
- Merkus, H.G. Particle Size, Size Distributions and Shape. In Particle Size Measurements; Particle Technology Series; Springer: Dordrecht, The Netherlands, 2009; Volume 17. [Google Scholar] [CrossRef]
- Morrison, F.D.; Sinclair, D.C.; West, A.R. Electrical and structural characteristics of lanthanum-doped barium titanate ceramics. J. Appl. Phys. 1999, 86, 6355–6366. [Google Scholar] [CrossRef]
- Iriani, Y.; Suherman, B.; Sandi, D.K.; Nurosyid, F.; Khairuddin; Handoko, E.; Faquelle, D. Structural modification and dielectric property of Bi-doped BaTiO3 (Ba1−xBixTiO3) ceramics synthesized by co-precipitation. Integr. Ferroelectr. 2024, 240, 140–148. [Google Scholar] [CrossRef]
- Kocserha, I. Role of A-site (Sr), B-site (Y), and A,B-site (Sr,Y) substitution in lead-free BaTiO3 ceramic compounds: Structural, optical, microstructural, mechanical, and thermal conductivity properties. Ceram. Int. 2023, 49, 1947–1959. [Google Scholar] [CrossRef]
- Martínez-López, R.; Pérez-Labra, M.; Romero-Serrano, J.A.; Barrientos-Hernández, F.R.; Reyes-Pérez, M.; Valenzuela-Carrillo, M.I.; Dávila-Pulido, G.I. BaTiO3 solid solutions co-doped with Gd3+ and Eu3+: Synthesis, structural evolution, and dielectric properties. J. Rare Earths 2024, 42, 1920–1926. [Google Scholar] [CrossRef]
- Tihtih, M.; Ibrahim, J.F.M.; Kurovics, E.; Abdelfattah, M. Study on the effect of Bi dopant on the structural and optical properties of BaTiO3 nanoceramics synthesized via sol–gel method. J. Phys. Conf. Ser. 2020, 1527, 012043. [Google Scholar] [CrossRef]
- Ianculescu, A.; Mocanu, Z.V.; Curecheriu, L.P.; Mitoseriu, L.; Pădurariu, L.; Trușcă, R. Dielectric and tunability properties of La-doped BaTiO3 ceramics. J. Alloy. Compd. 2011, 509, 10040–10049. [Google Scholar] [CrossRef]
- Xinle, Z.; Zhimei, M.; Zuojiang, X.; Guang, C. Preparation and characterization of nano-sized barium titanate powder doped with lanthanum by sol–gel process. J. Rare Earths 2006, 24, 82–85. [Google Scholar] [CrossRef]
- Arshad, M.; Maqsood, A.; Gul, I.H.; Anis-Ur-Rehman, M. Fabrication, electrical and dielectric characterization of Cd–Ni nanoferrites. Mater. Res. Bull. 2017, 87, 177–185. [Google Scholar] [CrossRef]
- Acharya, V.V.N.; Bhanumathi, A.; Ramam, K.V.S. Ferroelectric investigation of tungsten bronze lead–barium–lanthanum niobate ceramics with high d33 values. Ferroelectr. Lett. Sect. 1999, 25, 125–128. [Google Scholar] [CrossRef]
- Uchino, K.; Namura, S. Critical exponents of the dielectric constants in diffuse phase transition crystals. Ferroelectrics 1982, 44, 55–61. [Google Scholar] [CrossRef]
- Paunovic, V.; Prijić, Z.; Đorđević, M.; Mitić, V. Enhanced dielectric properties in La modified barium titanate ceramics. Facta Univ. Ser. Electron. Energ. 2019, 32, 179–193. [Google Scholar] [CrossRef]
Disclaimer/Publisher’s Note: The statements, opinions and data contained in all publications are solely those of the individual author(s) and contributor(s) and not of MDPI and/or the editor(s). MDPI and/or the editor(s) disclaim responsibility for any injury to people or property resulting from any ideas, methods, instructions or products referred to in the content. |
© 2025 by the authors. Licensee MDPI, Basel, Switzerland. This article is an open access article distributed under the terms and conditions of the Creative Commons Attribution (CC BY) license (https://creativecommons.org/licenses/by/4.0/).