Abstract
This paper presents a novel numerical–experimental workflow to evaluate the sealability of casing connections in geothermal and underground gas storage wells, where cyclic thermal and pressure loads challenge conventional qualification methods. The approach combines experimental make-up and cyclic loading tests with finite element analysis by explicitly modeling the connection geometry and the contact conditions. Validation against experimental data shows good agreement in seal ovality, roughness, and wear, confirming the predictive reliability of the model. Results indicate that initial geothermal discharge and seasonal storage cycles generate the highest von Mises stresses, expressed as a percentage of the material’s yield strength (%VMS), mainly under combined tensile and internal pressure loading. After the first make-up, subsequent cycles reduced seal contact pressure and length, increasing leakage risk; however, repeated loading improved tribological behavior, enhancing sealability despite occasional galling. The proposed framework enables accurate prediction of connection integrity under extreme cyclic conditions, offering a novel tool to optimize design and streamline qualification testing.
1. Introduction
The integrity of casing connections is a key concern in energy applications where wells are subjected to severe thermal and mechanical loads. This is particularly critical in geothermal production and underground storage wells, where cyclic pressurization and elevated temperatures impose service conditions far more demanding than in conventional oil and gas operations. In such environments, surface production temperatures may exceed 400 °C and withdrawal pressures can reach up to 200 bar [1]. The cumulative effect of long-term cyclic loading increases the likelihood of progressive damage and challenges the design and qualification of connections. Moreover, compared with hydrocarbon wells, the availability of field data for geothermal and storage applications remains limited, making direct “knowledge transfer” difficult for operators and service companies [2,3,4].
In parallel, the development of technologies for producing and storing low-carbon subsurface energy carriers has gained momentum in the last decade, especially as global energy strategies evolve under heightened geopolitical uncertainties [5,6]. Geothermal exploitation and underground storage of natural gas and hydrogen are increasingly central to this transition [7,8,9]. Projects such as the Iceland Deep Drilling Program [10] have demonstrated the extreme thermal and mechanical demands on tubular goods [11], while recent studies emphasize the additional integrity challenges posed by hydrogen, related to its small molecular size and cyclic injection–withdrawal processes [9,11,12,13,14,15].
Casing connections play a decisive role in maintaining long-term well integrity under these conditions. Conventional API STC and BTC designs, although widely deployed, offer limited sealability [16,17,18], which motivated the development of premium connections featuring metal-to-metal seals, torque shoulders, and Buttress-type thread profiles [19,20,21]. Premium connections, initially tailored for high-pressure/high-temperature hydrocarbon wells, have since become indispensable for geothermal and underground storage wells [7,8]. Their sealability depends strongly on tribological mechanisms, surface finishes, and adequate make-up practices [22,23,24]. Galling, in particular, remains a critical surface damage mechanism affecting connection performance and service life [25,26].
In recent decades, finite element analysis (FEA) has been widely applied to investigate the mechanical behavior of threaded connections under combined loading [27,28,29,30]. More recent efforts have extended FEA to model leakage paths and the influence of surface roughness [31,32,33], highlighting the importance of capturing both macroscopic contact pressures and microscopic sealing effects. Hybrid approaches that integrate experimental testing and advanced simulation are now essential to qualify connections for service-specific cyclic conditions [34,35,36].
Despite these advances, current qualification standards, such as ISO 13679:2019 [21], were originally developed for hydrocarbon applications and do not fully address the challenges posed by geothermal and hydrogen storage wells. In particular, the combined effects of cyclic thermal loads, hydrogen permeation, and tribological degradation mechanisms are still insufficiently understood [9,13,14,15]. This gap underscores the need for advanced methodologies that integrate experimental evidence with predictive numerical tools to assess connection sealability and integrity in emerging energy applications.
The present study addresses this gap by combining controlled make-up and cyclic loading experiments with detailed finite element simulations. The objective is to provide a validated framework for assessing the sealability of premium connections under extreme cyclic conditions, thereby supporting the safe and efficient deployment of geothermal and underground storage technologies.
1.1. Casing Connections for Underground Storage and High Thermal Downhole Environments
Threaded connections have been widely used in oil and gas for over a century to join drill pipe, tubing, and casing [16]. A connection is the geometric arrangement of threads and the material properties that allow two adjacent pipe joints to be joined hermetically and withstand the loads and operations expected over the well’s life [17,18,19].
The so-called API connections have been the workhorse of industry until the mid-1960s, where more challenging field conditions and a growing interest in unlocking natural gas reservoirs in several regions worldwide fostered the development and use of Premium Connections.
Unlike API connections, which offer limited sealing capability due to their geometry, premium connections incorporate a metal-to-metal (MTM) seal, a modified Buttress thread, and a torque shoulder. The MTM seal is energized during make-up, before the tubular string is run, providing gas-tightness even under the combined loads encountered during service.
Table 1 shows a general range of applicability of such connections in function of bottomhole pressure, and the wellbore depth and type of energy carrier produced are given. While only addressing Oil & Gas environments, the chart highlights the role of Premium (gas-tight) connections for its use in complex downhole scenarios, where the combined effect of high operating pressures and production/withdrawal of gases are the main drivers justifying the use of such thread geometries.

Table 1.
Range of application of OCTG connection types by application (Oil and Gas). API Connections are labeled here as “standard” connections, and Premium connections are those providing gas-tight capabilities by design [20].
Table 1.
Range of application of OCTG connection types by application (Oil and Gas). API Connections are labeled here as “standard” connections, and Premium connections are those providing gas-tight capabilities by design [20].
| Well Type | Location | Connection Type | Well Depth [km] | Bottom Hole Pressure [Bar] |
|---|---|---|---|---|
| Gas Wells | Offshore | Premium Connections | 6.0 | 550 |
| Gas Wells | Onshore | Premium Connections | 6.0 | 550 |
| Oil Wells | Offshore | Standard Connections | 3.0 | 275 |
| Oil Wells | Onshore | Standard Connections | 3.0 | 275 |
Driven by national emergency supply needs derived from geopolitical concerns at that time, the construction and expansion of underground storage facilities gained momentum in the early 1970s. At that time, the most common method involved storing crude oil and refined liquid products in salt caverns [37] and depleted hydrocarbon reservoirs, particularly along the U.S. Gulf Coast and in Northwestern Europe [17]. As a result, well completions from that era predominantly relied on API STC and BTC connections. Decades later, as natural gas became increasingly vital for ensuring a stable energy supply for both industrial and residential users in these regions, it became clear that repurposing old wellbores originally designed for liquid hydrocarbon storage was necessary. This shift led to the adoption of Premium Connections.
With operating pressures reaching 200 bar and the combined loading induced by cyclic withdrawal and injection phases, the use of gas-tight connections in said downhole environments is expected to become standard practice. This trend is particularly relevant as interest in storing gases with low molecular size like hydrogen continues to grow, playing a key role in the evolving energy strategies of carbon-free industrial economies worldwide. For deep geothermal environments however, it is not possible to make a general statement with regard to the bottomhole pressures witnessed during the operation of a production well: high enthalpy production from under pressured reservoirs is rather the norm in continental Europe [17], downhole operating pressure requirements in excess of 690 bar are seen as a threshold value for the planning of completion arrangements in other deep geothermal plays around the globe [2,38,39].
1.2. Review of Existing Qualification Tools for Gas-Tight Casing Connections for Cyclic Downhole Service
Contrasting with the rather empirical development API connections witnessed until the development of the API Buttress thread by the late 1950s, the technological breakthrough brought by the arrival of Premium Connections in the market implied an unprecedented increase investment dedicated to the development and standardization of the latter. This factor, first mentioned in [40] and yet unseen generally for oilfield equipment until that time, has been constantly updated, which is reflected in their high cost when compared to conventional API thread geometries.
The role of low-carbon energy carriers in the actual global energy mix grows along with a widespread interest for robust wellbore architectures exceeding the minimum requirements for Wellbore Integrity Management during the entirety of its productive lifetime. This trend is already noticed in specific regulatory requirements and recommendations contained in standards and guidelines like NORSOK D-010 (2013) [41] and BVEG (2021) [42], correspondingly.
In contrast, underground hydrogen storage and high-enthalpy geothermal production have not yet been addressed by standards governing the qualification of premium connections (e.g., ISO 13679:2019 [21]). Since the 1980s, most research on premium connections under cyclic downhole conditions has focused on high bottomhole pressures in natural-gas service and on the tribological behavior of MTM seals—contact-pressure distribution and the onset of galling—as a function of sliding speed, lubrication, and surface quality. A summary of key contributions is provided in Table 2 (after [17]).
Table 2.
Summarized State of the Art of Research Work on the Performance of Gas-Tight Connections subject to high cyclic downhole conditions.
Table 2.
Summarized State of the Art of Research Work on the Performance of Gas-Tight Connections subject to high cyclic downhole conditions.
| Source | Key Findings |
|---|---|
| Götzen (1986) [19] | Found axial loading had the most severe impact on Premium connections in thermal conditions. |
| Blackstone (1988) [15] | Studied the effects of sliding speed and applied load on galling resistance. |
| Inose (2016) [9] | Grease is indispensable for high-pressure gas tightness in premium metal-to-metal seals—mineral-oil greases with soft metal particle additives perform best. |
| Maruyama et al. (1995) [43] | Emphasized the importance of surface treatments like phosphating for seal resistance. |
| Tsuru (1990) [44] | Examined the role of thread clearance in sealing efficiency. |
| Maruyama et al. (1989) [45] | Increased tubular wall thickness improved resistance to cyclic loading and seal contact pressure. |
| Ertas (1992) [46] | Studied the effects of sliding speed and applied load on galling resistance. |
| Johnson (2004) [47] | Investigated lubrication absence effects on sealing and confirmed “seal deformation history” experimentally. |
| van Wittenberghe (2011) [20] | Focus on shoulder design and its impact on sealing. |
| Pearson (2013) [48] | Introduced “seal deformation history” concept for improved resistance in MU/BO cycles. |
| Stewart (2014) [49] | Further studied “seal deformation history” in MU/BO cycles. |
| Zabala (2015) [50] | Expanded on surface treatment research for MTM seal surfaces. |
| Grijalva Meza (2015) [18] | Validated seal ovality evolution impact on deformation trends. |
| Xie (2017) [27] | Expanded on surface treatment research for MTM seal surfaces. |
| Kaldal & Thorbjornsson (2021) [51] | Developed a semi-premium connection for geothermal settings without MTM sealing. |
Recent industrial insights also highlight the role of advanced numerical tools in assessing connection integrity [52]. In parallel, computer-aided methods such as finite element analysis (FEA) have been used since the early 1990s to evaluate OCTG mechanical performance under multiple load modes. Although adoption for gas-tight casing connections lagged due to contact-mechanics complexity, advances in computation extended their use to demanding applications [16,17,18] (e.g., horizontal wells and casing drilling) while reducing qualification costs (Table 3).
Table 3.
Summarized State of the Art of Simulation Work on Casing Gas-Tight Connections (Modified after [53,54]).
Table 3.
Summarized State of the Art of Simulation Work on Casing Gas-Tight Connections (Modified after [53,54]).
| Source (Ref.) | 2D Axis-Symmetrical | Nonlinear Material | Nonlinear Geometry | Connection Make-Up | Axial Loading (Comp–Tensile) | Internal Pressure | External Pressure | Bending | Temperature |
|---|---|---|---|---|---|---|---|---|---|
| Assanelli & Dvorkin (1993) [55] | ✓ | ✓ | ✓ | ✓ | ✓ | ||||
| Dvorkin & Toscano (2003) [56] | ✓ | ✓ | ✓ | ✓ | ✓ | ||||
| Sugino et al. (2010) [57] | ✓ | ✓ | ✓ | ✓ | ✓ | ✓ | |||
| Xu & Chen (2017) [34] | ✓ | ✓ | ✓ | ✓ | ✓ | ✓ | |||
| Guo et al. (2012) [58] | ✓ | ✓ | ✓ | ✓ | ✓ | ||||
| Xu & Shi (2014) [59] | ✓ | ✓ | ✓ | ✓ | ✓ | ||||
| Cui et al. (2015) [60] | ✓ | ✓ | ✓ | ✓ | ✓ | ||||
| Chen et al. (2018) [22] | ✓ | ✓ | ✓ | ✓ | ✓ | ✓ |
With the growing importance of energy carriers produced or stored in the underground such as deep geothermal resources and gaseous hydrogen, the industry is keen to accelerate the knowledge transfer from the Oil and Gas E&P sector. With ongoing initiatives from both industrial and independent organisms proposing reworked testing methodologies [3], a critical gap yet remains in understanding the impact of sealability performance and seal damage sensitivity on Well Integrity under the service conditions featured in the above-mentioned downhole environments. This gap becomes more evident as the results and availability of such initiatives are kept private and away from public availability.
As field operations aim for lower environmental impact and longer service life, the suitability of current qualification standards for gas-tight connections is uncertain. Some gases—especially hydrogen—have properties not fully considered by ISO 13679 [21], which typically uses nitrogen as the test medium. Hydrogen’s smaller molecular size and viscosity affect both test philosophy and acceptable leak-rate thresholds.
Additionally, current qualification standards focus solely on analyzing connection performance at a single stage of a gas-tight connection’s service life. This study proposes a holistic approach to understanding and evaluating gas-tight connection performance throughout its entire service life. It also assesses the impact of specific operating conditions on the connection’s sealing capacity, enabling the prediction of conditions that may lead to a potential loss of integrity.
2. Experimental–Numerical Approach to Assess and Predict Casing Connection Performance for Underground Storage and High Thermal Downhole Environments
A testing approach was developed to assess the performance of a gas-tight connection during the entirety of its productive time, for which a thorough Service Life Analysis was conducted based on documented field cases and real field data to identify the service conditions typically found in underground storage environments, as well as in deep geothermal environments along the North German Basin [17]. For the analysis of a deep geothermal downhole environment, thermal derating on a L80 tubular alloy was considered. As a result, three key service life stages were identified:
- Service Stage 1: Tubular running on the rig floor (Make-Up/Break-Out);
- Service Stage 2: Service Life Scenario A (Downhole injection);
- Service Stage 3: Service Life Scenario B (Energy withdrawal).
The mechanical performance of the connection tested was assessed by experimental testing mimicking each one of the abovementioned service stages. For Stage 1, a Vertical Power Tong was used. This setup, shown in Figure 1, features the following:
- Two independently acting clamping units (upper and lower). The upper unit undergoes free rotation whereas the lower unit is restricted to axial movement only.
- Connection Make-Up is controlled via an operating console, which automatically stops when the predefined Make-Up Torque and/or angular rotation are achieved [61], triggered by an automatic switch.
- A Digital Data Acquisition System displaying Make-Up and Break-Out plots in real time, allowing data to be stored and later retrieved using a USB stick.

Figure 1.
Vertical Power Tong used to replicate tubular running and connection of casing connections on the rig floor.
For Stages 2 and 3, a new testing rig mimicking downhole conditions on cyclic production/injection wellbores was developed for this approach based on the general parameters mentioned later under “Preparation of Test Specimens for Stage 2 and 3”, which were calculated based on data gathered during the Service Life Analysis. Service loads characterizing Stage 2 are pure compressive strength, while pure tensile loading will define Stage 3. The applied internal pressure, as well as duration of the corresponding testing runs, remain the same.
By applying pure axial load and internal pressure and while working on the principle, first identified by Götzen (1986) [19], of connection separation when subjected to axial loading, it is possible to evaluate the sealability performance of “closed” (FMU) specimens for either water or nitrogen in real time during a finite number of test cycles (tension-compression + variable hold time). The rig, as shown in Figure 2, features the following general hardware and data gathering configuration:
- Double-acting hydraulic cylinder along with a hydraulic power unit;
- Internal pressure inlet system;
- Leakage detection and monitoring system;
- Data Processing and Control System (including load sensors and other measurement devices).

Figure 2.
Cyclic Load Testing Rig—Schematic (A) and Final Position (B) views.
2.1. Test Specimens—Rationale for Selection and Specimen Preparation
The conceptual design of the Service Life Analysis identified threaded and coupled connections (T&C) as the preferred choice for high cyclic loading in the downhole environments of interest for the study. After comparing critical operating conditions mentioned previously with geometrical and performance features offered by the Premium connection designs available in the market, a generic Premium connection design was selected for further experiments: featuring a cone-to-cone MTM seal (lower contact stress peak), a modified Buttress thread profile (improved performance under axial loading), and an inverse torque shoulder (enhanced compression resistance while maintaining sealing), a set of 38 test specimens with different manufacturing tolerances (24 pins, 14 boxes) plus a set of 10 spares were machined in a 3.5″ × 9.5 lb/ft, L80 configuration.
This is shown in Figure 3. Both size and material were selected for the sake of replicability and consistency of experimental results with the data from the Service Life Analysis, as well as for easier handling during the execution of the experimental work.
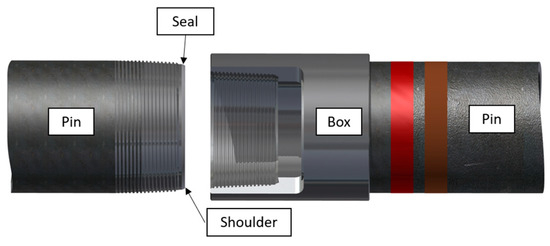
Figure 3.
Sectional view of the Test Specimen configuration used in the study.
2.1.1. Preparations for the 1st Experimental Phase: Make-Up/Break-Out
From the original set of samples, five specimen combinations (one combination comprised by 2 pin specimens + 1 box) were selected based on ovality measurements taken right after manufacturing and upon arrival of the samples at the testing laboratory. The remaining samples were kept as additional spares in case of damage of the main specimens. The basis for specimen selection was based on said measurements and the results of pre-testing, where it was found that samples with high connection interference failed, thus narrowing the selection of potential samples to specimens with “low-nominal” interference values. For the execution of the experiments on Service Stage 1 (MU/BO Testing), the following operation parameters were considered:
- Make-Up Torque Limits: 3.54 kNm (Min), 3.93 kNm (Optimum), 4.32 kNm (Max);
- Thread Dope Recipe: API Modified;
- Amount of Thread Dope on the specimens: 9 g (Pin), 1 g (Box);
- Rotational Speed of the Power Tong: 4 rpm;
- Maximum test cycles per specimen: 9 Make-Up Cycles + 1 FMU;
- Failed/Pass criterion: No Damage at the seal surfaces (Galling).
Before and after each test cycle, surface roughness (Ra and Rz) and seal ovality were measured on each pin specimen under controlled laboratory conditions. A threshold value range for surface roughness of ±1.6 µm was established for both pin and box seal surfaces. This was done for the sake of defining a set of “seal ovality/seal roughness” evolution charts, later used to make general estimations of the tribological development of the seal surface during the conditions mentioned above.
In the case a test specimen successfully passed the maximum amount of test cycles showing no damage at the MTM seal surfaces, the specimen combination in question underwent a 24-h baking stage, where the sample is subjected to a maximum temperature of 180 °C. This was done for simulating thread compound aging attributable to high downhole temperatures: the threshold temperature of 180 °C, which is contained in ISO 13679 [21,62], is based on average field operating temperatures found in conventional oilfield downhole applications during the 2nd half of the XX Century [19,46].
2.1.2. Preparations for the 2nd Experimental Phase: Sealability Assessment
After a specimen combination passed Service Stage 1 (Make-Up/Break-Out (MU/BO), the specimen combination was rigged into the cyclic loading rig (Figure 2). As a pre-testing of the cyclic loading rig before the start of experiments for Service Stage 2 and 3, discarded specimens from the previous stage were instrumented with strain gauges before a series of test runs were executed. The purpose of such pre-testing runs was to calibrate the data gathering and control systems of the cyclic loading rig, thus ensuring accurate measurements and early troubleshooting potential issues. For the execution of the experiments on Service Stage 2 and 3 (Production/Injection scenarios), the following operation parameters were considered:
- Maximum Axial Load Capacity of the testing rig: 900 kN (tensile and compressive);
- Maximum Applied Load: 80% VMS (735 kN in both tension and compression);
- Applied Internal Pressure Range: 200 bar–310 bar;
- Testing Media: Water (for hydraulic sealability) and N2 (for gas sealability);
- Maximum test cycles per specimen: 200–250 full cycles (Tensile + Compressive loading + Hold Time);
- Duration of Full Load Sequence per specimen: 25,000 to 60,000 s;
- Failed/Pass criterion: No Leakage on the specimen (0.9 mL/15 min)—according to the ISO 13679 [21].
2.2. Construction of the Numerical Model
The numerical modeling framework developed in this study was conceived as a direct complement to the experimental campaign, with the dual purpose of (i) reproducing the observed contact mechanics and sealing response of the tested gas-tight connection geometry under realistic Make-Up and service loading conditions, and (ii) enabling predictive assessments of sealability for alternative designs without the need for repeated full-scale testing. This approach is grounded in the philosophy that, when properly calibrated against experimental evidence, finite element analysis (FEA) can serve as a robust surrogate to explore the structural and tribological performance of threaded connections subjected to combined mechanical and pressure loads [17,53,54].
The geometry under investigation is a premium cone-to-cone metal-to-metal (MTM) seal connection (Figure 3). Sectional view of the Test Specimen configuration used in the study, widely used in critical downhole environments for OCTG because it maintains gas-tightness over long service lives [4,63]. In this work we exploit axisymmetry and mid-plane symmetry to build an efficient 2D axisymmetric model that preserves full fidelity in the seal, shoulder, and thread contact interfaces; this approach captures nominal contact pressures, seal lengths, and plastic strain distributions with accuracy comparable to full 3D analyses [23,64].
2.3. Geometric Simplifications and Symmetry Considerations
The decision to adopt a 2D axisymmetric half-section was justified by the fact that both the connection geometry and the primary loading conditions (axial tension/compression and internal pressure) are rotationally symmetric about the connection axis. This permits representation of the joint by revolving a single cross-section about its central axis (ABAQUS element types CAX/CGAX), with the radial and axial coordinates (r,z) defining the model domain and the circumferential coordinate being implicit [65].
The additional mid-plane symmetry along the longitudinal axis of the coupling reduces the computational domain by half, further decreasing element count while preserving the mechanical behavior in the region of interest. This simplification is consistent with previous numerical work on bolted joints [24] and premium connections [22,66], where the fidelity of the contact pressure field and stress state is unaffected by halving the model when the loading and geometry are symmetric.
2.4. Mesh Design and Convergence
The finite element mesh of the connection model was generated in ABAQUS using 4-node bilinear axisymmetric elements (CAX4), selected for their robustness in representing axisymmetric geometries and compatibility with non-linear contact simulations under the small-sliding formulation [65]. The mesh comprised 18,538 elements for the BOX and 20,091 elements for the PIN, with a graded distribution: coarse in the bulk and refined to approximately 0.05 mm in the seal and shoulder regions to capture stress gradients. A mesh-convergence study, performed by reducing the seal-region element size by ~30% (increasing the total element count by ~50%), resulted in less than 2% variation in peak nominal contact pressure. This outcome confirmed that the computed stress distribution and leakage predictions are mesh-independent.
To balance computational efficiency and numerical accuracy, a graded mesh strategy was adopted. Coarser elements were employed in the bulk regions of the pin and box members, where stress gradients are modest and structural deformation is primarily elastic. In contrast, fine mesh refinement was applied in the high-interest zones—specifically, the MTM seal contact region and the torque shoulder area—where steep stress gradients, localized plasticity, and evolving contact conditions occur.
In the MTM seal region, elements were refined down to a nominal size of 0.05 mm, enabling the capture of sharp nominal contact pressure peaks and fine-scale variations in the pressure distribution along the sealing surface. Accurate resolution of this pressure field is critical for predicting leakage onset, as sealability is directly linked to whether the nominal contact pressure exceeds the applied internal pressure over a sufficient length of the sealing surface.
In the shoulder region, refinement was driven not only by the need to capture nominal contact pressures but also by the necessity to resolve the plastic shear band that develops during Make-Up and service loading. The element size in this zone was selected based on preliminary simulations that showed the shear band width to be on the order of a few hundred microns. By maintaining an element size sufficiently smaller than this width, the numerical model accurately represents both the onset and propagation of localized plastic deformation. This resolution is essential for understanding how over-torque conditions or excessive interference can promote early plasticization, which in turn can reduce seal performance over time.
The final mesh consisted of 18,538 elements for the BOX and 20,091 elements for the PIN. All nodes along symmetry planes and contact interfaces were matched to ensure compatibility and to prevent numerical artifacts at the interface boundaries. Figure 4 shows the finite-element mesh, highlighting both the global discretization and the locally refined regions around the seal shoulder and thread.
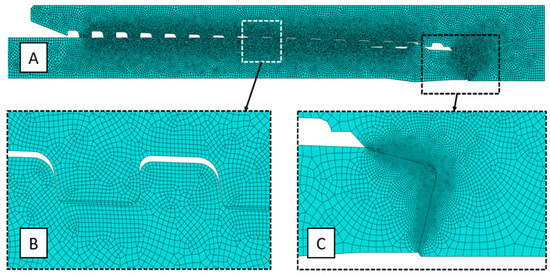
Figure 4.
Finite-element mesh of the threaded connection. (A) Global view of the model showing overall discretization. (B) Local refinement at the threads to capture contact stresses. (C) Local refinement at the seal shoulder region to resolve stress gradients.
The gap highlighted with a black boundary in Figure 4 corresponds to the initial clearance intentionally modeled between the pin and box components. This clearance represents the unengaged thread/flank region prior to make-up and is necessary to capture the realistic contact evolution during tightening. Including this feature ensures that the FE simulation accurately reproduces the progressive load transfer and seal formation observed in the physical connection.
Figure 5 shows a detailed view of the sealing region, highlighting two main areas and their associated interferences: (a) the seal area and (b) the shoulder area. The seal area is primarily responsible for ensuring the tightness of the entire connection, while the shoulder area, through its interference, provides the necessary energization of the joint after torque is applied.
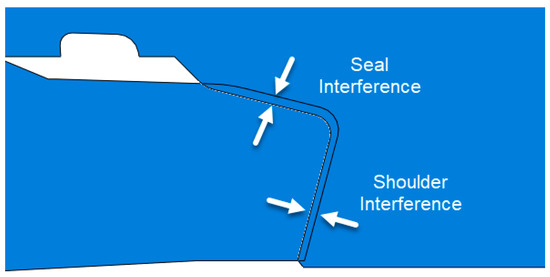
Figure 5.
Detailed view of the seal and shoulder regions, illustrating the corresponding interferences: the seal interference ensures gas-tightness of the connection, while the shoulder interference, found in both elements of pin and box, provides additional support and energization after torque application.
A mesh convergence study was conducted to ensure that the numerical predictions of contact pressures, seal length, and leakage performance were independent of mesh size. In this process, the element size in the seal region was reduced by approximately 30%, increasing the total element count by nearly 50%. Convergence was achieved when further refinement altered the peak nominal contact pressure by less than 2%, consistent with best practices in contact mechanics simulations [64,66]. This convergence criterion provides confidence that the predicted leakage rates [27]—derived from the contact pressure distribution through the leakage model (Equation (1)) are free from discretization bias.
where
- A and B: fitting parameters;
- σ: contact pressure;
- Q: leakage volume rate.
Through this refinement strategy, the mesh achieved a balance between localized accuracy in critical contact and plasticity regions and computational efficiency for full load-path simulations. This ensured that the FE model could faithfully replicate the complex interplay of elastic–plastic deformation, contact evolution, and pressure sealing observed in the experimental program.
2.5. Material Model and Constitutive Behavior
The material model was defined to replicate the mechanical response of the L80 OCTG steel grade used in the experimental specimens (Figure 2). This steel is a quenched-and-tempered medium-carbon alloy commonly employed in oil and gas tubular products due to its balance of strength, toughness, and resistance to sulfide stress cracking.
The elastic properties were set according to standardized values for L80 steel, consistent with API 5CT specifications [67] and previous numerical studies on threaded OCTG connections [22,23]. These elastic parameters ensure accurate representation of the initial stiffness of the connection under both tensile and compressive loads.
The yield strength was assigned as σy = 551.6 MPa (80 ksi), matching the API 5CT minimum specified value for L80 material. In the numerical framework, this yield stress serves as the onset of plastic deformation in the von Mises formulation.
The constitutive response was modeled using a von Mises yield criterion with associated flow rule, a formulation well established for ductile metals under multi-axial stress states [22,23,24,25,26,27,28,29,30,31,32,33,34,35,36,37,38,39,40,41,42,43,44,45,46,47,48,49,50,51,52,53,54,61,62,63,64,65,68,69]. The von Mises criterion defines yielding as a function of the second deviatoric stress invariant, making it insensitive to hydrostatic pressure and therefore suitable for the highly constrained stress fields present in the seal and shoulder contact zones of threaded connections.
Plastic flow was implemented using an incremental plasticity algorithm in ABAQUS, where the stress state is updated at each load increment via the radial return mapping procedure. This approach ensures numerical stability even under large strain gradients encountered in the highly localized plastic zones during Make-Up and cyclic loading.
In this study, the L80 steel grade defined by API 5CT was selected as the reference material. L80 is a widely used casing grade with a minimum yield strength of 552 MPa (80 ksi), tensile strength ranging from 655 to 862 MPa, and good toughness in sour-service environments. Its balanced mechanical properties make it a representative choice for medium-to-deep wells where both strength and resistance to hydrogen sulfide are required. The grade was chosen not only because it is frequently used in geothermal and storage wells, but also because extensive field experience and available test data provide a reliable basis for calibration and validation of the FE models.
2.6. Isotropic Hardening Behavior
An isotropic hardening model was adopted to represent the expansion of the yield surface as plastic deformation progresses. This choice reflects the material’s tendency to exhibit uniform strengthening in all loading directions after yielding, a behavior consistent with the monotonic and cyclic test data for quenched-and-tempered steels. The isotropic hardening law was defined using true stress–plastic strain data obtained from tensile testing of the L80 material and transformed to engineering strain for ABAQUS input.
In ABAQUS, isotropic hardening was implemented via the Plastic property definition, in which a bilinear isotropic model was implemented. These values capture the full range of plastic response, from the yield point through the strain hardening regime up to the maximum strain levels experienced in service. For accurate cyclic load prediction, the hardening curve included the initial rapid strain hardening stage, the more gradual work-hardening phase, and the onset of saturation.
Below the isotropic hardening parameters:
- ET = 17,500 MPa (tangent modulus);
- EP = E·ET/(E + ET) (plastic hardening modulus).
2.7. Role in Contact and Seal Performance
This material definition is crucial for capturing the plastic strain accumulation in the MTM seal and torque shoulder during Make-Up and under combined axial–pressure cyclic loading. The non-linear model allows the simulation to predict localized yielding, shear band formation, and residual contact pressure loss, all of which are key determinants of long-term seal integrity. Furthermore, the inclusion of isotropic hardening ensures that post-yield strengthening is properly accounted for, avoiding non-physical over-predictions of plastic strain localization.
2.8. Boundary Conditions
Boundary conditions were imposed to enforce the axisymmetric and mid-plane symmetry assumptions while replicating the physical constraints observed in the test rigs (Figure 1 and Figure 2).
Axis of revolution: All nodes along the connection axis were constrained in the radial direction (pinned) to enforce axisymmetry.
Mid-plane symmetry: Nodes along the longitudinal symmetry plane were constrained in the axial direction, preventing displacement normal to the plane while allowing in-plane deformation.
Pin end constraint: The free end of the pin was constrained against rigid-body motion in the axial direction to preserve the correct axial stiffness of the assembly. This boundary was placed sufficiently far from the seal to avoid spurious boundary effects.
2.9. Contact Modeling
Three distinct contact interfaces were explicitly modeled in the finite element representation of the connection: (i) the metal-to-metal (MTM) seal, (ii) the torque shoulder, and (iii) the thread flanks. Each interface plays a critical role in load transfer and sealability, with the MTM seal bearing the primary responsibility for gas-tightness, the torque shoulder providing axial positioning and supplemental sealing, and the thread flanks ensuring torque transmission while resisting axial separation.
All contact definitions employed ABAQUS’s small-sliding, surface-to-surface contact algorithm with penalty enforcement. This algorithm enforces contact compatibility by introducing a set of internal contact elements that apply restoring forces proportional to the magnitude of penetration between master and slave surfaces. These contact elements are not directly user-defined but are automatically generated by ABAQUS when the interaction properties are assigned. The software also determines master/slave assignments automatically, typically assigning the more finely meshed surface as the slave to improve accuracy in local stress predictions.
In the ABAQUS formulation for axisymmetric problems, both CAX and CGAX element libraries can be used for contact surfaces. CAX elements are torsionless axisymmetric solids, suitable for purely axial-symmetric loads, whereas CGAX elements support generalized axisymmetric conditions including torsion. For the present analysis, CAX4 elements were chosen, as the loading path did not include torsional components during service simulation. The contact algorithm discretizes each contact surface into a series of linear contact segments, each defined by two consecutive nodes along the interface. This segmentation allows the algorithm to track evolving contact status—open or closed—at each integration point during the incremental solution process.
The small-sliding formulation is computationally efficient and particularly suitable for cases where relative tangential motion between surfaces is modest, as is the case during Make-Up seating of the MTM seal and shoulder under static interference conditions. This choice reduces solution time while preserving convergence stability, an important consideration given the fine mesh resolution in the seal region.
In the baseline model, all contact interactions were assumed frictionless. This assumption was motivated by both computational efficiency and literature evidence indicating that introducing a Coulomb friction coefficient in the range μ = 0.1–0.2 yields negligible differences in the seal’s peak nominal contact pressure (<2%) and predicted leakage rates (<4%) [25,70]. These findings imply that normal load distribution dominates sealability, with shear resistance playing a secondary role. Furthermore, frictionless contact simplifies the mesh convergence process by removing sensitivity to local tangential slip events.
Nevertheless, the model framework allows friction to be included in future studies. ABAQUS provides this capability through the Contact → Friction property, enabling Coulomb-law friction with either constant or pressure-dependent coefficients. In practice, friction parameters could be calibrated against torque–turn curves from Make-Up tests to capture shear-induced hardening phenomena [4,26,62,63] and to represent the influence of thread compounds and surface treatments on torque distribution. The addition of friction can also slightly increase local plastic strain in the seal region (<10% under cyclic loading [25,70]), which may be relevant for studies focusing on galling or long-term wear.
The axisymmetric finite element model of a connection is fundamentally based on the evaluation of normal stresses at the sealing surfaces. These stresses govern the development of contact pressures that ensure leak-tight performance and thus represent the primary parameter for assessing sealability. Although galling is a detrimental surface phenomenon associated with localized adhesion and material transfer during make-up, it does not directly alter the macroscopic distribution of normal stresses that are critical for sealability. In practice, galling is generally detected in the threaded region rather than in the sealing area; consequently, its occurrence does not have a significant influence on the sealing performance of the connection. Therefore, in the context of a sealability assessment, friction is not the dominant factor, while the establishment and maintenance of sufficient normal contact pressure remains decisive. This reconciles the use of galling as a pass criterion with the modeling approach based on stress-driven sealing mechanisms [21,25,26,70].
Overall, the combination of accurate surface discretization, mesh-sensitive master/slave assignment, penalty-based enforcement, and a carefully justified friction model ensures that the contact algorithm in ABAQUS captures the key physics of the MTM seal, torque shoulder, and thread flank interfaces while maintaining computational efficiency. This approach aligns with best practices in the simulation of interference-fit and sealing joints [24], providing a robust foundation for the KPI-based sealability assessments presented in this work.
2.10. Representation of Make-Up and Service Loads
The Make-Up process was simulated by imposing an interference fit between the pin and box shoulder surfaces, corresponding to the experimentally determined interference lengths derived from torque–turn diagrams. Two interference levels were evaluated: 0.015 mm and 0.030 mm, representing optimal and over-torqued conditions, respectively. These values were selected based on experimental evidence indicating that over-torquing promotes early plasticization of the seal area, reducing subsequent sealing capacity.
Internal pressure was applied as a distributed nodal load on the exposed surfaces of the MTM seal, simulating fluid pressure penetration. Service loading sequences reproduced the combined axial tension/compression and internal pressure cycles applied during the experimental Phase II tests, with tensile and compressive loads up to 80% of the connection’s von Mises strength (VMS) and internal pressures up to 310 bar.
2.11. Pressure Penetration Problem
Following Greenwood & Williamson’s work on asperity contact [24] and Fischer laminar micro-channel leakage model [71], the pressure penetration problem was addressed by distinguishing two seal zones at each load step:
Zone 1—surfaces under nominal contact pressure (pcp_cpc) between pin and box;
Zone 2—surfaces exposed to internal or external pressure.
Equivalent nodal forces in Zone 2 were computed by integrating the applied pressure over the active contact segments. ABAQUS’s internal contact elements track the evolving contact status at each increment, allowing dynamic reclassification of nodes between Zones 1 and 2 as the load path progresses.
2.12. KPI Extraction and Sealability Assessment
Three Key Performance Indicators (KPIs) were extracted from the FE results to quantify sealing performance, as defined in Equations (2)–(4):
Seal/Shoulder Force—total contact force integrated over the seal or shoulder interface;
Maximum Nominal Contact Pressure—peak value of pcp_cpc at the seal or shoulder;
where
: Nominal contact pressure on the Seal;
Nominal contact pressure at the Shoulder;
Internal or external pressure.
Seal Length—axial length of the seal over which pcp_cpc (nominal contact pressure at the cone-to-cone seal) exceeds the internal pressure pintp_pint (applied internal pressure on the connection). This is defined by using a unitary sealability indicator (Equation (4)).
where
- : Sealability Indicator for the analyzed State;
- : Sealbility Indicator for Make-Up.
All KPI values reported in tables and figures are normalized with respect to the MU state according to Equation (4); values greater than 1 indicate improvement relative to MU, whereas values lower than 1 indicate degradation.
These KPIs were evaluated at critical load points corresponding to the experimental leakage assessment: MU, T-1, MU-1, C-1, MU-2, T-2, MU-3, C-2, MU-4 (Table 4, Table 5, Table 6 and Table 7). Their evolution was used to interpret changes in sealing performance due to tensile/compressive cycling, interference level, and load path history.
Where
- MU—Reference make-up state;
- T-1, T-2—First and second tensile loading cycles;
- C-1, C-2—First and second compressive loading cycles;
- MU-1, MU-2, MU-3, MU-4—Return to make-up state after each tensile or compressive cycle.
Table 4.
Seal Performance Indicators (KPI) with ∆Int = 0.030 mm.
Table 4.
Seal Performance Indicators (KPI) with ∆Int = 0.030 mm.
| Load Step | Peak [MPa] | Seal Length [mm] | LP2 [MPa·mm] |
|---|---|---|---|
| MU | 1467 | 2.5 | 1231 |
| T-1 | 1319 | 1.6 | 880 |
| MU-1 | 1378 | 2.4 | 1174 |
| C-1 | 1375 | 2.5 | 1266 |
| MU-2 | 1310 | 2.1 | 985 |
| T-2 | 1174 | 1.3 | 685 |
| MU-3 | 1258 | 2.0 | 980 |
| C-2 | 1321 | 2.5 | 1260 |
| MU-4 | 1256 | 2.1 | 979 |
Table 5.
Shoulder Performance Indicators (KPI) with ∆Int = 0.030 mm.
Table 5.
Shoulder Performance Indicators (KPI) with ∆Int = 0.030 mm.
| Load Step | Peak [MPa] | Shoulder Length [mm] | LP2 [MPa·mm] |
|---|---|---|---|
| MU | 1916 | 2.7 | 2102 |
| T-1 | 793 | 1.8 | 797 |
| MU-1 | 1728 | 2.7 | 1904 |
| C-1 | 1494 | 3.2 | 2678 |
| MU-2 | 992 | 2.6 | 1446 |
| T-2 | 363 | 1.5 | 343 |
| MU-3 | 1003 | 2.6 | 1439 |
| C-2 | 1501 | 3.2 | 2676 |
| MU-4 | 1000 | 2.6 | 1443 |
Table 6.
Seal Performance Indicators (KPI) with ∆Int = 0.015 mm.
Table 6.
Seal Performance Indicators (KPI) with ∆Int = 0.015 mm.
| Load Step | Peak [MPa] | Seal Length [mm] | LP2 [MPa·mm] |
|---|---|---|---|
| MU | 1504 | 2.1 | 1065 |
| T-1 | 1245 | 1.2 | 711 |
| MU-1 | 1301 | 2.0 | 1013 |
| C-1 | 1348 | 2.5 | 1219 |
| MU-2 | 1256 | 1.7 | 875 |
| T-2 | 1132 | 1.1 | 606 |
| MU-3 | 1209 | 1.7 | 870 |
| C-2 | 1299 | 2.5 | 1214 |
| MU-4 | 1208 | 1.7 | 871 |
Table 7.
Shoulder Performance Indicators (KPI) with ∆Int = 0.015 mm.
Table 7.
Shoulder Performance Indicators (KPI) with ∆Int = 0.015 mm.
| Load Step | Peak [MPa] | Shoulder Length [mm] | LP2 [MPa·mm] |
|---|---|---|---|
| MU | 1749 | 1.9 | 1237 |
| T-1 | 421 | 0.7 | 165 |
| MU-1 | 1683 | 1.9 | 1181 |
| C-1 | 1626 | 2.8 | 2157 |
| MU-2 | 745 | 2.0 | 899 |
| T-2 | 0 | 0.0 | 0 |
| MU-3 | 757 | 2.0 | 892 |
| C-2 | 1628 | 2.7 | 2153 |
| MU-4 | 755 | 2.0 | 897 |
2.13. Calibration and Validation of the Numerical Model
The FE model was calibrated by matching the initial seal nominal contact pressures and interference lengths to those obtained experimentally from torque–turn plots. Validation was performed by comparing predicted KPI evolution and leakage onset with full-scale test results (Figure 6). High correlation was observed between the FE-predicted seal length reduction under tensile load and the experimentally measured increase in nitrogen leak rate.
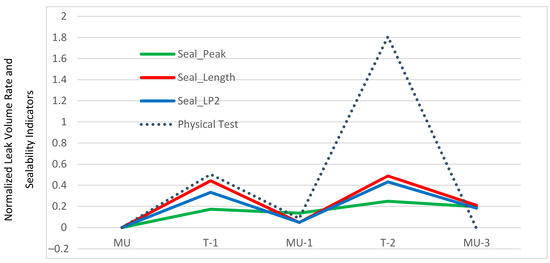
Figure 6.
Evolution of Sealability Indicators and Experimental Leakage through the experimental assessment.
FE-predicted sealability indicators (Equation (4)) were compared against experimental leakage trends (Figure 6). While magnitudes differ, the evolution patterns align (loss under T-1/T-2, recovery at MU-n/C-n), supporting the model validity.
The methodology explicitly links the indoor experimental program with the finite element simulations through a stepwise calibration–validation procedure. First, make-up and cyclic loading tests were performed to generate torque–turn and leakage data under controlled conditions. These measurements were then used to calibrate key material and contact parameters in the FE models, including friction factors and plastic hardening laws. Subsequently, the normalized sealability indicators derived from the FE analysis (Equation (4)) were compared against the experimental leakage evolution to validate the predictive capability of the model. This integrated approach ensures consistency between laboratory evidence and numerical predictions, providing a reliable framework for extrapolating connection performance to untested geometries and service conditions.
2.14. Limitations and Applicability
The present axisymmetric model captures the primary mechanics of the MTM seal under symmetric loading, but it does not represent non-axisymmetric effects such as bending or eccentric Make-Up, which would require full 3D modeling. The neglect of explicit surface roughness geometry means that leakage predictions rely on empirical calibration (Equation (4)) rather than direct flow simulation through asperity channels [72]. Nonetheless, the combination of mechanistically sound KPIs and calibration against full-scale tests makes the model a powerful and efficient tool for sealability prediction across a range of premium connection designs.
3. Discussion of Results
In this section, the results of both experimental and numerical runs will be presented and discussed.
3.1. Results of the Experimental Approach
Service Stage 1 (MU/BO): The main objective of this experimental stage was to assess the connection sensitivity to surface damage at the MTM seal areas during tubular running at the rig floor before it is run into the wellbore, namely during the Make-Up process.
A similar trend was also identified in those specimens (14 in total) that were discarded in its totality due to galling at the MTM seal surface. This phenomenon could suggest that, for the damaged specimens (Figure 7), the phosphate layer on the seal surface was displaced during Make-Up and redistributed across the MTM seal surface. As a result, the exposed metallic substrate came into direct contact with the mating seal surfaces, thus leading to galling as depicted in Table 7.
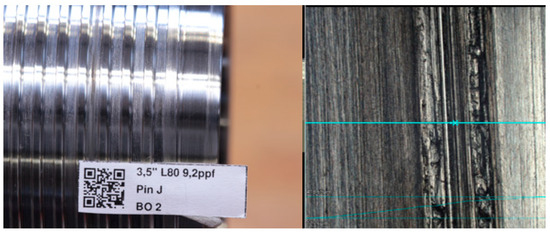
Figure 7.
Damaged specimen (Left side “as detected” on the test rig, right side on the microscope).
From a tribological point of view, this could also indicate that a initially rough surface helps with lubrication retention of the contacting (MTM) surfaces, but these beneficial effects might be lost as Make-Up cycles progress. This is evidenced by decreasing Ra values. Further research is required to confirm this hypothesis.
On the damaged specimens, galling consistently occurred at the seal zone where the seal angle starts. The reason for this trend was identified as a manufacturing issue that was resolved as testing progressed.
For the totality of the specimens tested, the analysis of surface roughness evolution during this stage revealed that specimens without any surface damage exhibited a general downward stabilization of Ra values after the 1st Make-Up cycle, as shown in Figure 8, with this effect being more noticeable after the 3rd Make-Up cycle. It is therefore assumed that an upward trend in measured Ra could give an indication on the potential occurrence of future surface damage in the connection. This conclusion is, however, only applicable to seal geometries like those tested in this study (see Section 2.1).
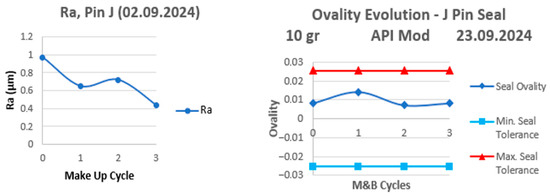
Figure 8.
Evolution history of both ovality (left) and surface roughness (right) in one of the tested specimens with no damage.
The analysis of ovality evolution on the tested samples showed that all pin specimens featured rounding (“inward shrinkage”) of the seal diameter because of the Make-Up process itself (Figure 8. Evolution history of both ovality (left) and surface roughness (right) in one of the tested specimens with no damage). Considering the manufacturing tolerances of the specimens, this phenomenon could explain the positive effects on sealing performance of the specimen combinations, which was later witnessed during Stages 2 and 3 of the experiments. Previous studies confirmed that dominant angles influence ovality in connections during Make-Up while defining the seal zones where galling is more likely to occur [18].
A definitive conclusion cannot be drawn due to measurement limitations. Not all pins were measured because Side A underwent final make-up and because metrology resources were initially limited. In addition, frequent but non-critical surface damage at the thread runout was excluded from the analysis, as it lies outside the study scope and can typically be repaired in the field according to ISO 13679:2019 [21].
Service Stages 2 and 3 (Injection/Production): The main objective of the stage was to assess the performance of gas-tight casing connections during repeated injection/production scenarios in function of its resistance to leakage. Although none of the 5 tested specimen combinations leaked during the experiments, the novel design and purpose of the test rig meant that operational challenges had to be addressed in real time, e.g., the internal pressure system for sealability tests required manual adjustment which however did not have a negative impact on the results of the experiment.
Overall recorded leak rates remained below the 0.9 mL/15 min threshold throughout cyclical loading, as Figure 9 shows. The observed leak rate variations (upward or downward trends) highlight the system’s sensitivity to internal pressure fluctuations and the corresponding manual corrections.
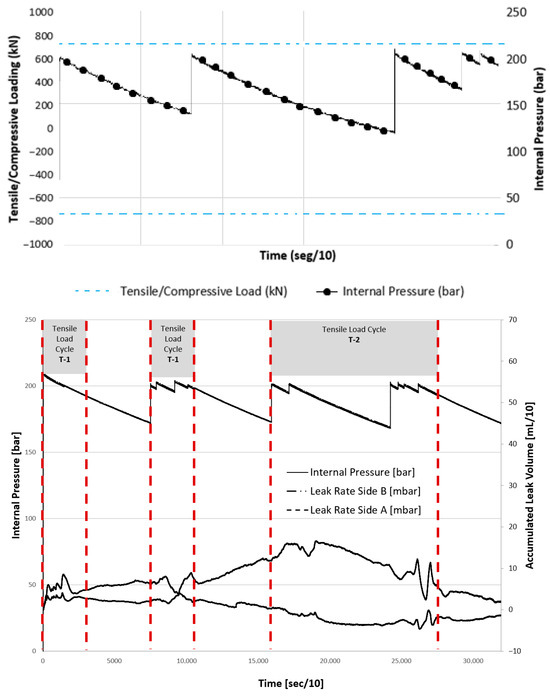
Figure 9.
Tensile/Compressive Load Sequence vs. Internal Pressure (upper side) and accumulated leak volume rates on both sides of Specimen Combination 5 (lower side). In this case, the testing medium was nitrogen.
The sealability setup proved to be more sensitive to internal pressure fluctuations when nitrogen was used as the test medium. The main reason behind the use of nitrogen as the test medium was not only a normal convention within the scope of good practice of OCTG premium connection qualification procedures [19,21,52], but also due to safety concerns due to its properties as a non-flammable, inert gas which behaves in a similar fashion like hydrogen [52]. Figure 9 gives an overview of the testing sequence and the leakage trends recorded during the experiment. Regardless of the test medium used for the sealability assessments, the leak rates on Side A of each specimen combination (on the Box) featured a higher sensitivity to internal pressure fluctuations. For the sake of understanding it is worth mentioning that, in the upper side of Figure 9, the axial load applied on the specimen (blue) ranged from −740 kN (compression) to +740 kN (tension), and this cycle repeated every 240 s, whereas in the lower side of Figure 9 the effects of pure tensile axial load of +740 kN (tension) applied are highlighted (dotted lines in red mark out the duration of each load cycle).
With regard to the sealability performance of the connection on Specimen Combination 5, leak rate fluctuations were more evident within the first two hours (7.200 s) of cyclic loading, aligning with approximately 35 load cycles (2.4 h). Unlike other specimens tested, Side B exhibited significantly lower leak rates than Side A for most of the assessment, even after stabilization at 10.5 h of internal pressurization. Despite these variations, no leak rate exceeded the threshold of 0.9 mL/15 min. The findings derived from testing on Specimen Combination 5 bear great relevance considering frequent workover activity (e.g., tripping in and tripping out) of production strings during the service lifetime of a downhole energy storage wellbore [17], thus deriving on performance interpretations which are close to the reality of field service.
The longer cycle time observed for T2 compared to T1 is explained by the progressive loss of seal length and contact pressure after the first tensile loading. As a result, during T2 the system requires a larger displacement to mobilize the remaining sealing surfaces, which increases the cycle duration. In contrast, during T1 the initial seal length is still intact, so the cycle is shorter.
3.2. Results of the Numerical Analysis
Service Stage 1 (MU/BO): The main objective of the numerical analysis on this experimental stage was to investigate how the mechanism of seal energizing is generated during the Make-Up Process through the interaction between sealing surfaces, torque-turn plots and local material deformation. For the latter, the following material properties typical for a L80 oilfield grade steel alloy were employed:
- Young modulus: 210,000 MPa (210 GPa);
- Poisson ratio: 0.3;
- Yield Stress: 80 ksi = 551.6 MPa;
- Material conditions: Isotropic hardening, elasto-plastic material, Von Mises yield criterion.
In finite element analyses (FEA) of tubular connections, the plastic response of steels is generally modeled using a bilinear elastoplastic scheme. This approach idealizes the material behavior with a linear elastic portion up to the yield stress, followed by a linear plastic hardening branch. Although this simplification neglects details such as the Lüders plateau or nonlinear strain hardening, in practice it has little influence on the overall results of connection performance analyses. The structural response (e.g., load–displacement, contact pressure distribution, sealability) is usually governed by geometry, contact conditions, and overall plastic capacity, rather than by fine details of the hardening curve [27].
As part of the Make-Up/Break-Out (MU/BO) testing procedure, torque-turn diagrams were generated for each test sample combination. A general trend of a typical Make-Up diagram is shown in Figure 10. These plots later underwent a sensitivity analysis to determine average ΔTorque values, which are essential for evaluating simulated interference in numerical assessments. Since the tested specimens feature a 6 thread-per-inch (6 TPI) configuration, the interference at the seal and shoulder areas of both the pin and box was calculated. An initial rough estimate placed the total average shoulder interference at 0.054 mm, which was later refined to 0.030 mm and ultimately adjusted to 0.015 mm.
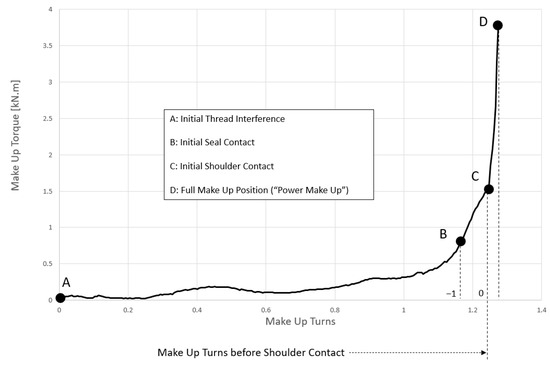
Figure 10.
Make-Up Diagram. The importance or proper identification of the moment in which the torque shoulder on the pin contacts the corresponding box surface is highlighted here, as this accounts for more precise results during the numerical analysis with Finite Element Analysis (FEA).
Figure 11 illustrates the correlation between von Mises stress and plastic strain for the case of 0.030 mm shoulder interference. A similar trend is observed for the 0.015 mm interference, although both the plastic strain and the corresponding von Mises stress are lower, as will be discussed in the subsequent analysis. The black region in the von Mises stress field indicates that the material has reached its yield stress, implying the onset of plastic strain. As shown in the lower part of the figure, the plastic strain distribution coincides with the black zone in the von Mises stress diagram, confirming this correlation.
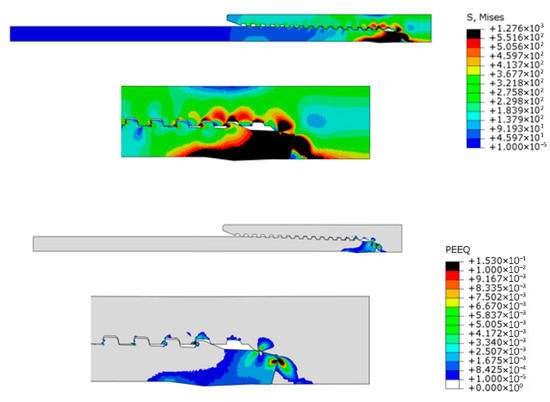
Figure 11.
Stress concentration (up) and equivalent plastic strain (down) levels at the connection @ seal interference of 0.03.
In Figure 12 the effects of torque shoulder interference on the plasticization of punctual areas at the MTM seal surface during both initial Make-Up and the full loading process are compiled. When the interference is set at 0.030 mm, a fully developed plastic shear band appears, whereas at 0.015 mm, only a minor initiation area for plastic deformation is present. The latter value aligns more closely with observed connection behavior, as Make-Up curves suggest that the actual initial interference tends to hover around this figure.
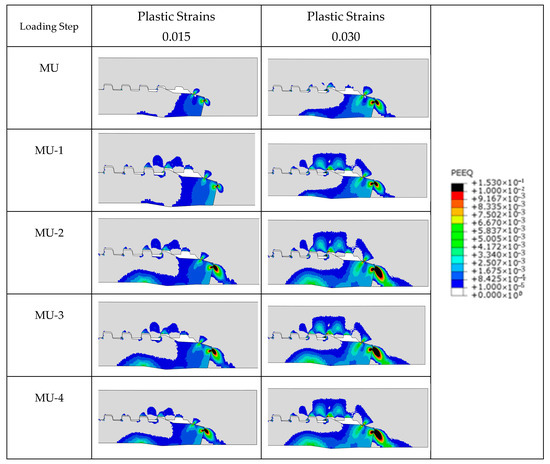
Figure 12.
Overview of Plastic Strain Evolution on Seal/Shoulder areas during Cyclic Loading @80% VMS.
Experimental findings support these assumptions. Figure 12 shows that the findings of the numerical analysis predicted significant plastic deformation at the shoulder area when assuming an interference value of 0.030 mm. However, this was not observed during testing. While some degree of plastic deformation was expected in this region, the 0.015 mm assumption appears more realistic. This conclusion is reinforced by visual inspections after each Make-Up cycle, which showed no signs of damage in the shoulder area (Figure 7).
The large difference in plastic strain between the 0.015 mm and 0.030 mm interference cases is explained by the higher constraint introduced at the seal and shoulder surfaces under the over-torqued condition. The 0.030 mm interference promotes the development of a continuous plastic shear band, while the 0.015 mm case only initiates localized plasticization, which is more consistent with the experimental observations.
The differences between numerical and experimental interpretations highlight the importance of carefully analyzing torque-turn plots. Typically, as seal surfaces make contact, the pin nose displaces inward, leading to the false assumption of immediate shoulder contact. The actual shoulder engagement is indicated later by a torque peak. Consequently, simulations may prematurely predict severe plastic deformation, which does not accurately reflect real-world connection behavior. Misinterpreting this phenomenon could lead to incorrect assessments of sealing performance in cyclic loading conditions.
The discrepancies between the results achieved by using different torque shoulder interference values speaks for the necessity of a Sensitivity Analysis on this matter.
Furthermore, the analysis of the full set of torque-turn plots gathered during the experimental phase reveals the influence of cone-to-cone seal geometries on seal interference. Contact between shoulder surfaces occurs in two phases: initial non-parallel contact followed by full uniform mating. This behavior aligns with the known tendency of cone-to-cone geometries to generate high contact pressure peaks at increased interference levels, which can contribute to surface wear and galling.
For Service Stage 1, simulation results at an interference level of 0.015 mm revealed significantly lower maximum stress compared to the 0.030 mm case. Additionally, the 0.030 mm interference scenario exhibits a more substantial loss of contact area throughout the loading process, further influencing seal performance. Initial simulations at 0.030 mm interference indicated a high degree of plasticization along the pin nose and surrounding seal area. While such deformation could result from excessive torque applied on the rig floor, it poses a risk to connection integrity over the service life of the joint. Over-torquing during Make-Up reduces contact pressure in seal areas compared to connections made with the manufacturer’s recommended optimum torque, leading to diminished sealing quality.
Service Stages 2 and 3 (Injection/Production): The numerical analysis of this stage was to assess the quality of MTM seal contact during service-induced tensile/compressive load cycling. In the simulation, the fully made-up connection model was subjected to five load cycles of alternating tensile and compressive forces at 80% VMS replicating field service conditions as depicted in Figure 13. The loading sequence followed these stages:
- MU to T-1: The simulation begins with the connection in “closed” (MU) state, applying a tensile load of 80% VMS.
- T-1 to C-1: The specimen then transitions to compressive loading, reaching 80% VMS.
- C-1 to MU-1 to T-2: The connection returns to the neutral Make-Up position before undergoing another tensile loading cycle at 80% VMS.

Figure 13.
Loading Sequence for the simulation of Service Stages 1 to 3.
Table 8 reports the contact pressure on the seal and shoulder regions for torque-shoulder interference values of 0.015 mm and 0.030 mm. Across Make-Ups (MU-0 to MU-4), the seal and shoulder contact stresses—and their effective contact area/length—decrease with each cycle and reach a stable response after MU-3.
Table 8.
Summarized evolution of contact pressure at the seal (left) and torque shoulder by load scenario. Magnitudes of both contact pressure and seal length in red (Modified after [17]).
Generally, the numerical analysis revealed that tensile loading has the greatest influence on the shoulder area, where a complete loss of initial contact pressure (421 MPa to 0 MPa) was recorded after the first tensile cycle, as shown in Table 9. Summarized evolution of contact pressure at the seal (left) and torque shoulder by load scenario. (Modified after [17]). In comparison, the seal area exhibited only a 9% decrease in contact pressure. Under compressive loading, the shoulder area showed slight sensitivity, with a marginal increase in pressure (+0.1%).
Table 9.
Overview of KPI Evolution during Cyclic Loading @80% VMS.
Contact length decreased at the shoulder surface under tensile loading but remained largely unchanged under compression. The seal surface, however, was less affected by combined loading. Overall, the most critical loading scenario was the second cycle of tensile loading at the shoulder surface, where a 57% reduction in contact pressure was observed—significantly greater than the 19.7% loss recorded in the seal area (Table 8). These findings emphasize the significant impact of tensile loading on connection performance, reinforcing the well-known susceptibility of pipe bodies to cyclic loading conditions. Notably, this conclusion applies even to proprietary gas-tight connections, which, despite their advanced design over standard API geometries, still exhibit similar weaknesses under extreme tensile loads.
4. Conclusions
A new casing connection prediction technique comprising on the integration of an experimental-numerical analysis and a newly developed testing rig was developed and run to assist on the study and prognosis of potential load scenarios leading to a loss of gas-tight connection integrity in function of damage at their sealing surfaces. This analysis suggests that surface roughness (Ra) evolution is a key predictive indicator of galling in test specimens.
The observed increase in Ra for damaged specimens, in contrast to the decreasing trend in damage-free samples, implies a potential link between manufacturing processes and surface degradation. The proposed mechanism—surface phosphating displacements during the Make-Up Process—points to material transfer between sealing surfaces as a contributing factor to galling and shall be considered as a potential side-effect of manufacturing, for which further investigations are required.
Both numerical and experimental approaches, as Table 8, Table 9 and Table 10 show, indicate that the performance of the connection stabilizes during the first two Make-Up Cycles (MU1-MU2). The observed stabilization of parameters like ovality and surface roughness suggests that early operating and handling conditions significantly influence long-term performance and the reduction of costs due to avoiding longer testing times due to the abovementioned stabilization on sealing surfaces making contact.
Table 10.
Key findings of both experimental and numerical analyses.
From the numerical analysis in Phase 2, the stability of seal contact pressure beyond Make-Up 2 supports the assumption that tensile loading governs seal integrity, particularly in applications like natural gas withdrawal or hydrogen injection, where thermodynamic effects play a role. The axial separation at seal surfaces under tensile loading presents an increased risk for connection seepage. This finding is consistent with observations made on deep geothermal operations.
Although the initial galling issue was mitigated through manufacturing adjustments, the combined experimental and FE results indicate that the threaded region still exhibits a sensitivity to galling under severe cyclic loading. This suggests that, while the immediate problem was resolved, galling remains a potential long-term risk factor that must be considered in connection design and qualification.
Table 11 summarizes the key metrics—peak seal and shoulder pressures and average leak rates—at state T2, the most critical condition due to cumulative prior loading. For the seal indicator, the case with 0.015 mm shoulder interference shows a value comparable to 0.030 mm. For the shoulder indicator, the 0.015 mm case exhibits a complete loss of shoulder contact, while the 0.030 mm case retains a small but non-zero value. Overall, a marked reduction in shoulder contact area is observed. However, consistent with Figure 12, the 0.015 mm case develops lower plastic strain than the 0.030 mm case.
Table 11.
Key metrics peak seal/shoulder pressures and average leak rates for the most critical load phase during both simulation and experimental analysis (Tensile Loading Cycle 2).
The last two columns on the right side of Table 11 present the leak rates measured for Sides A and B of the coupling specimen. These results correspond to the second tensile load cycle (T2), identified as the most critical loading condition through both experimental and numerical analyses, as illustrated in Figure 9. Although the leakage threshold of 0.9 mL/15 min was not exceeded at any stage of the experimental assessment, it is noteworthy that the average leak rate on Side B approached this limit, whereas the corresponding value on Side A remained lower. This behavior may be attributed to the influence of the tubular string’s self-weight on the sealability performance of the coupling in that region, an effect further amplified by the combined action of pure applied tensile loading and internal pressure during this phase of the experiment.
5. Future Work
Motivated by the findings from this experimental-numerical approach, the following future work is advised:
- As previously mentioned, and while the overall sealing performance of the connection evaluated were satisfactory, further testing on different connection geometries is deemed necessary to validate the findings and trends recorded during the execution of this experimental-numerical tool by testing different connection geometries, so that the results from this work can be translated to different MTM seal and thread designs, thus making the identification of similar performance trends more clear [73,74].
- Linked to the above-mentioned recommendation, the set of “Test-to-Failure” experiments is deemed advisable to investigate the limitations and advantages of different connection geometries under the conditions investigated on this work. In addition, the sensitivity of specific connection parameters can be better identified and further analyzed.
- An ongoing overhaul of the Hold Time Control System at the cyclic loading testing autoclave will enable longer testing times and longer variable hold times, which will be a factor favoring investigations under critical operating conditions. This will come in handy as soon as testing on hydrogen mixtures are deemed feasible with the current testing autoclave configuration.
- The refinement of a connection leakage prediction tool by linking a set of evaluation points provided by specific %VMS values originated from the analysis and impact of punctual downhole events (e.g., production, injection, workover, etc.) during the service lifetime of the wellbore will enable connection performance prediction to be more precise. For this purpose, more field data is to be collected and processed.
- The deployment and refinement of statistical analysis tools like, e.g., Taguchi-based approaches will help to further study the onset of galling at the MTM seal areas during testing.
Author Contributions
Conceptualization, J.M.P. and O.G.M.; Methodology, J.M.P., O.G.M. and J.H.B.; Investigation, J.M.P. and O.G.M.; Writing—original draft, O.G.M.; Writing—review & editing, O.G.M. and J.M.P.; Testing Facilities acquisition, J.H.B.; Simulation Resources, J.M.P. All authors have read and agreed to the published version of the manuscript.
Funding
This research received no external funding.
Data Availability Statement
The raw data supporting the conclusions of this article will be made available by the authors upon request.
Acknowledgments
We would like to thank Claudio Jouglard (Department of Civil Engineering, Universidad Tecnologica Nacional (UTN), Argentina) and Joachim Oppelt (Institute of Subsurface Energy Systems (ITE), TU Clausthal, Germany) for supervising the present work, for their valuable input during the conceptualization, draft review and final approval phases, as well as assisting with providing with both technical and technological resources to execute this research work.
Conflicts of Interest
The authors declare no conflicts of interest.
Abbreviations
The following abbreviations are used in this manuscript:
| API | American Petroleum Institute |
| API BTC | API Buttress Threaded Connection |
| API STC | API Short Thread Connection |
| BO | Break-Out |
| E&P | Exploration & Production |
| FEA | Finite Element Analysis |
| FMU | Final Make-Up |
| kN | kilonewton |
| kNm | kilonewton-meter |
| MTM | Metal-to-metal (seal) |
| MU | Make-Up |
| OCTG | Oilfield Country Tubular Goods |
| pintp_pint | applied internal pressure on the connection |
| pcp_cpc | nominal contact pressure at the cone-to-cone seal |
| Ra | Average Roughness |
| Rpm | Revolutions per Minute |
| Rz | Mean Roughness Depth |
| T&C | Threaded and Coupled |
| TPI | Threads per Inch |
| VMS | Von Mises Stress |
| ΔTorque | Delta Torque |
References
- Alsubaih, A.A.S.; Sepehrnoori, K.; Delshad, M.; Alsaedi, A. A Comprehensive Review of Well Integrity Challenges and Digital Twin Applications Across Conventional, Unconventional, and Storage Wells. Energies 2025, 18, 4757. [Google Scholar] [CrossRef]
- Rivenbark, M.; Themig, D.; Radtke, C.; Elliott, R.; Hindle, D.; Clyne, I. Deep Geothermal Well Completions: A Review of Downhole Problems and Specialized Technology Needs. In Proceedings, Thirty-Sixth Workshop on Geothermal Reservoir Engineering; Stanford University: Stanford, CA, USA, 2011; Available online: https://www.geothermal-library.org/index.php?mode=pubs&action=view&record=8007192 (accessed on 30 July 2025).
- ISO/PAS 12835; (TWCCEP)—Qualification of Casing Connections for Thermal Wells. International Standardization Organization: Geneva, Switzerland, 2013.
- Grijalva Meza, O.; Sinaga, S. Overview of Lubrication Regimes and Nominal contact pressure Distribution in Proprietary Tubular Connections for Special Drilling Environments. In Proceedings of the SPE/IADC Middle East Drilling Technology Conference and Exhibition, Abu Dhabi, United Arab Emirates, 29–31 January 2018; pp. 1–10. [Google Scholar] [CrossRef]
- Nicholson, J.E.; Snyder, R.E. Geothermal-Well Completions: A Survey and Technical Evaluation of Existing Equipment and Needs; Sandia National Laboratories, U.S. Department of Energy: Albuquerque, NM, USA, 1982; Report SAND82-7052. Available online: https://digital.library.unt.edu/ark:/67531/metadc1070708/ (accessed on 1 August 2025).
- Southon, J. Geothermal Well Design, Construction and Failures. In Proceedings of the World Geothermal Congress, Antalya, Turkey, 24–29 April 2005; Available online: https://www.geothermal-library.org/index.php?mode=pubs&action=view&record=8001355 (accessed on 31 July 2025).
- Axelsson, G.; Thórhallson, S.; Björnsson, G. Stimulation of Geothermal Wells in Basaltic Rock in Iceland. In Proceedings of the ENGINE Workshop 3, Zürich, Switzerland, 29 June–1 July 2006; Available online: https://www.researchgate.net/publication/242234259_Stimulation_of_geothermal_wells_in_basaltic_rock_in_Iceland (accessed on 1 August 2025).
- Jacobs, T. The Uncertain Bright Future of Underground Hydrogen Storage. J. Pet. Technol. 2023, 75, 24–30. [Google Scholar] [CrossRef]
- Inose, K.; Sugino, M.; Goto, K. Influence of Grease on High-Pressure Gas Tightness by Metal-to-Metal Seals of Premium Threaded Connections. Tribol. Online 2016, 11, 227–234. [Google Scholar] [CrossRef]
- Friðleifsson, G.Ó.; Elders, W.A.; Zierenberg, R.A.; Stefánsson, A.; Fowler, A.P.G.; Weisenberger, T.B.; Harðarson, B.S.; Mesfin, K.G. The Iceland Deep Drilling Project 4.5 km Deep Well, IDDP-2, in the Seawater-Recharged Reykjanes Geothermal Field in SW Iceland Has Successfully Reached Its Supercritical Target. Sci. Drill. 2017, 23, 1–12. [Google Scholar] [CrossRef]
- Tsang, C.F.; Mangold, D.C.; Lippmann, M.J. Simulation of Reinjection at Cerro Prieto Using an Idealized Two Reservoir Model. Geothermics 1981, 10, 357–379. Available online: https://www.geothermal-library.org/index.php?mode=pubs&action=view&record=1003579 (accessed on 12 August 2025). [CrossRef][Green Version]
- Gutiérrez Puente, H.; Ribó Muñoz, M. Reinjection Experiences in the Cerro Prieto Geothermal Field. Geotherm. Resour. Counc. Trans. 1994, 18, 261–267. Available online: https://www.geothermal-library.org/index.php?mode=pubs&action=view&record=1006990 (accessed on 14 September 2025).[Green Version]
- Klarner, J.; Schnideritsch, H.; Friess, B.; Kepplinger, J.; Horvath, B.; Haydl, R. Characterization of OCTG Material for the Application in Underground Hydrogen Storage Caverns. In Proceedings of the DGMK/ÖGEW Spring Conference “Exploring the Subsurface Potential—Make the Energy Transition Happen”, Celle, Germany, 31 May–1 June 2023; Available online: https://dgmk.de/en/event-programs/program-of-the-dgmk-oegew-spring-conference-2023/; https://dgmk.de/app/uploads/2023/03/04-Klarner.pdf (accessed on 9 August 2025).[Green Version]
- Gaffney Cline. Underground Hydrogen Storage. 2022. Available online: https://www.gaffneycline.com/sites/g/files/cozyhq681/files/202207/gaffneycline_underground_hydrogen_storage_article.pdf (accessed on 28 May 2023).[Green Version]
- Blackstone, J. Effects of Sliding Speed and Applied Load on Galling Resistance. J. Tribol. 1988, 110, 205–212. [Google Scholar] [CrossRef]
- Grijalva Meza, O. OCTG Advancements in Casing Drilling: Where We Have Been and Where Are We Going? In Proceedings of the SPE Oklahoma City Oil and Gas Symposium, Oklahoma City, OK, USA, 27–31 March 2017. Paper Number: SPE-185102-MS. [Google Scholar] [CrossRef]
- Grijalva Meza, O. Investigations on the Sealing Performance of Premium Connections under Cyclic Downhole Service Conditions. Ph.D. Thesis, Technische Universität Clausthal, Clausthal-Zellerfeld, Germany, 2025. [Google Scholar] [CrossRef]
- Grijalva Meza, O. Overview of Premium Threaded Connections and Assessment of their Galling Sensitivity. Master’s Thesis, Technische Universität Clausthal, Clausthal-Zellerfeld, Germany, 20 April 2015. [Google Scholar]
- Götzen, P. Zur Beanspruchung von Futterrohren in Dampfinjektionsbohrungen. Ph.D. Thesis, Institut für Tiefbohrtechnik, Erdöl- und Erdgasgewinnung (ITE), Technische Universität Clausthal,, Clausthal-Zellerfeld, Germany, 1986. [Google Scholar]
- Van Wittenberghe, J. Experimentele Analyse en Modellering Van Het Vermoeiingsgedrag Van Geschroefde Buisverbindingen. Ph.D. Thesis, University of Gent, Gent, Belgium, 2011. Available online: https://backoffice.biblio.ugent.be/download/1957168/4335755 (accessed on 3 August 2025).
- ISO 13679:2019; Petroleum and Natural Gas Industries—Procedures for Testing Casing and Tubing Connections. International Standardization Organization: Geneva, Switzerland, 2019.
- Chen, W.; Di, Q.; Zhang, H.; Chen, F.; Wang, W. The sealing mechanism of tubing and casing premium threaded connections under complex loads. J. Pet. Sci. Eng. 2018, 171, 724–730. [Google Scholar] [CrossRef]
- Xie, J.; Tao, G. Analysis of casing connections subjected to thermal cycle loading. In Proceedings of the Abaqus Users’ Conference, Providence, RI, USA, 24–27 May 2010; pp. 1–16. Available online: https://scispace.com/papers/analysis-of-casing-connections-subjected-to-thermal-cycle-4a6e90wo97 (accessed on 5 August 2025).
- Greenwood, J.A.; Williamson, J.B.P. Contact of Nominally Flat Surfaces. Proc. R. Soc. A 1966, 295, 300–319. [Google Scholar]
- Lorenz, B.; Persson, B.N.J. Leak-rate of seals: Comparison of theory with experiment. Europhys. Lett. 2009, 86, 44006. Available online: https://arxiv.org/pdf/0904.2988.pdf (accessed on 5 August 2025). [CrossRef]
- Grijalva Meza, O.; Sinaga, S. Zu den Tribosystemen von metallischen Dichtungen an Ölfeldrohren für Gasbohrungen: Theoretische-mathematische Einblicke und deren Einfluss auf kritische Ölfeldaktivitäten. In Proceedings of the 58th Tribologie-Fachtagung 2017—Reibung, Schmierung und Verschleiß, Göttingen, Germany, 25–27 September 2017; pp. 2–10. Available online: https://www.gft-ev.de/ (accessed on 3 August 2025).
- Xie, J.; Cam, M. Experimental Investigation of Metal-to-Metal Seal Behavior in Premium Casing Connections for Thermal Wells. In Proceedings of the SPE Canada Heavy Oil Technical Conference, Calgary, AB, Canada, 15–16 February 2017. [Google Scholar] [CrossRef]
- Garnier, A.; Saint-Marc, J.; Bois, A.-P.-P.; Kermanac’H, Y. An Innovative Methodology for Designing Cement-Sheath Integrity Exposed to Steam Stimulation. SPE Drill. Complet. 2010, 25, 117709. [Google Scholar] [CrossRef]
- Falcone, G.; Liu, X.; Okech, R.R.; Seyidov, F.; Teodoriu, C. Assessment of Deep Geothermal Energy Exploitation Methods: The Need for Novel Single-Well Solutions. Energy 2018, 160, 54–63. [Google Scholar] [CrossRef]
- Kamila, Z.; Kaya, E.; Zarrouk, S.J. Reinjection in Geothermal Fields: An Updated Worldwide Review 2020. Geothermics 2021, 89, 101970. [Google Scholar] [CrossRef]
- Duerden, H. Superior Geothermal Well. AU Patent 2011100069 A8, 24 February 2011. [Google Scholar]
- Reynolds, J.B. Ground Heat Steam Generator. U.S. Patent 3,274,769, 27 September 1966. Available online: https://patents.google.com/patent/US3274769A (accessed on 7 August 2025).
- Aguilera, R.; Rahimah, A.R. Evaluation and Optimization of EOR Huff-N-Puff Gas Injection in Vaca Muerta Shale. In Proceedings of the SPE/AAPG/SEG Unconventional Resources Technology Conference, Houston, TX, USA, 9–11 June 2025. [Google Scholar] [CrossRef]
- Xu, J.; Chen, Z.; Dong, X.; Zhou, W. Effects of Lean Zones on Steam-Assisted Gravity Drainage Performance. Energies 2017, 10, 471. [Google Scholar] [CrossRef]
- Faergestad, I.M. The Defining Series: Heavy Oil. In Schlumberger Oilfield Review; SLB: Houston, TX, USA, 2016; Available online: https://www.slb.com/resource-library/oilfield-review/defining-series/defining-heavy-oil (accessed on 8 August 2025).
- Statista. Installed Geothermal Energy Capacity by Country. 2020. Available online: https://www.statista.com/statistics/270251/installed-geothermal-energy-capacity-by-country/ (accessed on 26 April 2020).
- Kiemde, A.F.; Ferrando, N.; de Hemptinne, J.-C.; Le Gallo, Y.; Reveillère, A.; Pinto, J.S.R. Hydrogen and Air Storage in Salt Caverns: A Thermodynamic Model for Phase Equilibrium Calculations. Sci. Technol. Energy Transit. 2023, 78, 10. [Google Scholar] [CrossRef]
- Tischner, T.; Evers, H.; Hauswirth, H.; Jatho, R.; Kosinowski, M.; Sulzbacher, H. New Concepts for Extracting Geothermal Energy from One Well: The GeneSys-Project. In Proceedings of the World Geothermal Congress, Bali, Indonesia, 25–30 April 2010; Volume I.. Available online: https://www.geothermal-library.org/index.php?mode=pubs&action=view&record=8006427 (accessed on 9 August 2025).
- Hole, H. Geothermal Well Cementing. In IGA International Summer School on Direct Applications of Geothermal Energy; IGA: Amstelveen, The Netherlands, 2008; GRC No. 8005462; Available online: https://www.geothermal-library.org/index.php?mode=pubs&action=view&record=8005462 (accessed on 9 August 2025).
- Meza, O.G.; Berdasco, J.H.; Baptista, N.P.; Carvajal, C.P.; Oppelt, J. Technological Improvements in OCTG Premium Casing Connections and Advancements in Design Paradigms to Address the Challenges Present During the Exploitation of Unconventional Hydrocarbon Resources: A Critical Review. In Proceedings of the Abu Dhabi International Petroleum Exhibition & Conference: Society of Petroleum Engineers, Abu Dhabi, United Arab Emirates, 7–10 November 2016. Paper Number: SPE-183199-MS. [Google Scholar] [CrossRef]
- NORSOK D-010; Well Integrity in Drilling and Well Operations. Norsk Sokkels: Stavanger, Norway, 2013.
- Bundesverband Erdgas, Erdöl und Geoenergie e.V. Leitfaden Bohrungsintegrität; Bundesverband Erdgas, Erdöl und Geoenergie e.V. (BVEG): Hannover, Germany, 2021; Available online: https://www.bveg.de/wp-content/uploads/2021/09/BVEG-Leitfaden-Bohrungsintegritaet_Technische-Regel.pdf (accessed on 9 August 2025).
- Maruyama, M.; Tsuru, T.; Ryuichi, I.; Tochikawa, T. Allowable Torque of Tubular Connection Under Simulated Running and Working Conditions. In Proceedings of the SPE/IADC Drilling Conference, Amsterdam, The Netherlands, 28 February–2 March 1995. [Google Scholar] [CrossRef]
- Tsuru, E.; Maruyama, K.; Yazaki, Y.; Peters, E. Influence of Compound Grease on the Performance of Premium Connections. SPE Drill. J. 1990, 5, 71–78. [Google Scholar] [CrossRef]
- Maruyama, K.; Tsuru, E.; Ogasawara, M.; Inoue, Y.; Peters, E.J. An Experimental Study of Casing Performance Under Thermal Recovery Conditions. In Proceedings of the SPE California Regional Meeting, Bakersfield, CA, USA, 5–7 April 1989. [Google Scholar] [CrossRef]
- Ertas, A.; Carper, H.J.; Blackstone, W.R. Development of a test machine and method for galling studies. Exp. Mech. 1992, 32, 340–347. [Google Scholar] [CrossRef]
- Johnson, D.H.; Murtagian, G.R.; Fanelli, V.; Villasante, J.A.; Ernst, H.A. Sealability of Stationary Metal-to-Metal Seals. J. Tribol. 2004, 126, 591–596. [Google Scholar] [CrossRef]
- Pearson, C. The effect of temperature on wear and friction of a high strength steel in fretting. Wear 2013, 303, 622–631. [Google Scholar] [CrossRef]
- Stewart, F.; Le, H.; Williams, J.; Leech, A.; Bezensek, B.; Roberts, A. Characterisation of friction and lubrication regimes in premium tubular connections. Tribol. Int. 2012, 53, 159–166. [Google Scholar] [CrossRef][Green Version]
- Zabala, F. Influence of Roughness, Type of Lubricant and Coating on the Tribological Performance in the Seal Area of OCTG Threaded Connections. Ph.D. Thesis, Universidad Nacional del Sur, Buenos Aires, Argentina, 2015. Available online: https://repositoriodigital.uns.edu.ar/handle/123456789/2518 (accessed on 5 August 2025).[Green Version]
- Kaldal, G.; Jónsson, M.; Pálsson, H.; Karlsdóttir, S. Analysis of the Casing in a High Temperature Geothermal Well During Discharge. In Proceedings of the 37th Workshop on Geothermal Reservoir Engineering, Stanford, CA, USA, 30 January–1 February 2012; Stanford University: Stanford, CA, USA, 2012. Paper Number: SGP-TR-194. Available online: https://www.geothermal-library.org/index.php?mode=pubs&action=view&record=8008290 (accessed on 4 August 2025).[Green Version]
- Designolle, V. Hydrogen-Tight Connections for Underground Storage. Vallourec Smart Tubular Solutions. World Oil, Online Presentation. 2021. Available online: https://event.on24.com/wcc/r/3489957/02D3B98AFA4F2E8C6A3793026CA2F7E4?partnerref=Vallourec (accessed on 5 August 2025).[Green Version]
- Pereiras, J. Modeling of Failure in Threaded Connections for Gas and Oil Industry Applications due to Fatigue, Elasto-Plasticity, and Material Surface Treatments. Ph.D. Thesis, Universidad de Buenos Aires: Buenos Aires, Argentina, 2025; In Preparation. Available online: https://www.fi.uba.ar/investigacion/doctorado/tesis-defendidas (accessed on 4 August 2025).[Green Version]
- Uribe, J. Envoltórias Probabilísticas da Estanqueidade de Conexões de Revestimento de Pocos. Ph.D. Thesis, Universidade do Sao Paulo, São Paulo, Brazil, 2020. Available online: https://producaocientifica.eesc.usp.br/set/1238 (accessed on 2 August 2025).[Green Version]
- Assanelli, A.P.; Dvorkin, E.N. Finite Element Models of OCTG Threaded Connections. Comput. Struct. 1993, 47, 725–734. [Google Scholar] [CrossRef]
- Dvorkin, E.N.; Toscano, R.G. Finite Element Models in the Steel Industry: Part II—Analyses of Tubular Products Performance. Comput. Struct. 2003, 81, 575–594. [Google Scholar] [CrossRef]
- Sugino, M.; Nakamura, K.; Yamaguchi, S.; Daly, D.; Briquet, G.; Verger, E. Development of an Innovative High-Performance Premium Threaded Connection for OCTG. In Proceedings of the Offshore Technology Conference (OTC), Houston, TX, USA, 3–6 May 2010. Paper Number: OTC-20734-MS. [Google Scholar] [CrossRef]
- Guo, X.; Zhang, J.; Zhao, Z.; Liu, J.; Xu, H.; Su, X. Research on the Connection Performance of Variable Pitch of Screw Threaded Casing Based on 3D Finite Element Simulation Model. Appl. Mech. Mater. 2012, 215–216, 1105–1110. [Google Scholar] [CrossRef]
- Xu, H.; Shi, T.; Zhang, Z.; Shi, B. Loading and Contact Stress Analysis on the Thread Teeth in Tubing and Casing Premium Threaded Connection. Sci. World J. 2014, 2014, 287076. [Google Scholar] [CrossRef]
- Cui, F.; Li, W.; Wang, G.; Gu, Z.; Wang, Z. Design and Study of Gas-Tight Premium Threads for Tubing and Casing. J. Pet. Sci. Eng. 2015, 133, 208–217. [Google Scholar] [CrossRef]
- Zhu, W.; Liang, Y.; Zhao, L. Modeling Surface Roughness and Flow of Gases in Threaded Connections to Analyze Sealing Performance. Processes 2024, 12, 574. [Google Scholar] [CrossRef]
- Chintaginjala, H.V. Statistical Evaluation of Tribotechnical Parameters Impacting Wear Behaviour in Metal-to-Metal Seals on Casing Connections Intended for Thermal Service: A Comparative Approach. Master’s Thesis, Technische Universität Clausthal, Clausthal-Zellerfeld, Germany, 2019. Available online: https://dokumente.ub.tu-clausthal.de/content/index.xml (accessed on 3 August 2025).
- Ernens, D.; Peréz-Ràfols, F.; Van Hoecke, D.; Roijmans, R.F.H.; Riet, E.J.; Voorde, J.V.; Almqvist, A.; Rooij, M.B.; Roggeband, S.M.; Haaften, W.M.; et al. On the Sealability of Metal-to-Metal Seals with Application to Premium Casing and Tubing Connections. SPE Drill. Compl. 2019, 34, 382–396. [Google Scholar] [CrossRef]
- Wang, X.; An, B.; Xu, Y.; Jackson, R.L. The effect of resolution on the deterministic finite element elastic-plastic rough surface contact under combined normal and tangential loading. Tribol. Int. 2020, 144, 106141. [Google Scholar] [CrossRef]
- Karlsson and Sorensen Inc. 1989, ABAQUS Users Manual, Version 4-7-1; Hibbitt, Karlsson and Sorensen, Inc.: Providence, Rhode Island, 1989; pp. 23–32. Available online: https://search.worldcat.org/en/title/25562549 (accessed on 8 September 2025).
- Williamson, J.B.P.; Hunt, R.T. Asperity persistence and the real area of contact between rough surfaces. Proc. R. Soc. Lond. Math. Phys. Sci. 1972, 327, 147–157. [Google Scholar] [CrossRef]
- API Specification 5CT, 10th Edition. Available online: https://www.api.org/products-and-services/standards/important-standards-announcements/standard-5ct (accessed on 5 August 2025).
- Meyer, R.F.; Attanasi, E.D.; Freeman, P.A. Heavy Oil and Natural Bitumen Resources in Geological Basins of the World; U.S. Department of the Interior & U.S. Geological Survey: Reston, VA, USA, 2016; ISBN 978-1-2970-5310-8. Available online: http://purl.access.gpo.gov/GPO/LPS87698 (accessed on 2 August 2025).
- Humpries, M. North American Oil Sands: History of Development, Prospects for the Future; CRS Report for Congress, Congressional Research Services: Washington, DC, USA, 2008; Paper Number: RL34258; Available online: https://digital.library.unt.edu/ark:/67531/metadc96795/#:~:text=This%20report%20examines%20the%20oil%20sands%20resource%20base,impacts.%2030%20pages.%20Humphries%2C%20Marc%20January%2017%2C%202008 (accessed on 2 August 2025).
- Lorenz, B.; Persson, B.N.J. Leak-rate of seals: Effective medium theory and comparison with experiment. Europhys. Lett. 2011, 94, 54005. Available online: https://arxiv.org/pdf/0911.3019.pdf (accessed on 9 September 2025). [CrossRef]
- Fischer, F.J.; Schmitz, K.; Tiwari, A.; Persson, B.N.J. Fluid Leakage in Metallic Seals. Tribol. Lett. 2020, 68, 125. [Google Scholar] [CrossRef]
- Mou, Y.; Xie, Y.; Wei, F.; Zhao, H.; Han, L. Research on Thread Seal Failure Mechanism of Casing Hanger in Shale Gas Wells and Prevention Measures. Processes 2024, 12, 1253. [Google Scholar] [CrossRef]
- Yang, B.; Xu, H.; Xiang, S.; Zhang, Z.; Su, K.; Yang, Y. Effects of Make-Up Torque on the Sealability of Sphere-Type Premium Connection for Tubing and Casing Strings. Processes 2023, 11, 256. [Google Scholar] [CrossRef]
- Pereiras, J.M.; Grijalva Meza, O.; Oppelt, J.; Holzmann Berdasco, J.; Jouglard, C. Numerical and Experimental Assessments on the Performance of Gas-Tight Oilfield Tubular Connections under Cyclic Downhole Service Conditions. J. Tribol. 2025; in press. [Google Scholar] [CrossRef]


Disclaimer/Publisher’s Note: The statements, opinions and data contained in all publications are solely those of the individual author(s) and contributor(s) and not of MDPI and/or the editor(s). MDPI and/or the editor(s) disclaim responsibility for any injury to people or property resulting from any ideas, methods, instructions or products referred to in the content. |
© 2025 by the authors. Licensee MDPI, Basel, Switzerland. This article is an open access article distributed under the terms and conditions of the Creative Commons Attribution (CC BY) license (https://creativecommons.org/licenses/by/4.0/).