Abstract
Abnormal gas emissions are one of the main risk factors evoking coal mine gas accidents. How to accurately and efficiently predict gas emissions and identify the risk of gas anomalies has become a key issue in coal mine safety management. This study takes the Yuqia No.1 Mine of Qinghai Energy Group as the research object, collecting environmental variable data such as the gas emission quantity of the mining face, coal seam depth, coal seam thickness, coal seam gas content, temperature, wind speed, and respirable dust concentration. Multi-parameter data fusion, gray correlation degree analysis, least square support vector machine (LS-SVM), random forest (RF), back propagation neural network (BPNN), and other methods were adopted in this paper to explore the prediction accuracy and risk factors of mine gas emissions. The results show the following: (1) The correlation coefficients between coal seam depth, coal seam thickness, coal seam gas content, daily progress, daily output, and wind speed and gas emission quantity are 0.955, 0.975, 0.963, −0.912, 0.983, and 0.681, respectively, showing a significance level of 0.01, and are used as external input characteristic quantities for gas emission quantity prediction. (2) For the LS-SVM model, the root mean square error (RMSE) and mean absolute error (MAE) values on the training set were 0.015 and 0.012, respectively, while the corresponding test errors were 0.216 and 0.094, which represent the lowest among all models. The R2 values for the training and test sets were 0.993 and 0.951, respectively, indicating higher predictive accuracy compared to the other three benchmark models. (3) According to the comprehensive correlation degree, the top five factors that had a greater impact on the amount of gas emissions were, successively, as follows: coal seam thickness (0.8896), coal seam gas content (0.8849), daily output (0.6456), coal seam depth (0.6258), and wind speed (0.5578). The research results can provide a reference for high-precision prediction of gas emissions.
1. Introduction
In the field of coal mining, the significant losses caused by gas emission disasters constitute the main obstacles and difficulties in the production process [1]. With the increase in mining depth and intensity, geological conditions tend to become more complex, and the intensity of coal seam gas release significantly rises, which has a direct impact on the safe production and resource utilization of the mine. Gas emission quantity prediction technology, as a core measure for disaster prevention, can achieve advanced early warning of potential risks. Based on this, developing an accurate prediction model for gas emission quantity is of great significance for improving the level of disaster prevention and control.
The magnitude of gas emissions is determined by multiple factors such as the heterogeneous gas occurrence conditions of the coal seam and the dynamically changing mining progress. The interaction mechanism of these factors shows significant dynamic nonlinear characteristics. Therefore, by leveraging information technology and intelligent methods, accurately predicting the volume of gas emissions and identifying the causes of risks is not only an urgent need to solve the safety problems in mines but also an important support for promoting the green transformation of the energy industry. During the two sessions in 2025, the government work report further emphasized the need to “effectively prevent and resolve risks in key areas, and firmly hold the bottom line of no systemic risk” (People’s Daily Overseas Edition, 2025-03-07) [2]. The 14th Five-Year Plan emphasizes the construction of “intelligent and green” mines. Coal mine safety is the premise of transformation, and it is also an important yardstick to measure the degree of social civilization and governance ability. With the increase in coal mining depth, the gas content increases significantly, the mining environment becomes worse, and the risk of gas anomalies intensifies. Gas explosions, coal and gas outbursts, and other accidents are the main types of major coal mine disasters; gas-related accidents account for more than 30% and the mortality rate is high. Therefore, with the help of information fusion technology, the relevant monitoring data of gas emissions in underground coal mines are collected and summarized, and machine learning-related technologies such as neural network, random forest, and support vector machine are used to predict gas emissions and carry out risk identification, so as to find out the influencing factors. In the process of high-quality development, it is recommended to adhere to gradually reducing the risk of coal mines, avoid mass death and injury accidents, maintain social stability and family happiness, and provide scientific guarantee for supporting sustainable economic development and achieving the goal of “zero death” mines and “double carbon”.
Therefore, to address the technical bottleneck of a single sensor in assessing the complex and variable underground environment, this study focuses on the monitoring data of multi-parameter sensors and systematically conducts research from three aspects: information fusion, gas prediction, and risk identification. By collaboratively applying data mining, deep learning, and expert knowledge to analyze multi-source data, efforts are made to build a human–machine integrated prediction and recognition model, aiming to provide a solid model foundation and scientific decision-making basis for early warnings regarding mine gas safety.
1.1. Research on Information Fusion
Information fusion serves as the “nerve center” for intelligent coal mining and safe production. By breaking down data barriers and uncovering deep correlations, it provides technical support for risk prevention and control as well as efficient management. By integrating data from various sources such as gas concentration, wind speed, dust concentration, and equipment status, it eliminates information silos, enhances the system’s perception and response capabilities in complex coal mine environments, and conducts real-time assessment of gas explosion risks [3]. Chen et al. (2024) combined multi-sensor data fusion technology with the actual coal mine gas environment, determined the outburst warning indicators, and constructed a coal and gas outburst warning model based on multi-sensor information fusion [4]. Liu et al. (2025) established an Informer prediction model based on this multi-indicator system, enabling multi-step forecasting of gas concentration in the working face [5]. He (2019) selected the back propagation neural network (BPNN) to set up a gas outburst identification model, and then optimized it by improved particle swarm optimization (IPSO); then, the outputs of the optimized BPNN were taken as the identification results and used to establish a feature database [6]. By combining the matter–element cloud model (MECM) with improved Dempster–Shafer evidence theory, Zhang et al. (2022) proposed a novel regional outburst prediction approach based on the spatial distribution of risk index [7]. Zhang et al. (2025) designed a context information fusion module MSSFPN based on FPN, which was established on deep feature maps and fused image features in the scale dimension to enhance the feature representation of the target [8]. Feng (2019) believed that multi-source information fusion technology could be utilized to extract and comprehensively characterize key risk factors from multi-sensor data underground, thereby achieving the prediction of gas outburst disasters [9]. Hong (2023) [10] utilized entropy-weighted data fusion technology to perform data-level fusion and verification on the gas concentration data of the upper corner, working face, and return airway. The results indicated that the fused gas concentration could better reflect the gas concentration in the mining area as a whole [10].
This technical approach aims to enhance system reliability through multi-dimensional data fusion and joint analysis of various monitoring information, thereby obtaining more accurate and stable gas concentration data, and ultimately laying a solid foundation for precise prediction and scientific decision-making of gas emission quantity. Furthermore, with the in-depth application of Internet of Things, AI, and 5 G technologies, information fusion will further drive the transformation of mines from “passive response” to “active prevention”, becoming the core driving force for safeguarding the lives of miners and the sustainable development of resources.
1.2. Research on Gas Prediction
Coal mine gas prediction is a core technology for ensuring the safe production of mines. China started its research and application in the field of gas disaster prevention and prediction relatively early, and has made remarkable progress in theoretical exploration and technological development. In recent years, with the development of technologies such as deep learning, this field is shifting from traditional experience-based judgment to precise, intelligent and proactive early warning. Zhao et al. (2025) presented a methodology for 3D implicit geological modeling and visualization using Gempy and PyVista libraries, as well as gas prediction and distribution based on the Scikit-learn library [11]. He et al. (2025) proposed a new prediction method to improve the accuracy of prediction coal mine gas concentration, which combined Variational Mode Decomposition (VMD) with Long Short-Term Memory (LSTM) to mitigate the impact of the complexity on prediction accuracy [12]. Liu et al. (2024) proposed a gas emission prediction model based on Kernel Principal Component Analysis (KPCA), an Improved Crow Search Algorithm (ICSA) incorporating adaptive neighborhood search and support vector regression (SVR) [13]. Aiming at the problems of numerous influencing factors, strong nonlinear characteristics, and time correlation, Lin et al. (2024) applied feature selection methods based on Recursive Feature Elimination with Cross-Validation (RFECV) [14]. The RFECV method embedding two base models, Ridge Regression (Ridge) and random forest (RF), obtained four gas emission prediction multifactor combinations. Taking coal samples from Luling mine in Huainan and Huaibei mining areas as the research object, Yang et al. (2025) established a prediction model on the failure risk level of gas-bearing coal based on the convolutional random vector function connection network (CRVFL) [15]. Liang et al. (2025) took a mining face in Shanxi Province as the research object and investigated the prediction performance by recalling rate (TPR), false positive rate (FPR), mean absolute error (MAE), and mean absolute percentage error (MAPE) [16].
Overall, the current research on coal mine gas prediction shows the following significant trends:
- (1)
- Highly refined and integrated models. Researchers are no longer content with a single model but, through the integration and optimization of multiple intelligent algorithms, build customized hybrid models for different specific tasks such as gas concentration prediction, emission volume prediction, and outburst hazard prediction, in pursuit of ultimate prediction accuracy and efficiency [17].
- (2)
- The technical path has shifted from “indirect” to “direct”. Traditional methods mostly rely on monitoring underground environmental parameters for reverse inference. The latest excavation and exploration technology is a direct and active geological perspective method, which can identify the geological conditions of gas enrichment from the source and achieve a breakthrough in intrinsic safety early warning [18].
- (3)
- Research and application are closely integrated. Many advanced models and technologies have been tested and applied in actual mining areas, achieving excellent results in quantitative verification, demonstrating the rapid process from theoretical research to productivity transformation [19].
1.3. Research on Risk Identification of Gas Emissions
Gas outburst usually takes two basic forms. One is an ordinary outburst, which is a relatively slow and uniform release, accounting for more than 90% of the total daily gas release. The other is called an abnormal outburst, which is sudden and destructive. By revealing the spatiotemporal evolution mechanism of gas outburst and combining it with intelligent monitoring and prediction technology, the risk of gas accidents can be significantly reduced and the utilization of gas resources can be promoted. Given that the factors influencing gas outburst are diverse, such as geological factors, mining methods and intensities, ventilation conditions, etc., Jiao et al. (2024) analyzed the influencing factors of gas emissions in a working face from three aspects: initial gas conditions, coal seam geological conditions, and mining conditions [20]. Chen et al. (2024) used the Intrinsic Sympathomimetic Activity–Generalized Mean–Back Propagation Neural Network (ISA-GM-BP) method to explore the correlation between gas emissions and 13 influencing factors such as coal seam depth, coal seam inclination, coal seam spacing, gas content, and daily output [21]. Huang (2023) analyzed the influencing factors of absolute gas emissions in a mining face by using Gray Relation Analysis (GRA), and selected the influencing factors with high correlation degree as the input values of the model [22]. Liu et al. (2025) concluded that the gas emission quantity of a borehole was positively correlated with the original gas pressure, pore permeability coefficient, and fracture permeability coefficient, and negatively correlated with the matrix radius [23]. By analyzing the historical gas emission time series data, Geng et al. (2025) decomposed the gas emission sequence using Variational Mode Decomposition (VMD) and reconstructed the component prediction results to obtain the predicted value of gas emissions [24]. Bao’s research shows that the extraction rate, coal seam depth, daily production, gas content in adjacent layers, and coal seam thickness have a significant impact on gas emissions [25] (Bao et al., 2025).
To sum up, relevant scholars at home and abroad have conducted a lot of research on the prediction and analysis of the influencing factors of coal mine gas emissions. However, there are still limitations in the multifactor coupling mechanism of coal mine gas emissions and the characteristics of the small-sample data of gas emissions. Based on this, this paper extracts the main influencing factors that induce coal mine gas emissions through field exploration, text mining, and referring to the Coal Mine Safety Regulations (2022 edition), and adopts the Pearson correlation coefficient method to solve the problem of difficult feature selection of the prediction model. Then, the least square support vector machine model, BP neural network, random forest, and other prediction models are used to predict the gas emissions of the mining face, and the optimal prediction accuracy is identified by comparative analysis. Finally, on the basis of the prediction model, the key risk factors are identified by the generalized gray correlation degree to provide decision-making support for the pre-control of coal mine gas disaster risk.
2. Materials and Methods
2.1. Basic Overview of the Mine
The No.1 Well of Yuqia of Qinghai Energy (Development) Group Co., Ltd. is about 50 km away from Dachaidan Town, 240 km away from Delingha City, 245 km away from Golmud City to the south, and 220 km away from Lenghu Town to the west. It is 125 km away from Xitieshan Station of the Qinghai–Tibet Railway in the southeast. National Highway 315 (Qinghai–Xinjiang Highway) and National Highway 215 (Dunhuang–Golmud Highway) intersect and pass through the mining area, providing convenient road transportation conditions. The principle of the coal seam mining sequence is to mine the upper layer first to protect the lower layer. According to the mining sequence of the mining area, the succession principle, the location of the mine shaft, and the layout of the underground development roadways, the first mining area includes the first and second mining areas with the lowest underground development engineering volumes. The succession principle of the mining area is to follow the sequence of the panel first and then downhill, and to move from near to far. The coal seam mining sequence in each mining area is from the upper layer to the lower layer in sequence, and the same coal seam is mined from the upper section to the lower section in sequence. The ventilation mode of the mine is zonal, and the ventilation method is mechanical exhaust. The ventilation of the tunneling face is all local fan pressure ventilation. The charging room and the explosive material distribution room adopt independent return air, and other chambers are all arranged in the fresh air flow to form natural ventilation. According to the “2022 Annual Mine Gas Grade Appraisal Report of Qinghai Energy Yuqia Co., Ltd.”, submitted by China Inspection Group Gongxin Safety Technology Co., Ltd., the relative gas emission quantity of Yuqia No.1 Well from 2019 to 2022 was 1.9 m3/t, 1.6 m3/t, and 1.22 m3/t, respectively.
2.2. Research Method
2.2.1. Least Squares Support Vector Machine
LS-SVM is an improved version of traditional SVM, which was proposed by Suykens et al. in 1999 [26]. By simplifying the form of the optimization problem, the inequality constraints in the traditional SVM are transformed into equality constraints, and the loss function is replaced by the least squares error, so that the problem is transformed into the solution of linear equations, which significantly reduces the computational complexity. LS-SVM can solve practical problems such as small samples, nonlinearity, and local minima. Specific calculation steps reference Zhou et al. (2022) and Wang et al. (2025) [27,28].
2.2.2. BP Neural Network Prediction Method
BP neural network is a multi-layer feedforward neural network based on the error back propagation algorithm, which was proposed by Rumelhart et al. in 1986 [29]. It is one of the most classic and widely used models in artificial neural networks. It is suitable for classification and regression tasks, especially in nonlinear problems. In practical applications, attention should be paid to data preprocessing, network structure design, and hyperparameter tuning (such as learning rate and hidden layers). For specific calculation steps, refer to the study of Zhao et al. (2021) [30].
The forward learning process of the BP neural network is that the original sample starts from the input layer p, passes through the hidden layer T, and finally passes to the output layer q. The mathematical model of the three-layer BP neural network p-T-q is:
In Formulas (1) and (2), i = 1,2,…,p; j = 1,2,…,T; k = 1,2,…,q; and Uj and Uk are the output models of the hidden layer and the output layer, respectively. are the activation functions; wij and wjk are the weights between the input layer and the hidden layer and the hidden layer and the output layer, respectively; θj is the threshold of hidden layer nodes; ak is the threshold of the output layer; and xi is the output value of the input layer node i.
The error back propagation achieves the expected error range by adjusting the weights and thresholds between the neurons in each layer, and ek is the network prediction error. is the learning rate, and the weights and thresholds of the output layer and the hidden layer correction are:
2.2.3. Random Forest
Random forest is an ensemble learning algorithm based on decision trees, which was proposed by Breiman in 2001. It improves the generalization ability of the model by constructing multiple decision trees and voting (classification) or averaging (regression), while reducing the risk of overfitting. Random forests are widely used in classification, regression, and feature selection tasks due to their high efficiency, robustness, and ease of use. Their core advantages are dual randomness and parallel training, which are suitable for processing small- and medium-sized structured data (Volpiani. 2024) [31].
2.2.4. Gray Relational Analysis
The correlation coefficient is used to describe the degree of difference between sequences. represents the relative difference between the -th index of the subsequence and the corresponding index of the reference sequence . The expression is:
In Formula (7), , is the resolution coefficient, usually 0.5; is the maximum absolute value of the difference between all sequences at all times and the corresponding time of the reference sequence; and similarly, is the minimum absolute value [32].
Because the correlation coefficient is too discrete, it is not easy to consider the relative size, so the weighted calculation index gray comprehensive correlation degree is:
3. Results
3.1. Extraction and Characteristic Analysis of Influencing Factors of Gas Emission Quantity
3.1.1. Factor Extracting
There are various reasons for gas emissions in coal mines. The prevention and control measures taken by enterprises are mainly based on expert experience. However, different coal mines have different production conditions and characteristics, and a large number of historical records have been accumulated for reference in the production process. Therefore, when analyzing the causes of coal mine gas emission accidents, it is necessary to consider and combine the knowledge system of coal mine gas safety prevention and control in many aspects to form a multi-dimensional accident cause.
Under normal circumstances, coal mine gas is released from the adsorption state to the roadway and becomes free gas. Gas will diffuse with the law of gas circulation in the air, and the gas concentration will continue to change with the airflow. When the gas emission becomes larger and the ventilation in the roadway is insufficient, it is easy to cause gas accumulation, resulting in gas overrun, and even gas outburst accidents, resulting in coal mine shutdown. Therefore, in this state, in order to ensure the safety of underground production in coal mines, coal mining enterprises have installed sensors at different measuring points in coal mines to collect monitoring data of different indicators in coal mines, such as gas concentration, temperature, wind speed, and so on. Due to the complex and changeable underground environment of coal mines, the underground index of coal mines changes dynamically with time. According to the objective law of continuous change in things, this study selects the measured data of sensors at each measuring point of a coal mine underground mining face for modeling and analysis.
To clarify the physical mechanism and causal relationship influencing the gas emission quantity in the mining face, Figure 1 presents a schematic diagram of the typical ventilation and gas drainage system involved in this study. As shown in the figure, gas emerges from the coal face, fallen coal, and goaf, with its intensity jointly controlled by geological factors (such as coal seam thickness and original gas content) and mining factors (such as the advancing speed). The dilution and carrying effect of the air flow on the gas and the active removal effect of the gas drainage system on the gas jointly determine the final gas concentration in the return air flow, which is the prediction target of this model. Therefore, this prediction model is essentially a data-driven high-precision mapping and quantification of the complex physical process illustrated in the figure.
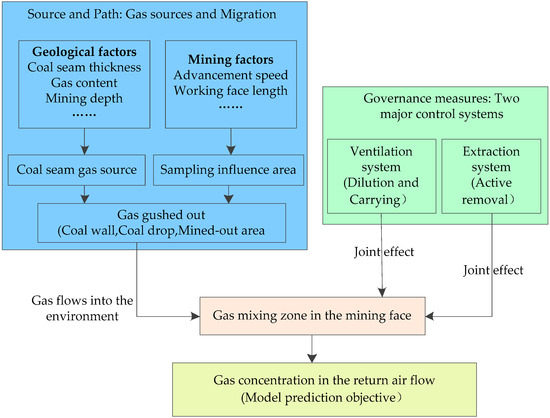
Figure 1.
Schematic diagram of the ventilation and gas drainage system in the mining face.
Based on the literature research and an actual investigation, the experimental data of this paper are derived from the 44,205 mining faces of a certain coal mine in Qinghai Province. The environmental variable data such as the gas emission quantity at multiple measurement points, coal seam depth, coal seam thickness, coal seam gas content, coal seam spacing, temperature, wind speed, and respirable dust concentration of the mining face of this mine are selected [33,34,35]. In addition, the daily output is closely related to the mining intensity. Generally, the higher the daily output, the greater the mining intensity, which will increase the gas emission quantity. Therefore, the daily progress and daily output indicators are also selected [36,37]. The time span is from 7 October 2024 to 24 October 2024, with a total of 18 sets of data. The sample data are shown in Table 1. The variables are defined as follows: X1 denotes coal seam depth (unit: m); X2 denotes coal seam thickness (unit: m); X3 denotes coal seam gas content (unit: m3/t); X4 denotes coal seam spacing (unit: m); X5 denotes daily progress (unit: m/d); X6 denotes daily production output (unit: t/d); X7 denotes temperature (unit: ℃); X8 denotes wind speed (unit: m/s); X9 denotes dust concentration (unit: mg/m3); and Y denotes relative gas emission quantity (unit: m3/t).

Table 1.
Data sample of influencing factors of gas emission quantity.
The entropy method is used to calculate the weight of each index, as shown in Table 2.
Table 2.
Entropy method used to calculate the weight results.
3.1.2. Feature Analysis
In order to clarify the relationship between gas emission and coal seam depth, seam thickness, dust concentration, and other variables, nine risk factors in Table 2 are taken as independent variables, and gas emission Y is taken as a dependent variable. Linear fitting analysis is carried out on each variable and dependent variable to measure the correlation coefficient. The specific fitting results are shown in Figure 2.
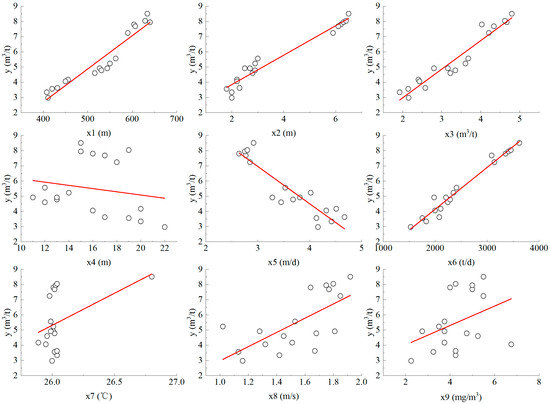
Figure 2.
Fitting image of gas emissions in coal mine.
It can be intuitively seen from Figure 2 that the linear relationship between coal seam spacing X4, temperature X7, dust concentration X9, and gas emissions is not obvious. Therefore, the Pearson correlation coefficient was used to study the correlation between gas emissions and nine environmental variables such as coal seam depth, coal seam thickness, coal seam gas content, coal seam spacing, temperature, wind speed, and respirable dust concentration, and thermal maps were used to describe the correlation strength. The details are shown in Figure 3.
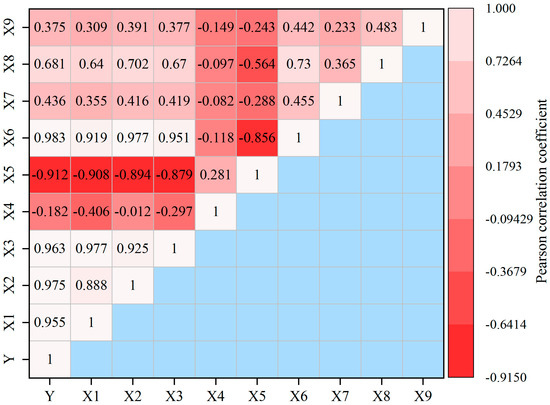
Figure 3.
Pearson correlation coefficients between features.
As shown in Figure 3, the correlation coefficients between the gas emission quantity Y and the coal seam depth X1, coal seam thickness X2, coal seam gas content X3, daily output X6, and wind speed X8 are 0.955, 0.975, 0.963, 0.983, and 0.681, respectively, all showing significant correlations at the 0.01 level, indicating a significant positive correlation between the gas emission quantity and the coal seam depth, coal seam thickness, coal seam gas content, daily output, and wind speed. The correlation coefficients between the gas emission quantity Y and the coal seam spacing X4, temperature X7, and dust concentration X9 are relatively small, with corresponding p-values of 0.471, 0.070, and 0.125, respectively, all greater than 0.05, indicating no correlation. The correlation coefficient between the gas emission quantity Y and the daily progress X5 is −0.912, showing a significant negative correlation at the 0.01 level. Based on the results of the correlation coefficient analysis, six features, namely coal seam depth X1, coal seam thickness X2, coal seam gas content X3, daily progress X5, daily output X6, and wind speed X8, are selected as the external input feature quantities for gas emission quantity prediction.
3.2. Prediction Result Analysis
3.2.1. Model Parameter Settings
The BP neural network, support vector machine, LS-SVM, and random forest were, respectively, applied to predict the gas emission quantity of the case mine, and then the prediction results and performance evaluation indicators were compared [38,39]. The training set ratio was initially set at 0.8, the number of decision trees in the random forest was 100, and the node splitting criterion was squared_error. The main parameter settings of the neural network were as follows: activation = ‘relu’, alpha = 1.0 × 10⁻⁴, learning_rate_init = 0.001, batch_size = ‘auto’, hidden_layer_sizes = (100), max_iter = 200, solver = ‘adam’, tol = 1.0 × 10⁻⁴, max_depth = None, min_samples_leaf = 1, min_samples_split = 2, n_estimators = 100, bootstrap = True, oob_score = True, and max_features = ‘auto’. The kernel width coefficient range of LSSVM was [0.01, 300] and the penalty factor range was [0.01, 200], which was further optimized by cross-validation to balance the complexity and error of the model.
Given the limited sample size of this study (n = 18), to avoid the high variance risk brought about by the segmentation of single data, a robust validation strategy was adopted for model evaluation and hyperparameter selection. Firstly, the generalization performance was evaluated by the leave-one-out cross-validation (LOOCV) method. Secondly, to conduct a fair model comparison, hyperparameter optimization was carried out through nested cross-validation, where the inner loop performed five-fold cross-validation to search for the optimal parameters, and the outer loop used the one-retention method to obtain the final performance index distribution (such as root mean square error and coefficient of determination). This process effectively reduced the risk of overfitting and ensured the credibility of the results.
Root mean square error (RMSE), mean absolute error (MAE), and R2 were selected as the error evaluation indexes of the gas emission prediction model [40]. The specific expressions are as follows:
In Formulas (9)–(11), n represents the number of test set samples; yi represents the predicted value of gas concentration; and is the actual value. The smaller the RMSE and MAE values, the higher the accuracy of the gas concentration prediction model, that is, the better the prediction effect of the model. The degree of fitting of R2 to data indicates that the larger the value is, the better the fitting effect is.
In summary, to mitigate the instability of results arising from a single training test split in small-sample datasets, this study employed a stratified validation framework.
For the final assessment of model performance, leave-one-out cross-validation was implemented. Rather than partitioning the dataset into fixed training and test subsets, LOOCV iteratively designated each individual sample as the test instance while utilizing the remaining samples for model training. This procedure was repeated until every sample was predicted exactly once. The overall generalization performance of the model was then evaluated based on aggregated performance metrics—such as root mean square error (RMSE) and coefficient of determination (R2)—computed across all prediction rounds.
With regard to hyperparameter optimization, in each LOOCV training iteration, if parameter tuning was required (e.g., grid search for least squares support vector machine, LSSVM), k-fold cross-validation was applied within the current training subset. This constituted the inner loop of a nested cross-validation scheme, which ensured that hyperparameter selection remained entirely independent of the held-out test sample in each LOOCV fold, thereby preventing data leakage and preserving the validity of performance estimation.
3.2.2. Gas Concentration Prediction Result Analysis
To evaluate the stability of the LSSVM model, comparative experiments were carried out using three alternative machine learning models: random forest, BP Neural Network, and support vector machine. Each model was trained over ten iterations, and the deviations of the prediction evaluation metrics were computed. Table 3 summarizes the comparative results of the evaluation metrics across the four models. In the field of machine learning, the performance of a predictive model is primarily assessed by its test error, which reflects the model’s ability to generalize to unseen data. Hence, the objective is typically to identify the model with the lowest test error. As indicated in Table 3, the LSSVM model achieved RMSE, MAE, and R2 values of 0.216, 0.094, and 0.951, respectively, outperforming all other models in each metric. This demonstrates that the LSSVM model is more capable of capturing the dynamic characteristics and underlying trends within the dataset. Furthermore, the evaluation metric deviations of the other three models were consistently higher than those of the LSSVM model, confirming its superior accuracy and stability in gas emission forecasting.
Table 3.
Model error values.
Based on the existing data, the relative error values between the predicted values and the true values of the four models are calculated, as shown in Table 4 and Figure 4. In Table 4, RE represents relative error and APE represents absolute percentage error. Through Figure 4, it can be seen intuitively that the change trend of the support vector machine prediction model is the most significant, followed by BP neural network, random forest, and LS-SVM. The specific reason is that the decision boundary of support vector machine depends on the support vector, which struggles to explain the importance of features intuitively, especially when nonlinear kernel is used. When the category sample size difference is large, the SVM may be biased towards the majority class, resulting in a large prediction error.
Table 4.
Model relative error.
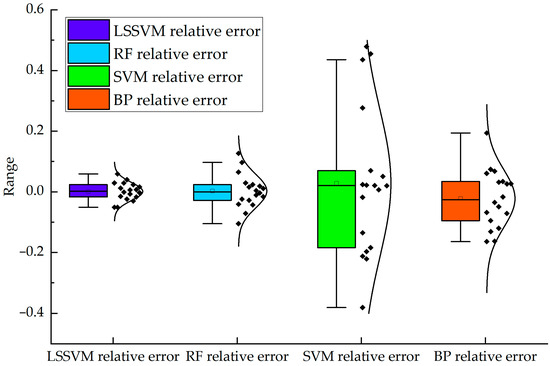
Figure 4.
Comparison chart of relative error of gas emission quantity.
To further demonstrate the prediction accuracy of different models, this study also adopted the calculation method of the mean absolute percentage error (MAPE). MAPE is an indicator for evaluating the accuracy of predictive models, and its calculation involves the difference between actual values and predicted values. The following are the detailed calculation steps:
- (1)
- Calculate the absolute percentage error (APE) for each data point. The APE is the absolute value of the difference between the actual value and the predicted value divided by the actual value. The formula is APE =|(X − Y)/X|, where X is the measured value and Y is the simulated value.
- (2)
- Calculate the average of all APEs. Add up the APE of each data point and then divide by the total number of data points N. The formula is average APE = (∑APE)/N.
- (3)
- Multiply the average APE by 100 to obtain the final result of MAPE. The formula is MAPE = average APE ∗ 100%.
Since MAPE directly measures the magnitude of prediction errors, the smaller the value, the more accurate the prediction. As shown in Table 4, through mutual verification of relative error and mean absolute percentage error, the MAPE of LS-SVM is 0.023, that of RF is 0.041, that of BP is 0.079, and that of SVM is 0.178. Therefore, the prediction accuracy of LS-SVM is the best.
For the BP neural network model, in the actual operation process, the more data there is, the higher the accuracy of the prediction results will be. The data volume in this paper belongs to a small sample, so the advantages of the model are limited and the prediction accuracy is reduced. Random forest is susceptible to random interference for samples with less data (such as <100 samples) [41]. LS-SVM reduces the computational complexity and improves the solution speed and anti-interference ability. The relative error of the model is the smallest and the stability is the highest, indicating that the LS-SVM model can significantly improve the prediction accuracy of the gas emission quantity in the case coal mine [42].
As illustrated in Figure 4, with respect to distribution position, the relative errors of the predicted values from the LSSVM model are approximately symmetrically distributed around the Y = 0 line, in contrast to those of the random forest, support vector machine, and BP neural network models. This suggests the absence of significant systematic bias in the LSSVM model. In terms of dispersion, the majority of error points for the LSSVM model lie within the ±10% range, indicating consistently high prediction accuracy under most conditions. By comparison, the other three models exhibit a small number of outliers, with relative errors exceeding ±20%.
The comparison results between the actual value and the predicted value of gas emission quantity are shown in Figure 5. The predicted value of the LS-SVM model curve is more in line with the actual value, and the graph overlap degree is higher, which is significantly better than the prediction accuracy of random forest, BP neural network, and support vector machine. Therefore, for the prediction of gas emission quantity in the mining face of the case coal mine, LS-SVM can be given priority.
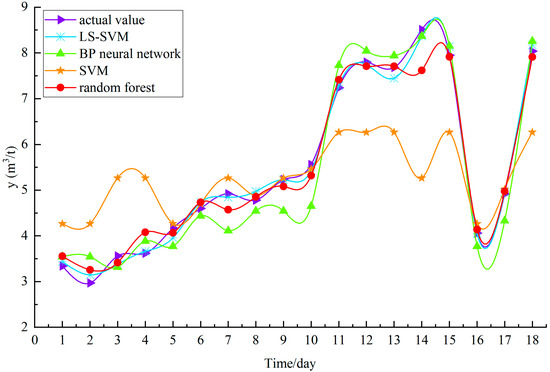
Figure 5.
Comparison results of actual value and predicted value of gas emission quantity.
3.3. Risk Identification of Gas Emission Quantity
According to the correlation degree Formulas (7) and (8) in the previous text, we calculate the correlation degree between the nine risk factors, such as coal seam depth, coal seam thickness, temperature, wind speed, and dust concentration, and the gas emission quantity Y. Generally speaking, the larger the correlation coefficient, the stronger the correlation between the independent variable and the dependent variable. Based on the difference in the correlation degree values, we sort the nine risk factors in descending order of the comprehensive correlation degree, and accordingly select the risk factors that have a greater impact on the gas emission quantity of the 44,205 mining faces of a certain coal mine in Qinghai Province. The comprehensive correlation degree is shown in Table 5 and Figure 6.
Table 5.
Gray correlation degree of risk factors.
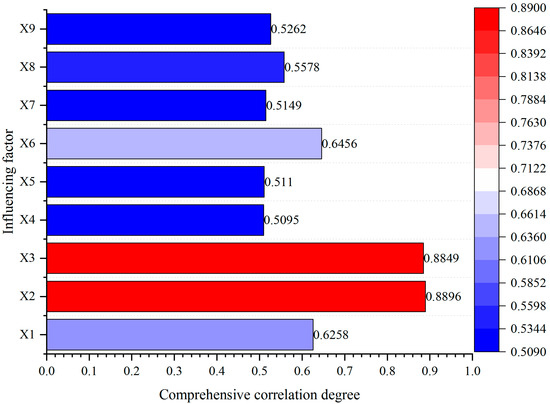
Figure 6.
Comprehensive correlation degree.
As shown in Table 5 and Figure 6, the comprehensive correlation degree values range from 0 to 1. The correlation degrees between the nine risk factors X1 to X9 and the gas emission quantity Y are 0.6258, 0.8896, 0.8849, 0.5095, 0.5110, 0.6456, 0.5149, 0.5578, and 0.5262, respectively. The larger the comprehensive correlation degree value, the stronger the correlation between the evaluation item and the gas emission quantity, and the greater the influence. For the case coal mine enterprise, the correlation coefficients between the coal seam thickness X2, the coal seam gas content X3, the daily output X6, and the coal seam depth X1 and the gas emission quantity are the largest, indicating that these four variables have the greatest impact on the gas emission quantity of the coal mine. The correlation degrees of the coal seam spacing X4, the daily progress X5, the temperature X7, and the dust concentration X9 are relatively small, which is consistent with the results obtained from the Pearson correlation coefficient in the previous text. Therefore, when coal mine enterprises prevent and avoid gas accidents, they should focus on exploring the causes of abnormal gas emissions, clarify the evolution laws of gas emissions, take precautions, make accurate predictions, further avoid and prevent gas accidents, and ensure the safety of miners’ lives.
4. Discussion
This study aims to systematically evaluate the modeling performance of BP neural network (BPNN), support vector machine (SVM), random forest (RF), and least squares support vector machine (LSSVM) in predicting the gas emission quantity in mines, and to compare the predictive capabilities of each model. The research results show that all four models have certain predictive capabilities, but there are significant differences in prediction accuracy, model stability, and computational efficiency. Overall, LSSVM performs best in all evaluation indicators, demonstrating its stronger applicability and reliability in the task of gas emission quantity prediction.
- (1)
- In terms of model performance, LSSVM outperforms other models in key evaluation metrics such as R2, RMSE, and MAE. The ranking of prediction accuracy for the four models is approximately as follows: LSSVM > RF > BPNN > SVM. SVM, based on the principle of structural risk minimization, has a good generalization ability under small-sample conditions, but its performance is highly dependent on the selection of kernel functions and hyperparameters, and its computational complexity is relatively high when the sample size is large. It is also sensitive to noise and missing data. Although BP neural networks have strong nonlinear fitting capabilities, they are prone to getting stuck in local minima, have unstable training processes, have slow convergence speeds, and have a high risk of overfitting. In this study, BPNN showed significant prediction volatility, which may be related to its parameter initialization method and local convergence characteristics. Random forest effectively reduces model variance and improves prediction stability through the Bagging integration strategy and random feature selection mechanism. LSSVM simplifies the traditional quadratic programming problem into solving a system of linear equations by converting inequality constraints into equality constraints, significantly improving training efficiency while retaining the excellent generalization performance of SVM. Additionally, this study used the above four models to conduct importance score analysis on input variables such as coal seam thickness, coal seam gas content, daily output, and coal seam depth. The results showed that X2 and X3 are the key factors affecting gas outflow, which is highly consistent with the actual experience and theoretical understanding of the mine, further verifying the reliability of the model and providing a scientific basis for gas prevention and control work.
- (2)
- The conclusion of this study is consistent with the research results of Zhang Jie (2025) [43] and Sheng Wu (2025) [44], all indicating that machine learning models (such as SVM, RF, TSA-MLP, and XGBoost-SHAP) outperform traditional mathematical models in the field of gas prediction. However, contrary to the conclusion of “SVM being the best” proposed by Cheng Xiaoyu (2022) [45] and Zheng Xiaoliang (2021) [46], this study finds that LSSVM has more advantages in terms of prediction accuracy and computational efficiency. This difference may stem from the larger dataset, more refined data preprocessing methods, and optimized hyperparameter settings adopted in this study, further highlighting the superior performance of LSSVM in specific application scenarios.
- (3)
- This study confirmed the practical application value of high-precision machine learning models such as LSSVM and RF in the prediction of gas emission quantity. Integrating such models into the mine safety monitoring system can help achieve real-time monitoring and early warning of gas risks, providing scientific decision support for ventilation control, gas drainage, and other prevention and control measures, thereby effectively preventing gas over-limit accidents and ensuring the safety of miners and the production efficiency of the mine.
- (4)
- Limitations: The data used in this study are from a single mining area, and the generalization ability of the model still needs to be verified in more geological conditions and mining area environments. In addition, the model performance is highly dependent on the hyperparameter tuning process. Although this study adopted methods such as grid search and Bayesian optimization, the computational cost of the optimization process is relatively high. The selection of input variables is limited by the existing dataset. Future research will consider introducing more geological dynamic factors and real-time monitoring variables to enhance the model’s interpretability and predictive ability.
- (5)
- Future outlook: Subsequent research will focus on exploring the potential of deep learning models in handling the time series characteristics of gas outflow volume, attempting to construct ensemble learning or hybrid models to integrate the advantages of multiple models, thereby further enhancing prediction accuracy and model robustness, and promoting the practical application and transformation of research results in mine safety production.
5. Conclusions
In view of the complex geological conditions of the Yuqia Coal Mine in Qinghai Province, this study adopted the Pearson correlation coefficient to screen the input variables and, by comparing multiple modeling methods, constructed a high-precision prediction model for the gas migration and emission volume in the mining face. This model not only helps optimize the strategies for coal mine gas control, but also provides an empirical case for the application of machine learning technology in the field of mine safety. The main research findings are as follows:
- (1)
- The Pearson correlation coefficient was adopted to identify the risk factors of gas emissions in the mining face of Yuqia Mine of Qinghai Energy Group, and the risk factors with higher correlation coefficients were screened as the input parameters of the model. The operation results show that the six factors, namely coal seam depth X1, coal seam thickness X2, coal seam gas content X3, daily progress X5, daily output X6, and wind speed X8, have a high correlation with the gas emission quantity and are used as the external input characteristic quantities for the prediction of gas emission quantity. In terms of the selection of input variables, this study is highly consistent with the research results of Zhang Kexue et al. [47] and Yang Xiaobin et al. [48], all covering core parameters such as coal seam thickness, coal seam depth, and original gas content. It needs to be emphasized that the identified relationships require process–physical validation, as well as verification on independent data/sites, before being used in operational security.
- (2)
- Longitudinal comparison of the commonly used BP neural network, support vector machine SVM, least squares support vector machine LS-SVM, and random forest algorithm measure the RMSE, MAE, and R2 of the model. The experimental results show that the RMSE and MAE index values of the LS-SVM model are the lowest, and the R2 value is the highest. Actual engineering verification shows that the predicted values of this model are highly consistent with the measured values, proving that it can effectively predict the gas emission quantity under complex geological conditions [49]. Then the relative error is applied to verify the model results, and the experimental results are consistent with the research conclusions of Chen Qiaojun [21] and Wang Lei [50]. It shows that the prediction accuracy of the LS-SVM model for small-sample mine gas emissions is higher than that of other algorithms, and the prediction accuracy is better, which can provide a reference for preventing the occurrence of mine gas disasters.
- (3)
- There are many risk factors of mine gas emissions, and the gray correlation analysis method is used to screen the key risk factors. The correlation coefficient between coal seam thickness X2 and gas emissions is the largest, and the comprehensive correlation degree is 0.8896. The comprehensive correlation degrees of coal seam gas content X3, daily output X6, and coal seam depth X1 are 0.8849, 0.6456, and 0.6258, respectively, indicating that these four indicators are the key risk factors affecting coal mine gas emissions. This is basically consistent with the results obtained by the Pearson correlation coefficient. In this study, the direct determination of coal seam gas content in a mine of Yuqia Coal Mine conforms to the relevant provisions of the ‘content determination method’, and the selection of measurement sites, sampling depth, sampling method, and measurement process all meet the relevant requirements. The measured maximum gas content increases with the increase in buried depth, which conforms to the law of buried depth and gas occurrence. Consequently, the measurement results of coal seam gas content in Yuqia Coal Mine are accurate and reliable. It follows that accurately predicting and revealing the evolution law of gas emissions in the mining face is the cornerstone of coal mine safety and gas control work. Identifying the risk factors of gas emission quantity is an important link in reasonably predicting the gas emission quantity [13,51]. By combining intelligent monitoring and prediction technologies, the risk of gas accidents can be significantly reduced, and at the same time, the efficient utilization of gas resources can be promoted.
Author Contributions
G.Z., Y.Z. and Q.T. are responsible for the topic selection and conception of the manuscript, while Y.Z. and G.Z. are responsible for the data processing and calculation, and jointly completed the paper writing. All authors have read and agreed to the published version of the manuscript.
Funding
This work is supported by the following programs: the Open Research Grant of Key Laboratory of Gas Control in Coal Mines National Mine Safety Administration, with the title “Research on coal mine gas disaster risk pattern recognition and prediction and early warning technology based on digital twin and information fusion” (Funder: Guisheng Zhang, NO. KLGCNMSA2024005). National Natural Science Foundation of China, with the title “Research on the Generation Mechanism of Gas-bearing Coal Damage and Outburst Disasters under the Action of Deep Rockburst Shock Waves” (Funder: Qingyi Tu, No. 52474203). Sub-project of the National Key Research and Development Program, with the title “The principle of coal biodegradation pore enlargement-molecular structure evolution synergistic gas reduction and elimination” (Funder: Qingyi Tu, No. 2023YFC3009001-6).
Data Availability Statement
Data used in this manuscript are available from corresponding author.
Acknowledgments
The authors have reviewed and edited the output and take full responsibility for the content of this publication.
Conflicts of Interest
The authors declare no conflicts of interest.
Abbreviations
The following abbreviations are used in this manuscript:
| LSSVM | Least Squares Support Vector Machine |
| SVM | Support Vector Machine |
| RF | Random Forest |
| BPNN | Back Propagation Neural Network |
| RMSE | Root Mean Square Error |
| MAE | Mean Absolute Error |
| VMD | Variational Mode Decomposition |
| LSTM | Long Short-Term Memory |
| KPCA | Kernel Principal Component Analysis |
| ICSA | Improved Crow Search Algorithm |
| SVR | Support Vector Regression |
| RFECV | Recursive Feature Elimination with Cross-Validation |
| CRVFL | Convolutional Random Vector Function Connection Network |
| MAPE | Mean Absolute Percentage Error |
| ISA-GM-BP | Intrinsic Sympathomimetic Activity–Generalized Mean–Back Propagation Neural Network |
| GRA | Gray Relation Analysis |
| LOOCV | Leave-One-Out Cross-Validation |
| RE | Relative Error |
| APE | Absolute Percentage Error |
| MAPE | Absolute Percentage Error |
References
- Zhai, C.; Cong, Y.Z.; Chen, A.K.; Li, Z.H. Reflection and prospect on the prevention of gas outburst disasters in China’s coal mines. J. China Univ. Min. Technol. 2023, 52, 1146–1161. [Google Scholar]
- Liu, K.; Li, X. Confidence Unites Strength, Hard Work Composes Splendid Chapters. Guangming Daily, 7 March 2025; 2025-03-09(005). [Google Scholar]
- Yu, Y.; Karimi, H.R.; Gelman, L.; Cetin, A.E. MSIFT: A novel end-to-end mechanical fault diagnosis framework under limited & imbalanced data using multi-source information fusion. Expert Syst. Appl. 2025, 274, 126947. [Google Scholar]
- Chen, Z.G.; Zhang, N.B.; Gao, Y.Y.; Wang, X.P.; Huang, N.; Li, Y. Research on early warning model of coal and gas outburst based on multi-sensor information fusion. China Coal 2024, 50, 67–73. [Google Scholar]
- Liu, B.L.; Li, Z.H.; Zang, Z.S.; Yin, S.; Niu, Y.; Cai, M.B. Multi-information Fusion Gas Concentration Prediction of Working Face Based on Informer. Min. Metall. Explor. 2025, 42, 597–613. [Google Scholar] [CrossRef]
- He, M. A Gas Outburst Prediction Model Based on Data Mining and Information Fusion. Rev. D’intelligence Artif. 2019, 33, 379–386. [Google Scholar] [CrossRef]
- Zhang, G.R.; Wang, E.Y.; Ou, J.C.; Li, Z.H. Regional Prediction of Coal and Gas Outburst Under Uncertain Conditions Based on the Spatial Distribution of Risk Index. Nat. Resour. Res. 2022, 31, 3319–3339. [Google Scholar] [CrossRef]
- Zhang, Z.H.; Liu, Y.Q.; Yan, F.; Zhang, Q. An Improved Vovnet Remote Sensing Target Detection Algorithm Based on Context Information Fusion. Electron. Opt. Control 2025, 32, 37–43. [Google Scholar]
- Feng, S.C. Multi-Source Information Fusion Forecasting Method for Coal and Gas Outburst Risk. Ph.D. Thesis, Liaoning Technical University, Fuxin, China, 2019. [Google Scholar]
- Hong, W.B. Research on Gas Anomaly Identification by Integrating Multi-Source Online Monitoring Data. Master’s Thesis, Anhui University of Science and Technology, Huainan, China, 2023. [Google Scholar]
- Zhao, X.F.; Hao, T.X.; Feng, H.Y.; Li, F.; Li, X. Exploration of 3D Coal Seam Geological Modeling Visualization and Gas Content Prediction Technology Based on Borehole Data. Energy Sci. Eng. 2025, 13, 1117–1131. [Google Scholar] [CrossRef]
- Hu, Q.S.; Cheng, Y.X.; Zheng, S.; Zhao, D.; Li, S.Y.; Sun, Y.J.; Zhang, Y.S. Coal Mine Methane Gas Concentration Prediction Based on PSO-VMD-LSTM and Error Quadratic Decomposition. Min. Metall. Explor. 2025, 42, 647–663. [Google Scholar] [CrossRef]
- Liu, L.; Dai, L.C.; Mao, X.Y.; Chen, Y.T.; Jing, Y.H. Research on Gas Emission Prediction Based on KPCA-ICSA-SVR. Processes 2024, 12, 2655. [Google Scholar] [CrossRef]
- Lin, H.F.; Li, W.J.; Li, S.G.; Wang, L.; Ge, J.Q.; Tian, Y.; Zhou, J. Coal mine gas emission prediction based on multifactor time series method. Reliab. Eng. Syst. Saf. 2024, 252, 110443. [Google Scholar] [CrossRef]
- Yang, K.; Xu, R.J.; Zhang, J.; Chi, X.L.; Liu, W.J.; Zheng, S.Z.; Liu, W.J. Mechanical properties and prediction model of failure risk level of gas-bearing coal. J. Min. Saf. Eng. 2025, 42, 404–417. [Google Scholar]
- Liang, Y.P.; Li, S.; Li, Q.G.; Guo, Y.B.; Sun, W.J.; Zheng, M.H.; Wang, C.C. Prediction of gas concentration in the upper corner of mining working face based on the FEDformer-LGBM-AT architecture. J. China Coal Soc. 2025, 50, 360–378. [Google Scholar]
- Li, M.; Xu, Y.S.; Wang, Y.H.; Wang, D.D. A Method for Predicting the Risk of Coal and Gas Outburst Based on IDBO-HKELM-Adaboost. Chin. J. Sens. Actuators 2025, 38, 477–486. [Google Scholar]
- Xi’an Research Institute of China Coal Technology & Engineering Group. “Safety Navigation” for Tunneling Operations. Available online: https://kjt.shaanxi.gov.cn/kjdt/jckj/202509/t20250929_3571963.html (accessed on 29 September 2025).
- CCTEG China Coal Institute. A Number of Technical Equipment from China Coal Research Institute Were Showcased at the National on-Site Promotion Conference for Coal Mine Gas Control. Available online: https://ccri.ccteg.cn/contents/1444/1006187.html (accessed on 19 October 2025).
- Jiao, B.N.; Sa, Z.Y.; Han, B.N.; Liu, J.; Lu, S.Q.; Wang, H. Prediction of mining face gas emission and gas volume fraction in mining face return air roadway based on ISSA-GM-BP. Saf. Coal Mines 2024, 55, 12–21. [Google Scholar]
- Chen, Q.J.; Yu, H.; Li, Y.C.; Tan, Y.J.; Li, Y. Prediction of gas emission quantity in mining face based on KPCA-LSSVM. J. Saf. Sci. Technol. 2024, 20, 78–84. [Google Scholar]
- Huang, X. Research on the Prediction Method of Gas Gushing Based on Machine Learning. Master’s Thesis, Anhui University of Science and Technology, Huainan, China, 2023. [Google Scholar]
- Liu, W.; Han, D.Y.; Xu, H.; Zhou, Y.J.; Li, T.N. Mechanism investigation and models evaluation of gas migration in dual-porosity coal seam. Coal Sci. Technol. 2025, 53, 151–162. [Google Scholar]
- Geng, C.H.; Cui, Y.N.; Liu, J.Z.; Li, L.L.; Liu, X.S.; Bi, Z.B. Dynamic prediction of gas emission from working face based on variational mode decomposition and grey Wolf optimization BiL STM. Min. Saf. Environ. Prot. 2025, 1–9. [Google Scholar]
- Bao, R.Y.; Feng, Q.C.; Lei, C.K. Influencing Factors Analysis and Prediction of Gas Emission in Mining Face. Sustainability 2025, 17, 578. [Google Scholar] [CrossRef]
- Suykens, J.A.K.; Vandewalle, J. Least squares support vector machine classifiers. Neural Process. Lett. 1999, 9, 293–300. [Google Scholar] [CrossRef]
- Zhou, J.; Lin, H.F.; Jin, H.W.; Li, S.G.; Yan, Z.G.; Huang, S.Y. Cooperative prediction method of gas emission from mining face based on feature selection and machine learning. Int. J. Coal Sci. Technol. 2022, 9, 51. [Google Scholar] [CrossRef]
- Wang, L.J.; Zhang, Q.S.; Hao, Y.; Zhou, Y.; Qiu, M.; Sun, C. Photovoltaic adaptive power prediction model based on meteorological data extrapolation and significance analysis. Acta Energiae Solaris Sin. 2025, 46, 317–325. [Google Scholar]
- Rumelhart, D.E.; Hinton, G.E.; Williams, R.J. Learning representations by back-propagating errors. Nature 1986, 323, 533–536. [Google Scholar] [CrossRef]
- Zhao, Y.Q.; He, G.; Wang, Y.Y.; Ruan, J.; Zhang, P. Dynamic assessment and obstacle factor diagnosis of industrial ecological safety based on BP neural network. Bull. Soil Water Conserv. 2021, 41, 127–136. [Google Scholar]
- Volpiani, P.S. Are random forests better suited than neural networks to augment RANS turbulence models? Int. J. Heat Fluid Flow 2024, 107, 109348. [Google Scholar] [CrossRef]
- Zhu, Y.N.; Heng, L.W.; He, G.; Qiao, G.T. Research on comprehensive measurement of safety management level in colleges and universities based on grey system. J. Anhui Univ. Sci. Technol. (Soc. Sci.) 2019, 21, 104–108. [Google Scholar]
- Yuan, X.Q.; Dong, W.X.; Fan, J.Y.; Liu, P.; Li, Z.Z.; Fourmeau, M.; Liu, W. Dynamic gas emission during coal seam drilling under the thermo-hydro-mechanical coupling effect: A theoretical model and numerical simulations. Gas Sci. Eng. 2024, 131, 205454. [Google Scholar] [CrossRef]
- Shen, J.H.; Shi, Y.; Lin, B.Q.; Liu, T.; Shen, Y.; Liu, T.; Yang, W. Study on the influence law of gangue filling structure on the gas emission in adjacent coal seams. J. Clean. Prod. 2024, 455, 142339. [Google Scholar] [CrossRef]
- Bi, S.H.; Shao, L.S.; Qi, Z.H.; Wang, Y.B.; Lai, W.Z. Prediction of coal mine gas emission based on hybrid machine learning model. Earth Sci. Inform. 2022, 16, 501–513. [Google Scholar] [CrossRef]
- Hu, C.W.; Li, Q.; Wang, Y.L.; Li, Y.Y.; Wang, Y.Q.; Chang, K. Influence Mechanism of Mine Pressure on Coal Seam Gas Emission During Mining. Geotech. Geol. Eng. 2022, 40, 3067–3074. [Google Scholar] [CrossRef]
- Shao, L.S.; Zhang, K. A Gas Emission Prediction Model Based on Feature Selection and Improved Machine Learning. Processes 2023, 11, 883. [Google Scholar] [CrossRef]
- Nouri, G.M.; Ansari, S.M.; Majid, N. Estimation of Gas Emissions using the Land GEM Model from the Landfill of Baft County, Kerman, Iran. Environ. Monit. Assess. 2023, 195, 1444. [Google Scholar] [CrossRef]
- Zhang, J.Z.; Cui, Y.X.; Yan, Z.G.; Huang, Y.X.; Zhang, C.Y.; Zhang, J.L.; Guo, J.T.; Zhao, F. Time Series Prediction of Gas Emission in Coal Mining Face Based on Optimized Variational Mode Decomposition and SSA-LSTM. Sensors 2024, 24, 6454. [Google Scholar] [CrossRef]
- Zhao, W.; Dong, H.Z.; Ren, J.C.; Yuan, Y.; Wang, K.; Wang, F. A software for calculating coal mine gas emission quantity based on the different-source forecast method. Int. J. Coal Sci. Technol. 2024, 11, 007003. [Google Scholar] [CrossRef]
- Büchau, Y.G.; Leven, C.; Bange, J. A portable low-cost device to quantify advective gas fluxes from mofettes into the lower atmosphere: First application to Starzach mofettes (Germany). Environ. Monit. Assess. 2024, 196, 138. [Google Scholar] [CrossRef]
- Fan, J.Y.; Wu, D.H.; Lu, S.X. A compound Bayesian networks gas prediction and scheduling method for blast furnace systems under various scenarios. Control. Eng. Pract. 2025, 164, 106463. [Google Scholar] [CrossRef]
- Zhang, J.; Yang, K.; Liao, X. Prediction and Application of Gas Emission in High-Gas Coal Mines Based on TSA-MLP. J. Saf. Sci. Technol. 2025, 21, 138–145. [Google Scholar]
- Sheng, W.; Wang, L.Z. A Traceability Model for Upper Corner gas in Fully Mechanized Mining Face Based on XGBoost-SHAP. J. Mine Autom. 2025, 51, 21–27+140. [Google Scholar]
- Cheng, X.Y.; Zhou, A.T.; Guo, Y.Z.; Cheng, C.; Li, D.B. Prediction Method of Gas Emission Based on Random Forest and Support Vector Machine. Saf. Coal Mines 2022, 53, 205–211. [Google Scholar]
- Zheng, X.L.; Lai, W.H.; Xue, S. Application of MI and SVM in Coal and Gas Outbursts Prediction. China Saf. Sci. J. 2021, 31, 75–80. [Google Scholar]
- Zhang, K.X.; Li, Z.X.; Chen, X.X.; Zheng, Q.X.; Wang, X.L.; Li, X.L.; Hou, D.C.; Li, X.L.; Yan, X.C.; Li, W.T. Gas emission prediction of intelligent mines based on PCA-HPO-ELM. J. Min. Sci. Technol. 2025, 1–11. [Google Scholar] [CrossRef]
- Yang, X.B.; Han, C.; Hu, M.G.; Chen, L.H.; Fu, T.Y.; Lu, F.; Sun, X.C.; Liu, S.Y.; Zhang, X.J. A spatiotemporal feature-based prediction model for gas emission: An interpretability analysis. J. Saf. Environ. 2025, 25, 3794–3802. [Google Scholar] [CrossRef]
- Sun, Y.; Zheng, L.L.; Lan, H.; Yu, Z.X.; Wang, J.; Li, B.; Yang, F.; Wen, F.B. Study on the gas outflow pattern and outflow prediction model of the return mining face under complex geological conditions. Sci. Rep. 2025, 15, 25601. [Google Scholar] [CrossRef] [PubMed]
- Wang, L.; Liu, Y.; Liu, Z.Z.; Qi, J.Y. Research on Gas Emission Prediction Model Based on IABC-LSSVM. Transducer Microsyst. Technol. 2022, 41, 34–38. [Google Scholar]
- Bai, L.Y.; Geng, H.; Yu, G.M. Research on the prediction model of gas emission based on grey system theory. Sci. Rep. 2025, 15, 22739. [Google Scholar] [CrossRef]


Disclaimer/Publisher’s Note: The statements, opinions and data contained in all publications are solely those of the individual author(s) and contributor(s) and not of MDPI and/or the editor(s). MDPI and/or the editor(s) disclaim responsibility for any injury to people or property resulting from any ideas, methods, instructions or products referred to in the content. |
© 2025 by the authors. Licensee MDPI, Basel, Switzerland. This article is an open access article distributed under the terms and conditions of the Creative Commons Attribution (CC BY) license (https://creativecommons.org/licenses/by/4.0/).