Article

Numerical Study on a PV/T Using Microchannel Heat Pipe

1
Changqing Engineering Design Co., Ltd., Xi’an 710018, China
2
College of New Energy, China University of Petroleum (East China), Qingdao 266580, China
*
Author to whom correspondence should be addressed.
Processes 2025, 13(11), 3402; https://doi.org/10.3390/pr13113402
Submission received: 11 September 2025 / Revised: 19 October 2025 / Accepted: 20 October 2025 / Published: 23 October 2025
(This article belongs to the Special Issue Multi-Phase Flow and Heat and Mass Transfer Engineering)

Abstract

Photovoltaic/Thermal (PV/T) technology efficiently harnesses solar energy by co-generating electricity and hot water. Unlike conventional PV systems, PV/T systems improve thermal utilization, cool PV modules, and prevent performance degradation caused by high temperatures. Among the various PV/T configurations, micro-channel heat pipe (MCHP) systems are prominent due to their ability to enhance heat transfer through the use of vacuum-filled, refrigerant-sealed MCHPs. This study explores how factors such as working fluid type, evaporation section heat flux, fill ratio, and condensation section length impact system performance. A 3D steady-state CFD model simulating phase-change heat transfer was developed to analyze thermal and electrical efficiencies. The results reveal that R134a outperforms acetone in heat transfer, with thermal resistance showing a significant decrease (from 0.5 °C·W−1 at a 30% fill rate to 0.3 °C·W−1 at a 70% fill rate) under varying heat source powers. The optimal fill ratio depends on the heat flux; for powers up to 70 W, the fill ratio ranges from 30% to 50%, while above 70 W, it shifts to 60–80%. Additionally, a longer condensation section reduces thermal resistance by up to 30% and enhances heat transfer efficiency, improving the overall system performance by 10%. These findings offer valuable insights into optimizing MCHP PV/T systems for increased efficiency.

1. Introduction

Enhancing the overall efficiency of solar photovoltaic (PV) and photovoltaic/thermal (PV/T) systems has been a central research focus. A key objective is to regulate the operating temperature of solar cells and improve heat transfer performance. Conventional liquid-based PV/T systems, while offering good heat transfer, face challenges in achieving uniform temperature distribution due to limitations in water channel design [1]. Moreover, in extremely cold climates, the use of water as a working fluid poses a freezing risk, which can severely limit system functionality. Heat pipe technology has emerged as a promising solution to these challenges, offering the potential to enhance both the performance and reliability of PV/T systems.
Photovoltaic/Thermal (PV/T) technology synergistically combines photovoltaic power generation with thermal energy collection, enabling the co-generation of electricity and hot water from solar energy [2]. In contrast to conventional PV systems, PV/T configurations not only improve thermal energy utilization but also actively cool the photovoltaic modules. This cooling effect mitigates the reduction in electrical efficiency and prevents structural damage caused by excessive operating temperatures [3]. Among various PV/T configurations, systems employing micro-channel heat pipes (MCHPs) are particularly notable for their superior heat transfer performance [4]. MCHPs are vacuum-sealed tubes filled with a refrigerant, a design that significantly enhances heat transfer efficiency. To advance MCHP technology, this study investigates the impact of critical parameters—including working fluid type, heat flux in the evaporation section, fill ratio, and condensation section length—on overall system performance.
The concept of micro heat pipes was first proposed by Cotter [5] in 1984. It was posited that micro heat pipes exhibit reduced dimensions and augmented specific surface areas in comparison to conventional heat pipes, thereby facilitating enhanced heat transfer processes. However, individual micro heat pipes have limitations in terms of heat transfer efficiency and operational performance. Consequently, the notion of micro heat pipe arrays was proposed. Peterson [6,7] successfully implemented micro heat pipe arrays on silicon wafers. These micro heat pipes are internally independent of one another, thereby eliminating the risk of system failure due to leakage at a single point. Furthermore, microchannel heat pipes manufactured using extrusion molding offer the advantage of low cost, which lays a solid foundation for the large-scale application of microchannel heat pipes.
Mawufemo et al. [8] combined c-Si solar cells with wide microchannel heat pipes, using acetone as the heat pipe working fluid, to achieve simultaneous power generation and heating functions. Thierno M.O. Diallo [9] conducted a numerical analysis of the energy efficiency of a PV/T system using a novel microchannel evaporator and a PCM heat storage heat exchanger. Under given design conditions, the system’s electrical efficiency, thermal efficiency, and efficiency were 12.2%, 55.6%, and 67.8%, respectively. Compared to traditional systems, the overall energy efficiency of this system was improved by 28%, and the COP was increased by 2.2 times. Ren Xiao et al. [10] designed a novel microchannel loop heat pipe PV/T system using a coaxial tube heat exchanger as the condenser and an upper-end small-hole collector as the liquid supply device. Since the working fluid condenses within the loop, reducing the evaporator area has a minor impact on overall heat transfer performance but significantly reduces costs. A distributed parameter model was established and validated using experimental data.
In microchannel heat pipe PV/T systems, the fill rate significantly affects the heat pipe’s heat transfer performance, thereby influencing the power generation efficiency of solar photovoltaic systems. Yu Fawen et al. [11] conducted experimental studies on the heat transfer characteristics of small-scale, gravity-driven, rectangular-channel heat pipes using ethanol as the working fluid. They analyzed and discussed the effects of fill rate on wall temperature distribution, gas–liquid phase distribution, thermal resistance, and other heat transfer performance parameters. S. H. Noie [12] et al. investigated the effect of inclination angle on the thermal performance of two-phase closed-loop thermosiphon tubes under normal operating conditions with filling ratios of 15%, 22%, and 30% within the range of 5° to 90°. Their results showed that the thermal performance of the two-phase closed-loop thermosiphon tubes was optimal within the 15° to 60° range.
Microchannel heat pipes rely on unique aluminum flat tube micro-channels, which contain numerous independent micro-channels and micro-fins to enhance heat transfer [13]. They utilize tiny pipes and phase-change working fluids to facilitate rapid and efficient heat transfer. The presence of micro-channels increases the heat transfer area while reducing the liquid film thickness in the evaporation and condensation sections, significantly enhancing the heat transfer capability of microchannel heat pipes [14]. The key advantages of this design include: (i) high pressure resistance, as the structural partitions provide significant reinforcement; (ii) high reliability, owing to the independent operation of each micro-heat pipe; (iii) low contact thermal resistance, resulting from the flat surfaces that enable excellent integration and overcome the defects of cylindrical connections; and (iv) low cost, achieved through a single-step aluminum extrusion process with a lower material cost than traditional copper. Due to their excellent thermal response speed and isothermal capability, microchannel heat pipes can effectively reduce the temperature of photovoltaic cells, thereby enhancing the overall efficiency of PV/T systems [15]. They possess substantial development potential and represent an important future direction for technological advancement.
Microchannel heat pipe PV/T is a technology that combines photovoltaic power generation with thermal energy utilization. This technology integrates photovoltaic modules into heat pipe plates, enabling solar power generation while also efficiently collecting and utilizing the generated thermal energy through the heat pipe plates, with the aim of improving solar energy utilization efficiency. Microchannel heat pipes utilize tiny tubes and phase-change working fluids to facilitate rapid and efficient heat transfer. This design enhances heat transfer efficiency while reducing overall size and weight. The introduction of PV/T technology contributes to the overall sustainability of solar energy utilization. It not only increases the power generation efficiency of photovoltaic systems but also provides additional thermal energy for applications such as hot water, thereby achieving dual energy utilization.
Notwithstanding the progress made, a comprehensive understanding of the internal operational mechanisms of microchannel heat pipes remains an area requiring further investigation. This study addresses this gap by systematically examining the effects of working fluid type, evaporation section heat flux, liquid fill ratio, and condensation section length on MCHP performance. Furthermore, it extends the analysis to a full PV/T system, calculating its thermal and electrical efficiencies under the influence of various environmental and structural factors. The remainder of this paper is structured as follows: Section 2 describes the establishment of the MCHP and PV/T system models. Section 3 details the governing mathematical models for fluid heat transfer and system performance. Section 4 presents and discusses the results of numerical simulations, including parameter analysis and performance evaluation. Finally, Section 5 summarizes the principal conclusions and suggests recommendations for future work.

2. Description of the Microchannel Heat Pipe PV/T Model

This paper establishes a three-dimensional microchannel heat pipe and microchannel heat pipe PV/T model, specifically introducing the characteristics of microchannel heat pipes and the operating mode of PV/T systems, and detailing the theoretical basis of the calculation model, laying the foundation for the physical behavior analysis in the following sections.

2.1. Establishment of the Microchannel Heat Pipe Model

The model consists of microchannel heat pipes and a condenser. The heat transfer process can be described as follows: heat enters the heat pipe through the evaporation section, where the liquid working fluid evaporates. The phase change generates a temperature difference, creating a pressure gradient that causes the working fluid to evaporate from one side of the evaporation section and move axially to the condensation section. In the condensation section, the working fluid undergoes another phase change, releasing latent heat into the condenser medium. The liquid working fluid then returns along the wall to the evaporation section, completing the cycle. Figure 1 illustrates the appearance and cross-sectional structure of the microchannel heat pipe. Each channel is 2 mm wide and 1 mm high. Nine such channels form a microchannel heat pipe with a width of 20 mm and a height of 2 mm.
This paper uses ANSYS Fluent 2022R1 software to simulate mass and heat transfer phenomena in microchannel heat pipes numerically. A physical model of the two-phase mixture was created. When one side of the evaporation section is heated, a phase change from liquid to vapor occurs.
A three-dimensional model of two-phase heat transfer in microchannel heat pipes has been established [16]. The microchannel heat pipes are made of aluminum, with a total length of 1000 mm and a thickness of 0.5 mm. The heat pipes contain organic working fluid and are completely sealed at both ends, creating a vacuum inside to achieve high vapor velocity. At the same time, the high-speed vapor exerts significant shear stress on the liquid film on the pipe wall, which can reduce the thickness of the liquid film and achieve better heat transfer efficiency.
The condensation section uses an external, square condenser to dissipate heat. The condenser medium is water, which has inlet and outlet ports. The outer diameter of the water pipe is 7 mm, the inner diameter is 5 mm, and the volumetric flow rate is 0.47 L·min−1 (Figure 2).
To accurately simulate microchannel heat pipes, the following boundary conditions are applied, and some assumptions are made to simplify the model and minimize deviations from actual conditions.
(1)
Assume steady-state conditions.
(2)
The vapor-liquid interface temperature is close to saturation, and the flow was confirmed to be turbulent based on calculated Reynolds numbers exceeding 2100 under typical operating conditions.
(3)
Consider convective heat loss through the microchannel heat pipe surface, Convective heat loss from external surfaces was calculated using the Churchill-Chu correlation for natural convection from horizontal cylinders, with the heat transfer coefficient ranging from 8 to 12 W/m2·K under typical conditions [17].
(4)
Assume that the thermal properties of all materials are isotropic and constant.

2.2. Establishment of the PV/T Model

The model under consideration consists of microchannel heat pipes and a photovoltaic system. The heat exchange process is driven by the phase change of R134a inside the microchannel heat pipes, which cools the photovoltaic cells, thereby improving electrical and thermal efficiency.
The structural configurations of the diverse systems examined in this study are illustrated in Figure 3 The microchannel heat pipe is affixed to the base of the photovoltaic cell, facilitating the transfer of heat from the photovoltaic cell to the microchannel heat pipe via thermal conduction. The dimensions of the monocrystalline cell are 40 × 40 mm. The microchannel heat pipe utilized in the PV/T module comprises a cavity formed by multiple rectangular channels, with each channel measuring 1000 mm in length, 1.7 mm in width, and 1 mm in height. The respective lengths of the 800 mm evaporator and 200 mm condenser are driven by the requisite thermal balance between photovoltaic heat generation and active cooling dissipation. A condenser-to-total-length ratio of 15% to 25% is a common and effective empirical rule in heat pipe design for applications with high-heat-flux sources and efficient cooling sinks. Our design, with a condenser ratio of 20% (200 mm/1000 mm), falls squarely within this established and validated range [18,19]. Subsequently, the evacuated heat pipe was filled with R134a as the working fluid at a 50% filling ratio.
To simulate the energy conversion and heat transfer processes in photovoltaic modules, the following boundary conditions and simplifying assumptions are adopted to balance model accuracy and computational efficiency:
(1)
Assume that the conversion efficiency of the solar cell at 298.15 K is 13.5%, and the temperature coefficient is 0.0045 K−1 [20].
(2)
Assume steady-state conditions.
(3)
Consider heat losses from convection and radiation on the upper and lower surfaces of the photovoltaic module.
(4)
Assume that the thermal properties of all materials are isotropic and constant.
(5)
Regarding radiative heat losses, the front and back surfaces of the photovoltaic panel face the sky and ground, respectively.

3. Mathematical Model

3.1. Mathematical Model of Fluid Heat Transfer Process

The working fluid within the heat pipe exists as a liquid-vapor mixture, facilitating simultaneous heat and mass transfer during operation. Heat is transferred through two primary mechanisms: sensible heat transfer, occurring via convection and conduction between the working fluid and the tube wall due to temperature gradients, and latent heat transfer, which involves a significantly greater energy exchange through phase change of the working fluid. The axial movement of the working fluid from the evaporator to the condenser is driven collectively by the pressure gradient induced by the temperature difference and the substantial density variation resulting from the phase-change process. Subsequently, on the condenser side, the vapor condenses back to liquid, releasing its latent heat to the cooling medium before returning to the evaporator section to complete the cycle.
To this end, three-dimensional numerical simulations were conducted using Fluent software to investigate the heat transfer and flow characteristics of microchannel heat pipes. The continuity equation, momentum equation, and energy equation were solved separately based on the physical principles of fluid–structure interaction. This article uses the Mixture model for calculation. Table 1 shows other settings for the model calculation.
The mixture model is capable of computational modeling of multiphase systems through the solution of a mixture equation, a volume fraction equation of the secondary phase, and an algebraic equation of relative velocity. Furthermore, the model concurrently solves the Navier–Stokes equations [21]:
ρ t + ρ u = S M
t ρ u + ρ u u = p + μ u + u T + ρ g + F C S F
t ρ E + u ρ E + p = λ T + S E
In the continuity Equation (1), ρ is the mixture density and S M is the mass source term (which accounts for mass transfer due to phase change).
In Equation (2), u is the velocity vector, p is the pressure, g is the gravitational acceleration, F C S F is the momentum source term, and μ is the dynamic viscosity.
In the energy Equation (3), E is the total energy per unit mass, λ is the thermal conductivity of the mixture, T is the temperature, and S E is the energy source term (which accounts for the latent heat absorption/release during phase change).
Surface tension affects the behavior of bubbles during evaporation, thereby influencing heat transfer efficiency. To improve simulation accuracy, the continuous surface force (CSF) model proposed by Brackbill et al. [22] was adopted to increase the influence of surface tension. The formula is as follows:
F C S F = 2 σ α L ρ L κ V α V + α V ρ V κ L α L ρ L + ρ V
In the equation, σ is the surface tension, κ V and κ L are the two-phase surface curvatures defined according to the divergence of the unit normal vector n , α is the volume fraction of the liquid phase. The subscripts L and V denote the liquid and vapor phases, respectively.
The standard k ε model, which uses the model transport equation based on turbulent kinetic energy k and its dissipation rate ε , is adopted. The specific control equations for ε and k are as follows [23]:
ρ t + ρ u k ε x k = x k η + η t σ ε ε k + c 1 ε k η t u i x j u i x j + u j x i c 2 ρ ε 2 k
ρ k t + ρ u j k x j = x j η + η t σ k k x j + η t u i x j u i x j + u j x i ρ ε
η t = c μ ρ k 2 ε
In the equation, η t is the turbulence dissipation coefficient, c μ = 0.09, 1.44, 1.92, =1.0, =1.3, all are empirical coefficients.
In the context of evaporation and condensation, researchers have proposed numerous mathematical equations to facilitate the description of mass transfer. The Hertz-Knudsen equation [24] is a widely utilized equation in the field to calculate the net mass flow rate through the gas–liquid interface. The equation is expressed as follows:
J o = α M 2 π R p T V p s a t T L T L
In the equation, J o is the net mass flow rate through the gas–liquid interface, kg m 2 s 1 is the unit, M is the molar mass, R is the gas constant, T L and T V are the temperatures of the liquid phase and gas phase, p s a t and p are saturated pressure and pressure, and α c is the adjustment coefficient.
α e and α c are adjustment coefficients, specifically expressed as: the ratio of the actual evaporation rate to the theoretical maximum evaporation rate, and the ratio of the actual condensation rate to the theoretical maximum condensation rate. At the same time, the evaporation coefficient σ e and condensation coefficient σ c also have the following relationship with the adjustment coefficients [25]:
Evaporation process:
α e = 2 σ e 2 σ e
Condensation process:
α c = 2 σ c 2 σ c
The Clausius-Clapeyron equation [17] relates the temperature and pressure at saturation:
d p d T = Δ H T 1 / ρ v 1 / ρ l
In the formula, Δ H is the latent heat of vaporization.
When pressure and temperature are close to saturation, the above equation can be converted to the following form:
p p s a t = Δ H T 1 / ρ v 1 / ρ l T T s a t
Substituting Equation (12) into Equation (8) yields the following result:
J o = α M 2 π R T s a t Δ H 1 / ρ v 1 / ρ l T s a t T T s a t
Mass transfer occurs during phase change. The mass transfer is added to the mass conservation equation via the source term. To convert the units of mass flow rate, multiply both sides of Equation (13) by the surface area α i ( m 2 m 3 ) of the volume interface, and the units are converted to kg m 3 s 1 .
J = α i α c M 2 π R T s a t Δ H 1 / ρ v 1 / ρ l T s a t T T s a t
The volume surface area α i can be expressed by the vapor phase volume fraction α q and the Sauter mean diameter D S m . Assuming that the bubbles formed are spherical, the following equation applies:
α i = 6 α q D S m
Assuming that the evaporation and condensation coefficients are both 1 at saturation, Equation (14) can be written as [26]:
J = 12 D S m α q M 2 π R T s a t Δ H 1 / ρ v 1 / ρ l T s a t T T s a t
At this point, time relaxation factors βe and βc are introduced to represent mass transfer. During evaporation, the mass of liquid substance converted to gas and the mass of gas substance converted to liquid during condensation can be expressed by the following formulas:
J L V = β e α l ρ l T s a t T T s a t
J V L = β c α v ρ v T s a t T T s a t
In the equation, J L V and J V L represent the condensation rates of evaporation, respectively:
β e = 12 D S m M 2 π R T s a t ρ v Δ H ρ l ρ v
β c = 12 D S m M 2 π R T s a t ρ l Δ H ρ l ρ v
The model assumes that heat and mass transfer during evaporation and condensation are steady-state processes. The state of the fluid can be determined based on the saturated temperature, and then the mass source term and energy source term are substituted into the continuity equation and energy equation for solution, achieving interphase mass transfer and energy transfer. For specific details, please refer to Table 2.
In simulation calculations involving phase transitions, the values of βe and βc should be as reasonable as possible to ensure that the temperature field obtained from the simulation has high accuracy. If β e and β c are too large, the phase transition phenomenon becomes severe, and the energy equation is prone to divergence during the calculation process; if β e and β c are too small, the phase transition process approaches single-phase heat transfer. For simulation studies with large heat transfer rates, this can cause the gas phase temperature during condensation to be significantly below the boiling point temperature, or the liquid phase temperature during boiling to be significantly above the boiling point temperature. Based on experimental results, the values of β e and β c are set to 0.1. At this point, the mass transfer equations at the Gas–Liquid interface during evaporation and condensation are:
J l v = 0.1 α l ρ l T s a t T T s a t
J v l = 0.1 α v ρ v T s a t T T s a t
Multiplying the mass transferred during the evaporation and condensation process by the latent heat of vaporization yields the formula for heat transfer:
E l v = 0.1 α l ρ l T s a t T T s a t Δ H
E v l = 0.1 α v ρ v T s a t T T s a t Δ H
In order to assess the impact of various parameters on the thermal performance of heat pipes, the equivalent heat transfer coefficient is generally employed as the primary evaluation metric. The magnitude of the equivalent heat transfer coefficient is indicative of the quality of the heat pipe’s thermal performance. Furthermore, thermal resistance is a frequently utilized metric for assessing the thermal efficiency of heat pipes; reduced thermal resistance corresponds to enhanced heat transfer performance.
K e f f = Q i n L e f f A Δ T
L e f f = L e 2 + L a + L c 2
R = Δ T Q i n
In the equation: K e f f is the equivalent heat transfer coefficient, Q i n is the heat source power, L e is the length of the evaporation section of the heat pipe, L a is the length of the insulation section of the heat pipe, L c is the length of the condensation section of the heat pipe, A is the cross-sectional area of the heat pipe, and Δ T is the temperature difference between the evaporation section and the condensation section.

3.2. Mathematical Model of the PV/T Model

The control equation for the temperature distribution of each layer of PV is [27]:
ρ C p T t ( k T ) = q ˙ s o l P ˙ g e n
In the equation, ρ , C p , and k represent the density, specific heat capacity, and thermal conductivity of each layer, respectively. T is the temperature, q ˙ s o l can be defined as the volumetric solar energy absorption of each layer, and P ˙ g e n is the power generation per unit volume. Except for the monocrystalline silicon cell layer, the power generation of all other layers is zero.
By first specifying the solar radiation intensity G , the solar energy absorption and power generation of each layer of the PV can be modeled, and then the energy absorption of each layer can be calculated and treated as internal heat generation. In this study, it is assumed that the PV surface is always uniformly illuminated. The volumetric energy absorption of each layer is as follows:
q ˙ s o l , i = G r e c , i × α i × A i V i
G r e c , i = G r e c , i 1 × 1 α i 1 ρ i 1
In this equation, α i , ρ i and V i represent the absorption coefficient, reflectance, and volume of the i-th layer, respectively. The term “ G r e c , i ” can be defined as the solar radiation intensity received by each layer. Furthermore, “ q ˙ s o l , i ” is the volume heat source associated with each layer, and “ A i ” is the area of the i-th layer.
In a monocrystalline silicon layer, power generation is regarded as an internal heat sink, and the photovoltaic power of the photovoltaic cell is:
E p v = A p v G τ g η r e f 1 β T p v T r e f
The photovoltaic efficiency of photovoltaic cells is:
η p v = E p v G A p v
In the equation, G is the solar irradiance, A p v is the PV area, τ g is the glass transmittance, η r e f is the reference efficiency of monocrystalline silicon solar cells, and β is the temperature coefficient. Additionally, T p v is the average temperature of the PV, T r e f is the reference temperature of 298.15 K, and η p v is the efficiency of the PV.
The useful thermal energy gain of the PV/T system and the thermal efficiency can be calculated as [10]:
Q = M w C w T o u t T i n
η t h = Q w G A c = c w M w T o u t T i n G A c
In the formulas, M w is the water mass flow rate ( kg s 1 ), and C w is the specific heat capacity of water. In addition, T o u t is the water outlet temperature, T i n is the cooling water inlet temperature, and A c is the collector area.
Compared with thermal energy, electrical energy has a higher grade. Therefore, the energy efficiency of PV/T systems considering energy grades is calculated by reference [28,29]:
η p v t = η t h + ξ η p v η p o w e r
Here, η p o w e r is the average efficiency of conventional thermal power plants in converting thermal energy into electricity, which is taken as 38% based on the regional average data reported in [28]; ξ is the coverage rate of the solar photovoltaic system, which is the ratio of the photovoltaic cell area to the total collector area of the system.
Exergy can be used to represent the maximum useful work of the system, and the calculation formula [30] is as follows:
E x t h = Q t h 1 T a T m
Electrical energy is considered pure work, or pure exergy. Therefore, the electrical exergy is equal to the electrical energy output:
E x p v = E p v
In the formula, T a is the ambient temperature, T m is the average thermodynamic temperature, which is related to the temperature increase from the inlet temperature T i n to the outlet temperature T o u t , and can be expressed as:
T m = T o u t T i n ln ( T o u t / T i n )
The input to the system is solar radiation. Unlike thermal energy at low temperatures, solar radiation has a high potential to perform work. The exergy of the incident solar radiation E x G per unit area is not equal to its irradiance G , but is given by the Petela formula [31]:
E x G = G 1 T a T s u n
Among them, T s u n = 5760 K is the surface solar temperature. The average thermal exergy efficiency and electrical exergy efficiency is [32]:
η e x , t h = E x t h E x G A c = c w M w T o u t T i n 1 T a / T m E x G A c
η e x , p v = E x p v E x G A p v = E p v E x G A p v
The exergy efficiency of the system is:
η e x , p v t = η e x , t h + ξ η e x , p v
The sky temperature T s k y and convective heat transfer coefficient h are critical for accurately calculating heat losses from the PV module surface, which in turn affect the exergy analysis.
The sky temperature used for calculating surface radiation heat loss in photovoltaics can be given by equation [33]:
T s k y = T a     6 K
where T s k y is the sky temperature and T a is the ambient temperature. The convective heat transfer coefficient of PV is expressed in terms of wind speed as [34].
h = 5.82 + 4.07 v
where h is the convective heat transfer coefficient, with units of W m 2 K 1 , and v is the wind speed, with units of m s 1 . Both parameters are integrated into the energy balance boundary conditions of the PV/T model to simulate realistic thermal performance.

4. Results and Discussions

4.1. Grid Independence Verification and Model Verification

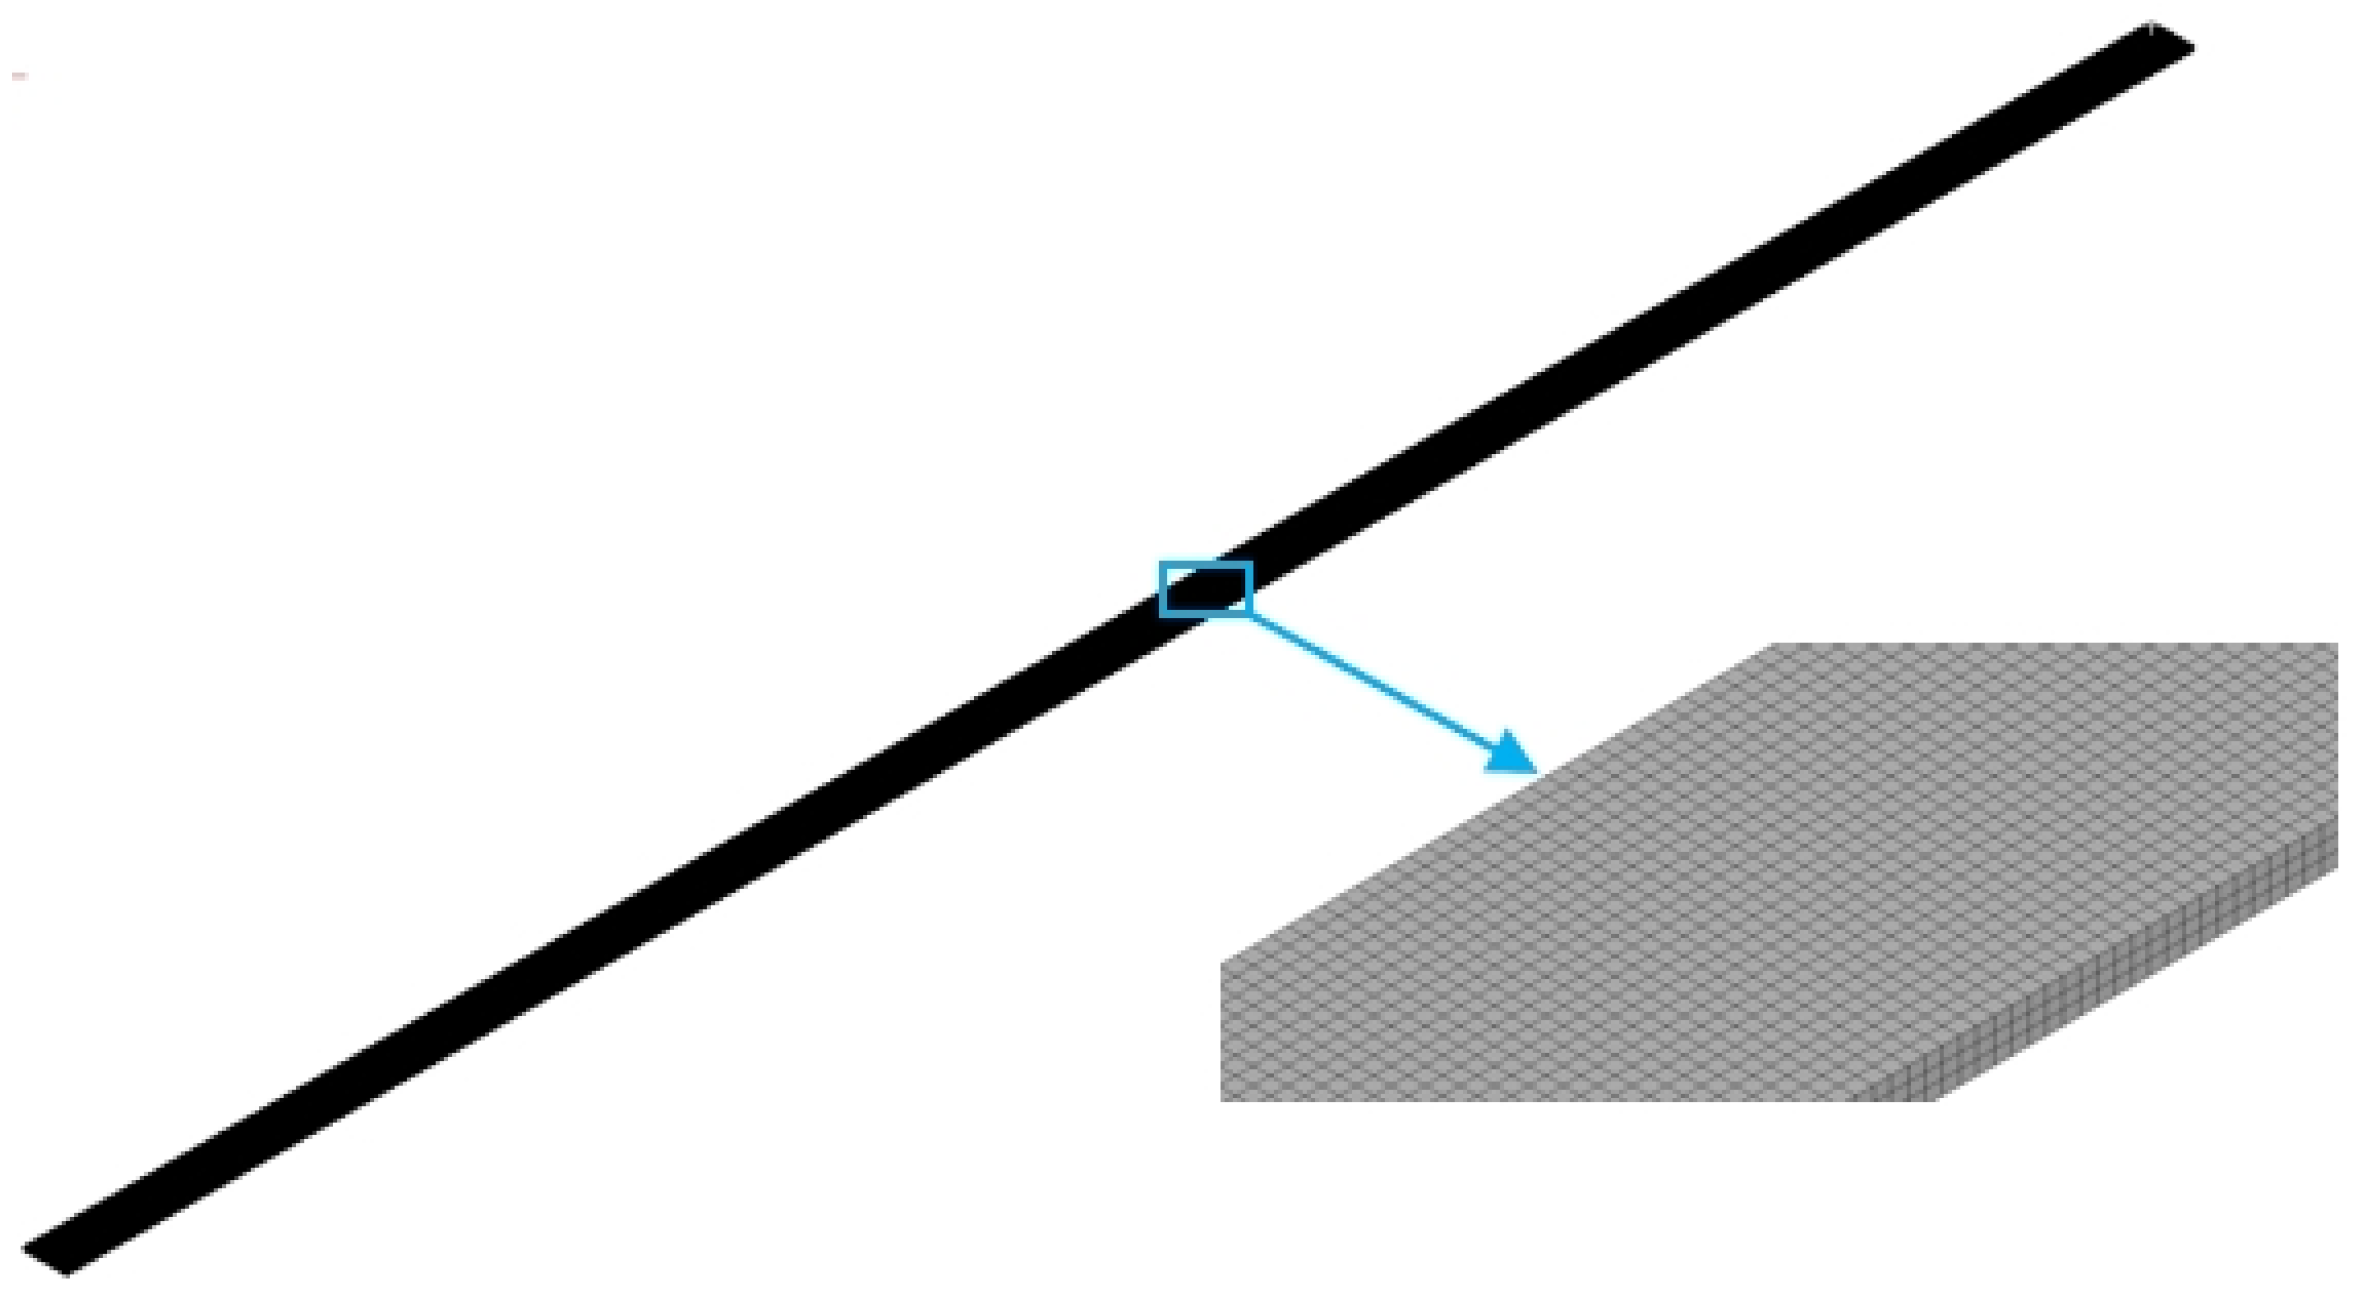
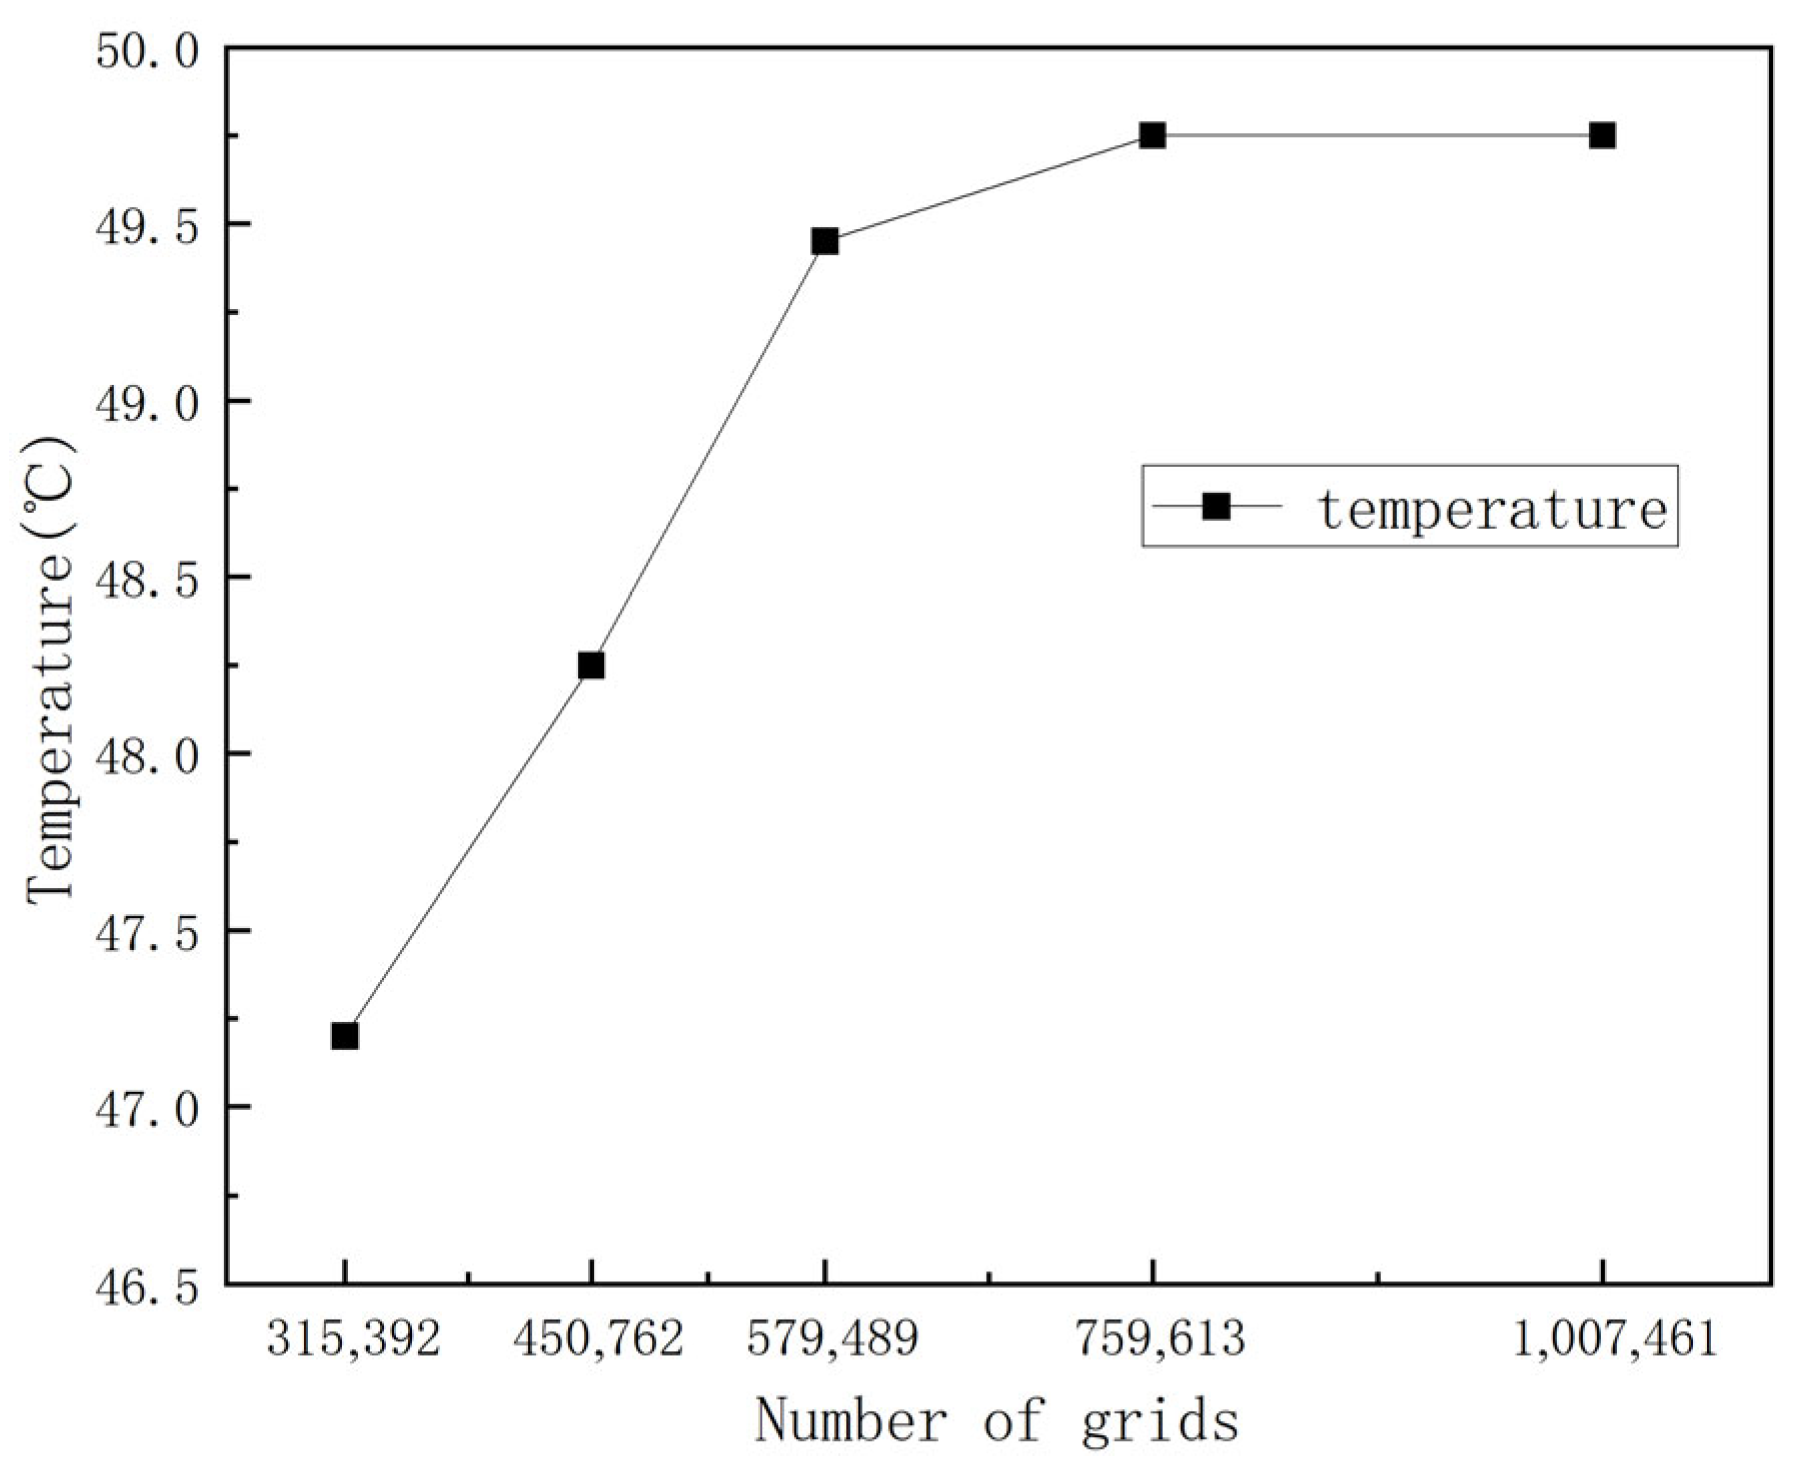
In simulation calculations, the number and quality of grids affect the speed and accuracy of calculations. When the number of grids is too large, the computational load increases, and the calculation speed decreases. Conversely, when the number of grids is too small, the simulation accuracy decreases. Therefore, the number of grids should be reduced while ensuring computational accuracy to balance both calculation speed and accuracy. This study compared the average temperature of the evaporation section under different grid parameter settings. When the average temperature of the evaporation section remains relatively stable across different grid sizes, the grid accuracy can be considered reliable. The computational mesh division of the microchannel heat pipe is shown in Figure 4, which performs encryption on key areas (such as near the microchannel wall).
The mesh independence was verified using a reference case with the following parameters: R134a as the working fluid, a 50% liquid filling ratio, a 70 W heat source power, and a 200 mm condenser length. As shown in Figure 5, the average temperature in the evaporator section stabilizes when the number of cells reaches approximately 760,000. Although the number of cells required for full convergence may vary slightly depending on the operating conditions (e.g., the working fluid and heat flux), this study adopted this mesh setting (approximately 760,000 cells) and performed boundary layer refinement to ensure computational accuracy and efficiency across all simulation cases.

4.2. Selection of Working Fluid and Physical Properties

The most important characteristics to consider when selecting an appropriate working fluid are compatibility and wettability with the heat pipe material, good thermal stability and thermal conductivity, high latent heat of vaporization, high surface tension and low viscosity of both the liquid and vapor phases. The thermophysical properties of the working fluids R134a and acetone used in this study are listed in Table 3.
Based on the principle of compatibility between the working fluid and aluminum, both R134a and acetone can be selected as working fluids for heat pipes. Among these, R134a has a high vapor density and low viscosity, which helps reduce vapor velocity and Gas–Liquid shear stress while accelerating the return flow of the condensed working fluid, demonstrating potential for high thermal performance [36]. Acetone, on the other hand, has a high thermal conductivity and latent heat of vaporization, enabling the transfer of more heat. Both working fluids have their advantages and disadvantages. In the next section, we will compare the two types of microchannel heat pipes using simulation.
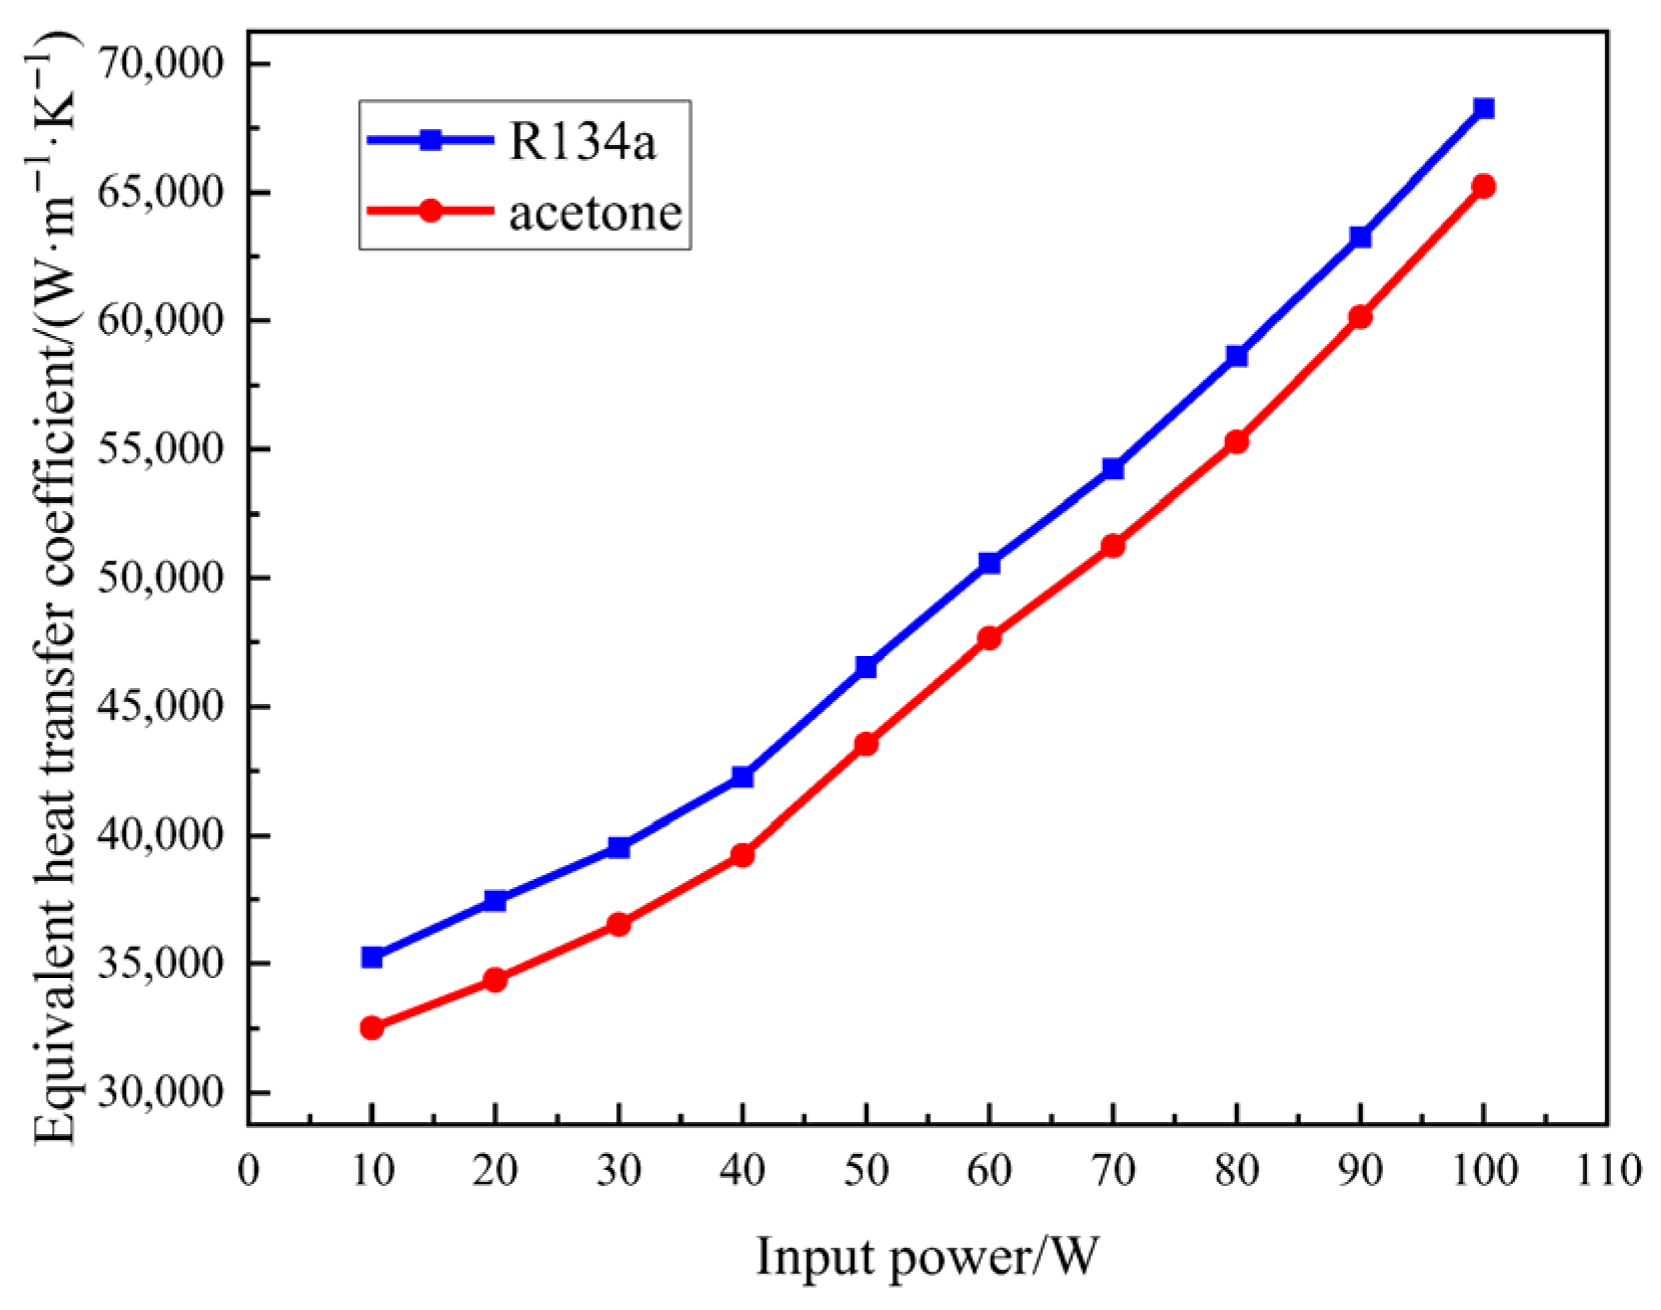
As shown in Figure 6, the equivalent heat transfer coefficients of both working fluids increase with the increase in heat source power. Compared to acetone, R134a exhibits a higher equivalent heat transfer coefficient, indicating that the heat transfer performance of R134a-based heat pipes is superior to that of acetone-based heat pipes.

4.3. Performance Study of Microchannel Heat Pipe

4.3.1. Heat Transfer Characteristics of Microchannel Heat Pipes at Different Fill Rates

The filling rate (or filling ratio) is a key initial condition of the model, defined as the volume fraction of the internal channel occupied by the liquid working fluid at the start of the simulation. To investigate the effect of refrigerant filling rate on the performance of microchannel heat pipe systems, the operational conditions of the heat pipe were simulated at filling rates of 30%, 40%, 50%, 60%, 70%, and 80%.
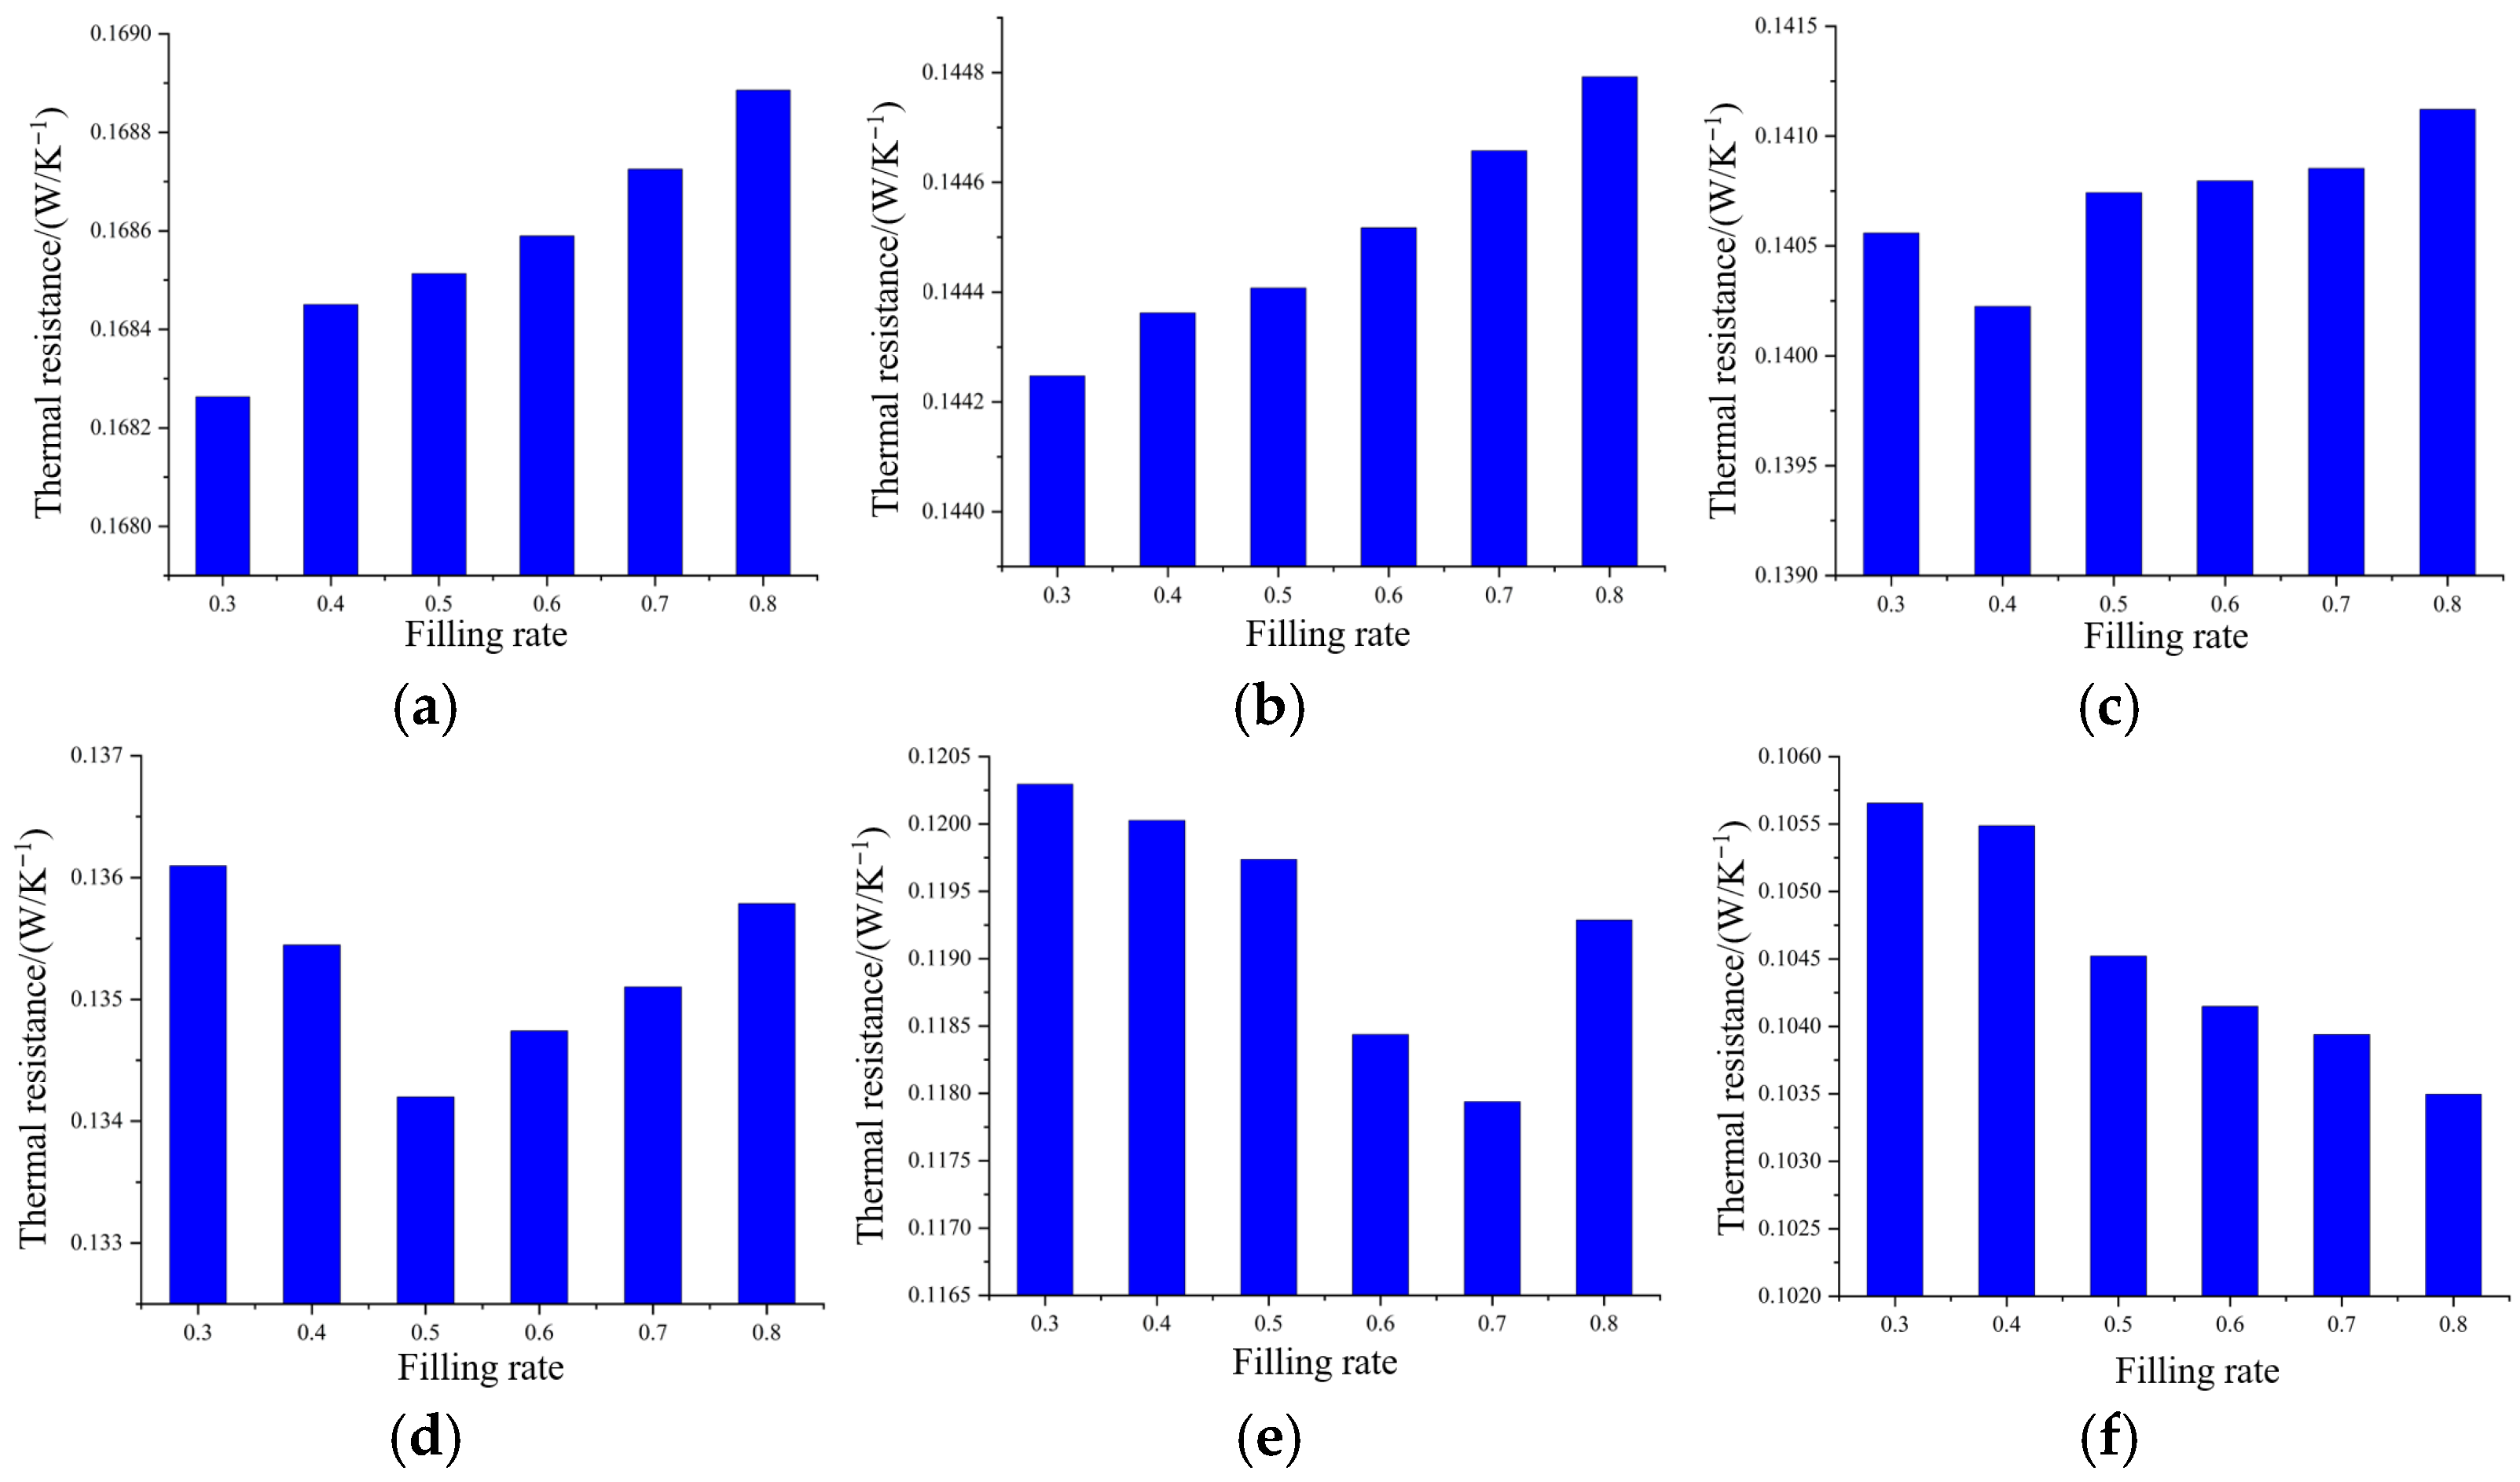
The calculation results under six heat source power conditions were compared and analyzed, with thermal resistance used to characterize the heat transfer performance of the heat pipe. As shown in Figure 7, there is a certain relationship between heat source power and optimal filling rate. Within the same heat pipe, the optimal filling rate varies with different heat source powers. At heat source powers of 10 W and 30 W, the thermal resistance corresponding to a 30% fill rate is the lowest, and it gradually increases as the fill rate increases; at a heat source power of 50 W, the thermal resistance corresponding to a 40% fill rate is the lowest; at a heat source power of 70 W, the thermal resistance corresponding to a 50% fill rate is the lowest, while that corresponding to a 30% fill rate is the highest; at a heat source power of 90 W, the optimal fill rate changes to 70%. When the heat source power increases to 110 W, the thermal resistance decreases in order from 80% to 30%.
When the heat source power is low, the thermal resistance of a heat pipe with a low fill rate is lower. This is because the heat input is minimal, most of the working fluid has not undergone phase change. After thermal expansion, the length of the liquid pool further increases. At this point, the proportion of liquid working fluid in the microchannel heat pipe is too large, while the proportion of the condensing return liquid film is too small. Since the heat transfer coefficient of the liquid pool is much lower than that of the liquid film, heat pipes with low fill rates exhibit better heat transfer performance at low heat source power levels. When the heat source power is high, the optimal filling rate of the heat pipe also increases. This is because the high heat source power causes the working fluid to evaporate quickly, resulting in a higher proportion of gaseous working fluid. Gaseous working fluid can effectively transfer heat, and the bubbles formed can stir the liquid pool, enhancing heat exchange; however, at this point, a low liquid filling rate results in a smaller proportion of liquid working fluid, and the return flow after condensation is insufficient to keep the tube wall in a state where it is continuously wetted by the liquid film, thereby reducing the heat transfer performance of the heat pipe.
The filling ratio is a key parameter affecting heat pipe performance. It is defined as the ratio of the working fluid volume to the total internal volume of the heat pipe. To explore its impact, this study compared and analyzed six different filling ratios ranging from 30% to 80%.

4.3.2. The Effect of Condensation Section Length on Heat Pipe Performance

Changes in the length of the condensation section directly affect the heat transfer performance of microchannel heat pipes. A longer condensation section can provide a larger effective condensation surface area, thereby improving the heat transfer efficiency of the heat pipe. On the other hand, if the condensation section is too short, it may limit the efficiency of the condensation process and reduce the overall heat transfer performance of the system. This study investigated the performance changes of heat pipes under three condensation section lengths: 100 mm, 200 mm, and 300 mm. As the condensation section length increases, the insulation section length correspondingly decreases, while the total heat pipe length and evaporation section length remain unchanged to ensure the same heat flux.
When the condensation section length decreases, the corresponding cooling area also decreases, resulting in reduced heat transfer through the condensation section and insufficient heat exchange. At this point, the gaseous working fluid generated by heating inside the heat pipe cannot be cooled promptly, leading to a smaller proportion of condensed liquid and a larger proportion of gaseous working fluid. The accumulating gaseous working fluid obstructs the return flow of condensed liquid, causing the liquid film on the condensation section, increasing the thermal resistance during heat exchange between the condensation section and the external environment. This deteriorates the circulation state of the working fluid inside the microchannel heat pipe, further causing the temperature of the evaporation section to rise and the heat transfer capacity to decrease (Table 4).
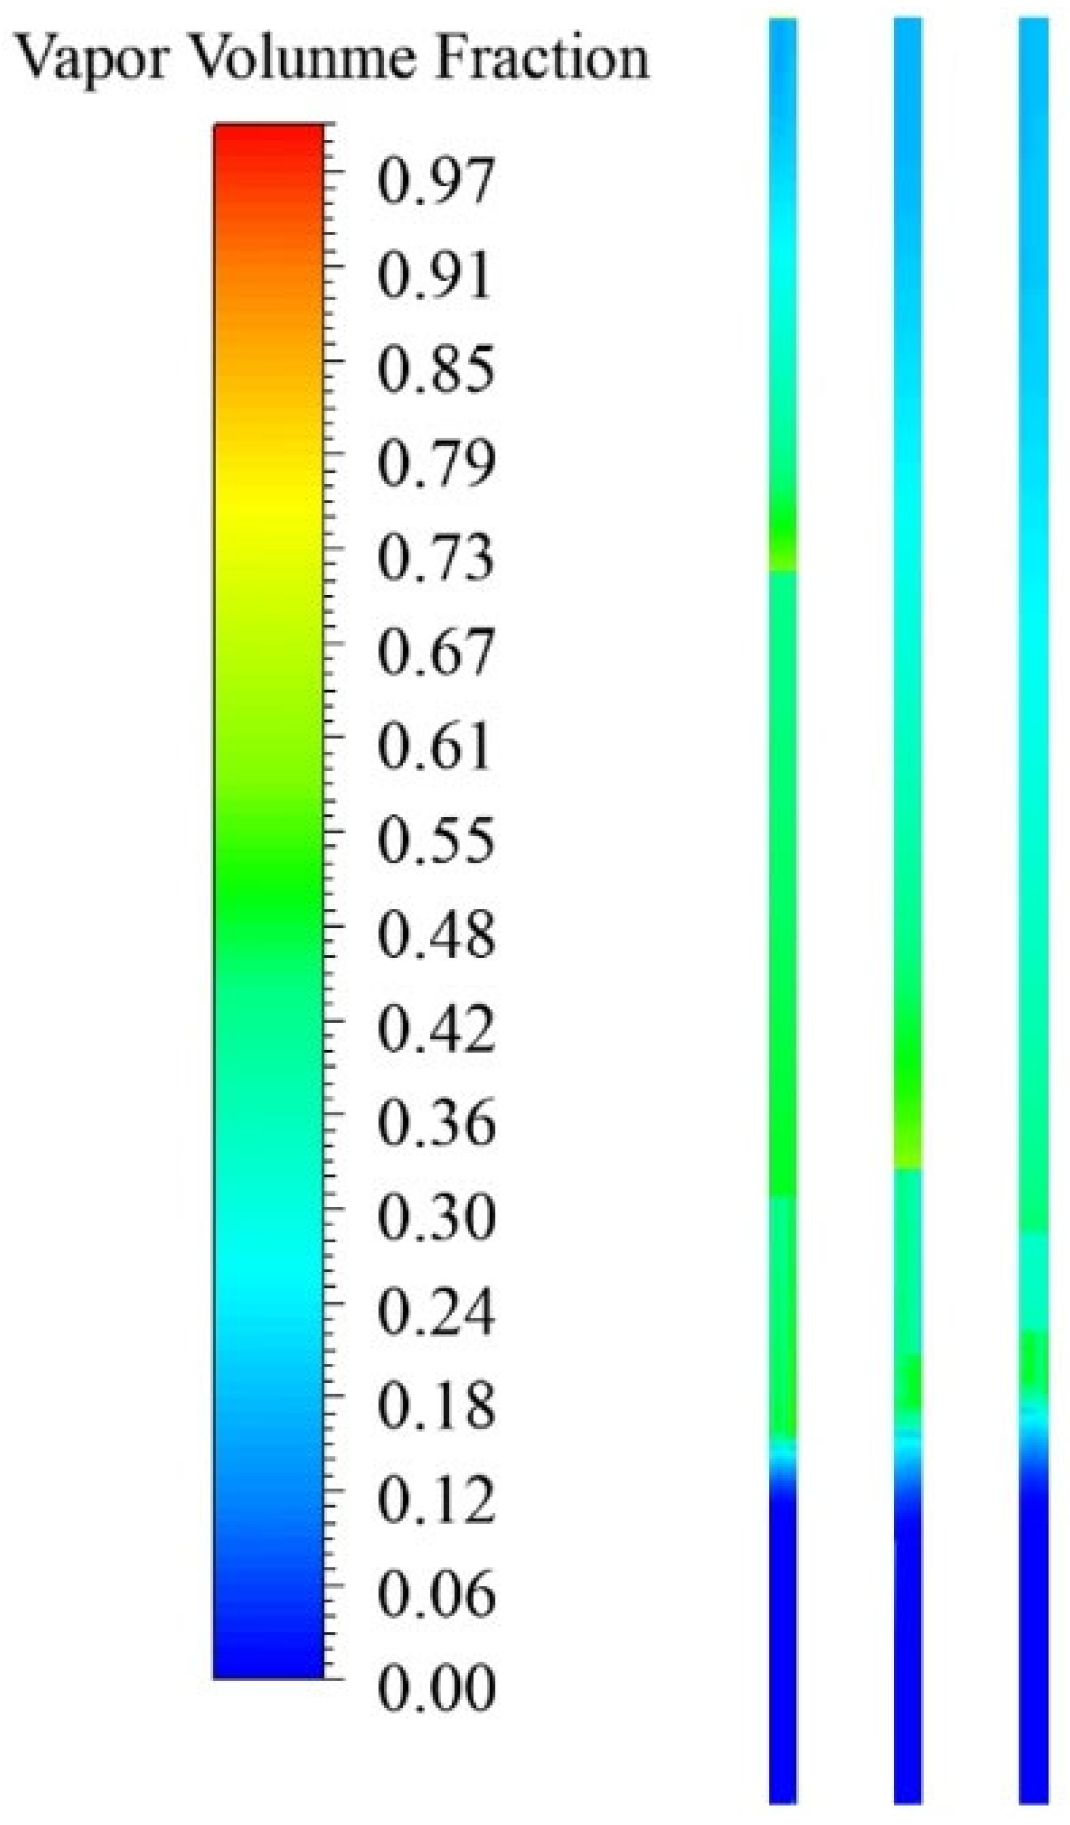
The figure below shows the distribution of gaseous and liquid working fluids at three different condensation section lengths. When the condensation section length is 100 mm, the proportion of liquid working fluid at the bottom of the heat pipe is relatively small. As the condensation section length increases, the proportion of liquid working fluid inside the heat pipe gradually rises. This is because as the condensation section length increases, the heat pipe can transfer heat more quickly, leading to an increase in condensation, resulting in the phenomenon where the proportion of liquid working fluid increases as the condensation section length increases. In order to intuitively demonstrate the impact of different condensation section lengths on the internal working fluid distribution, the Gas–Liquid phase distribution cloud diagrams under three lengths are shown in Figure 8.
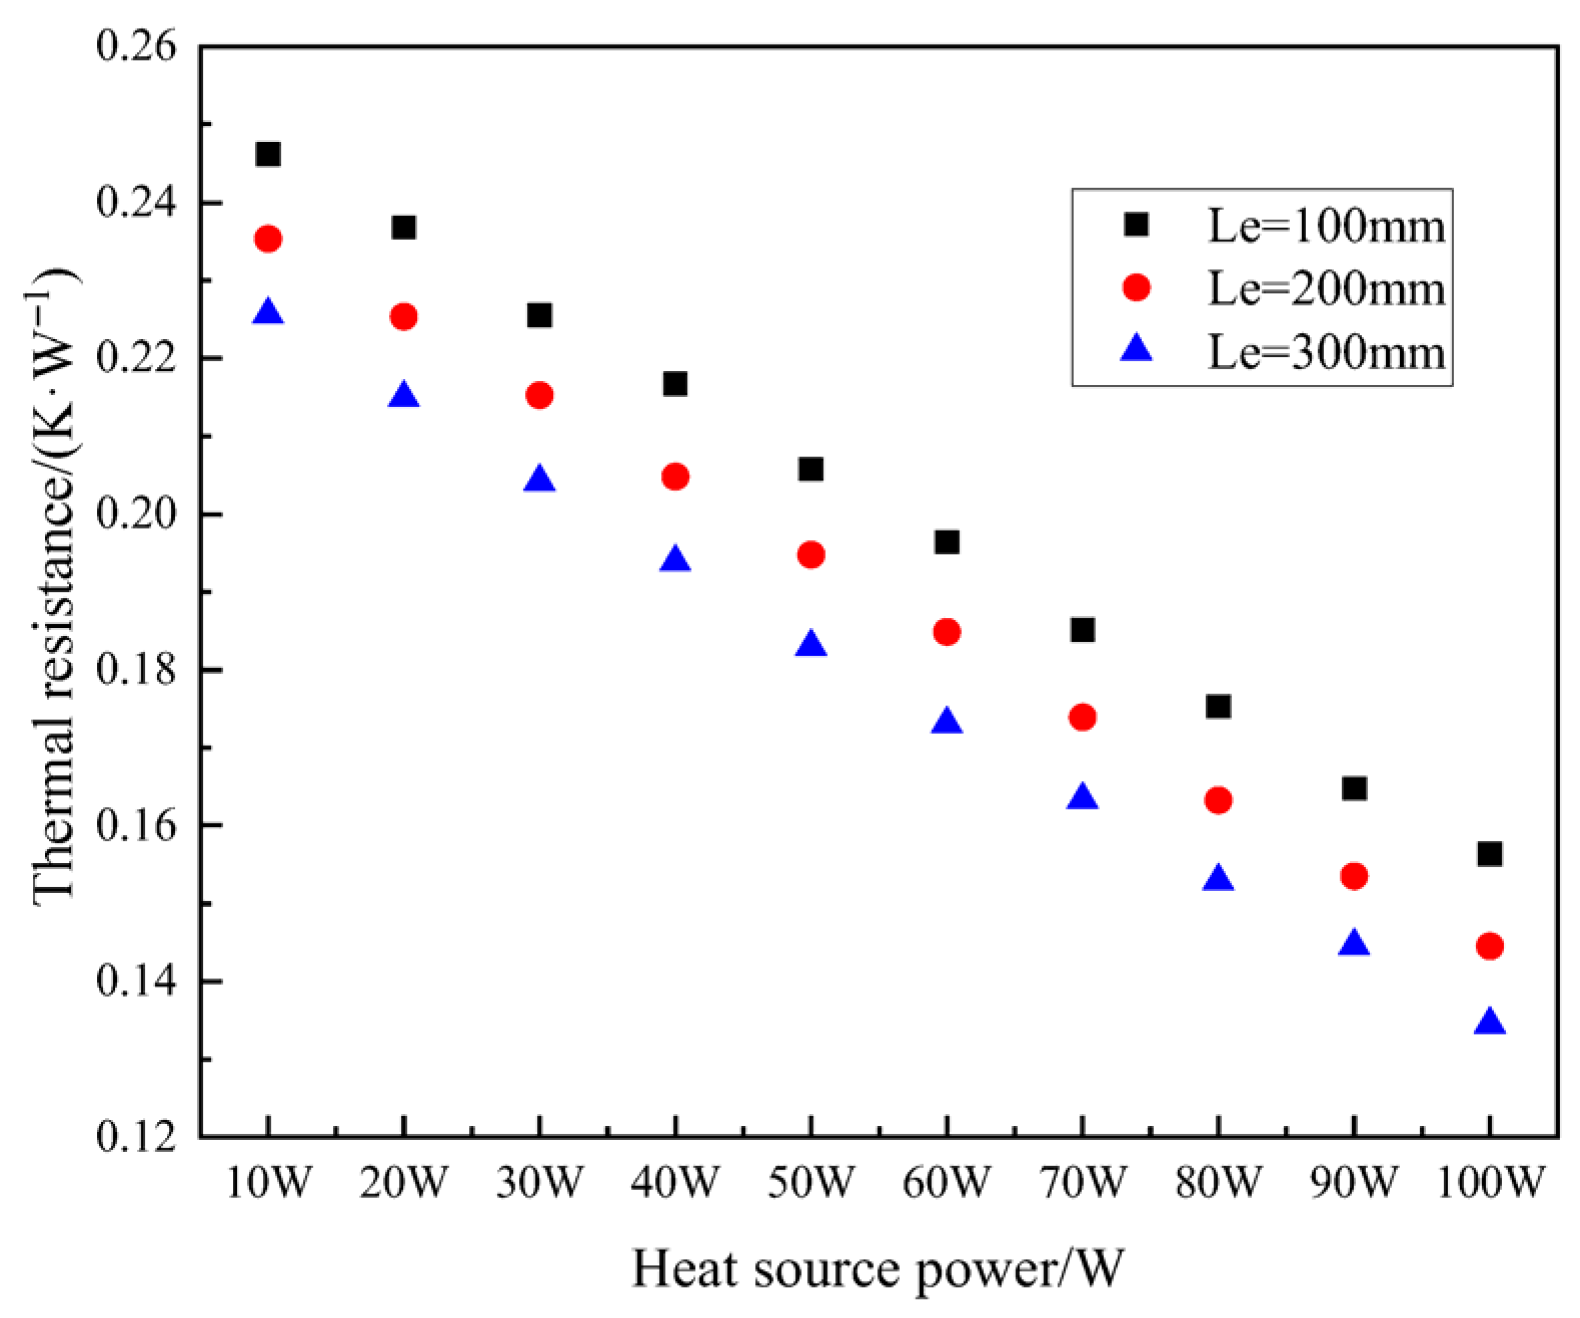
It was found that the length of the condensation section has a significant impact on heat transfer performance. When the condensation section length increases, i.e., by altering the ratio between the evaporation section and condensation section, more heat can be removed, thereby lowering the overall temperature of the heat pipe. Heat resistance is used to characterize the heat transfer performance of a heat pipe. Taking a heat pipe with a 50% liquid fill rate as an example, as shown in Figure 9, increasing the condensation section length can reduce heat resistance at different heat source power levels, thereby improving the heat transfer performance of the heat pipe. Additionally, the longer the condensation section, the lower the heat resistance. Increasing the heat input to the evaporation section raises the temperature of its inner wall surface, causing part of the liquid working fluid to vaporize. This generates numerous small bubbles and vapor films on the inner wall surface of the heat pipe. Since vapor has poor thermal conductivity, the attached small bubbles and vapor films increase the heat pipe’s thermal resistance, thereby reducing its heat exchange capacity. However, a longer condensation section increases the heat exchange rate, promptly removing the latent heat from the gaseous working fluid, making the condensation process more intense, and allowing more liquid working fluid to flow back, thereby better wetting the tube wall to reduce thermal resistance and improve heat transfer performance.
To further explore the phase distribution and liquid film behavior within the heat pipe, this section also uses the VOF (Volume of Fluid) model for numerical calculations. This model simulates multiphase flow by tracking phase interfaces on a fixed Eulerian grid. It is particularly suitable for transient simulations and analyzing the interfacial behavior of bubbles, liquid films, and other fluids. This study applied this model to accurately capture the liquid film distribution details within the condensation and adiabatic sections. To reduce computational load and accelerate convergence, the heat pipe model was simplified as follows: a two-dimensional model was used for calculations, and boundary conditions were simplified. Given the extreme computational demands of simulating liquid film thickness, this study employed a two-dimensional axisymmetric model for this specific analysis to improve computational efficiency. This simplification assumes structural symmetry across the heat pipe cross-section and focuses on capturing the liquid film distribution along the axial cross-section. The simplified boundary conditions are constant heat flux at the bottom of the evaporator section and constant temperature in the condenser section. Comparisons of basic performance parameters (such as evaporator section temperature) under key operating conditions have verified the qualitative agreement between this simplified 2D model and the previously described 3D model, confirming the validity of the analytical approach.
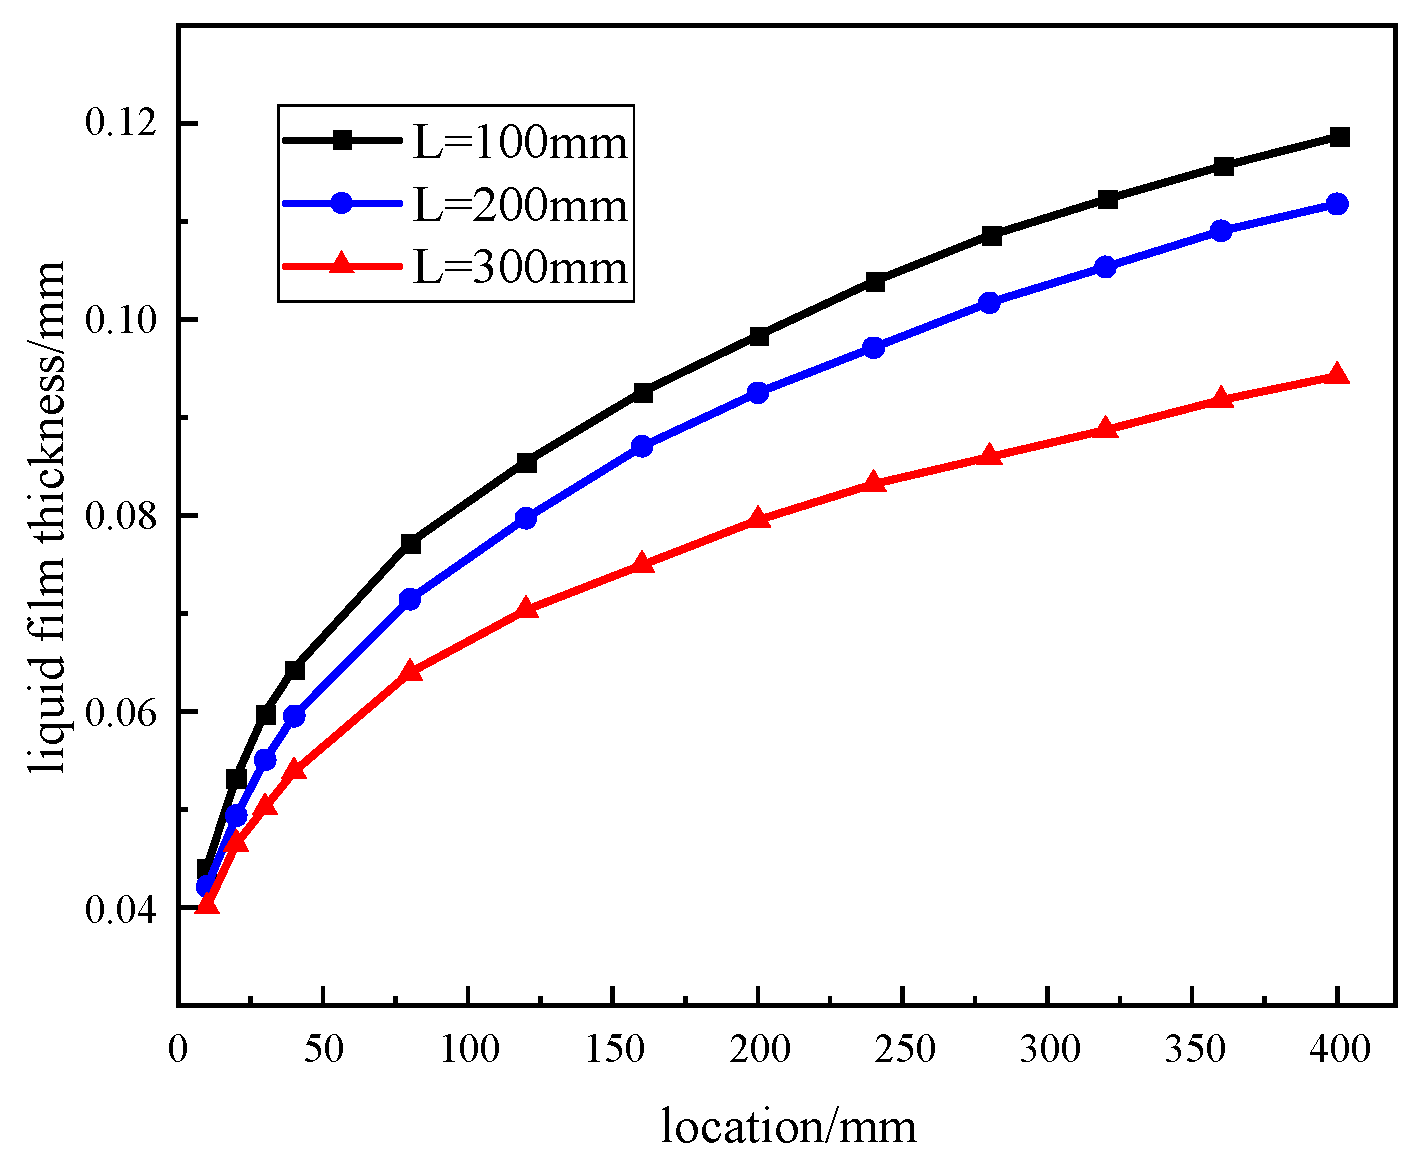
Figure 10 illustrates the effect of condensation section length on liquid film thickness. The liquid film thickness develops downward from the top and increases in thickness as it flows toward the evaporation section. When the condensation section length increases, the liquid film thickness of the condensing working fluid decreases accordingly. This is because a longer condensation section can rapidly condense a large amount of gaseous working fluid and promptly remove it, reducing the condensation rate per unit area and resulting in a thinner liquid film thickness on the surface. Conversely, when the condensation section length is shorter, the condensation rate per unit area is higher, and due to the constraints of smaller viscous friction resistance and steam inertia factors, liquid working fluid accumulation is more likely to occur. This also explains why increasing the condensation section length reduces the thermal resistance of the heat pipe. The liquid film thickness is obtained by post-processing the simulation results of the VOF model and is specifically defined as the vertical distance from the wall to the Gas–Liquid interface (usually the isosurface with a gas phase volume fraction of 0.5) at each axial position of the heat pipe.

4.4. Performance Study of Microchannel Heat Pipe PV/T

Microchannel heat pipes, due to their flat plate structure, can be easily integrated with photovoltaic modules and directly connected to the rear of the photovoltaic modules. Heat from the photovoltaic modules is transferred to the heat pipe through its evaporation section, and this energy is transported to the working fluid within the condensation section via evaporation in the evaporation section. Subsequently, through the condensation of the working fluid within the microchannel heat pipe, heat is released from the condensation section and transferred to the medium in the condenser, thereby achieving the collection and utilization of heat.

4.4.1. Effect of Solar Irradiance on PV/T Systems

For PV/T systems, solar irradiance intensity is the most critical factor affecting system efficiency. This section investigates changes in system performance under varying irradiance intensities. By varying solar radiation from 200 W·m−2 to 1000 W·m−2 while keeping other external variables constant—specifically, air temperature at 25 °C and air flow velocity at 1 m·s−1—the system’s performance was evaluated.
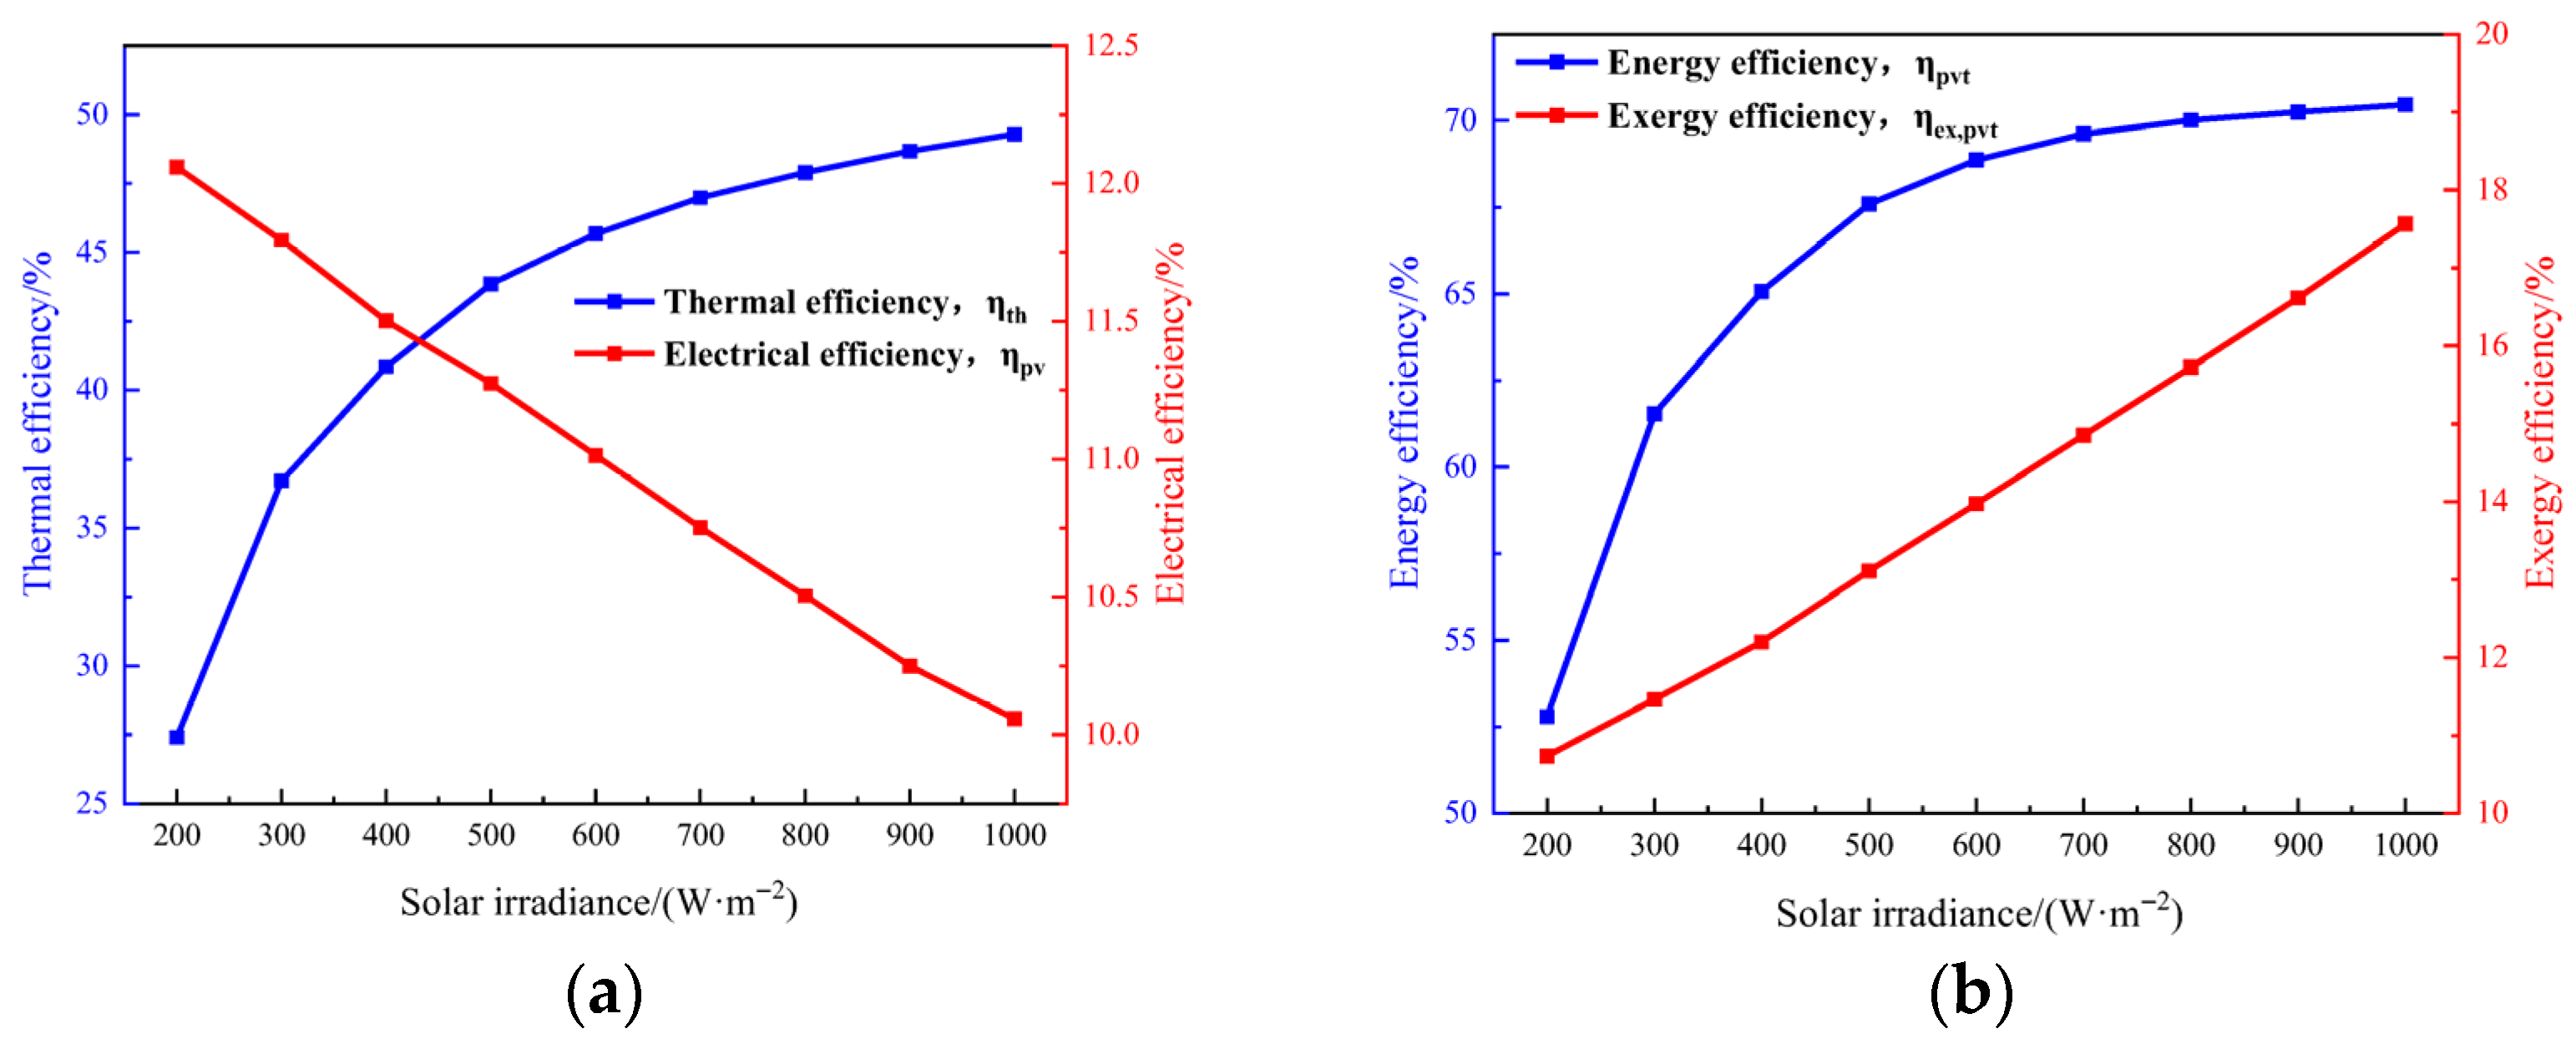
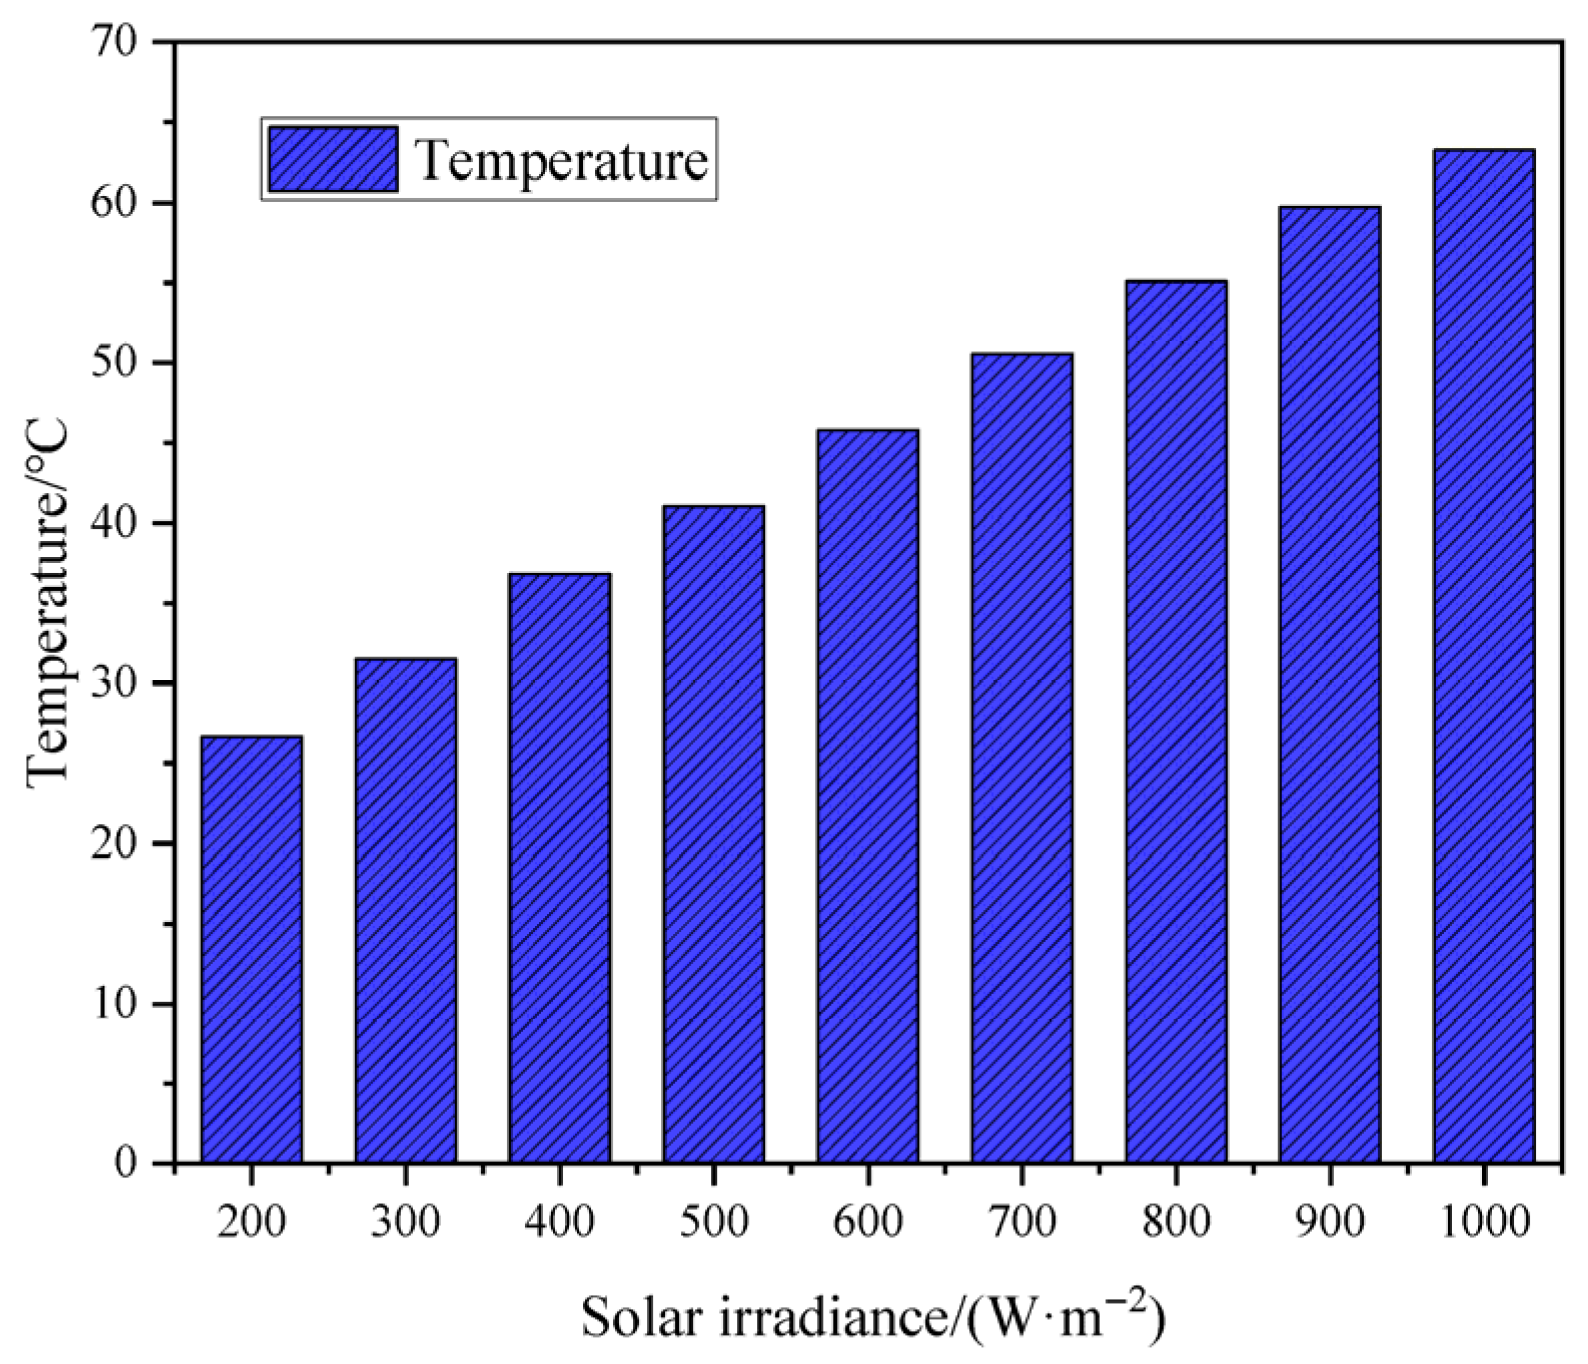
Figure 11 illustrates the impact of solar irradiance on thermal efficiency, electrical efficiency, energy efficiency, and exergy efficiency. As solar radiation intensity increases, thermal efficiency improves, but electrical efficiency decreases, while energy efficiency and exergy efficiency show an upward trend. This increase is particularly pronounced under relatively low solar irradiance conditions (<400 W·m−2), where it exhibits an almost linear growth. It can be observed that within the range of 200–400 W·m−2, thermal efficiency and energy efficiency increase rapidly; however, when solar irradiance exceeds 400 W·m−2, the rate of increase slows down. The primary cause of this deceleration is the rise in outlet water temperature, as higher water temperatures lead to increased heat loss. Additionally, as solar irradiance increases, the system also experiences greater heat loss to the surrounding air through convective heat transfer. When solar irradiance increases from 200 W·m−2 to 1000 W·m−2, the system’s thermal efficiency increases from 27.41% to 49.28%, a significant improvement; however, the system’s electrical efficiency slightly decreases from 12.06% to 10.06%. The trend of the operating temperature of photovoltaic cells increasing with irradiance is shown in Figure 12, which directly leads to the above-mentioned reduction in electrical efficiency. As solar irradiance increases, the thermal losses of the PV/T system relative to the absorbed solar radiation gradually decrease, leading to an upward trend in thermal efficiency. Additionally, the energy efficiency and thermal efficiency also improve. As solar irradiance increases from 200 W·m−2 to 1000 W·m−2, the energy efficiency increases from 52.80% to 70.46%, and the exergy efficiency increases from 10.74% to 17.56%.

4.4.2. Effect of Ambient Temperature on PV/T Systems

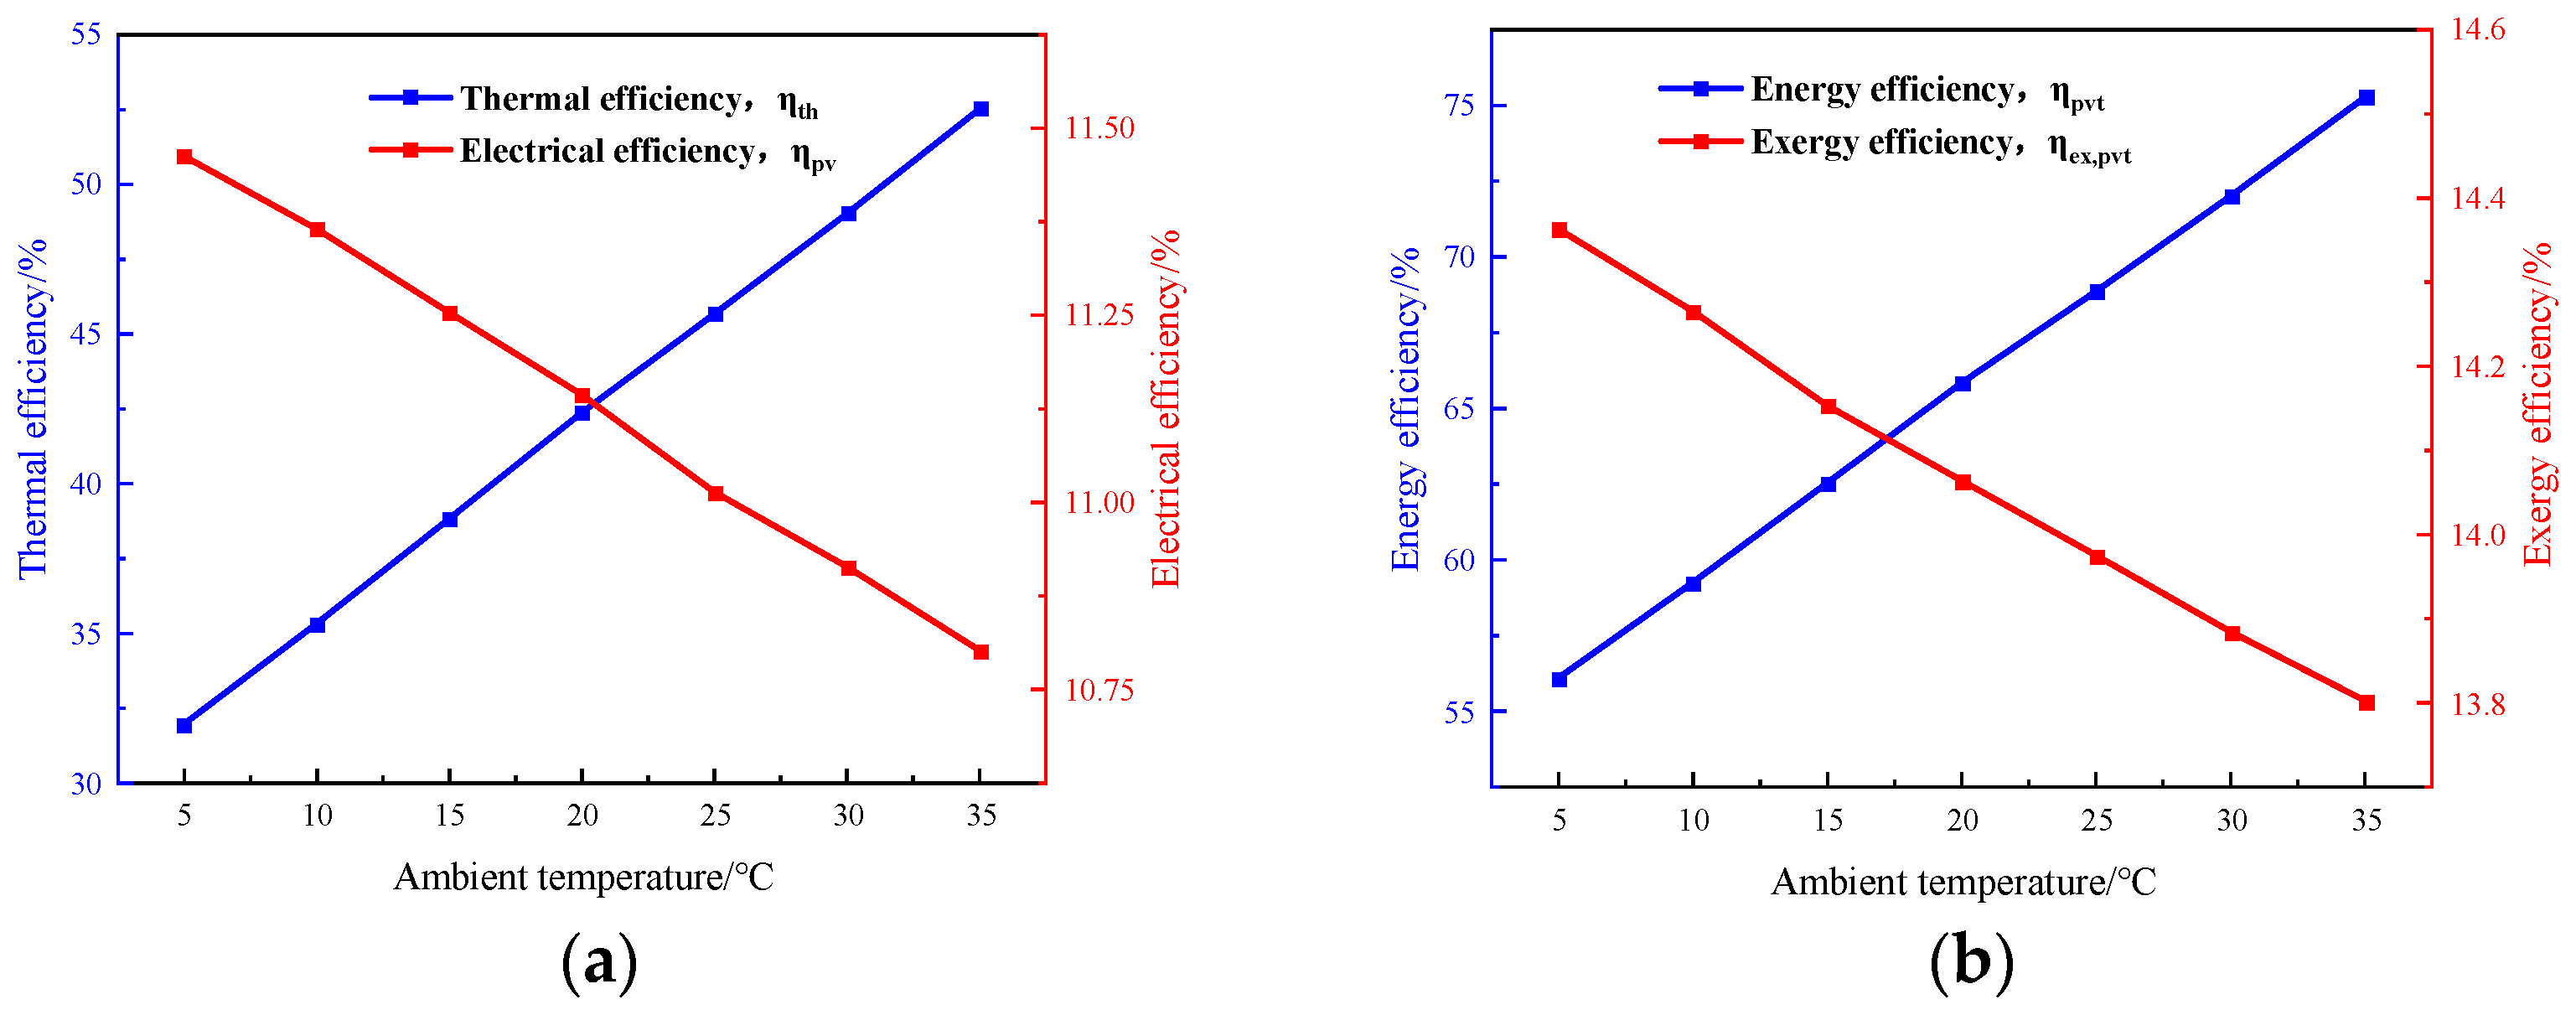
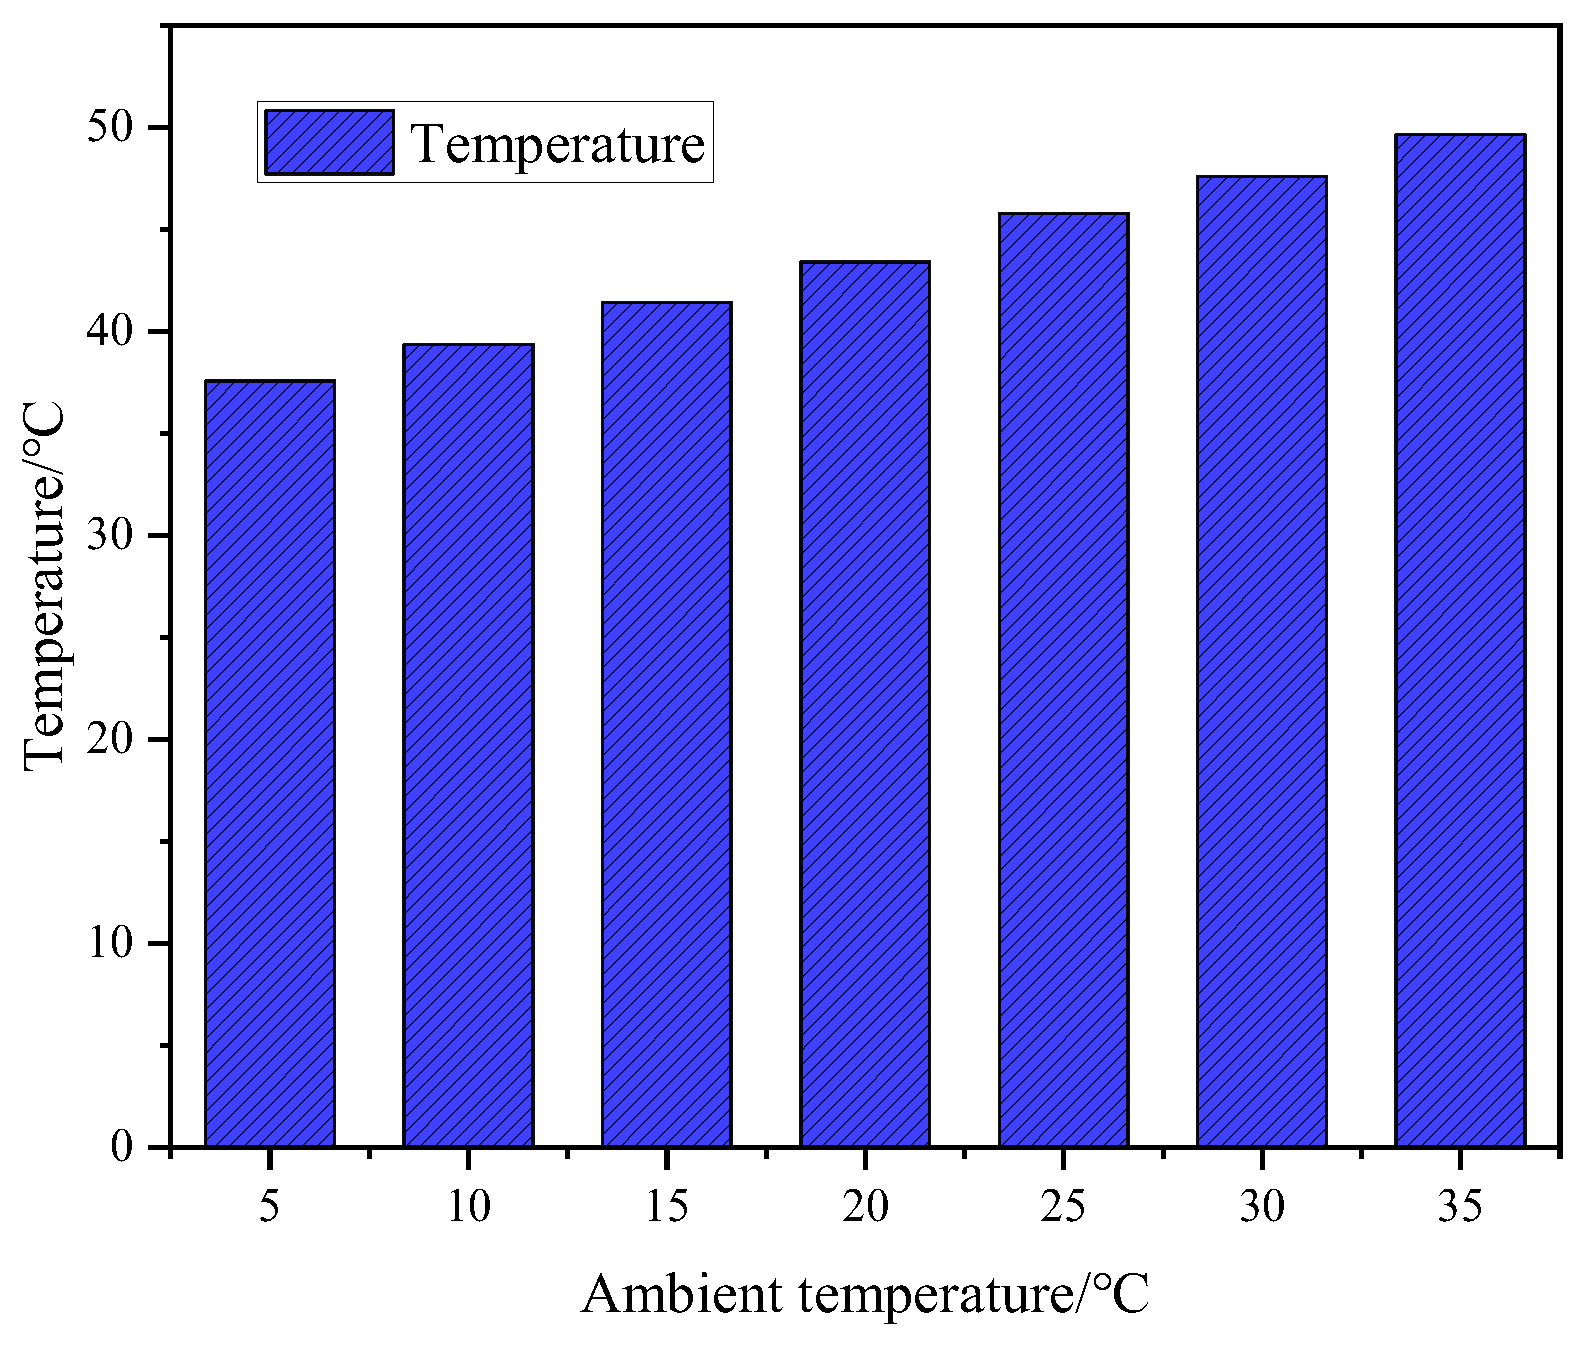
Environmental temperature has a significant impact on photovoltaic systems. Therefore, when designing, installing, and operating photovoltaic systems, it is essential to fully consider and manage the impact of temperature on system performance. The study examined changes in environmental temperature from 5 °C to 35 °C, while other external variables remained constant, namely solar radiation at 600 W·m−2 and wind speed at 1 m·s−1. As shown in Figure 13, when the ambient temperature increases from 5 °C to 35 °C, the system thermal efficiency improves from 31.98% to 52.53%, while the system electrical efficiency decreases only from 11.46% to 10.80%. This is attributed to the high heat transfer rate of microchannel heat pipes, which can effectively dissipate heat even as the ambient temperature rises, keeping the PV temperature within a lower range and reducing the decline in electrical efficiency. Additionally, when the ambient temperature increases from 5 °C to 35 °C, the energy efficiency and exergy efficiency of the PV/T system exhibit different trends. The energy efficiency increases from 56.11% to 75.27%, while the exergy efficiency decreases from 14.36% to 13.80%. The decrease in exergy efficiency is because exergy measures the “quality” of energy. Although a rise in ambient temperature brings in more heat energy (an increase in quantity, which manifests as an increase in thermal efficiency), the decrease in the temperature difference between the heat source (the photovoltaic cell) and the environment reduces the ability of the heat energy to do work (a decrease in quality), resulting in a decrease in exergy efficiency (Figure 14).

4.4.3. Effect of Inlet Water Temperature on PV/T Systems

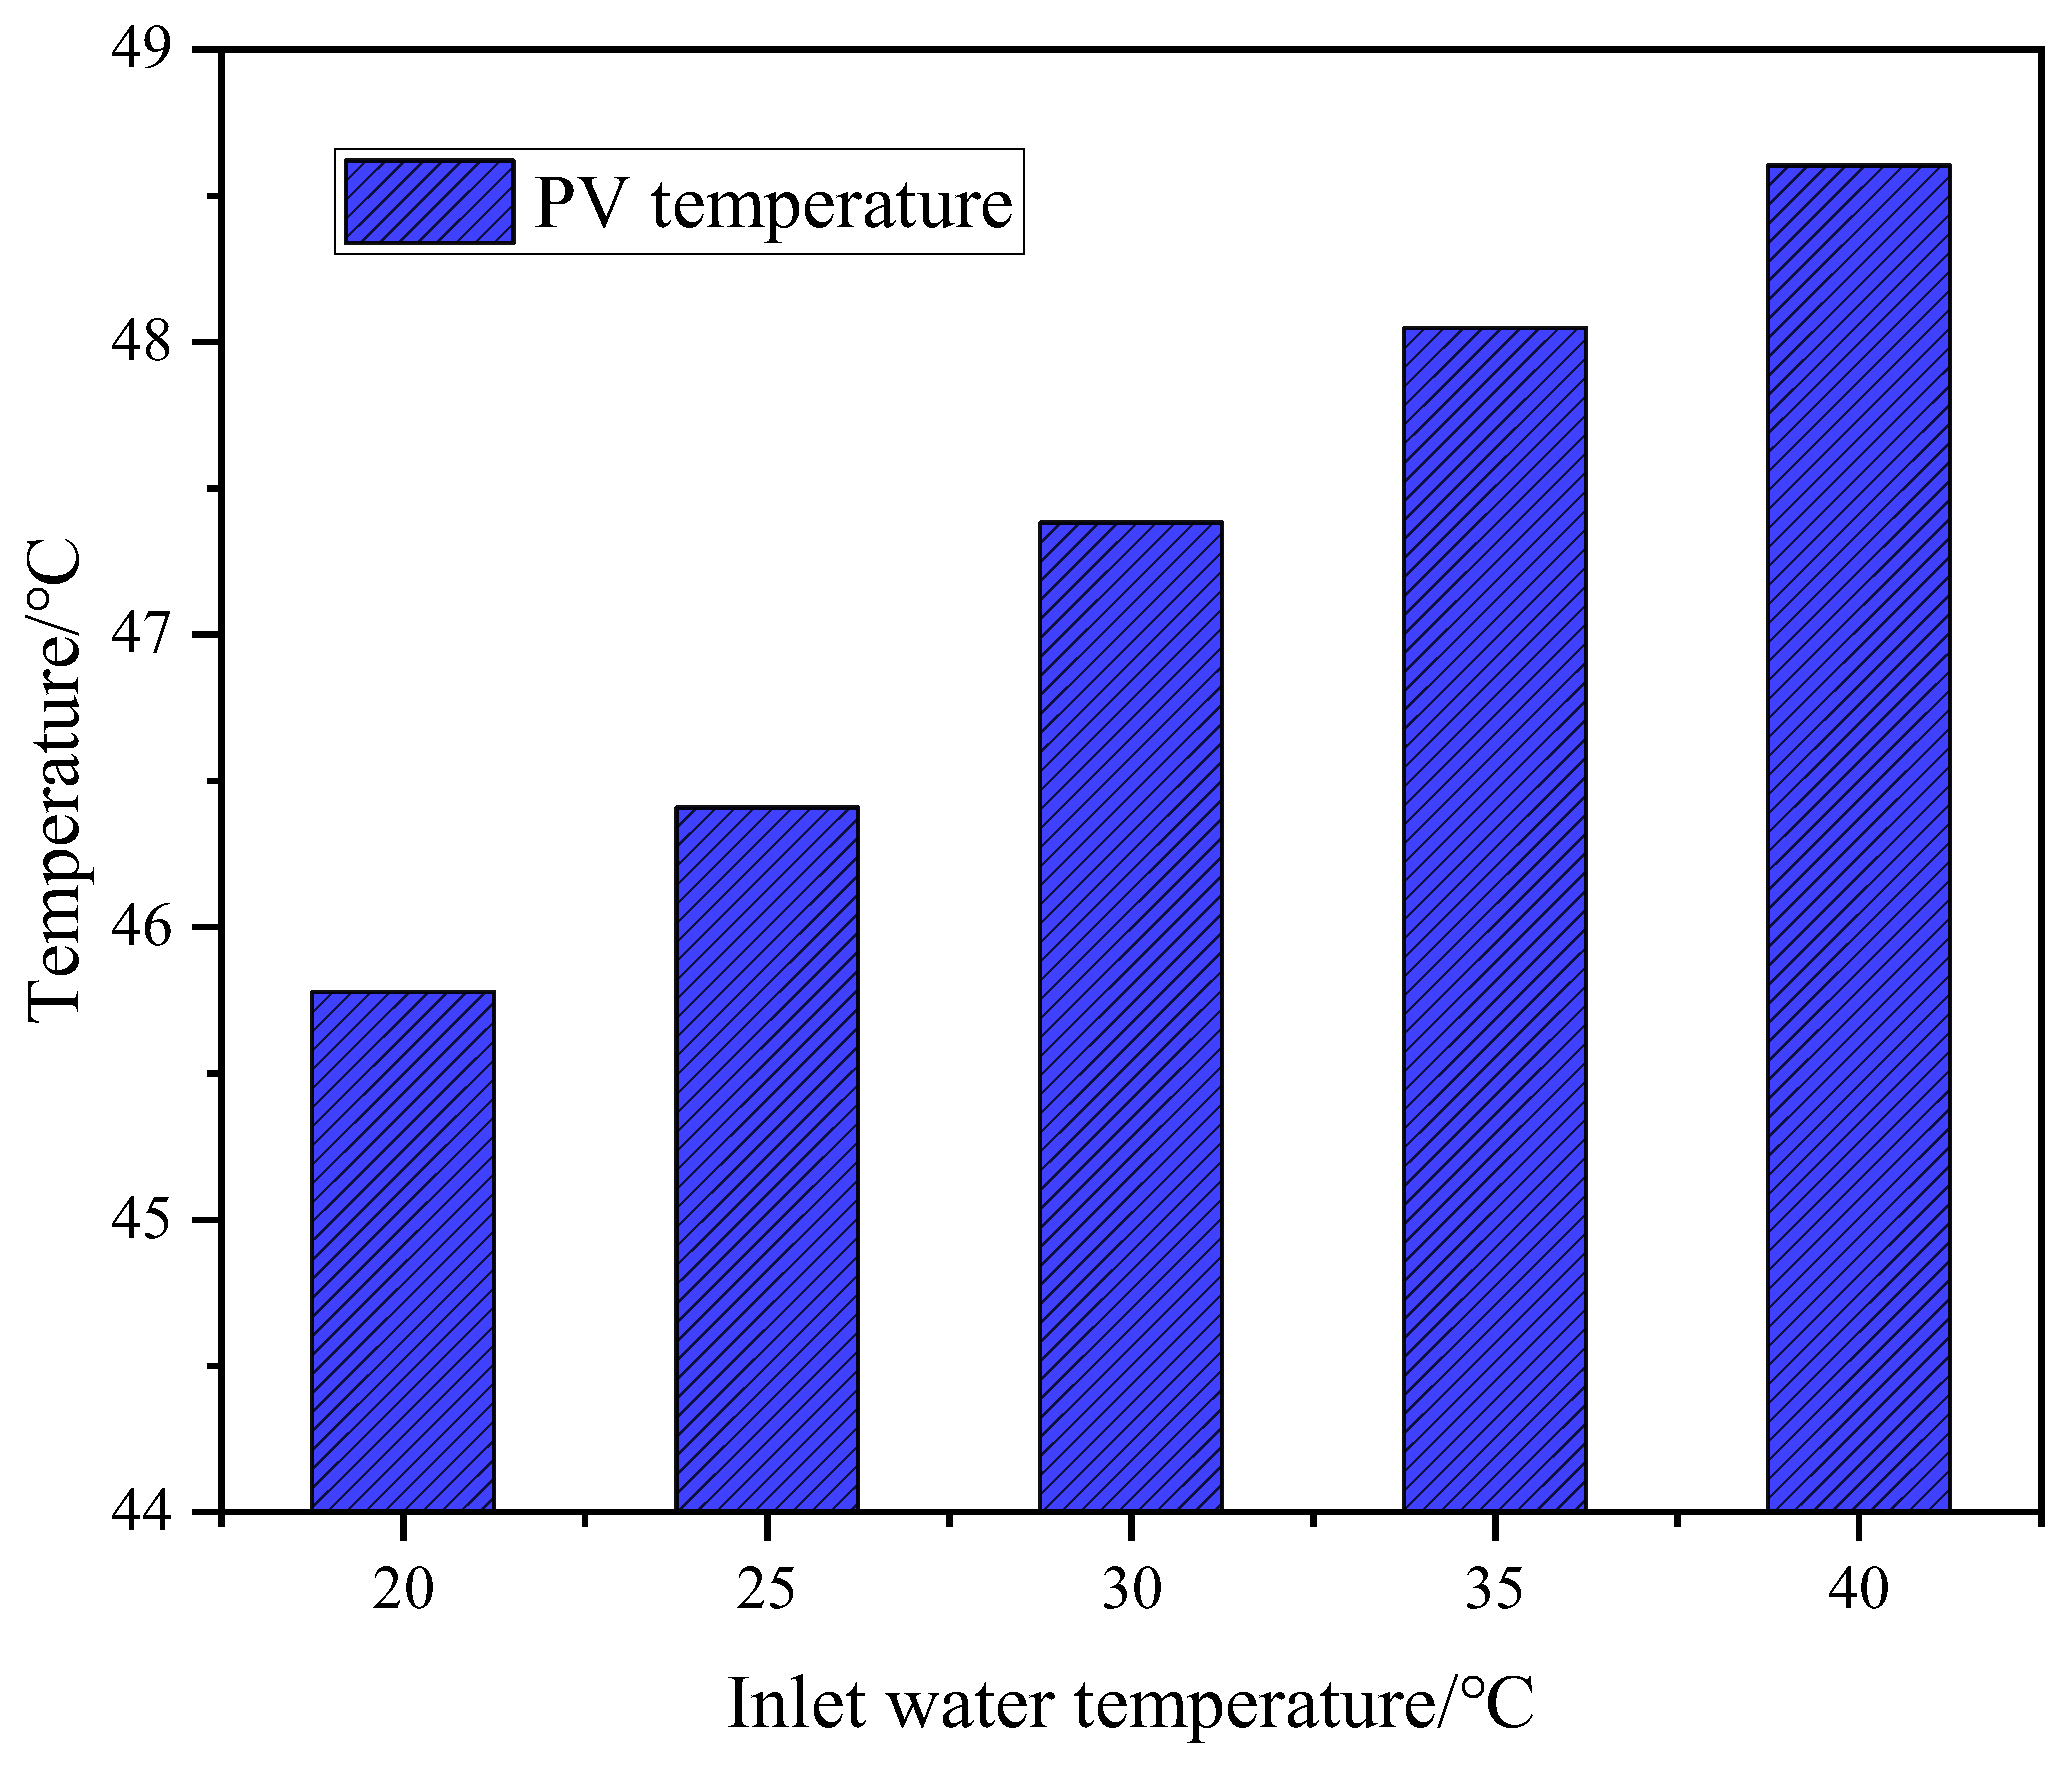
The impact of inlet water temperature on photovoltaic/thermal (PV/T) systems is multifaceted, primarily encompassing the following aspects, simulations were conducted under the following parameter conditions: ambient temperature of 25 °C, solar irradiance of 600 W·m−2, and wind speed of 1 m·s−1. As shown in Figure 15, when the inlet water temperature increases from 20 °C to 40 °C, the thermal efficiency decreases from 48.33% to 36.14%. As the inlet water temperature increases, heat loss between the collector and the surrounding environment increases, thereby reducing thermal efficiency. Additionally, the increase in inlet water temperature also has a negative impact on electrical efficiency. As shown in Figure 16, the temperature change of the photovoltaic cells also leads to the same conclusion, with electrical efficiency decreasing from 11.01% to 10.86%. This is caused by the negative power temperature coefficient of crystalline silicon cells (0.45%/°C). Thermal efficiency comprehensively considers both the quantity and quality of energy, and is closely related to the thermal loss content of the PV/T system, as well as environmental and operating temperatures. When the inlet water temperatures are 20 °C, 25 °C, 30 °C, 35 °C, and 40 °C, the thermal efficiency is 13.98%, 14.06%, 14.15%, 14.25%, and 14.34%, respectively, with an energy efficiency of 68.87%.

4.4.4. Effect of Wind Speed on PV/T Systems

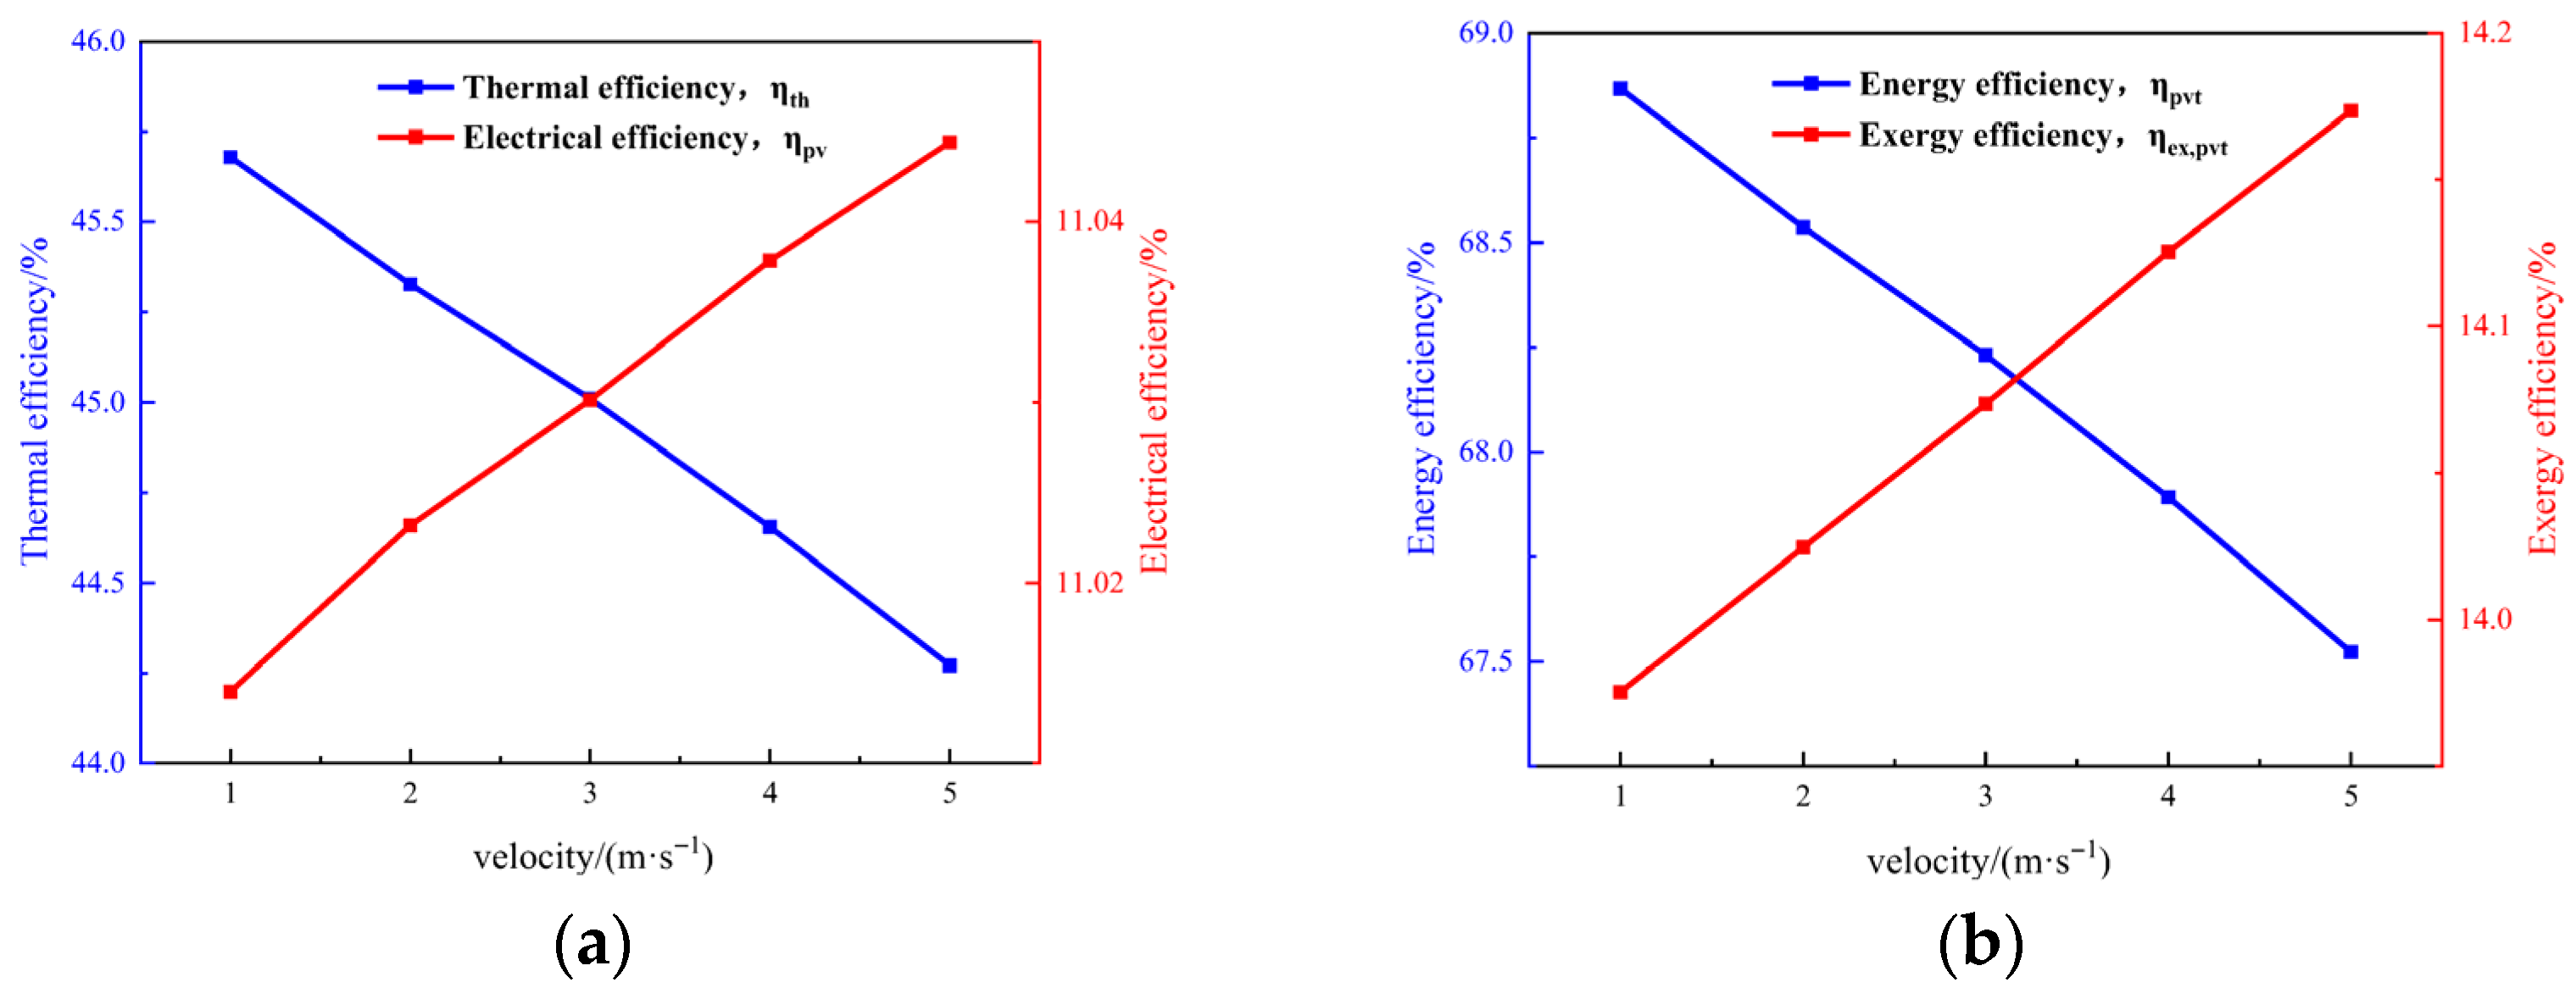
Wind speed also has a significant impact on photovoltaic systems. When wind speed changes from 1 m·s−1 to 5 m·s−1, while keeping other external variables constant (i.e., solar radiation at 600 W·m−2, air temperature at 25 °C), the system’s energy performance was evaluated. The results showed that increasing wind speed slightly reduces thermal efficiency and energy efficiency but slightly improves electrical efficiency and power efficiency. When wind speed increased from 1 m/s to 5 m/s, thermal efficiency decreased from 45.70% to 44.27%, electrical efficiency increased from 11.01% to 11.04%, energy efficiency decreased from 68.87% to 67.52%, and thermal efficiency increased from 13.98% to 14.17%. This is due to an increase in the convective heat transfer coefficient between the PV system and the surrounding environment, leading to a slight increase in system heat loss. However, this increase in the heat transfer coefficient is beneficial for improving electrical efficiency and thermal efficiency (Figure 17).

4.4.5. Analysis of the Impact of Photovoltaic Cell Coverage on Efficiency

The coverage of photovoltaic cells directly affects the absorption and conversion efficiency of solar energy.
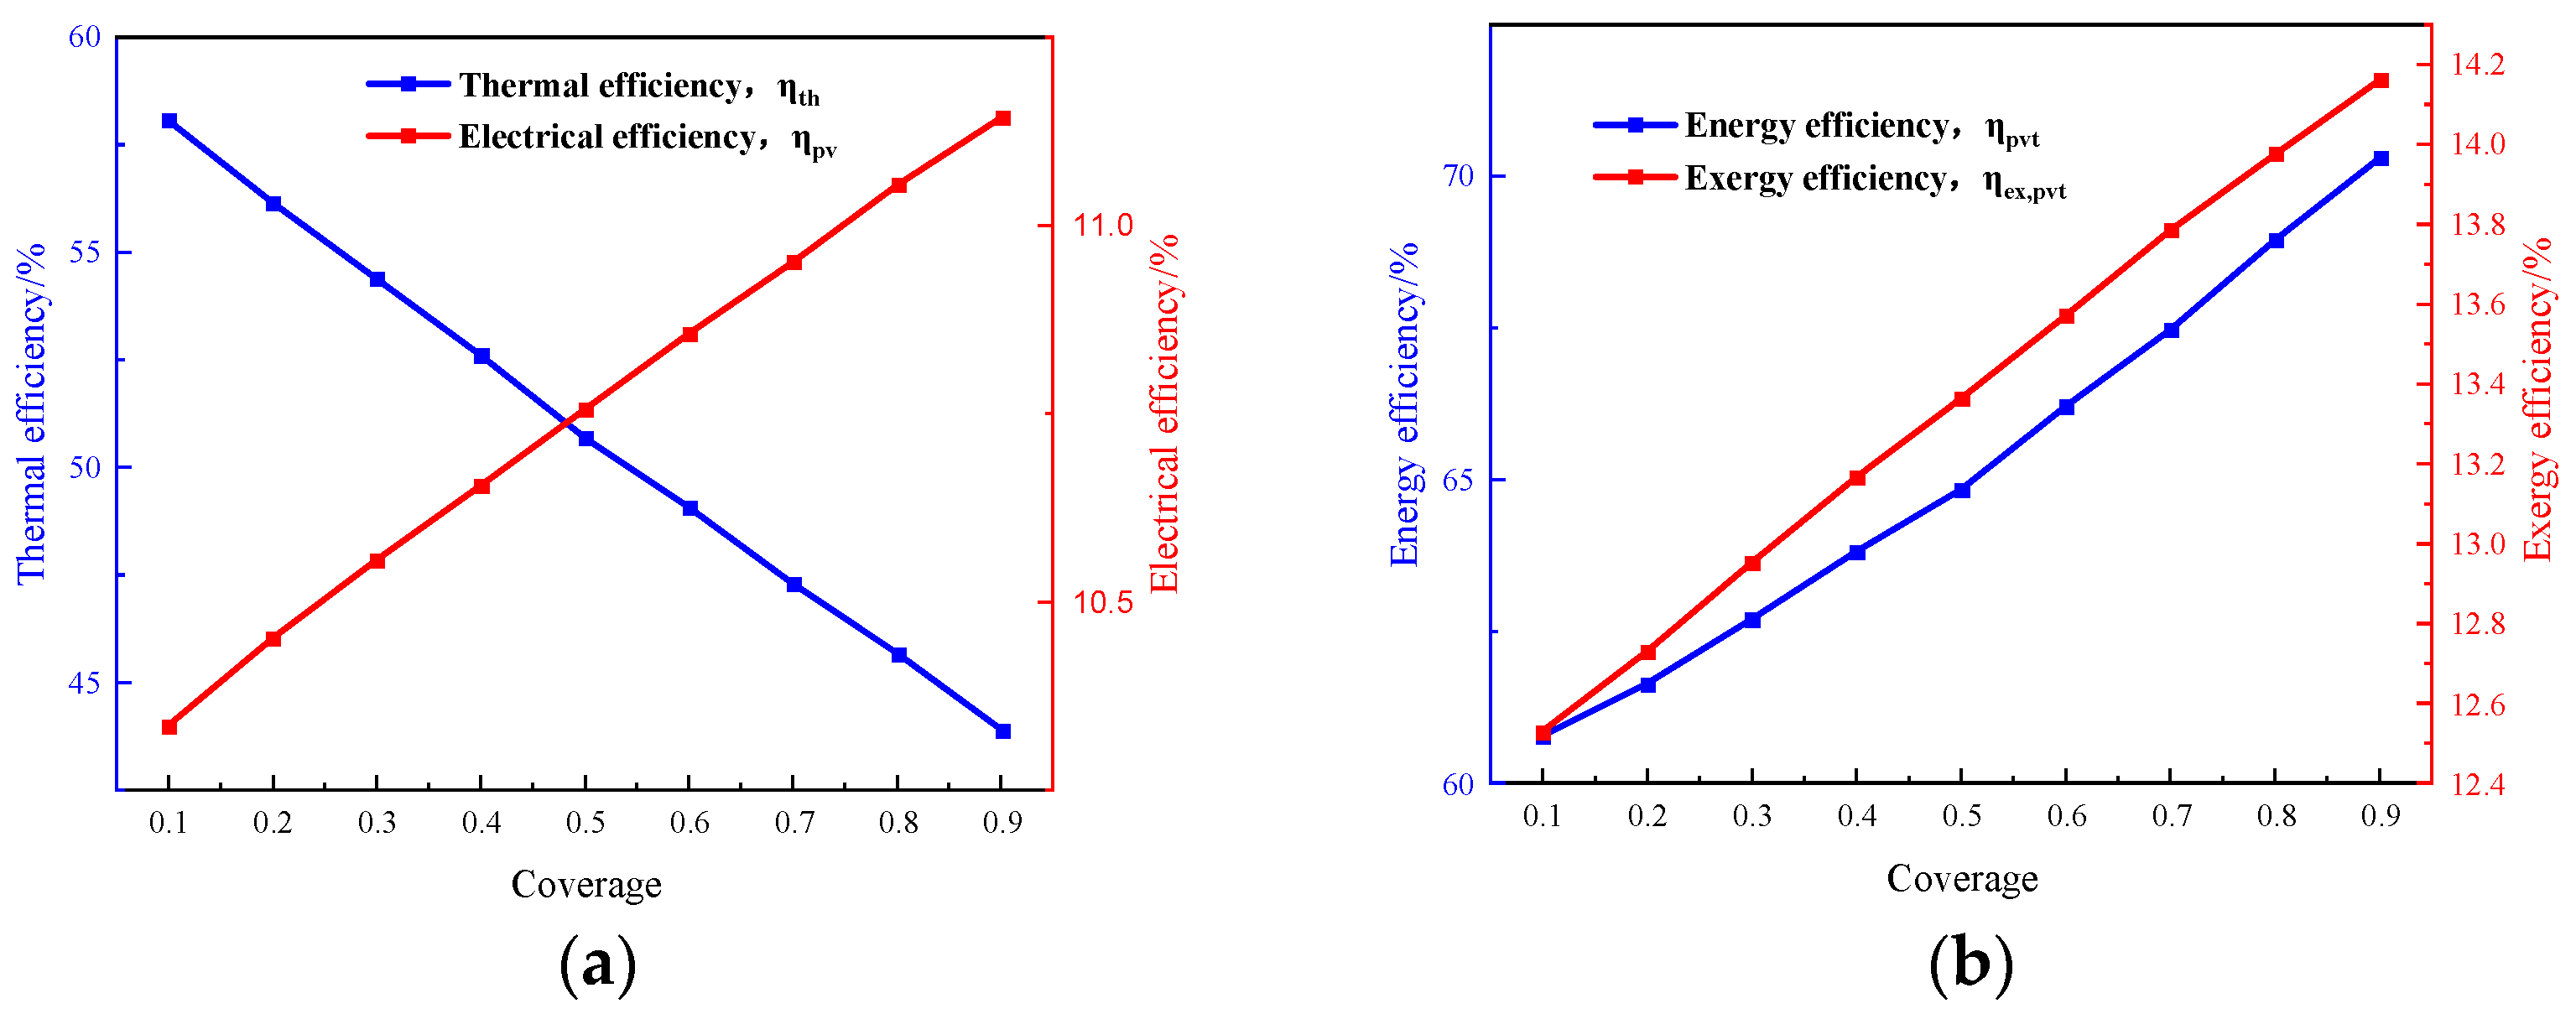
Figure 18 shows that as the coverage coefficient increases, electrical efficiency increases linearly, but thermal efficiency decreases. As the coverage coefficient increases, the area of the photovoltaic cell increases, leading to an increase in power output, but the increase in heat decreases. Additionally, due to the negative temperature coefficient and the decrease in photovoltaic temperature, electrical efficiency increases as the coverage coefficient increases. When the coverage coefficient increases from 0.1 to 0.9, the thermal efficiency decreases relatively, from 58.07% to 43.91%, while the electrical efficiency increases from 10.34% to 11.14%. This is because under constant total solar irradiation, a higher coverage means that more area is used for power generation rather than heat collection, so the heat output decreases. At the same time, due to the relatively smaller heat generation area, the overall operating temperature of the photovoltaic cell decreases. Given that photovoltaic cells have a negative temperature coefficient, the temperature reduction directly leads to an increase in their electrical efficiency. Ultimately, since electrical energy has a higher energy quality than thermal energy, the increase in the proportion of electrical output leads to an upward trend in the exergy efficiency and comprehensive energy efficiency of the system. Both energy efficiency and thermal efficiency show an upward trend, with the combined energy efficiency and thermal efficiency increasing from 60.79% to 70.30%.

5. Conclusions

This study analyzes the performance of a photovoltaic-thermal (PV/T) system integrated with microchannel heat pipes, providing insights for optimizing and applying such systems. The key findings are as follows:
Model and Research Framework: A PV/T model using microchannel heat pipes was developed, combining PV/T and microchannel technologies. A 3D steady-state CFD model was used to examine the phase-change heat transfer mechanism, assessing both microchannel heat pipes and the integrated PV/T system, considering key parameters and environmental/structural factors.
Microchannel Heat Pipe Performance: Key factors influencing heat pipe performance were identified. R134a was found to have a higher heat transfer coefficient than acetone. The optimal filling rate of the heat pipe varied with heat source power, ranging from 30 to 50% for powers below 70 W and 60 to 80% for higher powers. Increasing heat source power improved heat transfer performance until a limit was reached. Additionally, extending the condenser section reduced temperature and thermal resistance, enhancing heat transfer.
PV/T System Performance: The effects of environmental factors (solar irradiance, ambient temperature, wind speed) and structural factors (inlet water temperature, photovoltaic cell coverage) were analyzed. Solar Irradiance: Increased solar irradiance led to higher thermal (from 31.98% to 52.53%) and energy efficiencies (from 56.11% to 75.27%), but slightly reduced electrical efficiency (from 11.46% to 10.80%). Ambient Temperature: As the ambient temperature rose from 5 °C to 35 °C, thermal efficiency improved (31.98% to 52.53%), while electrical efficiency slightly decreased (11.46% to 10.80%). Inlet Water Temperature: When the inlet water temperature increased from 20 °C to 40 °C, thermal efficiency decreased (48.33% to 36.14%), while exergy efficiency increased. Wind Speed: With wind speed increasing from 1 m/s to 5 m/s, thermal and energy efficiencies slightly decreased, while electrical and exergy efficiencies showed minor improvements. Coverage Coefficient: As the coverage coefficient rose from 0.1 to 0.9, thermal efficiency decreased (from 58.07% to 43.91%), but electrical efficiency increased (from 10.34% to 11.14%). The study is limited by a fixed internal structure of the microchannel heat pipes. Future research should explore the effects of different structural configurations on heat transfer processes. Experimental validation of liquid film thickness and the construction of a test rig for seasonal performance analysis are also recommended.
It is important to note that the current investigation into microchannel heat pipes is limited to a fixed internal structure. Given that the internal geometry profoundly influences the heat transfer performance, future work should explore the effects of various structural configurations on internal processes such as evaporation, condensation, and liquid film backflow. Furthermore, while the liquid film thickness has been numerically calculated in this study, subsequent research necessitates validation through visualization experiments to more accurately determine the internal liquid film distribution. Lastly, as this study primarily relies on simulation analysis of the microchannel heat pipe-based PV/T system, the construction of a dedicated experimental test rig is recommended for future work. This would enable a comprehensive analysis of the system’s operational performance across different seasons.
Overall, the findings of this study clarify the key factors affecting the performance of microchannel heat pipe-based PV/T systems and provide valuable references for the design optimization and practical application of such systems in the future.

Author Contributions

Conceptualization, X.R.; methodology, X.R.; software, H.H. and C.P.; validation, H.F., H.L. and Z.S.; formal analysis, H.F.; investigation, C.P.; resources, H.H. and X.R.; data curation, H.L.; writing—original draft preparation, H.H.; writing—review and editing, X.R.; visualization, Z.S.; supervision, X.R.; project administration, H.H.; funding acquisition, H.H. All authors have read and agreed to the published version of the manuscript.

Funding

This research was funded by Changqing Engineering Design Co., Ltd., grant number CEDC-2023-004.

Data Availability Statement

The original contributions presented in this study are included in the article. Further inquiries can be directed to the corresponding author.

Conflicts of Interest

Authors Hu Huang, Hao Fu and Huashan Li were employed by Changqing Engineering Design Co., Ltd. The remaining authors declare that the research was conducted in the absence of any commercial or financial relationships that could be construed as a potential conflict of interest. The Changqing Engineering Design Co., Ltd. had no role in the design of the study; in the collection, analyses, or interpretation of data; in the writing of the manuscript, or in the decision to publish the results.

Nomenclature

Roman Letters
SymbolMeaning
AArea
AcCollector area
AiArea of the i-th layer
ALVInterfacial area density between liquid and vapor
cpSpecific heat capacity
DDiameter (Sauter mean diameter)
ETotal energy per unit mass
ExExergy
ExelElectrical exergy
ExinInput exergy (solar radiation)
ExthThermal exergy
GSolar irradiance
gGravitational acceleration vector
hConvective heat transfer coefficient
hfgLatent heat of vaporization
kTurbulent kinetic energy
LLength
LeLength of evaporation section
LcLength of condensation section
LaLength of adiabatic (insulation) section
mdotMass flow rate
mdot,glNet mass flow rate through the Gas–Liquid interface
MMolar mass
nUnit normal vector
PPressure
PsatSaturation pressure
QHeat source power
qHeat flux
RThermal resistance
RgGas constant
SSource term (general)
SmMass source term
SvMomentum source term
SEEnergy source term
TTemperature
TambAmbient temperature
TavgAverage temperature
TcellPV cell temperature
TinInlet water temperature
ToutOutlet water temperature
TrefReference temperature (298.15 K)
TsatSaturation temperature
TskySky temperature
TsunSolar surface temperature (5760 K)
tTime
UOverall heat transfer coefficient
vVelocity vector
uWind speed
VVolume
WdotPower generation per unit volume
Greek Letters
αVolume fraction
αLLiquid phase volume fraction
αVVapor phase volume fraction
βTime relaxation factor (phase change)
βeEvaporation time relaxation factor
βcCondensation time relaxation factor
εTurbulent dissipation rate
ηEfficiency (general)
η0Reference PV efficiency at Tref
ηelElectrical efficiency
ηexExergy efficiency
ηex,elElectrical exergy efficiency
ηex,thThermal exergy efficiency
ηex,pvElectrical exergy efficiency
ηex,pvtExergy efficiency
ηthThermal efficiency
ηpvElectrical efficiency
ηpvtEnergy efficiency
ηpowerAverage thermal-to-electric conversion efficiency (38%)
κThermal conductivity
λAbsorption coefficient
μDynamic viscosity
μtTurbulent viscosity
ρDensity
ρmMixture density
σSurface tension coefficient
σeC_2ε Empirical constants in k-ε model
τShear stress
φPV coverage ratio (PV cell area/Collector area)
ψReflectance
Subscripts and Superscripts
eEvaporation/Evaporator
cCondensation/Condenser
LLiquid phase
VVapor phase
glGas–Liquid interface
mMixture
satSaturation state
refReference condition
ii-th layer (in PV model)
elElectrical
thThermal
inInlet
outOutlet
ambAmbient
skySky
sunSun
cellPhotovoltaic Cell
genGeneration

References

  1. Shahsavar, A.; Arıcı, M. Energy and exergy analysis and optimization of a novel heating, cooling, and electricity generation system composed of PVT-heat pipe system and thermal wheel. Renew. Energy 2023, 203, 394–406. [Google Scholar] [CrossRef]
  2. Li, R.; Zhai, P.; Li, J.; Liu, X. Experimental study and performance enhancement of micro heat pipe PV/T system. Energy Built Environ. 2025, 6, 718–729. [Google Scholar] [CrossRef]
  3. Li, C.; Wang, H.; Zhao, Y.; Li, P.; Zhao, L. Investigation of the heat transfer perfor-mance of micro heat pipe arrays with long evaporation sections for thermal management in PV/T systems. Appl. Therm. Eng. 2025, 280, 128394. [Google Scholar] [CrossRef]
  4. Liu, X.; Wu, Q.; Li, J.; Novakovic, V. Annual Optimal Performance Anal-ysis of Micro Heat Pipe PV/T under Different Angles in Northwest China. J. Therm. Sci. 2025, 34, 400–412. [Google Scholar] [CrossRef]
  5. Cotter, T.P. Principles and Prospects for Micro Heat Pips; International Heat Pipe Conference; Los Alamos National Laboratory (LANL): Los Alamos, NM, USA, 1984; Volume 48, p. 101860. [Google Scholar]
  6. Launay, S.; Sartre, V.; Lallemand, M. Experimental study on silicon micro-heat pipe arrays. Appl. Therm. Eng. 2004, 24, 233–243. [Google Scholar] [CrossRef]
  7. Peterson, G.P.; Duncan, A.B.; Weichold, M.H. Experimental Investigation of Micro Heat Pipes Fabricated in Silicon Wafers. J. Heat Transf. 1993, 115, 751–756. [Google Scholar] [CrossRef]
  8. Modjinou, M.; Ji, J.; Li, J.; Yuan, W.; Zhou, F. A numerical and experimental study of micro channel heat pipe solar photovoltaics thermal system. Appl. Energy 2017, 206, 708722. [Google Scholar] [CrossRef]
  9. Diallo, T.M.; Yu, M.; Zhou, J.; Zhao, X.; Shittu, S.; Li, G.; Ji, J.; Hardy, D. Energy performance analysis of a novel solar PVT loop heat pipe employing a microchannel heat pipe evaporator and a PCM triple heat exchanger. Energy 2019, 167, 866–888. [Google Scholar] [CrossRef]
  10. Ren, X.; Yu, M.; Zhao, X.; Li, J.; Zheng, S.; Chen, F.; Wang, Z.; Zhou, J.; Pei, G.; Ji, J. Assessment of the cost reduction potential of a novel loop-heat-pipe solar photovoltaic/thermal system by employing the distributed parameter model. Energy 2020, 190, 116338. [Google Scholar] [CrossRef]
  11. Yu, F.; Ji, T.; Liu, X.; Zhang, C. Experimental Study on the Influence of Liquid Filling Ratio on Heat Transfer Characteristics of Small Gravity Heat Pipes. J. Eng. Thermophys. 2018, 39, 2749–2754. [Google Scholar]
  12. Noie, S.H.; Sarmasti Emami, M.R.; Khoshnoodi, M. Effect of Inclination Angle and Filling Ratio on Thermal Performance of a Two-Phase Closed Thermosyphon under Normal Op-erating Conditions. Heat Transf. Eng. 2007, 28, 365–371. [Google Scholar] [CrossRef]
  13. Fazeli, K.; Vafai, K. Analysis of optimized combined microchannel and heat pipes for elec-tronics cooling. Int. J. Heat Mass Transf. 2024, 219, 124842. [Google Scholar] [CrossRef]
  14. Zheng, G.; Deng, D.; Shen, Y.; Huang, Y.; Wu, H. Multi-objective optimization of Ω-shaped reentrant microchannels by numerical simulation and genetic algorithm. Heat Mass Transf. 2025, 61, 96. [Google Scholar] [CrossRef]
  15. Wen, X.; Ji, J.; Li, Z.; Song, Z.; Yao, T. Performance characterization of a PV/T system employing mi-cro-channel heat pipes and thermoelectric generators: An experimental and numerical study. Energy 2023, 264, 126182. [Google Scholar] [CrossRef]
  16. Yang, Z.; Song, J.; Zhang, G.; Sun, X.; Cheng, S.; Zhang, X.; Jiang, Y. Unraveling the promotion for SO2 and H2O resistance of transition metal-doped CeO2-TiO2 catalysts in NH3-SCR reaction: A DFT study. J. Hazard. Mater. 2025, 489, 137563. [Google Scholar] [CrossRef] [PubMed]
  17. Incropera, F.P.; DeWitt, D.P.; Bergman, T.L.; Lavine, A.S. Fundamentals of Heat and Mass Transfer, 7th ed.; John Wiley & Sons: New, York, NY, USA, 2013; pp. 565–567. [Google Scholar]
  18. Faghri, A. Heat pipe science and technology. Fuel Energy Abstr. 1995, 36, 285. [Google Scholar] [CrossRef]
  19. Peterson, G.P. An Introduction to Heat Pipes: Modeling, Testing, and Applications; John Wiley & Sons: New, York, NY, USA, 1994. [Google Scholar]
  20. Green, M.A.; Dunlop, E.D.; Yoshita, M.; Kopidakis, N.; Bothe, K.; Siefer, G.; Hinken, D.; Rauer, M.; Hohl-Ebinger, J.; Hao, X. Solar cell efficiency tables (Version 63). Prog. Photovolt. Res. Appl. 2024, 32, 3–13. [Google Scholar] [CrossRef]
  21. Patankar, S. Numerical Heat Transfer and Fluid Flow; CRC Press: Boca Raton, FL, USA, 2018. [Google Scholar]
  22. Brackbill, J.U.; Kothe, D.B.; Zemach, C. A continuum method for modeling surface tension. J. Comput. Phys. 1992, 100, 335–354. [Google Scholar] [CrossRef]
  23. Launder, B.E.; Spalding, D.B. The numerical computation of turbulent flows. In Numerical Prediction of Flow, Heat Transfer, Turbulence and Combustion; Pergamon: Oxford, UK, 1983; pp. 96–116. [Google Scholar]
  24. Knudsen, M.; Partington, J.R. The Kinetic.Theory of Gases. Some Modern Aspects. J. Phys. Chem. 1952, 39, 307. [Google Scholar] [CrossRef]
  25. Tanasawa, I. Advances in condensation heat transfer. In Advances in Heat Transfer; Elsevier: Amsterdam, The Netherlands, 1991; Volume 21, pp. 55–139. [Google Scholar]
  26. De Schepper, S.C.K.; Heynderickx, G.J.; Marin, G.B. Modeling the evaporation of a hydrocarbon feedstock in the convection section of a steam cracker. Comput. Chem. Eng. 2009, 33, 122–132. [Google Scholar] [CrossRef]
  27. Shittu, S.; Li, G.; Zhao, X.; Akhlaghi, Y.G.; Ma, X.; Yu, M. Comparative study of a concentrated photovoltaic thermoelectric system with and without flat plate heat pipe. Energy Convers. Manag. 2019, 193, 1–14. [Google Scholar] [CrossRef]
  28. Joshi, A.S.; Tiwari, A.; Tiwari, G.N.; Dincer, I.; Reddy, B.V. Performance evaluation of a hybrid photovoltaic thermal (PV/T)(glass-to-glass) system. Int. J. Therm. Sci. 2009, 48, 154–164. [Google Scholar] [CrossRef]
  29. Lee, J.H.; Hwang, S.G.; Lee, G.H. Efficiency Improvement of a Photovoltaic Thermal (PVT) System Using Nanofluids. Energies 2019, 12, 3063. [Google Scholar] [CrossRef]
  30. Gholampour, M.; Ameri, M. Energy and exergy analyses of Photovoltaic/Thermal flat transpired collectors: Experimental and theoretical study. Appl. Energy 2016, 164, 837–856. [Google Scholar] [CrossRef]
  31. Jeter, S.M. Maximum conversion efficiency for the utilization of direct solar radiation. Sol. Energy 1981, 26, 231–236. [Google Scholar] [CrossRef]
  32. Ren, X.; Li, J.; Zhao, X.; Cao, J.; Pei, G.; Ji, J. Parametric Analysis of a Novel Photovoltaic/Thermal System Using Amorphous Silicon Cells and Micro-Channel Loop Heat Pipes. Heat Transf. Eng. 2022, 43, 1149–1170. [Google Scholar] [CrossRef]
  33. Zhou, J.C.; Zhang, Z.; Liu, H.J.; Yi, Q. Temperature distribution and back sheet role of polycrystalline silicon photovoltaic modules. Appl. Therm. Eng. 2017, 111, 1296–1303. [Google Scholar] [CrossRef]
  34. Zhou, J.; Yi, Q.; Wang, Y.; Ye, Z. Temperature distribution of photovoltaic module based on finite element simulation. Sol. Energy 2015, 111, 97–103. [Google Scholar] [CrossRef]
  35. Cecelski, C.E.; Harris, K.J.; Goodman, C.A.; Kimes, W.A.; Liu, Q.; Miller, W.R.; Carney, J. Certification of NIST Gas Mixture Standard Reference Materials: NIST SP 260-222; National Institute of Standards and Technology: Gaithersburg, MD, USA, 2022; Volume 260. [Google Scholar]
  36. Fadhl, B.; Wrobel, L.C.; Jouhara, H. CFD modelling of a two-phase closed thermosyphon charged with R134a and R404a. Appl. Therm. Eng. 2015, 78, 482–490. [Google Scholar] [CrossRef]
Figure 1. Structure diagram of microchannel heat pipe.
Processes 13 03402 g001
Figure 2. Schematic diagram of a microchannel heat pipe.
Processes 13 03402 g002
Figure 3. Schematic diagram of PV/T system structure.
Processes 13 03402 g003
Figure 4. Microchannel heat pipe meshing.
Processes 13 03402 g004
Figure 5. Grid Independence Verification.
Processes 13 03402 g005
Figure 6. Equivalent heat transfer coefficients of R134a and acetone heat pipes.
Processes 13 03402 g006
Figure 7. Thermal resistance corresponding to input power: (a) 10 W; (b) 30 W; (c) 50 W; (d) 70 W; (e) 90 W; (f) 110 W.
Processes 13 03402 g007
Figure 8. Phase distribution diagram inside the heat pipe (The lengths of the condensation sections from left to right are 100 mm, 200 mm, and 300 mm, respectively).
Processes 13 03402 g008
Figure 9. Distribution of thermal resistance at 50% liquid filling rates (Le: condensation section length).
Processes 13 03402 g009
Figure 10. Distribution of liquid film thickness (L: condensation section length).
Processes 13 03402 g010
Figure 11. Effects of solar irradiance: (a) thermal and electrical efficiency; (b) The impact of energy efficiency and efficiency.
Processes 13 03402 g011
Figure 12. The effect of solar irradiation on the temperature of photovoltaic cells.
Processes 13 03402 g012
Figure 13. Effects of ambient temperature: (a) thermal and electrical efficiency; (b) Energy efficiency and efficiency.
Processes 13 03402 g013
Figure 14. The relationship between ambient temperature and photovoltaic cell temperature.
Processes 13 03402 g014
Figure 15. Effects of inlet water temperature: (a) thermal and electrical efficiency; (b) Energy efficiency and efficiency.
Processes 13 03402 g015
Figure 16. The effect of imported water temperature on the temperature of photovoltaic cells.
Processes 13 03402 g016
Figure 17. Effect of wind speed: (a) thermal and electrical efficiency; (b) Energy efficiency and efficiency.
Processes 13 03402 g017
Figure 18. Effects of PV cell coverage: (a) thermal and electrical efficiency; (b) Energy efficiency and efficiency.
Processes 13 03402 g018
Table 1. Model calculation settings.
Model SettingsHeat Pipe WallWorking FluidModelSolverFlow ModelSolution Method
MaterialsaluminumR134a/acetoneMixturePressure solverk-e modelQuick
Table 2. Schepper et al. proposed gas–liquid phase transition model [26].
Transmission VolumePhase Transition ProcessPhase Transition CriterionPhaseSource Term Expression
QualityEvaporation T L > Τ sat liquid phase J M , L = β e ρ L α L T L T s a t T s a t
gas phase J M , L = β e ρ L α L T L T s a t T s a t
Condensation T V < Τ sat liquid phase J M , V = β c ρ V α V T s a t T V T s a t
gas phase J M , V = β c ρ V α V T s a t T V T s a t
EnergyEvaporation T L > Τ sat E l v = β e ρ L α L T L T s a t T s a t Δ H
Condensation T V < Τ sat E v l = β e ρ V α V T s a t T V T s a t Δ H
Table 3. R134a and acetone physical parameters [35].
Physical ParametersR134aAcetoneUnit
liquid density1147.4797.2kg·m−3
gas density32.252.12kg·m−3
Specific heat capacity of liquid1.42462.1625kJ·kg−1·K−1
Specific heat capacity of gas1.03161.45237kJ·kg−1·K−1
liquid phase thermal conductivity0.0811340.177702W·m−1·k−1
gas phase thermal conductivity0.0138250.0096338W·m−1·k−1
liquid viscosity1.9489 × 10−43.31 × 10⁻⁴kg·m−1·s−1
gas phase viscosity1.1693 × 10−57.25 × 10⁻⁶kg·m−1·s−1
Molecular weight102.0358.0791kg·kmol−1
critical temperature374.21508.65K
critical pressure40,5934720kPa
Table 4. Length of each section of heat pipe.
PartEvaporation SectionThermal Insulation SectionCondensation Section
Length/mm600300100
600200200
600100300
Disclaimer/Publisher’s Note: The statements, opinions and data contained in all publications are solely those of the individual author(s) and contributor(s) and not of MDPI and/or the editor(s). MDPI and/or the editor(s) disclaim responsibility for any injury to people or property resulting from any ideas, methods, instructions or products referred to in the content.