Review

Quantitative Detection of Toxic Elements in Food Samples by Inductively Coupled Plasma Mass Spectrometry (ICP-MS)

1
Faculty of Science, The University of Hongkong, Pokfulam, Hong Kong
2
Key Laboratory for Clean Renewable Energy Utilization Technology, Ministry of Agriculture, College of Engineering, China Agricultural University, Beijing 100083, China
*
Author to whom correspondence should be addressed.
Processes 2025, 13(10), 3361; https://doi.org/10.3390/pr13103361
Submission received: 9 July 2025 / Revised: 28 July 2025 / Accepted: 1 August 2025 / Published: 20 October 2025

Abstract

With industrial development, food safety problems occur frequently. The contamination of harmful elements in food has received widespread attention, especially heavy metal elements such as lead, cadmium, mercury, arsenic, and other heavy metals proven toxic to human health. As one of the most sensitive and accurate analytical techniques for trace element detection, inductively coupled plasma mass spectrometry (ICP-MS) has become an indispensable key technology in the field of food safety testing due to its ability to accurately determine the ppb/ppt level toxic elements in food and analyze the morphology of the elements, and the number of applications in the literature continues to grow remarkably (e.g., the average annual growth rate in the last decade has reached 12–15%), which supports the risk assessment and regulation. It has become an indispensable key technology in this field. In this review, the research progress of ICP-MS in the detection of hazardous elements in food is summarized, focusing on the basic principles of the technique, sample pretreatment methods, and common interference issues. The specific applications of ICP-MS in different types of food (e.g., cereals, aquatic products, vegetables, and dairy products) are also summarized. The main challenges in the current application of ICP-MS are also discussed, including matrix effect, stability of morphological transformation, and standardization issues. It is expected that the development of ICP-MS in portability, automation, and high-throughput detection has brought potential for its applications in food safety detection.

1. Introduction

The safety and quality of food are critical to public health and have become major concerns worldwide due to increasing reports of contamination by toxic substances. Among various contaminants, toxic elements have been proved hazardous to human health. These contaminants are persistent in the environment and cause severe health impacts even at low exposure levels (Figure 1). For example, lead (Pb) is a well-known neurotoxic element that can cause irreversible damage to the central nervous system, particularly in children. It has been reported that the 2014–2016 Flint water crisis resulted from switching the water source without corrosion control, causing lead-contaminated drinking water that caused irreversible harm, especially to children [1]. Cadmium (Cd) is classified as a category 1B carcinogen (probable human carcinogen), primarily causing kidney damage and bone demineralization (osteoporosis) [2]. Cd is an extremely dangerous pollutant due to its acute toxicity, high water solubility, non-biodegradability, and persistence in live organisms [3]. The 1931–1979 Itai-Itai disease outbreak in Japan’s Toyama Prefecture was caused by cadmium contamination from industrial wastewater, leading to chronic poisoning, bone deformities, and deaths among residents who consumed polluted rice and water [4]. Hg2+ accumulates in human tissues, causing cellular dysfunction and organ damage [5]. Inhalational exposure to elemental mercury induces acute systemic, cutaneous, neurological, respiratory, and hematological issues, with pediatric populations showing heightened susceptibility to immune-mediated effects [6,7]. Minamata disease in Japan, first identified in the 1950s, was a severe mercury poisoning outbreak caused by industrial wastewater containing methylmercury, which contaminated seafood and led to devastating neurological disorders and deaths among local residents [8]. Both inorganic arsenic, linked to cancer, genetic mutations, and organ damage, and organic arsenic, which can bio-accumulate and induce cellular stress or developmental effects, pose significant risks to human and environmental health; the ongoing Bangladesh arsenic contamination crisis, identified in 1993, stems from naturally occurring arsenic in groundwater and shallow tube wells, affecting over 77 million people with chronic poisoning, skin diseases, and cancers, marking one of the largest mass poisoning events in history [9]. Therefore, the levels of these harmful elements in food should be detected to ensure public health and safety.
Given the severity of such contamination, the accurate quantification of toxic elements in food has become increasingly critical. Several analytical techniques have been employed for the determination of toxic elements in food, including graphite furnace atomic absorption spectroscopy (GFAAS), flame atomic absorption spectroscopy (FAAS), and inductively coupled plasma optical emission spectroscopy (ICP-OES). GFAAS offers good sensitivity for single-element analysis and requires only small sample volumes, making it suitable for trace-level detection. However, its throughput is limited due to its inability to perform multi-element analysis efficiently. FAAS, while widely used for its simplicity and cost effectiveness, lacks the sensitivity required for detecting ultra-trace elements in complex food matrices. UV–vis spectroscopy is simple and cost-effective for quantitative analysis of colored or UV-absorbing compounds [14] but is limited to specific chromophores and single-element analysis. Atomic fluorescence spectroscopy (AFS) provides high sensitivity for trace element analysis, particularly for heavy metals like As, Se, and Hg, but requires element-specific conditions and complex sample preparation. Inductively coupled plasma emission spectrometry (ICP-OES, also known as ICP-AES) enables simultaneous multi-element analyses, has a wide linear range, and is tolerant of complex matrices [15]. Compared to ICP-MS, which offers lower detection limits and isotope analysis capabilities, ICP-OES is more suitable for analyzing high concentration samples and has lower operating costs, making it a popular choice for high metal content matrices (e.g., environmental, industrial samples, etc.).
ICP-MS has become the preferred technology for modern elemental analysis due to its extremely high sensitivity (detection limits down to ppt levels), ability to analyze over 40 elements simultaneously in a single injection, broad dynamic range (spanning from pg/L to g/L), and isotope analysis capabilities. It effectively mitigates interferences from complex matrices (e.g., high-salt or biological samples) via collision cell technology and supports automated operation for enhanced efficiency [16]. ICP-MS couples with HPLC by nebulizing the HPLC effluent into the ICP plasma, enabling species-specific separation (e.g., metalloproteins) followed by elemental detection for trace analysis in complex matrices [17]. Coupling with laser ablation (LA) technique, which uses a laser to ablate solid samples into vaporized particles carried by argon to the plasma, allows ICP-MS to analyze elemental composition with micrometer-scale spatial resolution for micro-area or non-destructive solid testing without complex sample preparation process [18]. From trace heavy metal detection in environmental samples to isotope tracing in materials, ICP-MS serves as an essential tool across disciplines, leveraging its “all-round” analytical power—trace quantification, speciation/isotope analysis, and multi-element screening—to meet stringent regulatory requirements and solidify its status as the “gold standard” in elemental analysis.
In recent years, many researchers have carried out in-depth studies on various aspects of the use of ICP-MS for food analysis, including sample preparation techniques, improving detection limits, analytical ranges, and method optimization. In this paper, the progress of the application of ICP-MS in the detection of harmful elements in food is summarized. Firstly, the basic principles of ICP-MS and common sample pretreatment strategies are introduced; then, the representative applications of ICP-MS for specific elements and different food types are summarized, including the laser ablation-ICP-MS (LA-ICP-MS) technique for spatial distribution analysis; and the main challenges faced by ICP-MS in practical applications, such as the matrix effect and the transformation of elemental morphology, are also discussed. Finally, the paper discusses the main challenges faced by ICP-MS in practical applications, such as matrix effects and elemental transformations, and looks at future opportunities in the field in terms of high sensitivity, automation, and on-site portable solutions.

2. Principle of ICP-MS

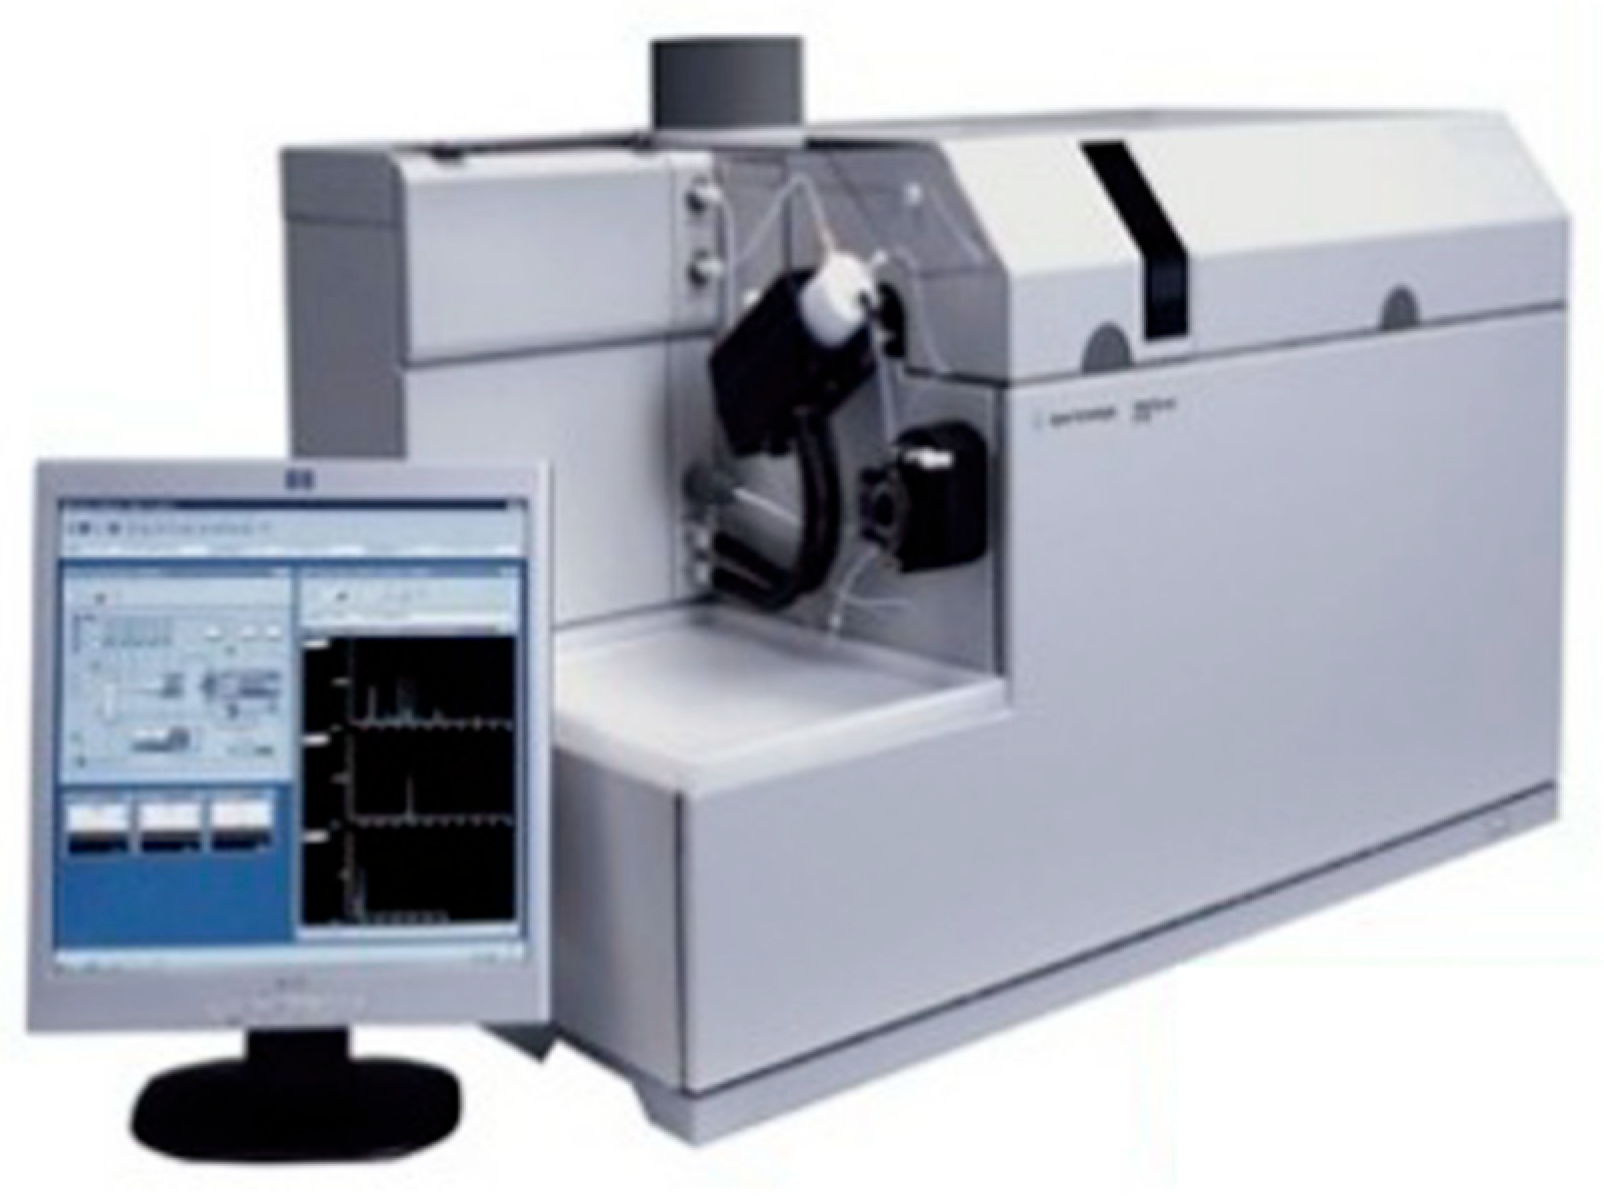
ICP-MS (Figure 2) is the most widely used type of plasma-source mass spectrometry technique, and it has long played and continues to play a pivotal role across diverse domains of applied science and research. Its complementary nature with other ion-source mass spectrometry techniques—such as electrospray ionization mass spectrometry—alongside the recent significant advancements in their development has greatly advanced the field of bioinorganic analytical chemistry [16].
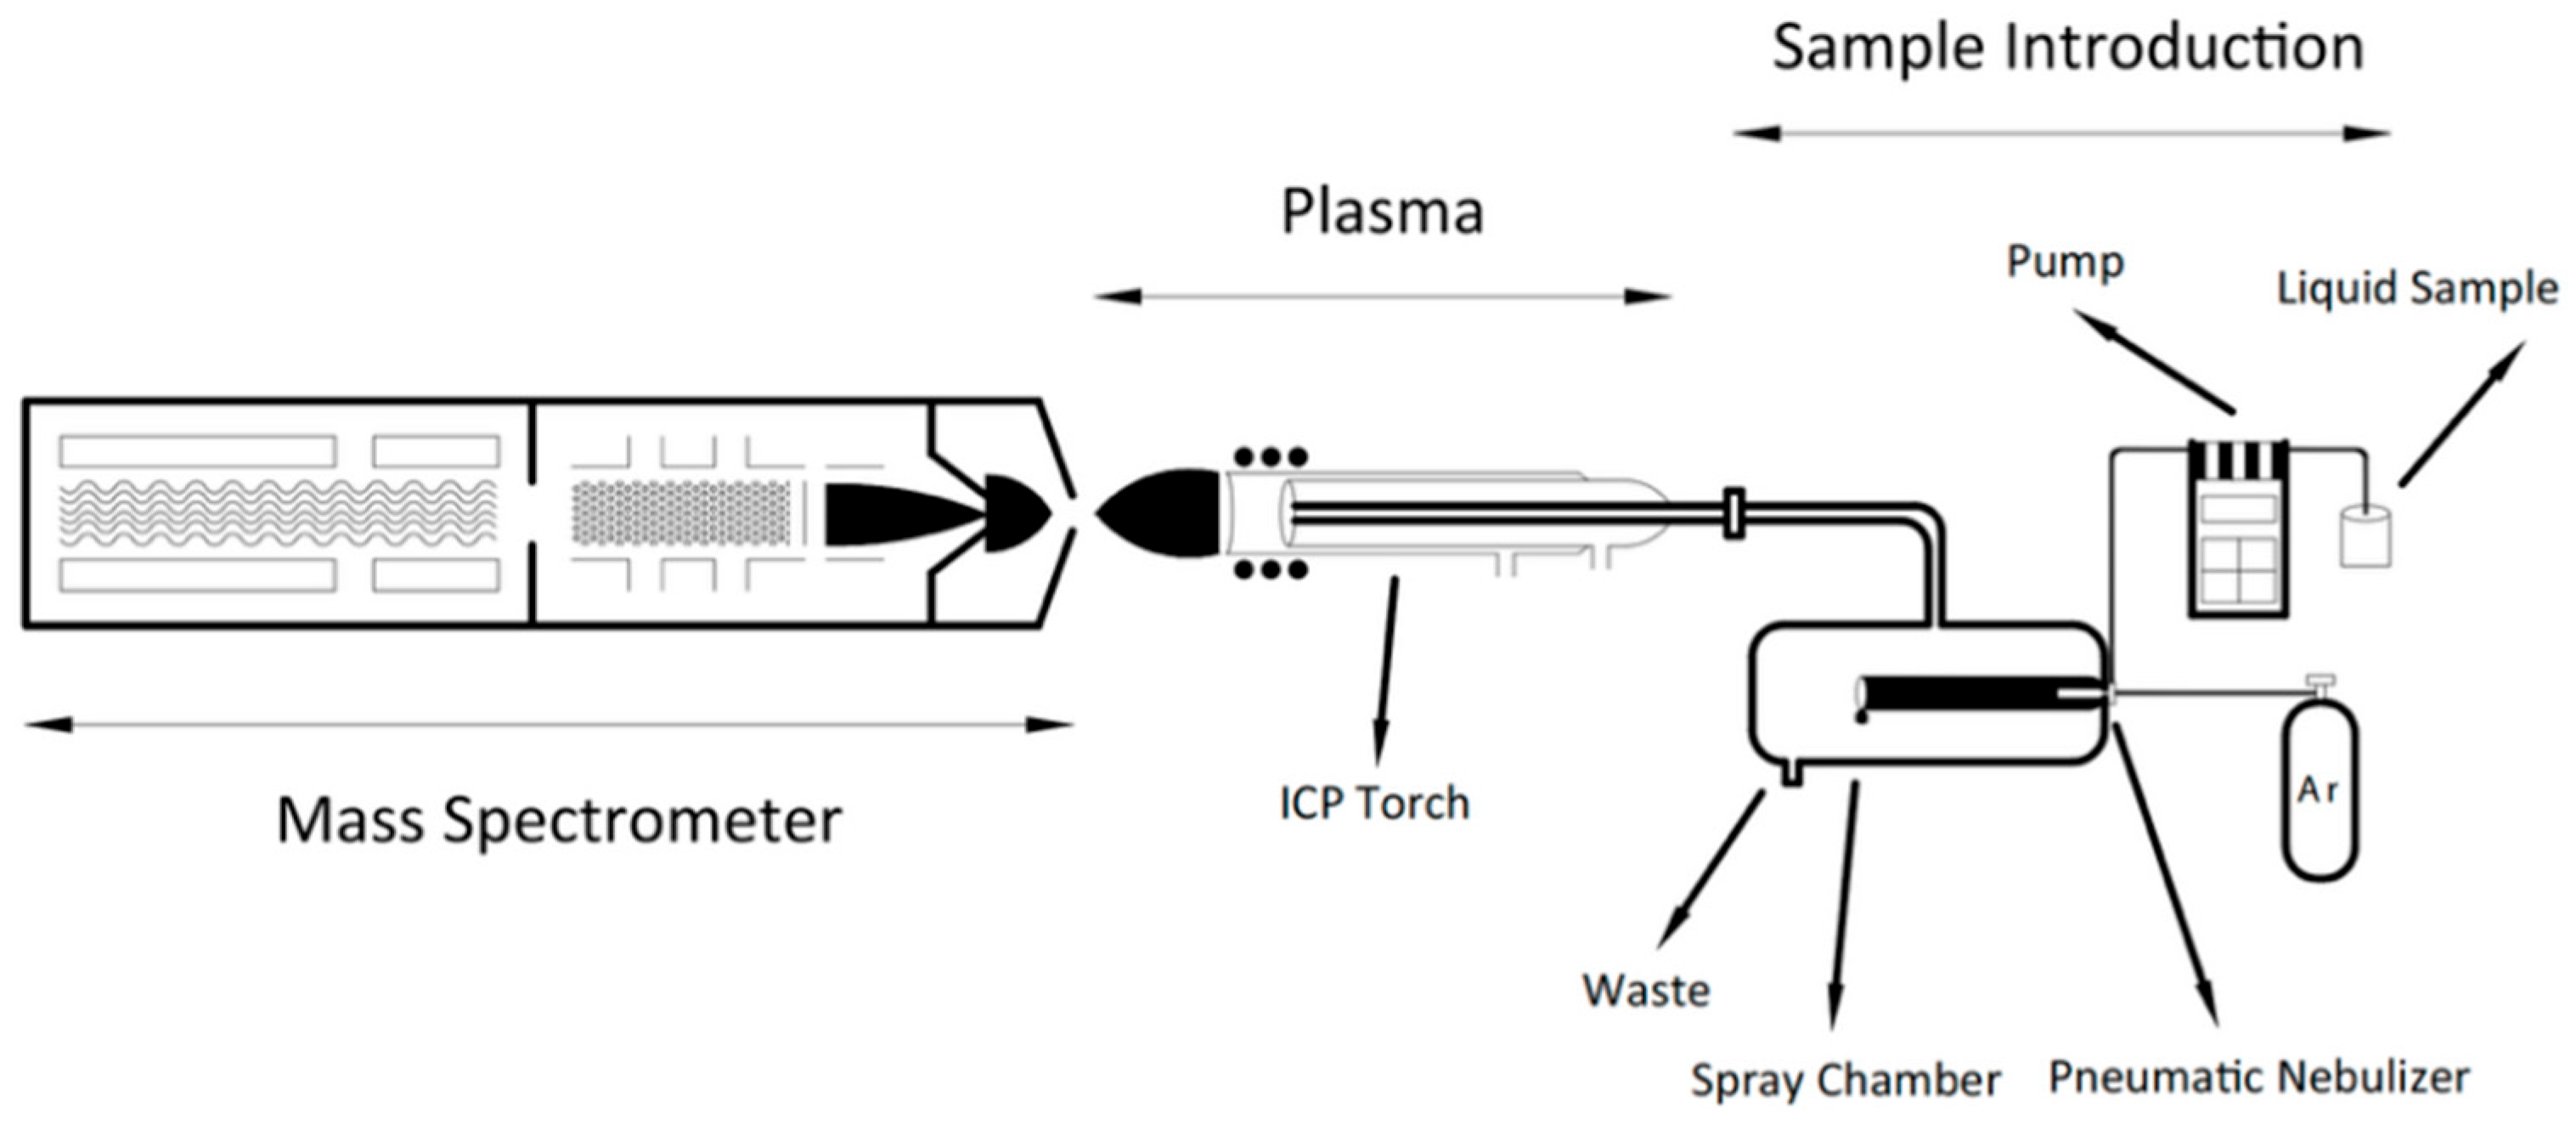
As shown in Figure 3, an ICP is the standard high-temperature ion source, which provides temperatures of approximately 5500 °C that no material can withstand. Thus, it is the most versatile atomizer and element ionizer available. Contrary to low-temperature ion sources for molecular ions, in a plasma, all bonds break. Hence, the data acquired from a plasma ion source correspond to the total content of an element in the sample. The elemental response is independent of the different species containing the same element, enabling simple and accurate species-unspecific, multi-element quantitation. Simple mass spectra in the mass-to-charge (m/z) range 5–250 are generated at the expense of multiple fragmentations and the loss of information on molecular mass and structure. Another unique property of a plasma is that it has the highest ion density (Ar+ and e) and hence provides the highest collision rate available. In combination with the high temperature, this drives the ionization of an element toward the physical limits set by the ionization potential of the element. Thus, much higher analyte ion densities and higher sensitivities are generated than by other ion sources. Additionally, the ICP ion source is much less vulnerable to the salt and solvent loads introduced by a sample [16].

3. Sample Preparation

The summary of the content in this part is shown in Table 1.

3.1. Conventional Sample Preparation Process

Sample preparation in inductively coupled plasma mass spectrometry (ICP-MS) is a critical pre-analytical stage aimed at converting diverse matrices into a homogenous, dissolved state suitable for plasma introduction while minimizing contamination and preserving analyte integrity. Dry ashing and acid digestion are two common sample preparation methods for elemental analysis in ICP-MS [31]. Dry ashing involves heating samples at 450–600 °C to oxidize organic matrices, leaving inorganic residues that are then dissolved in acid. This method is suitable for samples with high organic content (e.g., biological tissues, plant materials, etc.) and requires minimal reagent use, reducing contamination risks [32]. However, it may cause losses of volatile elements (e.g., As, Hg, and Se) due to high temperatures and can lead to analyte adsorption on crucible surfaces, affecting recovery.
Wet digestion uses strong acids (e.g., HNO3, HCl, HF, or mixtures like aqua regia) to decompose samples through chemical oxidation, often performed in open vessels (hotplate) or closed microwave-assisted systems, as shown in Table 2. Researchers can minimize reagent volume, shorten digestion time, and prevent volatile element loss, making it ideal for sensitive elements and complex matrices (e.g., environmental solids, food, etc.). Acid digestion effectively handles both organic and inorganic components but requires careful reagent selection to avoid contamination and may introduce matrix effects from residual salts or excess acids, necessitating dilution or matrix modification for accurate analysis [33]. Matrix effects can significantly affect the accuracy of an ICP-MS analysis; for example, ion suppression is the most common, where high-salt/acid matrices reduce the signal intensity of the element to be measured. Ion enhancement is relatively uncommon, but certain matrix components may also slightly enhance the signal of a particular element. Interference patterns can also be altered, and matrix components may be involved in the formation of new polyatomic interferences (e.g., ArCl+ interfering with As in perchloric acid). These effects can cause results to be low (suppression) or high (enhancement) or can introduce additional interferences. Sample dilution, the simplest of the commonly used mitigation strategies, reduces sensitivity. Secondly, internal standard (IS) involves the addition of internal standard elements (e.g., Sc, Y, In, etc.) with similar properties and correcting the signal of the target element in real time by the change in its signal (e.g., correcting for inhibition of Pb in high salt matrices with Y). Third, matrix-matched standards are calibrated using standard solutions similar to the sample matrix. Fourth, the standard addition method (SAM), where a known amount of standard solution is added to the sample for calibration, is effective but cumbersome. There are also improvements to the sample introduction system, such as high-salt resistant interfaces and desolvation devices, to minimize interferences [34]. After sample preparation, the ICP-MS detection workflow involves converting prepared samples into ions, separating them by mass-to-charge ratio (m/z), and quantifying abundances through sequential stages.

3.2. Polyatomic Interferences Correction

In ICP-MS analysis, polyatomic ion interferences (e.g., superposition of ArCl+ on As+) are mainly eliminated by collision/reaction cell (CRC) or high-resolution ICP-MS (HR-ICP-MS) techniques. CRC-ICP-MS is classified into two types of modes: The first one is the He collision cell mode (physical process), which utilizes the kinetic energy discrimination (KED) principle, where polyatomic interfering ions (e.g., ArCl+) have a larger collision cross-section than analyte ions (e.g., As+) and undergo more collisions in the He cell with a greater loss of kinetic energy. By applying a voltage barrier (KED voltage) at the cell exit, low-kinetic-energy interfering ions are blocked, while analyte ions can pass through the detection. The second reaction cell mode (chemical process) uses reactive gases (e.g., H2, NH3, O2, etc.) to react chemically with the interfering ions, converting them to other substances (e.g., Ar+ + H2 → Ar + H2+) or “mass transferring” the analyte ions to an uninterfering m/z value. High-resolution ICP-MS (HR-ICP-MS) distinguishes overlapping peaks by high mass resolution (e.g., resolution >7700 is required to distinguish As+ (m/z 75) from ArCl+), but equipment costs are high, and sensitivity is low [36].
Sugiyama et al. found that rare earth element (REE) doubly charged ions (e.g., 150Nd++) undergo mass overlap with As+ (m/z 75) or Se+ (m/z 78/80) that the conventional He-KED cannot solve, so they proposed a novel low-kinetic-energy collision cell scheme for H2. H2 has the advantage of physical properties with a significantly higher polarizability (0.80 × 10⁻³⁰ m3) than that of He (0.21 × 10⁻³⁰ m3), leading to a substantial increase in the cross section of collisions between doubly charged ions and H2. H2 also has a low-kinetic-energy condition. Lowering the initial kinetic energy of ions entering the cell by increasing the octopole bias (octpBias = −6 V) further enhances the collision frequency of doubly charged ions (as low kinetic energy ions are more likely to induce H2 molecular dipole interactions). In addition, the doubly charged ions (Nd++) collide more frequently in the H2 cell and decay their kinetic energies faster, thus being filtered by the KED voltage barrier (+5 V). It has been experimentally verified that the H2 low-kinetic-energy cell also eliminates multi-atomic interferences (e.g., ArCl+, BaO+, etc.) as well as other doubly charged interferences (e.g., Sr++ on Ca+, Zr+, etc.). However, the method also has technical limitations, and 180Se+ is subject to 40Ar40 Ar⁺ interference that is difficult to eliminate completely, as shown in Figure 4 [36].
It can be concluded that the He collision cell is versatile and suitable for multi-atomic interferences (e.g., oxides, argonides, etc.) but cannot solve the double-charge interferences. The H2 reaction cell efficiently removes the specific interferences (e.g., Ar+) through chemical reactions but requires customized methods. Therefore, HR-ICP-MS can be used as an alternative but with high cost and low sensitivity, while CRC technology is more suitable for routine laboratories. H2 low-kinetic-energy collision cell innovatively combines physical collision and kinetic energy modulation, which for the first time realizes the efficient elimination of double-charge interferences by KED and provides a reliable solution for the trace analysis of As/Se in high-REE-containing matrices.

3.3. Recent Improvements in Sample Preparation Process

As a highly sensitive trace element analysis technique, the accuracy and stability of ICP-MS results are highly dependent on the scientific and standardized sample pre-treatment. Since ICP-MS is extremely sensitive to matrix effects, contaminant interference, and chemical forms of elements, optimizing the sample handling process has become the core link to enhance data reliability. Systematic optimization of sample processing not only reduces the detection limit but also significantly improves the reproducibility and accuracy of simultaneous multi-element analysis in complex matrices.

3.3.1. Environmental Friendly

Conventional pre-treatment often relies on high concentrations of strong acids and high-temperature digestion, which not only generates toxic exhaust gases (e.g., NOx, HF, etc.) but also risks the loss of volatile elements such as mercury. A green chemistry strategy reduces organic solvent consumption while maintaining ppb-level detection sensitivity.
Brito et al. extended natural deep-eutectic solvents (NADES) to the extraction of inorganic elements for the first time. By integrating NADES with ultrasonic/microwave-assisted extraction technology and combining with multivariate experimental design, they systematically optimized a green pretreatment method for the extraction of toxic elements, such as arsenic, cadmium, and lead, in food and plant samples. The core optimization strategy used natural ingredients such as citric acid, malic acid, and xylitol to prepare NADES instead of traditional hazardous solvents, and the viscosity was reduced by adjusting the water content (45%) to enhance the extraction efficiency. The advantages of this method are reflected in the environmental friendliness, as NADES is biodegradable, completely avoiding the use of nitric acid, and characterized by high sensitivity and resource conservation. This study provides a sustainable solution for food safety testing that combines high recoveries (96–109%) with a low environmental burden [21].
Reducing the use of strong acids in the digestion solution is an important way to reach green chemistry. For example, there are also many other ways to optimize sample handling to be environmentally friendly. In Cerveira et al.’s study, the green chemistry of rice and wheat samples was optimized by microwave-assisted ultraviolet degradation (MW-UV), which used diluted nitric acid (4 mol/L) to replace the high concentration of acid and combined it with ultraviolet radiation to enhance the oxidation efficiency, which significantly reduced the amount of hazardous reagents and the toxicity of the waste liquid. The residual carbon content and residual acidity after digestion were extremely low, indicating that the organic matrix was almost completely decomposed, avoiding the waste of resources caused by repeated experiments. The digestion solution can be used directly for ICP-MS analysis without additional processing steps, which simplifies the process and reduces the risk of secondary contamination [22]. Patel et al. optimized the sample treatment to achieve the green chemistry goal through a multi-dimensional strategy by replacing the traditional nitrate-hydrogen peroxide strong-acid digestion method with hydrolases (cellulase, pectinase, xylanase, and amylase) to release the metal elements from the food matrix under mild conditions (pH 7; 37 °C), avoiding the use of strong acid corrosive reagents and reducing acidic waste and metal volatilization losses. The enzyme immobilization technique was further employed to load the hydrolase onto chitosan-coated magnetic nanoparticles (Fe3O4) for reusable enzymes [23]. This optimized solution significantly reduces hazardous waste emissions from the laboratory and simultaneously improves the safety and environmental friendliness of the analytical process, perfectly matching the principles of atom economy and pollution prevention.

3.3.2. Optimization Strategies for Pretreatment Under the Complexity of Food Matrices

In ICP-MS analysis, complex matrices often contain high salt, organic matter, or colloidal particles, which may cause matrix effects (e.g., polyatomic ion interference, signal suppression, etc.) or physical clogging (nebulizer, cone deposition, etc.), resulting in decreased sensitivity and data bias. Optimized sample processing methods (e.g., gradient digestion, matrix dilution, and internal standard calibration) can effectively decompose interfering components, reduce background noise, and improve the recovery of target elements to ensure the accurate detection of trace toxic elements (e.g., Ag and TiO2 NPs in food products) as well as to meet the stringent requirements of instrumental stability and regulatory requirements for the quantification of nanomaterials.
Different sample optimization methods are currently developed for different types of complex food matrices. Peters et al. proposed three key steps of enzymatic digestion in high-fat (cooking oil) and high-fiber (spinach) sonication and sample dilution for the complexity of food matrices. By using a digestion buffer containing Tris buffer, Triton X-100, and calcium acetate combined with mild enzymatic digestion (35–55 °C) with proteinase K, the organic components were effectively decomposed, and nanoparticles were released, which was supplemented with ultrasonication in an ice bath to break up the cell walls or agglomerates, avoiding the dissolution or agglomeration of the particles caused by high temperature. Further dilution of the sample to the dynamic detection range of spICP-MS significantly reduces the concentration of salts, proteins, and fats in the matrix, thereby reducing polyatomic ion interference and signal suppression [24]. Ghaffour et al. proposed an efficient pretreatment optimization strategy for seafood, cereals, and vegetables with complex food matrices: microwave-assisted extraction (MAE) and heat-assisted extraction (HAE) techniques were employed to avoid the oxidation of arsenic forms (e.g., the conversion of As(III) to As(V)) due to strong acids by using ultrapure water as the solvent for a mild extraction at 80 °C for 20–30 min. Meanwhile, 1.5 mM N-ethylmaleimide (N-EM) was introduced to block the binding of thiol groups to As(III), which significantly enhanced its recovery to 93–97% [25]. Beltrami et al. first used Tris buffer (pH 7.5–9) in combination with α-amylase at 90 °C for complex food matrices such as wheat, flour, and pasta to break down proteins and carbohydrates in order to release the metal particles and remove fat interferences in high-fat samples (e.g., butter cookies) by n-hexane extraction. Subsequent graded filtration using polycarbonate (0.22 μm) and PVDF (0.10 μm) membranes separated micron to submicron metal particles, supplemented by ethanol pretreatment to prevent membrane contamination. Finally, microwave acid digestion (HNO3) combined with gradient power control was used to convert the particles into a soluble state for quantitative analysis by ICP-MS [26].
The above studies effectively overcame the interference of the complexity of different food matrices on ICP-MS analysis through enzymatic digestion, gradient filtration, and mild extraction and significantly improved the accuracy and sensitivity of metal and nanoparticle detection. These methods provide reliable technical support for food safety risk assessment and regulatory control and have great potential for use in monitoring nanomaterial contamination and dietary exposure assessment.

3.3.3. Interference Cancellation and Correction

Current and emerging interference removal strategies for ICP-MS spectroscopy include the following. First are the non-instrumental methods: isotope selection, sample pretreatment, and dilution. For example, through pretreatment methods such as liquid-phase microextraction (LPME), solid-phase microextraction (SPME), magnetic solid-phase extraction (MSPE), and microarray technology, selective adsorption, matrix removal, target enrichment, and miniaturized automated operation are utilized to effectively eliminate matrix interference in biological samples [27]. Actually, the simplest non-instrumental interference elimination method is dilution. However, dilution of the sample, while reducing matrix interference, can lead to a decrease in the sensitivity of the target and must be carried out with ultrapure water and acid; otherwise, impurity elements such as sodium, calcium, and aluminum may be introduced, which in turn reduces the detection limit for these elements [37].
Second are the alternative introduction techniques: electrothermal evaporation (ETV), chemical vapor generation (CVG), and membrane desolventization (MD) to reduce solvent interference. For example, selective evaporation of Hg by an ETV (Figure 4) system at 650 °C results in efficient volatilization of Hg from the bioabsorbable calcium phosphate matrix, while more than 95% of the matrix components are retained in the sample chamber, avoiding co-evaporation interference. At the same time, the optimized carrier gas flow rate and heating program reduces condensation and memory effects, which, combined with the external calibration, significantly reduces matrix interference by eliminating the need for complex matrix matching [28]. CVG (Figure 5) effectively eliminates spectral and non-spectral interferences by converting analytes to volatiles and separating them from liquid matrices, which is particularly suitable for high-sensitivity analysis of trace elements in complex matrices. For example, in mercury detection, CVG selectively reduces inorganic mercury to vapor to avoid organic mercury and transition metal interferences, while in arsenic morphology analysis, HPLC-CVG-ICP-MS takes advantage of the difference in vapor generation efficiency of different arsenic species to separate toxic arsenic forms and reduce matrix interferences [29]. Dry sample aerosols can be generated by MD. Sabramanian et al. efficiently removed impurities such as phospholipids and free fatty acids and recovered solvents (e.g., hexane) by selective separation techniques (e.g., SRUF and SRNF membranes) with MD, which significantly reduced the content of interferences in the oils (e.g., phospholipids <10 mg/kg) under nonthermal conditions while enhancing solvent recovery (~63%) and reducing chemical reagent use, thus improving the quality of the vegetable oils and decreasing energy consumption [30].
Third are the instrumental improvements: cold plasma, gas modification, and collision/reaction cell, which suppress Ar-based interference. For example, currently, mass spectral interferences are directly eliminated without complex mathematical corrections by combining a high-RF-power cold plasma and kinetic-energy-discriminated collision cell technique (KED-ICP-MS) (selective filtration of polyatomic interfering ions through the difference in ion kinetic energy after gas collision in the collision cell), which lowers the plasma temperature to minimize the formation of polyatomic ions (e.g., 40Ar 63Cu) and removes interference from doubly charged ions (e.g., 206Pb2+) by the difference in kinetic energy of the collision gas (He) [38]. In addition, the interference of polyatomic ions and non-reactive gases to ICP-MS is eliminated by converting gaseous metal compounds (e.g., metal carbonyls, gaseous mercury, etc.) to particulate matter by reacting with ozone through a gas modification technique and replacing ambient interfering gases (e.g., N2; O2) with argon by using a gas exchange device (GED) and elimination of polyatomic ion interferences in ICP-MS by replacing ambient interfering gases with inert gases [39]. The collision/reaction cell can be combined with kinetic energy difference screening (KED) to eliminate interference. In the collision cell, polyatomic interfering ions lose more kinetic energy due to frequent collisions with noble gases (e.g., helium) with larger collision cross-sections and ultimately fail to pass the downstream barriers, whereas atomic ions retain more kinetic energy and are able to pass. In the reaction cell, reactive gases (e.g., hydrogen) chemically react with the interfering ions to convert them, while the KED blocks the product ions generated in the cell, thus realizing interference cancellation [40].
Fourth, high-resolution ICP-MS separates interferences of similar quality. For example, it is possible to distinguish iron (57Fe) and sulfur (32S) isotopes from other interfering signals by the high-quality resolution of high-resolution ICP-MS and to effectively eliminate spectral and matrix interferences from complex biological matrices (e.g., human serum) by combining ultrafiltration techniques to separate nanoparticles from soluble components, thus enabling highly sensitive, interference-free quantitative elemental analysis [41].
Finally, emerging methods such as interference standard method (IFS) and tandem ICP-MS (ICP-MS/MS), the latter of which realizes ultra-trace detection (LOD up to ng/L level) through dual quadrupoles and reaction gases, have become the core solutions for efficient and accurate analysis. IFS quantifies and subtracts background interfering signals from ICP-MS by adding specific correction factors or standards to improve the accuracy of trace analysis [37].
The standardized flow chart for eliminating interference during ICP-MS analysis is summarized in Figure 6 below.

4. The Detection of Special Elements

4.1. As

Normal research always detects arsenic (As) for its six species—arsenite (As3+), arsenate (As5+), arsenobetaine (AsB, C5H11AsO2), arsenocholine (AsC, C5H13AsO), mono-methylarsonic acid (MMA, CH3AsO(OH)2), and di-methylarsinic acid (DMA, (CH3)2AsO(OH)).
The main source of total arsenic in the diet is seafood, where total arsenic concentrations can reach >10 mg/kg. In seafood, arsenic is predominantly present as arsenobetaine [42]. According to a study by Nawrocka et al. (2022) [43], arsenobetaine (AsB), an organic arsenic species, is abundantly present in the seafood species Ensis directus, Mytilus edulis, Crassostrea gigas, Thunnus sp., and Salmo salar. Additionally, trace amounts of As5+ and DMA were found in Ensis directus and Crassostrea gigas, respectively [43].
Another seafood species—algae—has been considered a suitable species for removing various heavy metals from water through bioremediation. In Wang et al.’s (2020) research [44], Microcystis aeruginosa was found to play a key role in the bioremediation of arsenic in aquatic ecosystems; this organism can accumulate and transform arsenic into less toxic inorganic or methylated species. However, Microcystis aeruginosa is also one of the most common algal bloom species in freshwater ecosystems, often exhibiting higher arsenic concentrations under eutrophic conditions [44].
Good correlations between produce total arsenic (as normally eaten) and soil arsenic were identified for a number of types of produce [45]. The main arsenic species in rice are inorganic arsenic and DMA, with trace amounts of MMA also occasionally detected. The proportions of DMA and inorganic arsenic vary with rice cultivar and environmental conditions [46].
The World Health Organization (WHO) recommends a limit of 10 micrograms per liter (µg/L) of arsenic in drinking water. However, due to practical difficulties in removing arsenic from drinking water, this guideline value has been set as an interim value. Therefore, WHO emphasizes that every effort should be made to keep arsenic concentrations as low as possible and below this guideline value, resources permitting [47]. The U.S. Food and Drug Administration (FDA) limits contaminants such as arsenic by setting maximum allowable levels in its bottled water quality standards. For arsenic, the FDA has set a limit of 10 ppb in bottled water, which is equivalent to 10 µg/L and is identical to the limit set by the U.S. Environmental Protection Agency (EPA) for public drinking water [48]. It is important to note that arsenic limits apply to other products as well. For example, the European Union’s contaminant regulations set a maximum limit of 0.50 milligrams per kilogram (mg/kg) for total arsenic in table salt [49].
Table 3 below shows the speciation, concentration ranges, analytical performance, and occurrence of As in food categories. Based on the data in Table 3, the following core conclusions can be condensed. As in seafood is dominated by low-toxicity AsB (>90%, concentration 1–85 mg/kg), while highly toxic iAs (concentration 0.02–0.35 mg/kg) accounts for 60–80% of the total As in cereal grains, and rice, in particular, needs to be prioritized for control. Total As was significantly elevated in algae under eutrophic conditions (5–120 mg/kg) with morphological transformation, highlighting the need for environmental intervention. Accurate detection of trace As forms (e.g., MMA, LOD = 0.002 mg/kg) relies on highly sensitive coupling techniques (HPLC-ICP-MS), and there is an urgent need to develop in situ analytical methods adapted to complex matrices in order to support regulatory decision making.

4.2. Pb

Lead in food exists in diverse forms: inorganic (e.g., ionic Pb2+ from soil and insoluble salts like PbS/PbO from pollution), organic (rare complexes with amino acids/organic acids and minimal tetraethyllead), and particulate/colloidal (adsorbed on surfaces or stored in tissues as insoluble particles or protein-bound forms). Plant-based foods often have inorganic/lead-organic acid complexes, while animal foods show lead bound to biological molecules [50]. ICP-MS detects total lead by converting all forms to soluble Pb2+ via digestion; speciation analysis (e.g., HPLC-ICP-MS) differentiates forms for bio-availability assessment and safety controls.
Using LA-ICP-MS/ICP-MS, Zhang et al. found Pb primarily accumulates in wheat bran, with industrial areas showing 3.5× and 2.04× higher bran Pb than traffic/unpolluted regions. Additionally, 33% of samples exceeded China’s Pb safety limit. Isotope analysis indicated >50% of grain Pb originated from atmospheric deposition (78% in flour; 56% in bran). Airborne PbSO4 particles and soil-bound Pb were key contamination forms. Foliar tests demonstrated efficient leaf-to-grain Pb transfer [51]. Atmospheric pollution is the major Pb contamination source.
WHO’s Guidelines for the Clinical Management of Lead Exposure, published in 2021, emphasize blood lead concentrations as a key indicator of health risk. The guidance recommends that for individuals with blood lead concentrations at or above 5 µg/dL, the source of lead exposure must be identified and action taken to terminate the exposure [52]. In terms of drinking water safety, the FDA strictly regulates lead levels (and other contaminants) through its bottled water quality standards, which set the allowable level of lead in bottled water at a very low 5 ppb. Notably, this standard is stricter than the 15 ppb limit set by the EPA for public drinking water. This difference stems from special considerations for tap water systems, where the EPA’s standard needs to take into account the potential for lead leaching from lead pipes [53]. Meanwhile, in the area of occupational health and safety, the EU is planning to significantly tighten existing lead exposure regulations. The revision will significantly reduce two key limits: the biological limit (blood lead limit) from 700 to 150 µg/L and the occupational exposure limit (airborne lead) from 0.15 mg/m3 to 0.03 mg/m3 [54]. Together, these changes reflect an increased awareness of the health risks of lead exposure globally and efforts to strengthen protection at different levels (clinical, consumer products, and work environment).
Table 4 above shows speciation, sources, contamination characteristics, and analytical performance of Pb in foods. Based on the data in Table 4, the following core conclusions can be condensed. Wheat bran in industrial areas contains up to 3.5 times the amount of Pb in the transport area (1.8–12.5 mg/kg), 56% of which originates from atmospherically deposited PbSO4 particles, while 78% of the soluble Pb2+ in the flour is absorbed through foliar absorption-efficient transfer (bio-availability 45–60%), highlighting that the atmospheric pathway is more prioritized for control than soil adsorption (root contribution <15%). Protein-bound Pb in animal products accounts for 70–85% and bio-availability >60%, confirming the risk of food chain enrichment. Trace organic Pb (e.g., tetraethyl lead), although contributing <0.3% to contamination, was only 75–88% recovered (GC-MS LOD = 0.0001 mg/kg), and anti-matrix interference methods need to be developed to meet the challenge of novel contaminants.

4.3. Cd

Cadmium in food occurs in multiple forms: inorganic (soluble Cd2+ absorbed by plants and insoluble salts like CdS/CdO from pollution), organic (complexes with plant organic acids or animal metallothionein in kidneys/livers), and particulate (surface-adsorbed or from contaminated equipment). Plant-based foods have inorganic/organic acid-bound cadmium; animal foods (e.g., offal, seafood, etc.) show protein-bound forms [55]. ICP-MS measures total cadmium via digestion to soluble Cd2+; speciation (e.g., HPLC-ICP-MS) differentiates toxic-free ions from bound forms for bio-availability assessment in safety regulations.
In the study by Liu et al., ICP-MS was used to analyze the concentration of Cd in 25 surface sediment samples collected from the central Bohai Sea. Results showed cadmium in central Bohai Sea surface sediments had high concentrations, likely linked to human activities. It existed predominantly in non-residual forms (exchangeable + carbonate-bound) and was sensitive to pH/redox potential, readily releasing into water, highly bio-available, and easily absorbed by benthic organisms for food chain transfer [56]. Additionally, according to the finding of Alvarez et al., the binding of Cd to MTs represents an important cadmium storage and detoxification form in living organisms, characterized by low molecular weight and high metal-binding capacity. In rabbit liver, Cd primarily exists in the form of metallothionein-bound forms (Cd-MTs), specifically as two cadmium-metallothionein isoforms (Cd-MT1 and Cd-MT2). These isoforms are separated by capillary electrophoresis (CE) and then converted online into volatile cadmium species (such as CdH2) through volatile species generation (VSG) technology for detection by ICP-MS [57]. Therefore, once Cd in the sea enters the human body, non-residual cadmium readily binds to proteins such as metallothioneins (MTs). However, excessive intake can exceed the detoxification capacity of MTs, leading to various detrimental effects in the body.
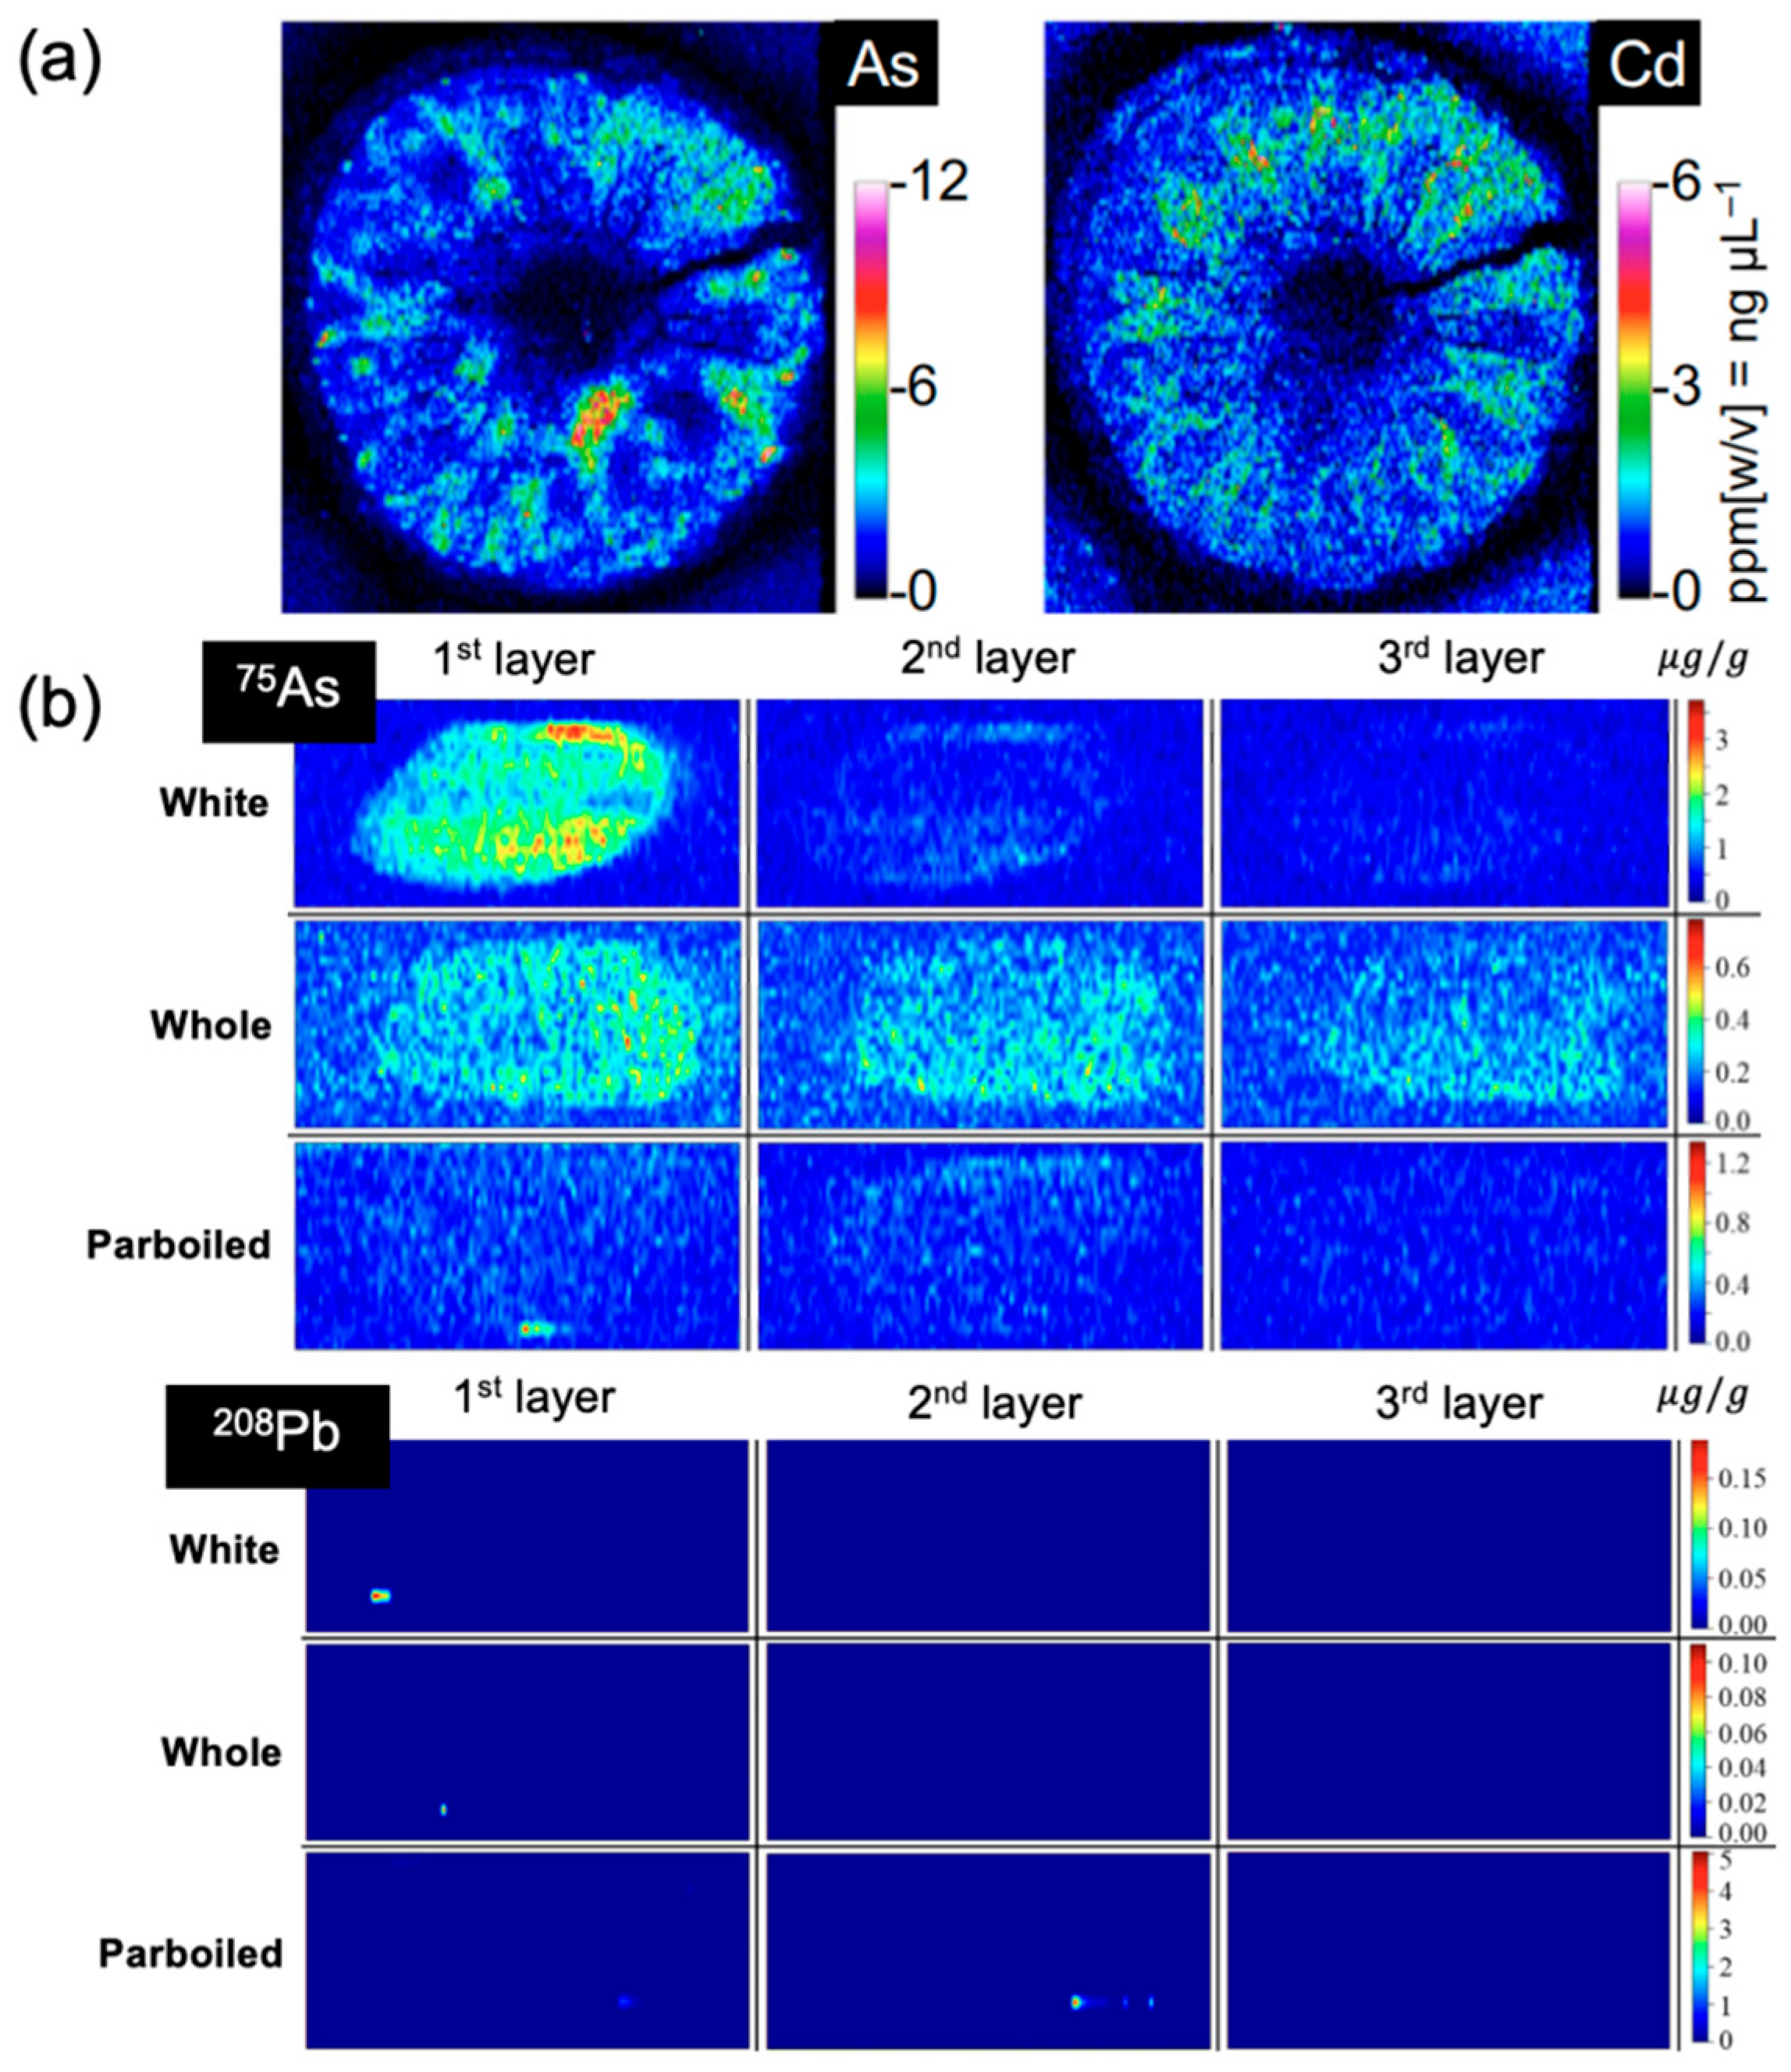
In Wei et al.’s study, japonica rice—Akitakaomachi (Oryza sativa L.)—grown in Cd-contaminated soil showed non-uniform Cd distribution in grains, with high accumulation in the embryo, outer pericarp, and aleurone layer. Incomplete removal of these structures during processing may lead to dietary Cd intake. Long-term excess Cd intake poses health risks. Cd mainly binds to globulin and albumin (binding ability: globulin > albumin > glutelin > prolamin) via sulfur-containing amino acids (cysteine and methionine), forming large-molecular-weight complexes that release toxic-free Cd ions during digestion, enhancing bio-availability and toxicity [58]. According to Suzuki et al.’s 1997 study, cadmium in Cd-contaminated rice primarily exists in a glutelin-bound form, with both endogenous (naturally contaminated) and exogenous (artificially added) cadmium preferentially binding to rice glutelin [59]. Combining this with Wei et al.’s findings, the distribution of cadmium in rice exhibits dual characteristics of “outer structure (embryo, aleurone layer) enrichment + glutelin binding”; while outer structures like the aleurone layer and embryo accumulate higher concentrations of cadmium, these can be removed through processing; in contrast, glutelin-bound cadmium in the endosperm is difficult to eliminate via milling, making it the primary residual form of cadmium in polished rice. This characteristic requires special attention in food safety assessment and processing control to mitigate dietary exposure risks.
The Joint FAO/WHO Expert Committee on Food Additives (JECFA) established a Provisional Tolerable Monthly Intake (PTMI) for cadmium of 25 µg/kg bw/month in 2010. In view of the long half-life of Cd in the human body, the Committee specifically chose to use a “monthly” value to express this safe intake threshold. WHO has also developed guidance for Cd in environmental media, with a guideline value for Cd in drinking water of 3 µg/L and a guideline value for Cd in air (averaged over a year) of 5 ng/m3 [60]. The FDA controls cadmium levels (and other contaminants) through its bottled water quality standards. For cadmium, the FDA has set an allowable level of 5 ppb for bottled water, which is equivalent to 5 µg/L and is identical to the EPA limit for cadmium in public drinking water [61]. On the other hand, the European Food Safety Authority (EFSA) has assessed and established a tolerable weekly intake (TWI) for cadmium of 2.5 µg/kg bw/week [62].
Table 5 below shows speciation, distribution, risk characterization, and analytical performance of Cd in foods. Based on the data in Table 5, the following core conclusions can be condensed: 80–90% of the marine sediment is non-residual Cd (12–85 mg/kg, exceeding the background value by 8–15 times in the industrial area), and its high mobility constitutes a source of pollution. The rice endosperm is dominated by gluten-bound cadmium (0.15–2.1 mg/kg, 40–60% removal rate in refined rice processing), while globulin-bound Cd is the most highly enriched in the seeds (3.2 μg/g), and the protein fractions need to be targeted and regulated to reduce the risk. The bio-availability of free Cd2+ in plants was 50–75% (TF = 0.32 in leafy vegetables), much higher than that of Cd in the particulate form (10–25%), and the low recoveries of the latter (78–92%) emphasized the importance of highly sensitive coupling techniques (e.g., SEC-ICP-ISC, LOD = 0.002 mg/kg), which are crucial for accurate exposure assessment.

4.4. Hg

Mercury in food exists mainly as inorganic mercury (soluble Hg2+ from pollution and insoluble salts like HgS in plants/sediments), organic mercury (predominantly methylmercury, CH3Hg+, formed via microbial methylation in water and bio-accumulation), and trace elemental Hg0 (rare; from industrial residues) [63]. ICP-MS detects total mercury by converting all forms to soluble Hg2+ via digestion; speciation analysis (e.g., LC-ICP-MS) differentiates highly toxic methylmercury (key safety concern due to neurotoxicity and efficient absorption) from less harmful inorganic forms to inform regulatory controls.
In mercury speciation analysis, Zhu et al. used MSPE-HPLC-ICP-MS with γ-mercaptopropyltrimethoxysilane-modified magnetic nanoparticles to detect Hg2+, MeHg+, and PhHg+ in water and fish samples, achieving rapid 8 min separation with 50% methanol in the mobile phase and strong anti-interference for complex matrices [64]. Ajin et al. developed a microwave-assisted alkaline extraction (25% KOH methanol)-LC-ICP-MS method for methylmercury in rice, fish, and soil, achieving >75% extraction efficiency [65] with high sensitivity, precise speciation separation, multi-matrix adaptability, and fast analysis, filling the gap in multi-matrix mercury speciation analysis.
Tian et al. used single-cell ICP-MS to reveal heterogeneous Hg bioconcentration in algae: larger cells accumulated more Hg due to higher surface-area-to-volume ratios, though unit volume efficiency (VCF) inversely correlated with cell size. Time-resolved signals showed rapid equilibrium within hours, followed by decreases from metabolism/division, highlighting bidirectional processes. Dual-isotope tracing found MeHg accumulated more efficiently than inorganic Hg [66], providing single-cell insights into aquatic mercury cycling and risk assessment.
The landmark Minamata Convention was adopted by the WHO in 2013 in response to the continued release of mercury from human activities, which resulted in its accumulation in the environment, its entry into the food chain, and its proven harmful effects on health. The Convention requires governments to take comprehensive measures, including controlling atmospheric emissions of mercury and phasing out certain mercury-containing products. Consequently, 2023 saw the adoption of an important amendment to the Convention, which bans the manufacture, import, or export of a range of mercury-added products, including batteries, switches and relays, fluorescent lamps, non-electronic measuring devices, and cosmetics, beginning in 2025. In terms of keeping drinking water safe, the FDA limits mercury levels (and other contaminants) through its bottled water quality standards [67]. For mercury, the FDA has set an allowable level for bottled water of 2 ppb, which is equivalent to 2 µg/L and is identical to the EPA’s limit for mercury in public drinking water [68]. At the same time, the EU is actively implementing its obligations under the Convention and seeking stricter controls. In July 2023, the European Commission adopted a Delegated Regulation formally incorporating the requirements of the Minamata Convention and its amendments into the EU legal system. The regulation not only implements the Convention but also further bans the manufacture, import, and export of eight additional mercury-containing products (e.g., mercury-containing lamps and non-electrical equipment), demonstrating the EU’s commitment to leading the way in reducing mercury pollution [69].
Table 6 below shows speciation, distribution, detection performance, and risk characterization of Hg in foods. Based on the data in–, the following core conclusions can be condensed. With >80% of CH3Hg+ in fish (concentration 0.1–1.8 mg/kg) and bio-accumulation factors as high as 105–106, its >95% absorption efficiency constitutes a major dietary risk. Although the percentage of Hg2+ in rice was <20% (0.02–0.35 mg/kg), the soil-grain transfer factor (TF = 0.15) suggests that contaminated farmland needs to be controlled. The toxicity of PhHg⁺ in industrial areas was reduced by 78% thermal degradation, but Hg0 was detected in processed foods with a recovery of only 65–82% (LOD = 0.0003 mg/kg), and there is an urgent need for the development of anti-volatilization technologies. Algal Hg enrichment showed a size effect—a high total number of large cells (SA:V = 0.8–1.2 mm−1) and strong enrichment of small cell units (VCF = 1.2 × 10⁴ L/kg), requiring targeted design of bioremediation strategies.

4.5. Cr

When it comes to heavy metals, many people immediately associate them with health hazards, but chromium (Cr) in food is an exception to the rule in that its toxicity is not absolute but is determined by its valence. Cr (III) is an essential trace element, while Cr (VI) is highly toxic. The intake of Cr in a normal diet is usually within safe limits, so there is no need to be overly concerned about “chromium in food”.
Pluháček et al. used ICP-MS to determine total Cr in yeast. It was concluded that the total chromium in commercially available yeast and supplements (S1–S9) was below the limit values (≤10 mg/kg for baker’s yeast and ≤230 mg/kg for supplements). The accuracy of the study was verified with mean recoveries of 98.2–103.7%, and the CRM determination (305.5 ± 5.0 mg/kg) complied with the certified values. The relative extended uncertainty (U′) of the single analysis was 8.4–10.0% (52Cr signal), meeting the target value of ≤20%. The applicable range was 0.125–305.5 mg/kg, and the lowest limit of quantification (LOQ) was 0.26 mg/kg (50Cr signal) [70]. The study by Lee et al. concluded that the total chromium content of commercially available milk (whole/skimmed/organic) in Korea is extremely low (0.044–0.121 μg/g), which is well below the international limits as well as the safety risk thresholds [71].
A few points need to be noted during the study of Cr measurement by ICP-MS. The first is matrix interference. The organic matter in the sample needs to be completely eliminated; otherwise, the residual carbon may inhibit the ICP-MS signal or form multi-atomic interferences (e.g., 40Ar12C interferes with 50Cr). The second is trace analysis. High sensitivity is required for low concentrations of Cr, and the uncertainty of the isotope 50Cr is significantly higher at <0.009 mg/L [70], as in the study by Pluháček et al. The third is uncertainty in accumulation. Multi-step operations (weighing, digestion, dilution, and calibration) introduce a large uncertainty component, with sample digestion contributing 69–98%. The last is data correlation. Analyzing multiple samples from the same batch using the same calibration curve leads to data correlation and invalidates traditional uncertainty assessment methods.
The current WHO guideline value of 0.05 mg/L has been questioned due to the carcinogenicity and genotoxicity of hexavalent chromium via the inhalation route, but the available toxicological data do not support the derivation of a new value. As a practical measure, 0.05 mg/L is considered to be unlikely to pose a significant health risk and is therefore retained as a provisional guidance value until more information is available and chromium can be reassessed [72]. Under a normal diet, chromium intake through natural food is in the safe range and is not a cause for concern. However, it is necessary to be vigilant against hexavalent chromium contamination from industrial pollution and processing, to choose food products from regular sources, and to avoid prolonged exposure to environments or objects that may contain excessive levels of chromium.

5. Detection of Toxic Elements in Different Food

5.1. Seafood

As an important source of high-quality protein for human beings, seafood occupies a key position in the global food supply and economic development. However, with the increase in offshore pollution, heavy metals such as mercury, cadmium, lead, and arsenic have accumulated in seafood through bioconcentration, seriously threatening food safety and human health. In order to accurately assess their risks, the use of ICP-MS technology to detect trace heavy metal content has become a core tool to ensure the quality and safety of seafood.
In the study of KUPLULU et al., heavy metal contamination levels of Cd, As, Pb, and Hg were determined by ICP-MS in 13 species of fish, mussels, and shrimp from the four major waters of the Black Sea, Marmara Sea, Aegean Sea, and Mediterranean Sea in Turkey. The results showed that the pollution trends were highly consistent among the four seas, with the order of heavy metal concentrations being As > Pb > Hg > Cd. It is worth noting that the enrichment capacity for specific metals varies significantly among fish species. For example, among them, filter-feeding shellfish (e.g., mussels) and shrimp accumulated significantly more heavy metals than fish due to the close proximity of the habitat to the pollution sources and their special feeding mode, which highlights the unique value of these fish and shrimp as “sentinel species” in the regional ecological health assessment [73].
Further studies of sturgeon by Katarina et al. showed that the spine, kidneys, and liver were the main enrichment areas for metal accumulation. The spine showed specific adsorption of Pb, the kidneys showed targeted accumulation of Cd, and the liver was a storage hub for Cu, Fe, and Se due to its strong metabolic function. In contrast, muscle had the highest Hg concentration among tissues, but its combined metal contamination index (MPI) was low, along with the gallbladder, brain, and swim bladder [74]. The study revealed that tissues such as the spine and gill cover, which have been neglected in traditional monitoring, have bio-indicator potentials. The spine can sensitively reflect the Pb contamination in the water body, and the cadmium content in the kidney can map the contamination level in the sediment, suggesting that the future environmental assessment can accurately analyze the gradient of contamination exposure and ecological risk.
The ICP-MS technique is sensitive for detecting contamination at low concentrations, but the cumulative effect of long-term low-dose exposure may be underestimated, and the actual health risk needs to be assessed in the future in the context of the bio-availability of heavy metals.

5.2. Cereals

Cereals, as the basic crops of human dietary structure, carry more than 60% of the world’s energy supply and nutritional source. However, in the process of industrialization and agricultural intensification, grains are prone to be enriched with heavy metal pollutants such as lead, cadmium, and arsenic through soil and water sources, and these bio-accumulative toxic elements may cause neurological damage, organ pathologies, and even carcinogenic risks. In order to accurately assess the safety of grains, ICP-MS has become a key technology to solve the problem of detecting trace heavy metals by virtue of its ppb-level detection limit, simultaneous detection of multiple elements, and efficient analytical characteristics.
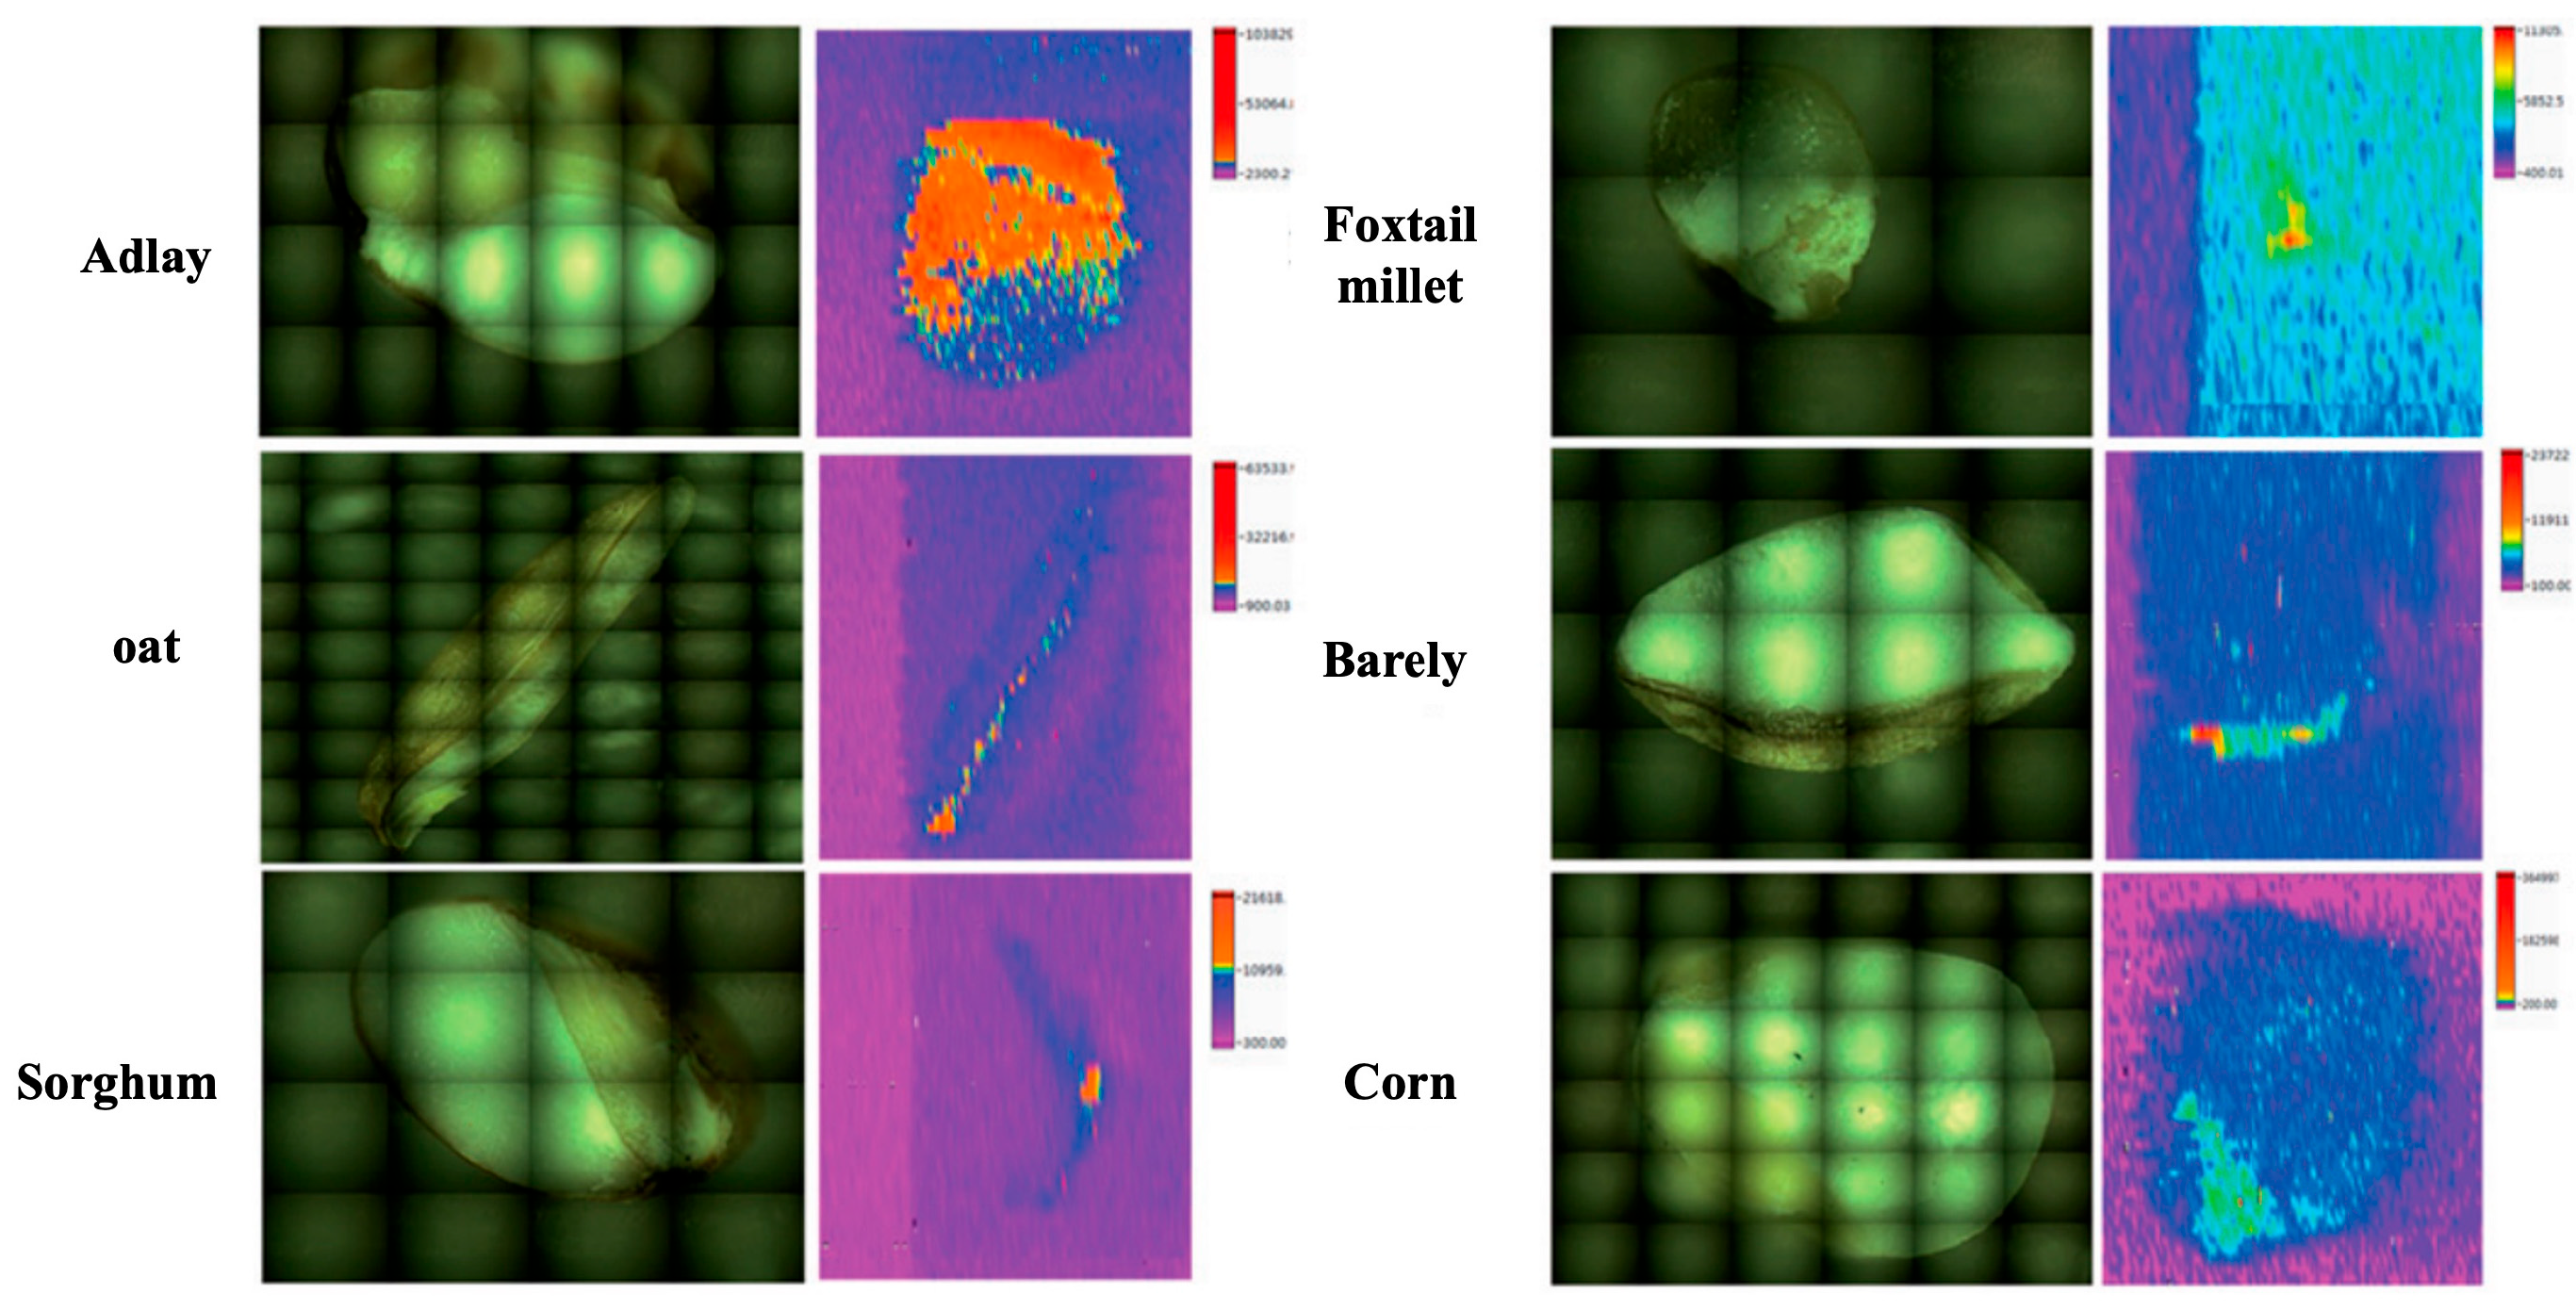
Choi et al. analyzed the content and distribution of Pb, Cd, As, and Hg in six cereal grains (barley, oats, millet, maize, sorghum, and Job’s tears) and found that barley had the highest levels of Pb and Cd, Job’s tears had the highest levels of As and Hg, and maize had the lowest levels of all four heavy metals [75]. Nowadays, there are many studies measuring the heavy metal content of each of these six common grains using ICP-MS. For example, Thabit et al. found that Pb, As, and Hg were not detected in imported 2018 barley samples from Europe by ICP-MS; trace Cd was detected only in two samples from Estonia, which was well below the EU MRL (0.2 ppm); and other elements such as aluminum and nickel were detected but at very low concentrations and without regulatory standards [76]. Regional trace amounts of cadmium may reflect localized sources of soil or agricultural contamination and require targeted monitoring. As, Cd, and Pb were not detected in oat milk in Sel et al.’s research, and the content of essential elements was low, which may need to be enhanced by nutritional fortification to increase its mineral value [77]. Jain et al. used ICP-MS to measure the content of heavy metal elements in nine different millet varieties, and only sorghum millet risk was low; the others generally contained Al and other non-essential metals and Pb, Hg, and other heavy metals, of which buckwheat millet and finger millet lead content far exceeded the safety limit, finger millet Hg content was the highest, and some of the samples exceeded the standard, while Cd and As in all samples were below the limit of quantification and not detected [78]. In Fioroto et al.’s research, the transport of As, Cd, and Pb and the morphology of As in multi-nutrient fertilizers were investigated by using a hydroponic maize shoot model combined with HPLC-ICP-MS. The results showed that As in the fertilizer was mainly in the form of arsenate (AsV), and As, Cd, and Pb could be transported to the roots, cotyledons, and leaves of maize shoots; the concentrations of As and Cd were similar to each other; the concentration of Pb was a little higher in the leaves; and the elemental uptake by maize shoots was higher in the suspension than in the extraction solution of fertilizer, which might be related to the fact that root exudates promoted the elemental solubilization [79].
In summary, ICP-MS, as the core technology for heavy metal detection in cereals, provides reliable support for accurate identification of pollution characteristics with its high sensitivity and multi-element analysis capability. The combination of morphological analysis can deeply analyze the mechanism of heavy metal migration and transformation, while the regional data differences highlight the importance of contamination traceability and localization of standards. In the future, it is necessary to further optimize the detection methods to overcome matrix interference and promote the construction of a database of heavy metal forms so as to provide a scientific basis for the development of differentiated control strategies and balancing the objectives of food safety and nutritional fortification.

5.3. Dairy

Dairy products are an important source of dietary nutrients for human beings and are particularly central to calcium and protein supplementation and infant and child development. However, with the increase in environmental pollution, heavy metals may migrate into dairy products through the feed chain, and even trace amounts may be harmful to the human body by accumulation. The use of ICP-MS technology to accurately determine trace levels of heavy metals has become a key tool for dairy safety and quality control.
Silalahi et al. examined Cd, Hg, and Pb in 94 fresh milk samples from traditional dairy farms in South Jakarta by ICP-MS. Cadmium was the most detected, and Pb was only detected in trace amounts in a few samples. The health risk assessment showed that the intake of Cd and Hg was well below the Joint FAO/WHO Expert Committee on Food Additives (JECFA) safety thresholds, and there was no health risk. Comparison revealed that the lead content of milk in Jakarta was significantly lower than that in Central Java, Indonesia, and the higher level of contamination in the city center area was presumed to be related to urban industrial pollution and contamination of feed and groundwater [80].
But the intake of vulnerable and susceptible people still needs to be looked at, especially formula. In Pacquette et al.’s research, Pb, Cd, Hg, and As were detected in infant formulae by ICP-MS. The results showed that lead was detected in trace amounts in only one brand, cadmium was detected in 1.54–8.34 µg/kg, mercury was not detected, and arsenic was detected in 2.29–7.91 µg/kg, which were all lower than the limits of the relevant regulations, so the levels of heavy metals in the marketed infant formulas were generally safe and controllable [81]. However, in Başaran et al.’s study, the levels of Pb, Cd, As, and Hg in 36 commercially available infant formulas in Turkey were examined by ICP-MS, and the exposure risk of 268 infants aged 0–24 months was assessed by the 24 h dietary recall method; the results showed that the average levels of Pb, Cd, As, and Hg were in compliance with the European Union limits for the majority of the samples, but the Pb levels in three brands exceeded the limits. Infants aged 0–6 months are at risk of combined exposure to multiple heavy metals due to their low body weight and high milk intake. About 70% of arsenic exposure was inorganic arsenic, which is more toxic, while lead and cadmium may originate from pasture soil or feed contamination, and mercury was detected in only 22.2% of the samples [82]. Given that milk powder is the main source of nutrition for infants and young children, infants and young children are more susceptible to heavy metal damage due to their metabolic characteristics. It is necessary to strengthen the environmental monitoring of milk sources, material control of production equipment, and packaging safety, and it is recommended that more stringent heavy metal limits be set for formula milk for infants aged 0–6 months in order to reduce the risk of exposure.

5.4. Potable Water

Drinking water is the foundation of human survival and health. Its quality and safety are directly related to public well-being and should not be compromised in any way. However, heavy metal contamination is one of the main threats to drinking water safety due to its trace toxicity and easy accumulation in the body. Therefore, accurate determination of trace/super-trace heavy metals in drinking water is essential. ICP-MS, with its high sensitivity, ultra-low detection limit, and powerful multi-element simultaneous analysis capability, has become an indispensable and key detection method to ensure the safety of heavy metals in drinking water.
Natural (geological causes) and anthropogenic (industry, agriculture, mining, etc.) activities have led to widespread contamination of water resources globally, with heavy metals (As, Cr6+, U, Pb, Hg, etc.), antibiotics, nanoparticles, and microplastics being the main pollutants. More than 2.2 billion people currently lack access to safe drinking water; for example, high-arsenic groundwater affects 108 countries, with Asia being the worst affected, and highly fluoridated water is a scourge in Ethiopia, India, and parts of China [83].
Alhagri et al. collected 27 bottled drinking water samples from the Yemeni market in 2023 and analyzed them for Cr, Cd, Hg, and Pb using ICP-MS, along with total dissolved solids (TDS), electrical conductivity (EC), and pH, and compared the results with the maximum allowable concentration (MAC) set by WHO and Yemen Ministry of Water and Environment (YMWE). The results showed that the LOD of the method ranged from 0.0003 to 1.86 μg/L, and the recoveries ranged from 80 to 120%. Trace element Pb was detected in all samples, but its concentration was below the detection limit. The concentrations of most of the detected elements, such as Cr and Cd, were in accordance with the WHO and YMWE standards, which were lower than the corresponding maximum allowable concentrations, and the physical and chemical indexes were in accordance with the relevant standards. The exception was Hg, which in most of the samples exceeded the acceptable limits set by the WHO and YMWE, and in some samples, the concentration was far above the standard, e.g., 15.492 µg/L in the Sana’a sample [84].
Ozge et al. [85] successfully determined the contents of 10 heavy metal ions (Al, Cr, Mn, Fe, Ni, Se, Cd, Sb, Ba, and Pb) in drinking water from different sources, including rural, well, and urban water, by means of ICP-MS and obtained their mean, median, and limit of detection (LOD) to compare the differences in different regions, as shown in Table 7. Among the detected elements, only the Pb level in the well water (18.73 μg L−1) exceeded the standard (15.00 μg L−1) set by the U.S. Environmental Protection Agency (EPA), while the levels of the other elements in the three sources were below the maximum permissible concentrations set by British Standard (BS) 6920 [85]. Possible reasons for the exceedance of Pb in well water include geological factors (e.g., lead minerals in underground rock formations) and corrosion of old pipes (leaching of metal pipes). Most of the heavy metals in the rural water were below the lower detection limit, which may be related to fewer human activities, while the urban water had slightly higher Mn, Fe, Ni, etc., which may be related to industrial discharges and pollution of pipeline networks. The neurotoxicity and nephrotoxicity of lead have been clearly defined, and well water, as the main source of water in some rural areas, should be prioritized for lead contamination, subregional standards for heavy metals in drinking water should be established, and control measures should be formulated in combination with the characteristics of water sources.

5.5. Vegetables

Vegetables are an indispensable cornerstone of the daily diet and have a direct bearing on public nutrition and health safety. However, factors such as soil and water pollution may lead to enrichment of vegetables with trace heavy metals. These heavy metals are highly toxic and easy to accumulate, threatening human health through the food chain. Therefore, accurate monitoring of trace/ultra-trace heavy metal contamination in vegetables is essential. ICP-MS, with its high sensitivity, ultra-low detection limit, and efficient multi-element simultaneous analysis capability, has become a key detection technology to meet this challenge and ensure the safety of vegetable consumption.
İslamoğlu et al. [86] focused on the levels of As, Cd, Pb, and Hg in spinach, carrots, and potatoes, commonly consumed in Turkey. The results of the study showed that the lead levels in all the vegetables tested exceeded the safety limits set by the Joint Expert Committee on Food Additives (JECFA) and the Turkish Codex Alimentarius (TFC) and posed a potential health risk, whereas the arsenic and mercury levels were generally low, and the cadmium levels were basically within the safe range except for special cases. Specifically, the levels of heavy metals (in µg/g, fresh weight) in the three vegetables were as follows: in spinach, the level of arsenic was 0.01234 µg/g, cadmium was 0.088 µg/g, lead was 0.430 µg/g, and mercury was less than 0.00031 µg/g. The level of arsenic in carrots was less than 0.00073 µg/g, cadmium was 0.055 µg/g, lead was 0.432 µg/g, mercury was less than 0.00031 µg/g, and Hg below 0.00032 µg/g. Potatoes contained arsenic below 0.0007 µg/g, cadmium 0.069 µg/g, lead 0.408 µg/g, and Hg below 0.00031 µg/g [86].
The most prominent risk point for these vegetables was the exceedance of the lead standard, which may be related to the soil characteristics of the growing area (e.g., high soil Pb background values) as well as the atmospheric pollution (Pb entering the soil through air deposition), while spinach, as a leafy vegetable, may be more susceptible to lead absorption, as its leaves are in direct contact with the air and soil. In terms of cadmium content, spinach contained more cadmium than carrots and potatoes, but the cadmium content per serving of all three was below the JECFA limit. However, cadmium is cumulative and can damage the kidneys if ingested over a long period of time. Therefore, for spinach, a vegetable with relatively high cadmium content, we need to be vigilant against the slow accumulation of cadmium in the body if it is consumed in large quantities over a long period of time. The source of cadmium in soil may be related to industrial wastewater irrigation or the use of cadmium-containing fertilizers. The arsenic and mercury levels in all three vegetables were extremely low, below the detection limit and well below the safety limit. This may be due to fewer sources of arsenic and mercury contamination in the study area, such as specific industrial activities (e.g., mining, smelting, etc.) or relatively low use of arsenic-containing pesticides, but continuous monitoring is still needed to avoid spreading of contamination due to industrial expansion or improper use of agricultural inputs.
Subsequently, environmental control in vegetable cultivation needs to be strengthened, such as conducting soil and air monitoring, standardizing the use of agricultural inputs, and conducting regular heavy metal tests on vegetables available in the market to reduce risks at source. For consumers, intake can be reduced by washing under running water and removing non-edible parts (e.g., peeling potatoes), but the fundamental solution still relies on improvement of the growing environment.

5.6. Honey

Honey is a valuable natural food and health product favored by consumers, and its purity and safety are of paramount importance. However, as an environmental “indicator”, bees may bring trace heavy metal contaminants from the environment into honey during the collection process. These heavy metals are highly toxic and easy to accumulate, posing a direct threat to human health. Therefore, accurate detection of trace/super-trace heavy metals in honey is a key component to ensure its safety for consumption. ICP-MS, with its high sensitivity, ultra-low detection limit, and powerful multi-element simultaneous analysis capability, has become the core tool to cope with the complex matrix of honey and realize accurate heavy metal detection.
Concentrations of selected metals in honey samples from eight different districts (Merkez, Genç, Solhan, Yayladere, Karlıova, Yedisu, Adaklı, and Kığı) of Bingöl Province, Turkey, were determined by ICP-MS by İzol et al. The metals detected included Cd, Hg, As, K, and others. The results showed that Hg was not detected in all honey samples, while other elements were detected. The highest concentration of K was found in these honey samples at 442.56 ± 1.8 mg/kg, while the lowest concentration of As was found at 6.0 ± 1 µg/kg [87]. The concentrations of As determined in this study did not exceed the maximum limits set by the European Union, and the concentrations of the other metals were also at acceptable levels. The levels of the elements in honey varied from region to region.
Scivicco et al. [88] analyzed 11 heavy metals and essential elements in multifloral honey collected from different cities of the Campania Region, Italy. It was found that none of the samples contained lead above the threshold value of 100 μg/kg set by the European Union Regulation (EU) 2015/1005. Concentrations of these elements ranged from 0.70 μg/kg (mercury) to 1713 μg/kg (manganese). Risk assessments based on honey intake (median and 95th percentile) in infants, adolescents, and adults indicated that non-carcinogenic risk was not a concern, as the target hazard quotient (THQ) and hazard index (HI) for each element did not exceed the threshold of 1. The risk assessment of the three groups was based on the median and 95th percentile intake of honey. However, the carcinogenic risks due to the intake of Ni, Cr, and As were of concern for three groups (Ni 167 ± 80.4 μg/kg, Cr 72.3 ± 19.2 μg/kg, and As 14.9 ± 8.36 μg/kg), with relatively higher risk values for infants and young children. The above findings suggest that environmental pollution has a relatively small effect on the presence of heavy metals in honey, which may be attributed to the bees’ own detoxification ability. However, in view of the potential risks that may be associated with honey consumption, it is necessary to consider setting regulatory thresholds for Ni, Cr, and As [88].
The levels of heavy metals in honey from the Campania Region are similar to those reported from Italy and other parts of the world, reflecting the widespread presence of such contaminants. Concentrations of heavy metals in honey were lower than in other bee products such as bees, beeswax, and pollen, which may be related to the chelating excretory mechanisms of bees and to differences in lipid content, exposure to airborne particulate matter, etc., in different matrices. This phenomenon highlights the complexity of heavy metal accumulation in bee systems and the need for comprehensive monitoring to ensure food safety.
The summary of the “Detection of Toxic Elements in Different Food” section is presented in Table 8 as follows.

6. Applications of LA-ICP-MS

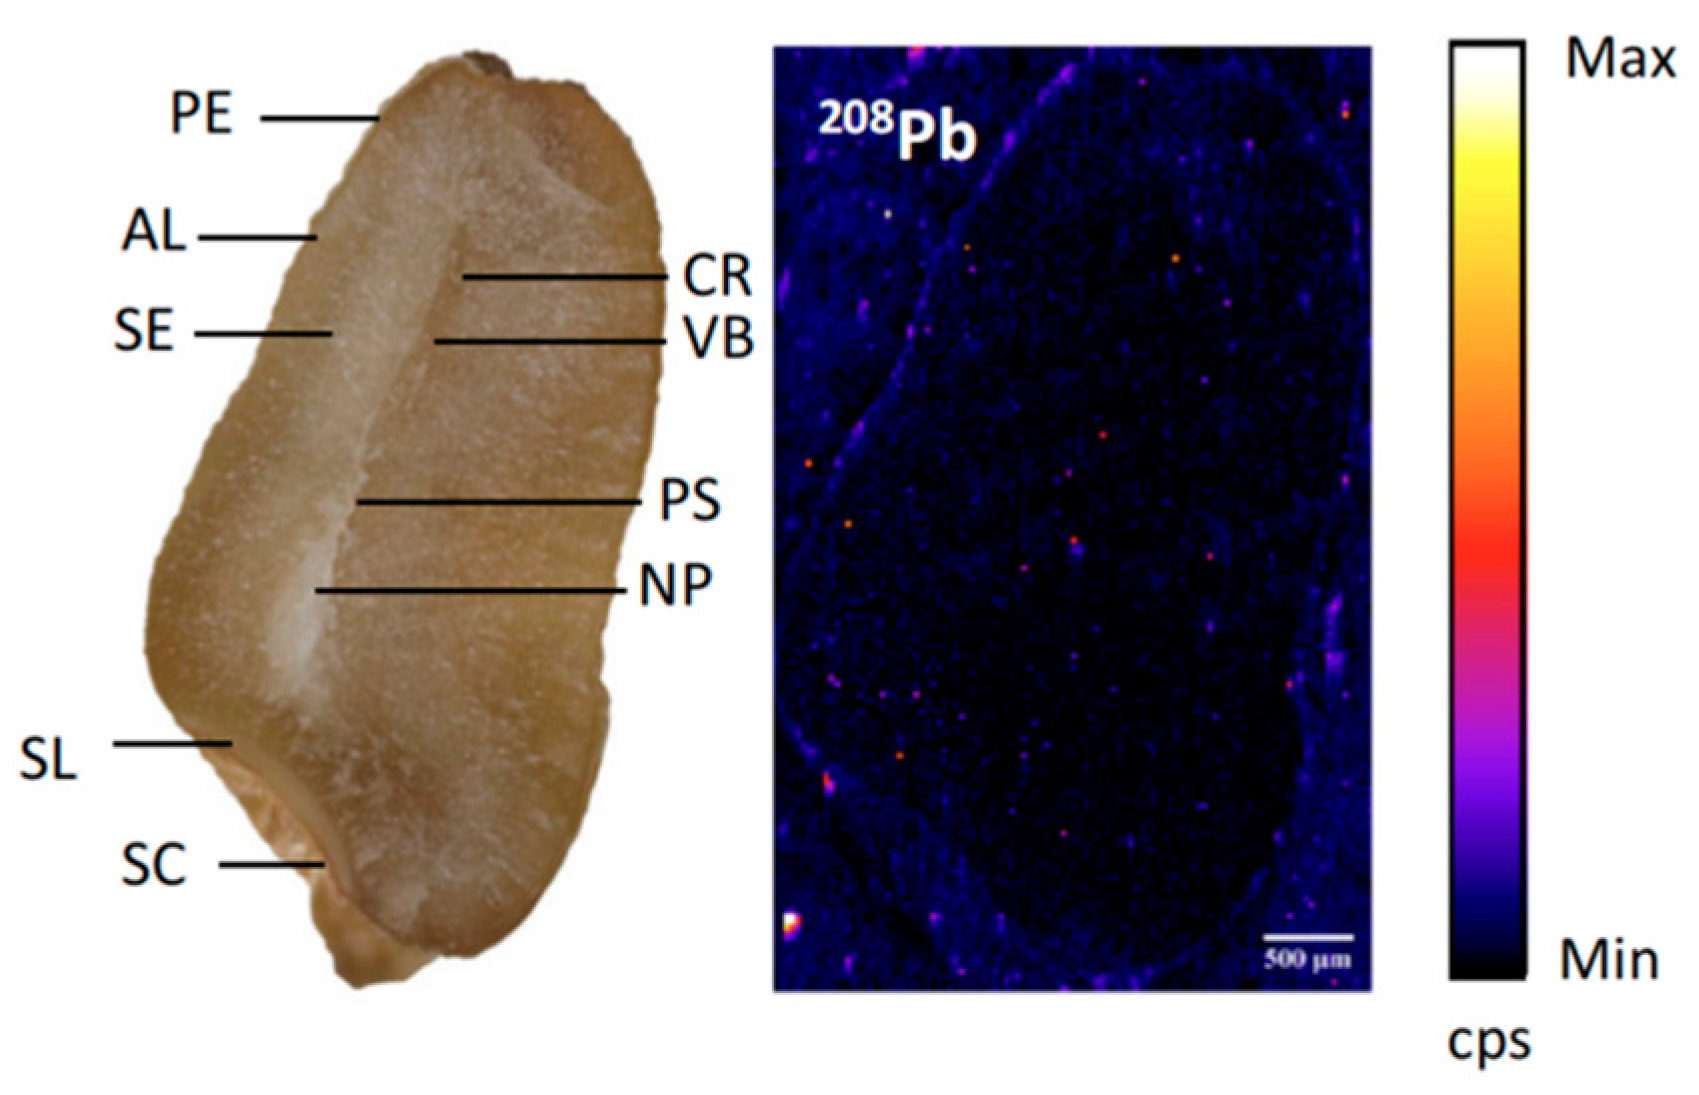
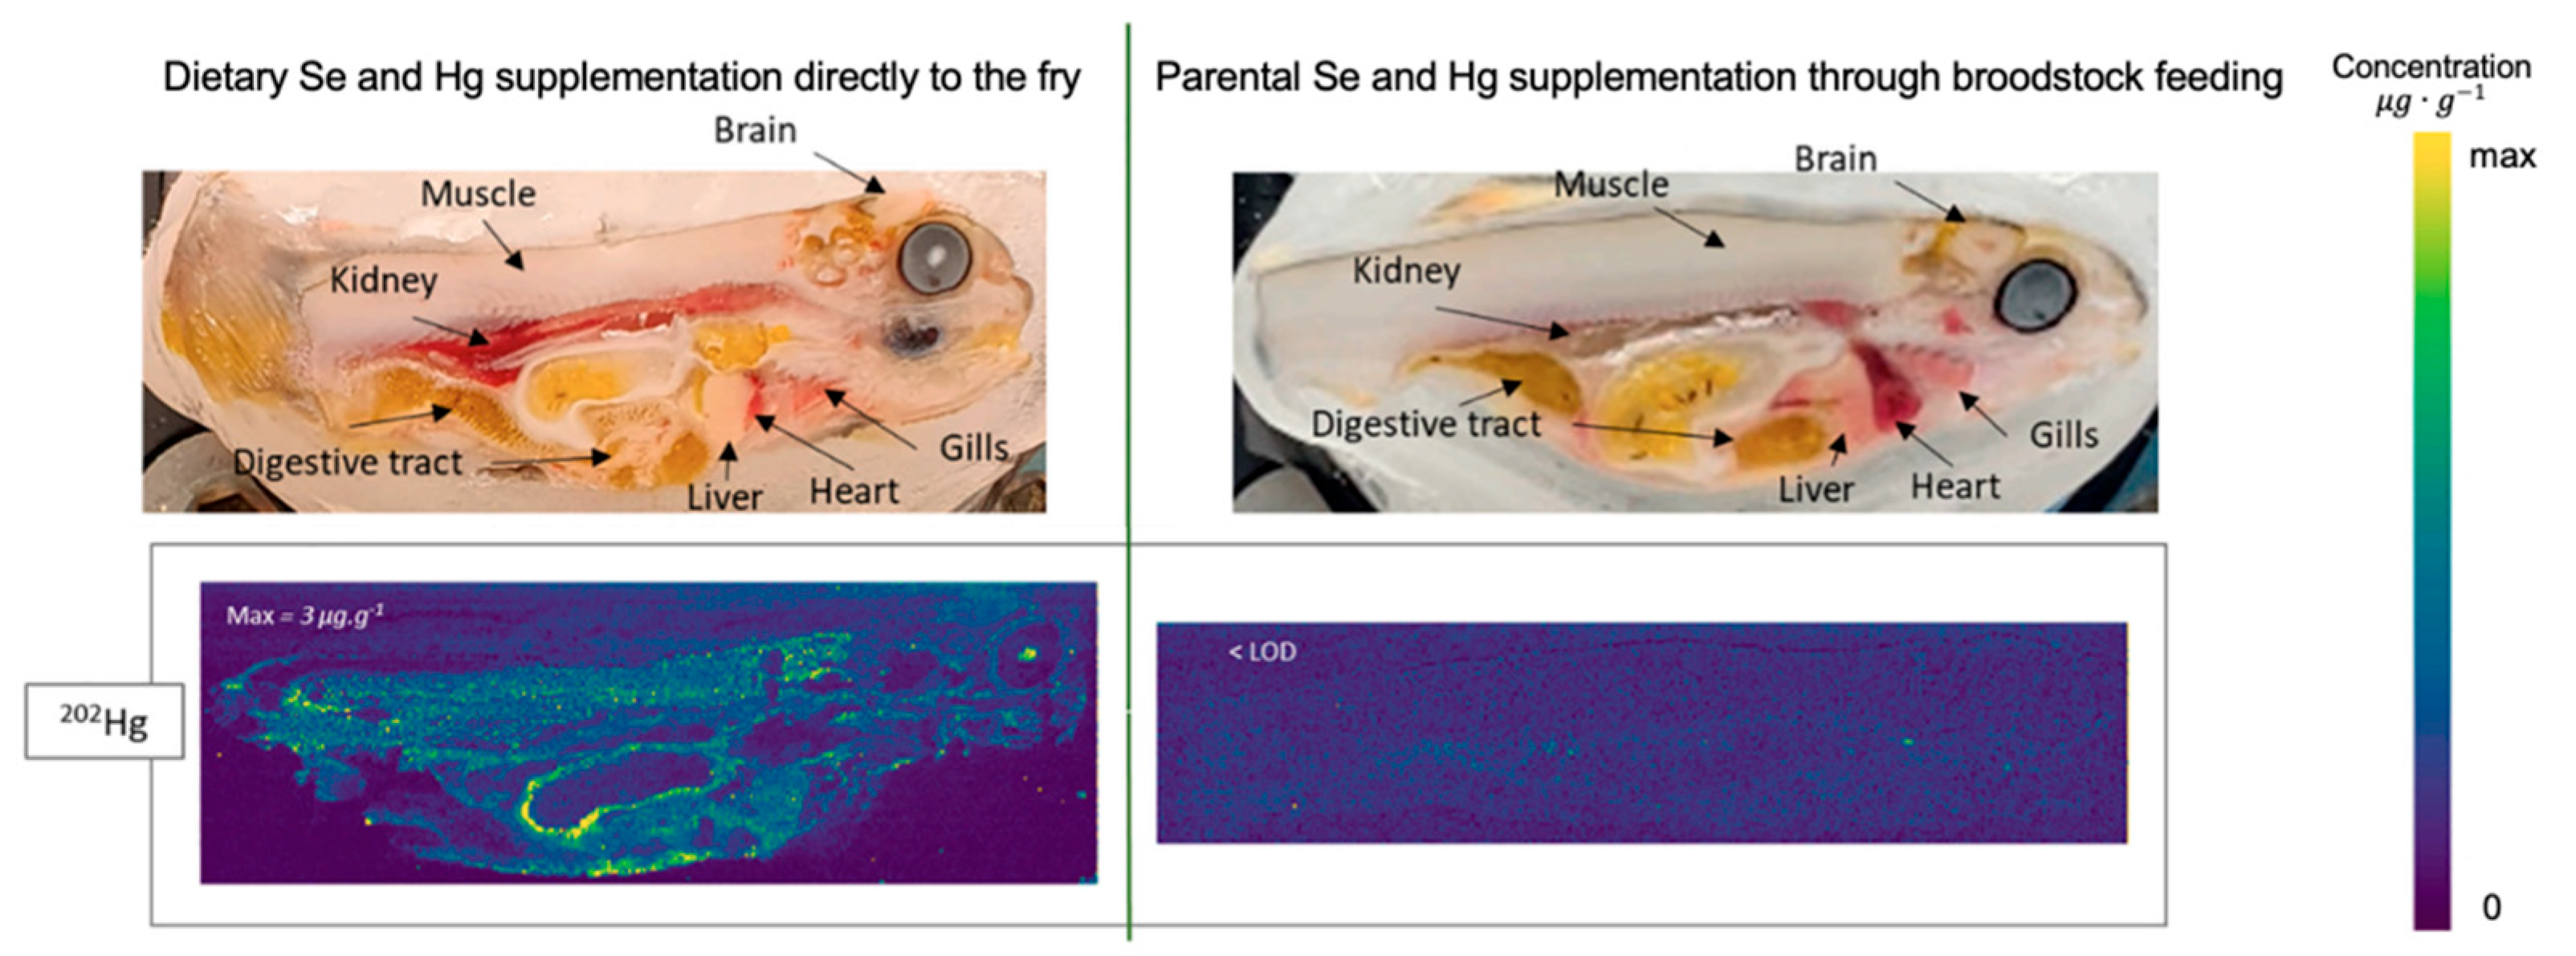
Laser ablation inductively coupled plasma mass spectrometry (LA-ICP-MS) is a highly adaptable mass spectrometry (MS) technique for the direct trace elemental and isotopic analysis of solid samples, delivering robust quantitative analysis capabilities [89]. This method is able to achieve high spatial resolution down to 1 μm and enable fast sampling with advancements in ablation cell design [90]. By mounting a sample on a two-dimensional stage, it can generate images of multiple elements by performing pixel-by-pixel scan on the sample. Widely utilized across diverse analytical domains, LA-ICP-MS has emerged as a pivotal tool, where its unique capabilities address critical challenges in biological tissue characterization and molecular imaging. LA-ICP-MS imaging combines laser ablation and ICP-MS to enable quantitative spatial mapping of specific proteins in biological tissues using metal-labeled probes, overcoming fluorescence imaging limitations like autofluorescence and spectral overlap. It leverages elemental tags (e.g., rare earths, noble metals, etc.) with low tissue background and optimized IHC protocols for absolute protein quantification in complex samples [91].

6.1. Element Quantification by LA-ICP-MS

LA-ICP-MS has significant advantages in the direct quantitative analysis of solids in terms of high sensitivity, simultaneous multi-element detection, spatial resolution in micro-regions (e.g., two-dimensional imaging and depth analysis), and the elimination of the need for complex sample pre-treatment (especially for difficult-to-solubilize samples such as hard tissues, geological materials, etc.) [89]. However, the technique still faces the core challenges of elemental fractionation effects and matrix effects and relies on matrix-matched standards or internal standard corrections (e.g., calcium, sulfur, and carbon) to improve accuracy.
There have been some improvements in recent measurement methods. For example, Fernández et al. proposed an online dual isotope dilution (IDMS) method coupled with LA-ICP-MS for direct quantitative analysis of solid samples. By sequentially analyzing samples and certified standards with the same isotope-enriched tracer solution, the method enables accurate quantification without pre-characterization of the tracer concentration. Experimental validation was performed for the determination of Sr, Rb, and Pb in silicate glass (NIST SRM series) and powder samples. The method significantly reduces the sample preparation time and isotope tracer material consumption, and the study demonstrated that the method is applicable to a wide range of solid matrices, providing a new strategy for rapid and accurate direct quantitative analysis of solids [92]. Michaliszyn et al. proposed a new LA-ICP-MS-based method for direct quantitative analysis of solids, which achieves SI-traceable measurements without relying on matrix-matched standard materials (CRMs) by innovatively utilizing the sample’s own matrix elements (e.g., silicon) as a reference material. The method successfully quantified Pb and Rb in NIST SRM 610 and 612 glass standards by synchronizing the introduction of solid ablative aerosol and standard solution to the plasma, combined with linear regression to separate the signal contributions, and the deviation of the measured value from the certified value was less than 7% with an extended uncertainty (k = 2) of 18–21%. This method breaks through the dependence of traditional methods on scarce standard substances and is particularly suitable for trace impurity analysis of high-purity materials (semiconductors, optical glass, etc.) while preserving the original spatial information of the sample and avoiding destructive pre-treatment [93]. Ewelina et al. explored the optimization of LA-ICP-MS for the direct quantitative analysis of magnesium, strontium, and barium in calcareous biological samples (coralline algae, moss worms, etc.). The key parameters were optimized: the short-wavelength 213 nm laser reduced the fractionation effect due to higher energy, and the signal coefficient of variation (CV) was as low as 0.64~0.81%, which was better than that of the 266 nm laser (CV 1.95%~3.19%); the combination of the calcium internal standard correction efficiently smoothed the effect of surface inhomogeneity, which improved the relative error of strontium from −83% to −12%. The research validation stage of pre-ablation removes surface contamination and significantly improves the image quality of barium distribution, which provides a systematic method reference for the quantitative analysis of biocalcium materials by LA-ICP-MS [94].
In addition, Neff et al. presented an innovative technical solution in the field of quantitative elemental analysis, which centers on the first successful application of a high-power nitrogen plasma source coupled with laser ablation (LA-(N2-ICP)-MS) for elemental analysis of solid samples. The researchers used a microwave-sustained, inductively coupled, atmospheric pressure-based nitrogen plasma (MICAP) with a power of up to 1500 W and a standard Fassel torch tube, overcoming the limitations of previous nitrogen plasmas with low power and poor stability. This innovation directly replaces expensive argon with nitrogen as the plasma gas, fundamentally eliminating critical interferences generated by the argon plasma background (e.g., 40Ar⁺ interfering with 40Ca+ and 40Ar3). 5Cl+ interferes with 75As+, and 2Ar+ interferes with Se, Te isotopes, etc., which have long constrained the ability of conventional LA-(Ar-ICP)-MS to measure K, Ca, Cr, Fe, As, Se, Te, and other elements with high-abundance isotopes by conventional LA-(Ar-ICP)-MS. Focusing on the direct introduction of “dry” aerosols from laser stripping into the nitrogen plasma, the study validated its feasibility in the analysis of real solid samples and demonstrated the potential for a significant reduction in operating costs (using liquid nitrogen instead of high-purity argon) [95].
Additionally, Rua et al. proposed two innovative calibration strategies and verified their application value to address the scarcity of solid standards and matrix matching problems faced by LA-ICP-MS in the quantitative analysis of catalyst trace elements. The first developed a multi-signal calibration method (MSC) that breaks through the traditional reliance on multiple standards by requiring only one certified reference material (CRM) and constructing a calibration curve by changing the laser parameters (repetition frequency or beam diameter) to generate multiple signal points, which significantly reduces the need and cost of matrix-matched CRMs. The second developed a solution-based calibration strategy that completely avoids the need for solid standards by simultaneously introducing the dry aerosol generated by laser stripping and the wet aerosol generated by pneumatic atomization of aqueous standards to the ICP ion source, using the aqueous standards for calibration without the need for solid standards. The experimental validation shows that the two new strategies have excellent performance. The relative deviation of the traditional external standard method combined with Li internal standard is −15%~+7%, while the deviation of the MSC strategy is narrowed to −9%~+7% under the condition of a single CRM with Li internal standard, and when the fused bead-forming powder CRMs (e.g., BHVO-2) with the perfectly matched matrices are used, the deviation is further optimized to −4%~+1%; the solution-based calibration strategy even achieves a deviation range of −3%~+7%, which is comparable to the conventional method. It is worth noting that Li internal standard calibration plays a key role in all the strategies, which improves the elemental recoveries of catalyst samples from 60–124% to 70–117% and effectively suppresses the matrix effect and signal fluctuation. When applied to the quantitative analysis of key toxic elements such as Co, Mo, Ni, and V in petrochemical catalyst samples (molten beads), the results of the new strategy are in high agreement with the XRF reference values, and the solution-based calibration realizes reliable multi-element analysis without solid standards for the first time. This study systematically solved the core bottleneck of the scarcity of solid standards in LA-ICP-MS quantification. The accurate performance of both of them in the range of −9%~+7% deviation provides a practical and universal solution for the monitoring of catalyst toxicity in the petrochemical industry and the high-throughput analysis of other solid samples [96].
In the future, the femtosecond laser needs to be optimized, new matrix matching standards developed, multiple techniques (e.g., chromatography–mass spectrometry) combined, and intelligent calibration algorithms implemented to further improve the quantitative reliability and extend the practical value in bio-imaging, environmental monitoring, and other fields [97].

6.2. Element Imaging by LA-ICP-MS

LA-ICP-MS has made significant progress in recent years in the field of spatially resolved imaging of elemental distribution in biological samples. It has the technical advantage of being able to detect multiple elements (e.g., metals, non-metals, and isotopes) simultaneously with sub-microgram/gram sensitivity, which is suitable for trace element analysis (e.g., heavy metal toxicity studies, nanoparticle uptake tracking, etc.). Spatial resolution can be enhanced to near single-cell level by optimizing the laser ablation cell design. Combined with molecular mass spectrometry or immunohistochemistry for complementary applications, elemental distribution and molecular information can be obtained simultaneously for protein localization and drug metabolism studies [98]. Application examples are as follows.
Six types of grains purchased in Korea were used for the study by Choi et al. The grains were cut into two halves transversely and analyzed by femtosecond (fs)-LA-ICP-MS for arsenic distribution imaging. The results (Figure 7) showed that arsenic in adlay, oat, and barley was mainly distributed in the region of grain cleavage, while arsenic in foxtail millet, sorghum, and corn was concentrated in the embryonic part of the grain, and the highest As content was found in adlay [75].
Nowadays, there are many studies on quantitative imaging of heavy metal elements in rice. Yamaji et al. used LA-ICP-MS to detect the distribution of As and Cd in rice (Oryza sativa) nodal tissues (Figure 8). The conclusion indicated that As and Cd traces were present in rice nodules, mainly concentrated in the thin-walled tissues between vascular bundles [99]. In addition, there have been many more in-depth analyses of heavy metal elements in rice. For example, Pereira et al. imaged the distribution of As and Pb in rice nodal tissues and in three types of commercially available rice (white, whole, and parboiled) by LA-ICP-MS, respectively. It was found that As was enriched in the peripheral tissues of wild-type rice nodes and in the thin-walled tissues of the intervillar tubules, whereas the distribution of As inside the nodes was significantly reduced in the in silico-transporter protein mutants (Lsi2; Lsi3), suggesting that transporter proteins have a regulatory role in the spatial distribution of As. In the analyses of the three types of rice grains, the distribution of As showed a trend of decreasing concentration from the surface layer to the interior, with white rice having the lowest As content due to polishing treatment and parboiled rice having a relatively uniform distribution of As due to hydrothermal treatment that may alter elemental mobility. Pb, on the other hand, was detected only in the surface layer of the grains, suggesting that Pb detection was mainly due to external contamination, and it did not penetrate into the deeper tissues [100].
There are also specialized studies for other grain types, and this study also includes different structures. Zhang et al. collected samples of wheat grains from industrial-transportation polluted areas, pure-transportation polluted areas, and non-polluted areas in Hebei Province to measure the distribution of 208Pb in wheat. The conclusions (Figure 9) yielded that Pb was mainly distributed in the outer layers of the grain (pericarp and seed coat), while the endosperm had the lowest content [51].
In addition to above grains, there have been many assays using LA-ICP-MS to image the spatial distribution of heavy metal elements in different species of organisms. For example, Thyssen et al. used fermented and dried cacao beans produced in the Santander Region of Colombia as samples, prepared them as planar samples by polishing, and imaged their elemental distributions using the LA-ICP–triple quadrupole mass spectrometry (TQMS) technique. It was found (Figure 10) that Cd and Pb were mainly enriched in the seed husk of cacao beans but with differences in the distribution pattern. 208Pb was more concentrated in the outer part of the seed husk, while Cd was also present in higher concentrations in the inner part and in the region of the embryonic axis. There was a region of overlap between the two in the outer part of the seed shell, but Cd was detected in trace amounts in the radicle and embryonic axis, whereas 208Pb was hardly distributed there. The spatial distribution patterns of all detected Cd isotopes in cacao beans were highly consistent, indicating that no spectral interference affected the results [101].
Labeyrie et al. used LA-ICP-MS for elemental imaging using thin sections of rainbow trout fry sampled by parental or direct feed supplementation with methylmercury and organic selenium (Se). It was found (Figure 11) that quantitative imaging of 202Hg was dependent on matrix matching standards (MMS). In fry supplemented directly with Hg, Hg was predominantly distributed in the muscle, kidney, liver, and intestine (concentration ~2 µg-g−1) and co-localized with Se. In contrast, Hg was not detected in fry supplemented only through the parental generation, indicating that Hg was not effectively transferred to the offspring. In addition, Hg signal tails were observed in the LA-ICP-MS analysis, presumably related to the deposition of Hg vapor in the transport system [102].
Wang et al. [103] used the brain, kidney, liver, and spleen of C57 female mice as samples to reveal the distribution pattern and interaction between Hg and Se in the organs by LA-ICP-MS imaging. It was found (Figure 12) that when exposed to inorganic mercury (iHg) alone, Hg was mainly enriched in the kidneys, whereas MeHg was unable to break through the blood–brain barrier to enter the brain, although it was present in small amounts in the kidney, liver, and spleen. However, when Hg was co-exposed with Se, the accumulation of Hg in kidneys increased abruptly to 4.6 times that of the single-exposure group and broke through the blood–brain barrier to enter the brain for the first time, with the synergistic effect of MeHg and Se being particularly significant. In the context of human food safety, the synergistic effects of Hg-Se in the food chain (e.g., fish, shellfish, etc.) need to be emphasized, and selenium-rich foods or supplements in Hg-contaminated areas may amplify the health hazards by facilitating Hg uptake [103]. This experiment also demonstrates the important role of LA-ICP-MS in the medical field.
Future efforts must focus on multi-modal integration (e.g., with fluorescence/MALDI-MS), expanding clinical applications (e.g., antibody-drug conjugates, nucleic acid imaging, etc.), and developing smaller, high-atomic-density labels to balance resolution/sensitivity. Interdisciplinary collaboration will standardize labeling, calibration, and data analysis, driving its use in precision diagnostics and translational research.

7. Challenges and Opportunities of ICP-MS

7.1. Challenges

The application of ICP-MS in food safety testing has the advantages of high sensitivity and multi-element analyses, but the implementation of the technology faces multi-dimensional systemic challenges. Firstly, complex food matrices (e.g., high salinity in seafood, organic matter in dairy products, etc.) tend to clog the nebulizer and cone port during the sample introduction stage, leading to signal fluctuations, and mass spectrometry analysis triggers the double interference of matrix effects and spectral line interferences (e.g., 40Ar35Cl to75As superposition interference, and114Sn to 114Cd homogeneous isobaric interference); even with the use of the dynamic reaction cell (DRC) and mathematical corrections, a residual error of 0.5–5% may still remain. Second, there is a contradiction between efficiency and precision in the sample pretreatment process, which results in fluctuating recoveries of up to 15–30%, whereas the traditional offline process takes 4–6 h/batch, which significantly increases the risk of environmental background contamination. Furthermore, elemental morphology analysis needs to rely on HPLC-ICP-MS coupling technology, but the salts of the chromatographic mobile phase are in conflict with the stability of the plasma, so it is necessary to accurately control the interface temperature (105 ± 2 °C) and add an EDTA stabilizer to maintain the stability of arsenic/mercury and other valence forms, which prolongs the development cycle of the method by two to three times. Finally, the high cost of operation and maintenance constraints on the popularity of the technology, for example complex substrates (such as seawater) causing corrosion of the cone mouth, increase annual maintenance costs up to 15–20%, the purchase price of the instrument, which puts significant pressure on grass-roots testing organizations [104]. To break through these bottlenecks, it is necessary to integrate new technologies such as intelligent matrix matching algorithms, modular digestion workstations, and ICP-MS/MS to build a standardized and economical solutions for the whole process.

7.2. Opportunities

The innovative development of inductively coupled plasma mass spectrometry (ICP-MS) technology is breaking through its traditional limitations in food safety testing in multiple dimensions. However, for regulatory laboratories, scalability requires an assessment of operating costs, which currently range from USD 20 to USD 50 per sample for automated systems and USD 5 to USD 15 for manual methods [105]. The integration of automated sample pre-processing platform and robotics achieves high throughput (200+ samples processed per day) and high reproducibility (RSD < 3%), which significantly improves the efficiency of large-scale monitoring, such as screening of heavy metals in dairy products [106]. At the same time, breakthroughs in miniaturized ICP-MS equipment are expected to pave the way to new applications in metallome analyses and compress traditional laboratories’ 3–5-day analysis cycle to within 2 h [107]. However, field-deployable devices face cost barriers (USD 150,000 to UDS 300,000) and need to be validated for standardized regulatory adoption [105]. In the field of elemental morphology analysis, microfluidic chip and HPLC-ICP-MS technology can shorten the arsenic morphology separation time from 15 min to 5 min, combined with deep learning algorithms for intelligent deconvolution of 206Pb+2207Pb+2 homogeneous heterotopic interferences so that the detection limit is reduced to 0.01 μg [108]. However, its throughput is still limited by the cost of chip manufacturing (USD 120 to USD 250 per chip), making it difficult to achieve high-volume screening [105]. In response to the need for sustainable sample pre-treatment, the new enzymatic-microwave synergistic digestion system reduces the amount of nitric acid by 70%, and dynamically optimizes digestion parameters (e.g., temperature gradient, pressure feedback, etc.) via AI to reduce the digestion time. At the operational level, this reduces the cost of reagents by 40% but increases the energy consumption per sample by 15% [105]. These technological innovations are building a whole-chain solution of “intelligent pre-processing–accurate analysis–real-time decision making”, promoting the development of food safety testing in the on-site, green, and intelligent direction. However, the key to achieving scale in a national monitoring program is to reduce the total cost of a single test to less than USD 10 and to achieve an end-to-end turnaround time of <4 h [105].

Author Contributions

Conceptualization, M.H.; methodology, M.H.; software, M.H.; validation, M.H.; formal analysis, M.H.; investigation, M.H.; resources, M.H.; data curation, M.H.; writing—original draft preparation, M.H.; writing—review and editing, M.H.; visualization, M.H.; supervision, X.L.; project administration, M.H. All authors have read and agreed to the published version of the manuscript.

Funding

This research received no external funding.

Conflicts of Interest

The authors declare no conflict of interest.

Abbreviations

The following abbreviations were used in this manuscript:
AFSAtomic Fluorescence Spectroscopy
AsBArsenobetaine
AsCArsenocholine
BECBackground Equivalent Concentration
BSBritish Standard
Cd-MTsCadmium-Metallothioneins
CECapillary Electrophoresis
CH3Hg+Methylmercury
CRCCollision/Reaction Cell
CRMCertified reference materials
CV-AASCold Vapor–Atomic Absorption Spectrometry
CVGChemical Vapor Generation
DMADi-methylarsinic Acid
DPASVDifferential Pulse Anodic Stripping Voltammetry
DRCDynamic Reaction Cell
ECElectrical Conductivity
EDTAEthylenediaminetetraacetic Acid
EFSAEuropean Food Safety Authority
EPAEnvironmental Protection Agency
ETVElectrothermal Vaporization
FAASFlame Atomic Absorption Spectroscopy
FDAFood and Drug Administration
fs-LA-ICP-MSFemtosecond–Laser Ablation–ICP-MS
GEDGas Exchange Device
GFAASGraphite Furnace Atomic Absorption Spectroscopy
H2Hydrogen
HAEHeat-Assisted Extraction
HeHelium
Hg2+Inorganic Mercury
HPLCHigh-Performance Liquid Chromatography
HR-ICP-MSHigh-Resolution–ICP-MS
ICP-MSInductively Coupled Plasma–Mass Spectrometry
ICP-OESInductively Coupled Plasma–Optical Emission Spectrometry
IDMSIsotope Dilution Mass Spectrometry
iAsInorganic Arsenic
IFSInterference Standard Method
ISInternal Standard
JECFAJoint FAO/WHO Expert Committee on Food Additives
KEDKinetic Energy Discrimination
LA-ICP-MSLaser Ablation–ICP-MS
LODLimit of Detection
LOQLimit of Quantification
LPMELiquid Phase Microextraction
MACMaximum Allowable Concentration
MAEMicrowave-Assisted Extraction
MDMembrane Desolvation
MeHg⁺Methylmercury
MICAPMicrowave-sustained, Inductively Coupled, Atmospheric Pressure-based nitrogen plasma
MMAMono-Methylarsonic Acid
MPIMetal Pollution Index
MSCMulti-Signal Calibration method
MSPEMagnetic Solid Phase Extraction
MTsMetallothioneins
MW-UVMicrowave–Ultraviolet Degradation
NADESNatural Deep-Eutectic Solvents
PhHg⁺Phenylmercury
ppbParts Per Billion
pptParts Per Trillion
PTMIProvisional Tolerable Monthly Intake
RSDRelative Standard Deviation
SAMStandard Addition Method
SECSize Exclusion Chromatography
SPMESolid-Phase Microextraction
TDSTotal Dissolved Solids
TFTransfer Factor
THQTarget Hazard Quotient
TQMSTriple Quadrupole Mass Spectrometry
TWITolerable Weekly Intake
UV-visUltraviolet–Visible Spectroscopy
VSGVolatile Species Generation
WHOWorld Health Organization
YMWEYemen Ministry of Water and Environment

References

  1. Pauli, B.J. The Flint water crisis. Wiley Interdiscip. Rev. Water 2020, 7, e1420. [Google Scholar] [CrossRef]
  2. Hüsken, A.; Arent, L.; Lohmayer, R. Cadmium Maximum Levels and Residue Situation in the German Wheat and Rye Harvest from 1975 to 2021. J. Agric. Food Chem. 2024, 72, 16496–16505. [Google Scholar] [CrossRef]
  3. Orzoł, A.; Gołębiowski, A.; Szultka-Młyńska, M.; Głowacka, K.; Pomastowski, P.; Buszewski, B. ICP-MS Analysis of Cadmium Bioaccumulation and Its Effect on Pea Plants (Pisum sativum L.). Pol. J. Environ. Stud. 2022, 31, 4779–4787. [Google Scholar] [CrossRef] [PubMed]
  4. Aoshima, K. Itai-itai disease: Renal tubular osteomalacia induced by environmental exposure to cadmium—Historical review and perspectives. Soil Sci. Plant Nutr. 2016, 62, 319–326. [Google Scholar] [CrossRef]
  5. Li, H.; Bei, Q.; Zhang, W.; Marimuthu, M.; Hassan, M.M.; Haruna, S.A.; Chen, Q. Ultrasensitive fluorescence sensor for Hg2+ in food based on three-dimensional upconversion nanoclusters and aptamer-modulated thymine-Hg2+-thymine strategy. Food Chem. 2023, 422, 136202. [Google Scholar] [CrossRef]
  6. Caravati, E.M.; Erdman, A.R.; Christianson, G.; Nelson, L.S.; Woolf, A.D.; Booze, L.L.; Cobaugh, D.J.; Chyka, P.A.; Scharman, E.J.; Manoguerra, A.S.; et al. Elemental mercury exposure: An evidence-based consensus guideline for out-of-hospital management. Clin. Toxicol. 2008, 46, 1–21. [Google Scholar] [CrossRef] [PubMed]
  7. Clarkson, T.W.; Magos, L.; Myers, G.J. The Toxicology of Mercury—Current Exposures and Clinical Manifestations. N. Engl. J. Med. 2003, 349, 1731–1737. [Google Scholar] [CrossRef]
  8. Eto, K. Minamata disease. Neuropathology 2000, 20, 14–19. [Google Scholar] [CrossRef]
  9. Atkins, P.; Hassan, M.; Dunn, C. Poisons, pragmatic governance and deliberative democracy: The arsenic crisis in Bangladesh. Geoforum 2007, 38, 155–170. [Google Scholar] [CrossRef]
  10. Maietta, I.; Otero-Martínez, C.; Fernández, S.; Sánchez, L.; González-Fernández, Á.; Polavarapu, L.; Simón-Vázquez, R. The Toxicity of Lead and Lead-Free Perovskite Precursors and Nanocrystals to Human Cells and Aquatic Organisms. Adv. Sci. 2025, 12, e2415574. [Google Scholar] [CrossRef]
  11. Athmouni, K.; Belhaj, D.; El Feki, A.; Ayadi, H. Optimization, antioxidant properties and GC–MS analysis of Periploca angustifolia polysaccharides and chelation therapy on cadmium-induced toxicity in human HepG2 cells line and rat liver. Int. J. Biol. Macromol. 2018, 108, 853–862. [Google Scholar] [CrossRef] [PubMed]
  12. Atti, S.K.; Silver, E.M.; Chokshi, Y.; Casteel, S.; Kiernan, E.; Dela Cruz, R.; Kazzi, Z.; Geller, R.J. All that glitters is not gold: Mercury poisoning in a family mimicking an infectious illness. Curr. Probl. Pediatr. Adolesc. Health Care 2020, 50, 100758. [Google Scholar] [CrossRef] [PubMed]
  13. Sambu, S.; Wilson, R. Arsenic in food and water—A brief history. Toxicol. Ind. Health 2008, 24, 217–226. [Google Scholar] [CrossRef]
  14. Wang, Q.; Wang, G.; Xie, S.; Zhao, X.; Zhang, Y. Comparison of high-performance liquid chromatography and ultraviolet-visible spectrophotometry to determine the best method to assess Levofloxacin released from mesoporous silica microspheres/nano-hydroxyapatite composite scaffolds. Exp. Ther. Med. 2019, 17, 2694–2702. [Google Scholar] [CrossRef]
  15. Hu, B.; Shengqing, L.; Guoqiang, X.; Man, H.; Jiang, Z. Recent Progress in Electrothermal Vaporization–Inductively Coupled Plasma Atomic Emission Spectrometry and Inductively Coupled Plasma Mass Spectrometry. Appl. Spectrosc. Rev. 2007, 42, 203–234. [Google Scholar] [CrossRef]
  16. Ammann, A.A. Inductively coupled plasma mass spectrometry (ICP MS): A versatile tool. J. Mass Spectrom. 2007, 42, 419–427. [Google Scholar] [CrossRef]
  17. Wu, D.; Pichler, T. Simultaneous speciation analysis of As, Sb and Se redox couples by SF-ICP-MS coupled to HPLC. Anal. Methods 2014, 6, 5112–5119. [Google Scholar] [CrossRef]
  18. Sylvester, P.J. A brief history of laser ablation inductively coupled plasma mass spectrometry (LA-ICP-MS). Elements 2016, 12, 307–310. [Google Scholar] [CrossRef]
  19. Gao, F.; Hao, X.; Zeng, G.; Guan, L.; Wu, H.; Zhang, L.; Wei, R.; Wang, H.; Li, H. Identification of the geographical origin of Ecolly (Vitis vinifera L.) grapes and wines from different Chinese regions by ICP-MS coupled with chemometrics. J. Food Compos. Anal. 2022, 105, 104248. [Google Scholar] [CrossRef]
  20. Kashani, A.; Mostaghimi, J. Aerosol characterization of concentric pneumatic nebulizer used in inductively coupled plasma-mass spectrometry(ICP-MS). At. Sprays 2010, 20, 415–433. [Google Scholar] [CrossRef]
  21. Brito, T.A.; Costa, F.S.; Oliveira, R.C.; Amaral, C.D.; Labuto, G.; Gonzalez, M.H. Green extraction using natural deep eutectic solvents for determination of As, Cd, and Pb in plant and food matrices by ICP-MS. Food Chem. 2025, 464, 141922. [Google Scholar] [CrossRef]
  22. Cerveira, C.; Hermann, P.; Pereira, J.; Pozebon, D.; Mesko, M.; Moraes, D. Evaluation of microwave-assisted ultraviolet digestion method for rice and wheat for subsequent spectrometric determination of As, Cd, Hg and Pb. J. Food Compos. Anal. 2020, 92, 103585. [Google Scholar] [CrossRef]
  23. Patel, A.; Chakraborty, S.; Misra, S.K.; Datta, B. Hydrolytic Enzyme-Facilitated Mass Spectrometric Investigation of Metals in Processed Food Matrices. ACS Food Sci. Technol. 2024, 4, 1152–1165. [Google Scholar] [CrossRef]
  24. Peters, R.; Herrera-Rivera, Z.; Undas, A.; van der Lee, M.; Marvin, H.; Bouwmeester, H.; Weigel, S. Single particle ICP-MS combined with a data evaluation tool as a routine technique for the analysis of nanoparticles in complex matrices. J. Anal. At. Spectrom. 2015, 3, 1274–1285. [Google Scholar] [CrossRef]
  25. Ghaffour, D.; Leufroy, A.; Jitaru, P. A novel method for multi-matrix arsenic speciation analysis by anion-exchange HPLC-ICP-MS in the framework of the third (French) total diet study: A novel method for multi-matrix arsenic speciation analysis by anion-exchange HPLC-ICP-MS in the framework of the third (French) total diet study. Anal. Bioanal. Chem. 2025, 417, 1519–1530. [Google Scholar] [CrossRef] [PubMed]
  26. Beltrami, D.; Calestani, D.; Maffini, M.; Suman, M.; Melegari, B.; Zappettini, A.; Zanotti, L.; Casellato, U.; Careri, M.; Mangia, A. Development of a combined SEM and ICP-MS approach for the qualitative and quantitative analyses of metal microparticles and sub-microparticles in food products. Anal. Bioanal. Chem. 2011, 401, 1401–1409. [Google Scholar] [CrossRef] [PubMed]
  27. Wang, H.; Liu, X.; Nan, K.; Chen, B.; He, M.; Hu, B. Sample pre-treatment techniques for use with ICP-MS hyphenated techniques for elemental speciation in biological samples. J. Anal. At. Spectrom. 2017, 32, 58–77. [Google Scholar] [CrossRef]
  28. Silva, J.S.; Heidrich, G.M.; Poletto, B.O.; Paniz, J.N.G.; Dressler, V.L.; Flores, E.M.M. Mercury determination in bioresorbable calcium phosphate using a new electrothermal vaporization system coupled to ICP-MS. J. Anal. At. Spectrom. 2023, 38, 1–16. [Google Scholar] [CrossRef]
  29. Gao, Y.; Liu, R.; Yang, L. Application of chemical vapor generation in ICP-MS: A review. Chin. Sci. Bull. 2013, 58, 1980–1991. [Google Scholar] [CrossRef]
  30. Subramanian, R.; Muthuganesan, N.; Venu, S.; Gopika, S.K.; Thummar, U.G.; Chakkaravarthi, A.; Singh, P.S.; Singh, S. Integrated membrane process for pretreating and desolventizing hexane-soybean oil miscella—A pilot plant study. J. Membr. Sci. 2024, 704, 122808. [Google Scholar] [CrossRef]
  31. Kilic, S.; Soylak, M. Determination of trace element contaminants in herbal teas using ICP-MS by different sample preparation method. J. Food Sci. Technol. 2020, 57, 927–933. [Google Scholar] [CrossRef]
  32. Shen, K.; Ni, Z.; Xiaoming, Y.; Zhongxi, L.; Ying, Z.; Zhou, T. Dry Ashing Preparation of (Quasi)solid Samples for the Determination of Inorganic Elements by Atomic/Mass Spectrometry. Appl. Spectrosc. Rev. 2015, 50, 304–331. [Google Scholar] [CrossRef]
  33. Pereira, L.S.F.; Enders, M.S.P.; Iop, G.D.; Mello, P.A.; Flores, E.M.M. Determination of Cl, Br and I in soils by ICP-MS: Microwave-assisted wet partial digestion using H2O2 in an ultra-high pressure system. J. Anal. At. Spectrom. 2018, 33, 649–657. [Google Scholar] [CrossRef]
  34. Nurubeyli, T.K.; Ahmadova, K.N. The role of the spectral matrix effect in the element analysis of biological fluids in ICP-MS. Mod. Phys. Lett. B 2020, 35, 2150094. [Google Scholar] [CrossRef]
  35. Kilic, M.; Kilic, S.; Yenisoy-Karakaş, S. The method development for elimination of matrix interferences in seawater monitoring to determine elements by ICP-MS. Environ. Monit. Assess. 2023, 195, 180. [Google Scholar] [CrossRef]
  36. Sugiyama, N. Attenuation of doubly charged ion interferences on arsenic and selenium by ICP-MS under low kinetic energy collision cell conditions with hydrogen cell gas. J. Anal. At. Spectrom. 2021, 36, 294–302. [Google Scholar] [CrossRef]
  37. Lum, T.-S.; Sze-Yin Leung, K. Strategies to overcome spectral interference in ICP-MS detection. J. Anal. At. Spectrom. 2016, 31, 178–188. [Google Scholar] [CrossRef]
  38. Ni, W.; Mao, X.; Xiao, F.; Guo, X.; Wang, L.; Wu, J.; Wang, T. Determination of Ultra-Trace Rhodium in Geological Samples by High Radio Frequency Power Cold Plasma and Kinetic Energy Discrimination Collision Cell-Inductively Coupled Plasma-Mass Spectrometry (KED-ICP-MS). Anal. Lett. 2024, 57, 1816–1828. [Google Scholar] [CrossRef]
  39. Ohata, M.; Nishiguchi, K. Research Progress on Gas to Particle Conversion–Gas Exchange ICP-MS for Direct Analysis of Ultra-trace Metallic Compound Gas. Anal. Sci. 2018, 34, 657–666. [Google Scholar] [CrossRef]
  40. Yamada, N. Kinetic energy discrimination in collision/reaction cell ICP-MS: Theoretical review of principles and limitations. Spectrochim. Acta Part B At. Spectrosc. 2015, 110, 31–44. [Google Scholar] [CrossRef]
  41. Kuznetsova, O.V.; Mokhodoeva, O.B.; Maksimova, V.V.; Dzhenloda, R.K.; Jarosz, M.; Shkinev, V.M.; Timerbaev, A.R. High-resolution ICP-MS approach for characterization of magnetic nanoparticles for biomedical applications. J. Pharm. Biomed. Anal. 2020, 189, 113479. [Google Scholar] [CrossRef] [PubMed]
  42. Schoof, R.A.; Yost, L.J.; Eickhoff, J.; Crecelius, E.A.; Cragin, D.W.; Meacher, D.M.; Menzel, D.B. A Market Basket Survey of Inorganic Arsenic in Food. Food Chem. Toxicol. 1999, 37, 839–846. [Google Scholar] [CrossRef]
  43. Nawrocka, A.; Durkalec, M.; Michalski, M.; Posyniak, A. Simple and reliable determination of total arsenic and its species in seafood by ICP-MS and HPLC-ICP-MS. Food Chem. 2022, 379, 132045. [Google Scholar] [CrossRef]
  44. Wang, Z.; Gui, H.; Luo, Z.; Sarakiotia, I.L.; Yan, C.; Laing, G.D. Arsenic release: Insights into appropriate disposal of arsenic-loaded algae precipitated from arsenic contaminated water. J. Hazard. Mater. 2020, 384, 121249. [Google Scholar] [CrossRef] [PubMed]
  45. Norton, G.; Deacon, C.; Mestrot, A.; Feldmann, J.; Jenkins, P.; Baskaran, C.; Meharg, A.A. Arsenic Speciation and Localization in Horticultural Produce Grown in a Historically Impacted Mining Region. Environ. Sci. Technol. 2013, 47, 6164–6172. [Google Scholar] [CrossRef] [PubMed]
  46. Norton, G.J.; Pinson, S.R.; Alexander, J.; Mckay, S.; Hansen, H.; Duan, G.L.; Rafiqul Islam, M.; Islam, S.; Stroud, J.L.; Zhao, F.J.; et al. Variation in grain arsenic assessed in a diverse panel of rice (Oryza sativa) grown in multiple sites. New Phytol. 2012, 193, 650–664. [Google Scholar] [CrossRef]
  47. Arsenic. Available online: https://www.who.int/news-room/fact-sheets/detail/arsenic (accessed on 27 July 2025).
  48. Arsenic in Food. Available online: https://www.fda.gov/food/environmental-contaminants-food/arsenic-food (accessed on 27 July 2025).
  49. Arsenic. Available online: https://food.ec.europa.eu/food-safety/chemical-safety/contaminants/catalogue/arsenic_en (accessed on 27 July 2025).
  50. EFSA Panel on Contaminants in the Food Chain (CONTAM). Scientific Opinion on Lead in Food. EFSA J. 2010, 8, 1570. [Google Scholar] [CrossRef]
  51. Zhang, X.-Y.; Geng, L.-P.; Gao, P.-P.; Dong, J.-W.; Zhou, C.; Li, H.-B.; Chen, M.-M.; Xue, P.-Y.; Liu, W.-J. Bioimaging of Pb by LA-ICP-MS and Pb isotopic compositions reveal distributions and origins of Pb in wheat grain. Sci. Total Environ. 2022, 802, 149729. [Google Scholar] [CrossRef]
  52. Lead Poisoning and Health. Available online: https://www.who.int/news-room/fact-sheets/detail/lead-poisoning-and-health (accessed on 27 July 2025).
  53. Lead in Food and Foodwares. Available online: https://www.fda.gov/food/environmental-contaminants-food/lead-food-and-foodwares (accessed on 27 July 2025).
  54. EASECAST NEWS—Lead Regulation in the, EU. Available online: https://www.rheinmetall.com/Rheinmetall%20Group/Systeme%20und%20Produkte/KS%20Gleitlager/Datenbl%C3%A4tter/EASECAST%20NEWS%20en.pdf (accessed on 27 July 2025).
  55. Wang, R.; Sang, P.; Guo, Y.; Jin, P.; Cheng, Y.; Yu, H.; Xie, Y.; Yao, W.; Qian, H. Cadmium in food: Source, distribution and removal. Food Chem. 2023, 405, 134666. [Google Scholar] [CrossRef]
  56. Liu, M.; Fan, D.; Liao, Y.; Chen, B.; Yang, Z. Heavy metals in surficial sediments of the central Bohai Sea: Their distribution, speciation and sources. Acta Oceanol. Sin. 2016, 35, 98–110. [Google Scholar] [CrossRef]
  57. Álvarez-Llamas, G.; Fernández de la Campa, M.R.; Sanz-Medel, A. An alternative interface for CE–ICP–MS cadmium speciation in metallothioneins based on volatile species generation. Anal. Chim. Acta 2005, 546, 236–243. [Google Scholar] [CrossRef]
  58. Wei, S.; Guo, B.; Feng, L.; Jiang, T.; Li, M.; Wei, Y. Cadmium Distribution and Characteristics of Cadmium-binding Proteins in Rice (Oryza sativa L.) Kernel. Food Sci. Technol. Res. 2017, 23, 661–668. [Google Scholar] [CrossRef]
  59. Suzuki, K.T.; Sasakura, C.; Ohmichi, M. Binding of Endogenous and Exogenous Cadmium to Glutelin in Rice Grains as Studied by HPLC/ICP-MS with Use of a Stable Isotope. J. Trace Elem. Med. Biol. 1997, 11, 71–76. [Google Scholar] [CrossRef]
  60. World Health Organization. Exposure to Cadmium: A Major Public Health Concern. 2019. Available online: https://iris.who.int/bitstream/handle/10665/329480/WHO-CED-PHE-EPE-19.4.3-eng.pdf?sequence=1 (accessed on 27 July 2025).
  61. Cadmium in Food and Foodwares. Available online: https://www.fda.gov/food/environmental-contaminants-food/cadmium-food-and-foodwares (accessed on 27 July 2025).
  62. Commission Regulation (EU) 2021/1323. Available online: https://eur-lex.europa.eu/eli/reg/2021/1323/oj/eng (accessed on 27 July 2025).
  63. Nogara, P.A.; Farina, M.; Aschner, M.; Rocha, J.B.T. Mercury in Our Food. Chem. Res. Toxicol. 2019, 32, 1459–1461. [Google Scholar] [CrossRef] [PubMed]
  64. Zhu, S.; Chen, B.; He, M.; Huang, T.; Hu, B. Speciation of mercury in water and fish samples by HPLC-ICP-MS after magnetic solid phase extraction. Talanta 2017, 171, 213–219. [Google Scholar] [CrossRef] [PubMed]
  65. Anil, A.S.; Alam, S.; Thakur, L.K. Optimized mercury speciation analysis using LC-ICP-MS and microwave assisted extraction for precise determination of methylmercury in fish, rice and soil. J. Food Compos. Anal. 2024, 129, 106092. [Google Scholar] [CrossRef]
  66. Tian, X.; Wang, Y.; Xu, T.; Guo, Y.; Bi, Y.; Liu, Y.; Liang, Y.; Cui, W.; Liu, Y.; Hu, L.; et al. Bioconcentration of Inorganic and Methyl Mercury by Algae Revealed Using Dual-Mass Single-Cell ICP-MS with Double Isotope Tracers. Environ. Sci. Technol. 2024, 58, 7860–7869. [Google Scholar] [CrossRef] [PubMed]
  67. Mercury and Health. Available online: https://www.who.int/news-room/fact-sheets/detail/mercury-and-health (accessed on 27 July 2025).
  68. Mercury in Food. Available online: https://www.fda.gov/food/environmental-contaminants-food/mercury-food (accessed on 27 July 2025).
  69. Mercury. Available online: https://environment.ec.europa.eu/topics/chemicals/mercury_en (accessed on 27 July 2025).
  70. Pluháček, T.; Pechancová, R.; Milde, D.; Bettencourt da Silva, R.J.N. Bottom-up uncertainty evaluation of complex measurements from correlated performance data: Determination of total Cr in yeast by ICP-MS after acid digestion. Food Chem. 2023, 404, 134466. [Google Scholar] [CrossRef]
  71. Lee, J.; Park, Y.-S.; Lee, H.-J.; Koo, Y.E. Microwave-assisted digestion method using diluted nitric acid and hydrogen peroxide for the determination of major and minor elements in milk samples by ICP-OES and ICP-MS. Food Chem. 2022, 373, 131483. [Google Scholar] [CrossRef]
  72. WHO. Background document for development of WHO guideline for drinking water quality. Version Public Rev. Issued WHO 2022, 9, 29. [Google Scholar]
  73. Kuplulu, O.; Iplikcioglu Cil, G.; Korkmaz, S.D.; Aykut, O.; Ozansoy, G. Determination of Metal Contamination in Seafood from the Black, Marmara, Aegean and Mediterranean Sea Metal Contamination in Seafood. J. Hell. Vet. Med. Soc. 2018, 69, 749–758. [Google Scholar] [CrossRef]
  74. Jovičić, K.; Nikolić, D.M.; Višnjić-Jeftić, Ž.; Đikanović, V.; Skorić, S.; Stefanović, S.M.; Lenhardt, M.; Hegediš, A.; Krpo-Ćetković, J.; Jarić, I. Mapping differential elemental accumulation in fish tissues: Assessment of metal and trace element concentrations in wels catfish (Silurus glanis) from the Danube River by ICP-MS. Environ. Sci. Pollut. Res. Int. 2015, 22, 3820–3827. [Google Scholar] [CrossRef]
  75. Choi, S.H.; Kim, J.Y.; Mi Choi, E.; Lee, M.Y.; Yang, J.Y.; Ho Lee, G.; Su Kim, K.; Yang, J.-S.; Russo, R.E.; Yoo, J.H.; et al. Heavy Metal Determination by Inductively Coupled Plasma—Mass Spectrometry (ICP-MS) and Direct Mercury Analysis (DMA) and Arsenic Mapping by Femtosecond (fs)—Laser Ablation (LA) ICP-MS in Cereals. Anal. Lett. 2019, 52, 496–510. [Google Scholar] [CrossRef]
  76. Thabit, T.M.A.M.; Shokr, S.A.; Elgeddawy, D.I.H.; El-Naggar, M.A.H. Determination of Heavy Metals in Wheat and Barley Grains Using ICP-MS/MS. J. AOAC Int. 2020, 103, 1277–1281. [Google Scholar] [CrossRef]
  77. Sel, S.; Koyuncu, İ. Microwave-Assisted Sample Preparation for Simultaneous Determination of Trace Elements in Vegan Foods with Inductively Coupled Plasma Mass Spectrometry. Food Anal. Methods 2025, 18, 428–441. [Google Scholar] [CrossRef]
  78. Jain, H.V.; Dhiman, S.; Ansari, N.G. Divulging the unexpected: Insight investigation of minor and toxic elements in diverse millet. Microchem. J. 2025, 213, 113636. [Google Scholar] [CrossRef]
  79. Fioroto, A.M.; Albuquerque, L.G.R.; Carvalho, A.A.C.; Oliveira, A.P.; Rodrigues, F.; Oliveira, P.V. Hydroponic growth test of maize sprouts to evaluate As, Cd, Cr and Pb translocation from mineral fertilizer and As and Cr speciation. Environ. Pollut. 2020, 262, 114216. [Google Scholar] [CrossRef] [PubMed]
  80. Silalahi, E.M.; Lioe, H.N.; Faridah, D.N. Heavy Metals Cd, Hg, and Pb in Fresh Milk from Dairy Farms in South Jakarta Analyzed by ICP-MS. Trop. Anim. Sci. J. 2023, 46, 502–508. [Google Scholar] [CrossRef]
  81. Pacquette, L.H.; Thompson, J.J.; Malaviole, I.; Zywicki, R.; Woltjes, F.; Ding, Y.; Mittal, A.; Ikeuchi, Y.; Sadipiralla, B.; Kimura, S.; et al. Minerals and Trace Elements in Milk, Milk Products, Infant Formula, and Adult/Pediatric Nutritional Formula, ICP-MS Method: Collaborative Study, AOAC Final Action 2015.06, ISO/DIS 21424, IDF 243. J. AOAC Int. 2018, 101, 536–561. [Google Scholar] [CrossRef] [PubMed]
  82. Başaran, B. An assessment of heavy metal level in infant formula on the market in Turkey and the hazard index. J. Food Compos. Anal. 2022, 105, 104258. [Google Scholar] [CrossRef]
  83. Balaram, V.; Copia, L.; Kumar, U.S.; Miller, J.; Chidambaram, S. Pollution of water resources and application of ICP-MS techniques for monitoring and management—A comprehensive review. Geosyst. Geoenviron. 2023, 2, 100210. [Google Scholar] [CrossRef]
  84. Alhagri, I.A.; Al-Hakimi, A.N.; Al-Hazmy, S.M.; Albadri, A.E. Determination of trace and heavy metals in bottled drinking water in Yemen by ICP-MS. Results Chem. 2024, 8, 101558. [Google Scholar] [CrossRef]
  85. Surucu, O. Trace determination of heavy metals and electrochemical removal of lead from drinking water. Chem. Pap. 2021, 75, 4227–4238. [Google Scholar] [CrossRef]
  86. İslamoğlu, A.H.; Kahvecioğlu, T.; Bönce, G.; Gedik, E.; Güneş, F. Determination of heavy metals in some fruits, vegetables and fish by ICP-MS. Eurasian J. Food Sci. Technol. 2021, 5, 67–76. [Google Scholar]
  87. İzol, E.; Kaya, E.; Karahan, D. Investigation of some metals in honey samples produced in Different Regions of Turkey’s Bingöl province by ICP-MS. Mellifera 2021, 21, 1–17. [Google Scholar]
  88. Scivicco, M.; Squillante, J.; Velotto, S.; Esposito, F.; Cirillo, T.; Severino, L. Dietary exposure to heavy metals through polyfloral honey from Campania region (Italy). J. Food Compos. Anal. 2022, 114, 104748. [Google Scholar] [CrossRef]
  89. Limbeck, A.; Galler, P.; Bonta, M.; Bauer, G.; Nischkauer, W.; Vanhaecke, F. Recent advances in quantitative LA-ICP-MS analysis: Challenges and solutions in the life sciences and environmental chemistry. Anal. Bioanal. Chem. 2015, 407, 6593–6617. [Google Scholar] [CrossRef]
  90. Wang, H.A.O.; Grolimund, D.; Giesen, C.; Borca, C.N.; Shaw-Stewart, J.R.H.; Bodenmiller, B.; Günther, D. Fast Chemical Imaging at High Spatial Resolution by Laser Ablation Inductively Coupled Plasma Mass Spectrometry. Anal. Chem. 2013, 85, 10107–10116. [Google Scholar] [CrossRef]
  91. Cruz-Alonso, M.; Lores-Padín, A.; Valencia, E.; González-Iglesias, H.; Fernández, B.; Pereiro, R. Quantitative mapping of specific proteins in biological tissues by laser ablation–ICP-MS using exogenous labels: Aspects to be considered. Anal. Bioanal. Chem. 2019, 411, 549–558. [Google Scholar] [CrossRef] [PubMed]
  92. Fernández, B.; Rodríguez-González, P.; García Alonso, J.I.; Malherbe, J.; García-Fonseca, S.; Pereiro, R.; Sanz-Medel, A. On-line double isotope dilution laser ablation inductively coupled plasma mass spectrometry for the quantitative analysis of solid materials. Anal. Chim. Acta 2014, 851, 64–71. [Google Scholar] [CrossRef]
  93. Michaliszyn, L.; Ren, T.; Röthke, A.; Rienitz, O. A new method for the SI-traceable quantification of element contents in solid samples using LA-ICP-MS. J. Anal. At. Spectrom. 2020, 35, 126–135. [Google Scholar] [CrossRef]
  94. Pollak-Kowa, E.; Telk, A.; Wieczorek, M. Evaluating solid standards for LA-ICP-MS quantitative imaging of organisms with calcareous skeletons: Accuracy, homogeneity, and laser wavelength effects. Analyst 2025, 12, 2564–2573. [Google Scholar] [CrossRef]
  95. Neff, C.; Becker, P.; Hattendorf, B.; Günther, D. LA-ICP-MS using a nitrogen plasma source. J. Anal. At. Spectrom. 2021, 36, 1750–1757. [Google Scholar] [CrossRef] [PubMed]
  96. Rua-Ibarz, A.; Van Acker, T.; Bolea-Fernandez, E.; Boccongelli, M.; Vanhaecke, F. A comparison of calibration strategies for quantitative laser ablation ICP-mass spectrometry (LA-ICP-MS) analysis of fused catalyst samples. J. Anal. At. Spectrom. 2024, 39, 888–899. [Google Scholar] [CrossRef]
  97. Pisonero, J.; Fernández, B.; Günther, D. Critical revision of GD-MS, LA-ICP-MS and SIMS as inorganic mass spectrometric techniques for direct solid analysis. J. Anal. At. Spectrom. 2009, 24, 1145–1160. [Google Scholar] [CrossRef]
  98. Pozebon, D.; Scheffler, G.L.; Dressler, V.L. Recent applications of laser ablation inductively coupled plasma mass spectrometry (LA-ICP-MS) for biological sample analysis: A follow-up review. J. Anal. At. Spectrom. 2017, 32, 89–919. [Google Scholar] [CrossRef]
  99. Yamaji, N.; Ma, J.F. Bioimaging of multiple elements by high-resolution LA-ICP-MS reveals altered distribution of mineral elements in the nodes of rice mutants. Plant J. Cell Mol. Biol. 2019, 99, 1254–1263. [Google Scholar] [CrossRef]
  100. Pereira, C.K.; Neves, V.M.; Hidrich, G.M.; Faccin, H.; Pozebon, D.; Dressler, V.L. Imaging of Elements Distribution in Rice by Laser Ablation Inductively Coupled Plasma Mass Spectrometry. Braz. J. Anal. Chem 2023, 10, 79–91. [Google Scholar] [CrossRef]
  101. Thyssen, G.M.; Keil, C.; Wolff, M.; Sperling, M.; Kadow, D.; Haase, H.; Karst, U. Bioimaging of the elemental distribution in cocoa beans by means of LA-ICP-TQMS. J. Anal. At. Spectrom. 2018, 33, 187–194. [Google Scholar] [CrossRef]
  102. Labeyrie, L.; Vallverdu, G.S.; Michau, D.; Fontagné-Dicharry, S.; Mounicou, S. Development of polymer films and biological matrices standards for selenium, mercury and endogenous elements quantitative LA-ICP MS imaging in entire rainbow trout fry. Microchem. J. 2023, 194, 109204. [Google Scholar] [CrossRef]
  103. Liu, J.; Cui, J.; Wei, X.; Li, W.; Liu, C.; Li, X.; Chen, M.; Fan, Y.; Wang, J. Investigation on selenium and mercury interactions and the distribution patterns in mice organs with LA-ICP-MS imaging. Anal. Chim. Acta 2021, 1182, 338941. [Google Scholar] [CrossRef] [PubMed]
  104. Najafabadipour, A.; Hassanzadeh, F.; Kordestani, M. Advanced deep learning models for predicting elemental concentrations in iron ore mine using XRF data: A cost-effective alternative to ICP-MS methods. Environ. Geochem. Health 2025, 47, 104. [Google Scholar] [CrossRef] [PubMed]
  105. Evans, E.H.; Pisonero, J.; Smith, C.M.; Taylor, R.N. Atomic spectrometry update: Review of advances in atomic spectrometry and related techniques. J. Anal. At. Spectrom. 2021, 36, 868–891. [Google Scholar] [CrossRef]
  106. Herwig, N.; Stephan, K.; Panne, U.; Pritzkow, W.; Vogl, J. Multi-element screening in milk and feed by SF-ICP-MS. Food Chem. 2011, 124, 1223–1230. [Google Scholar] [CrossRef]
  107. Ogra, Y. Development of miniaturized HPLC-ICP-MS for speciation of bio-trace elements. Biomed. Res. Trace Elem. 2008, 19, 34–42. [Google Scholar]
  108. Pungjunun, K.; Praphairaksit, N.; Chailapakul, O. A facile and automated microfluidic electrochemical platform for the in-field speciation analysis of inorganic arsenic. Talanta 2023, 265, 124906. [Google Scholar] [CrossRef] [PubMed]
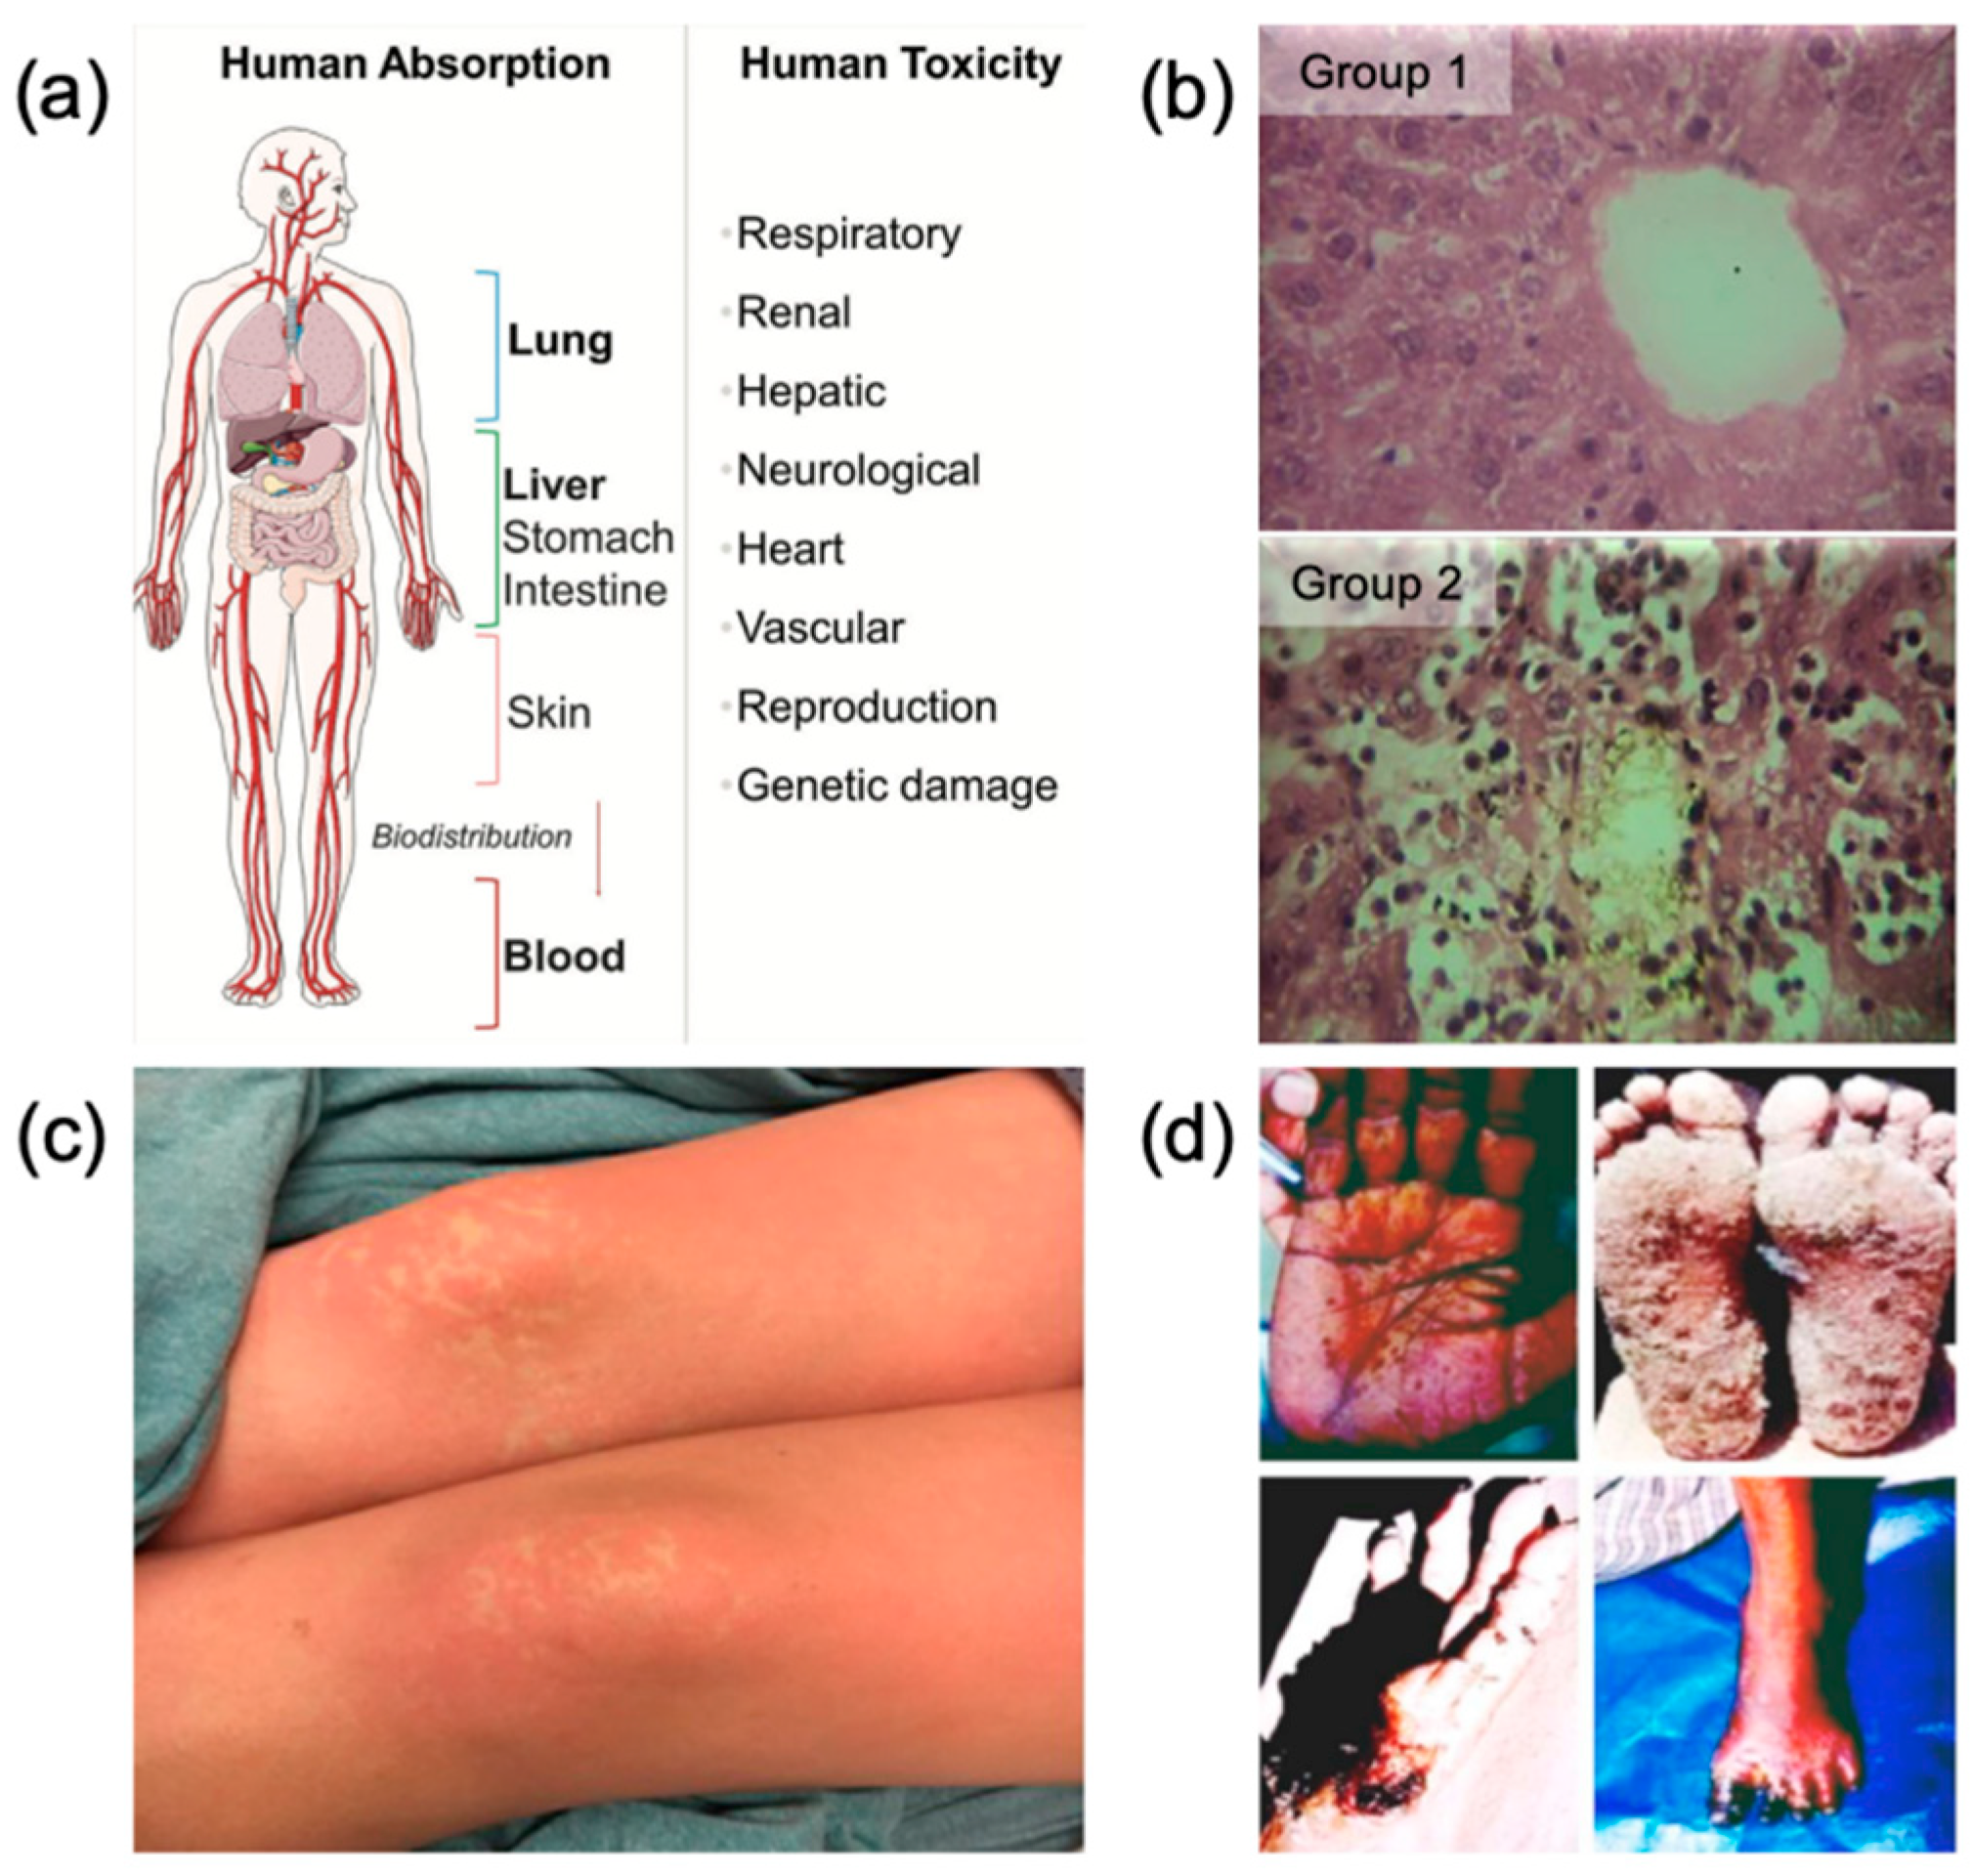
Figure 1. (a) The possible absorption and distribution pathways of Pb in the human body are demonstrated [10]. (b) Representative micrographs of liver sections (hematoxylin/eosin staining; ×400 magnification). (Group 1) Normal rats. (Group 2) CdCl2−-treated rats (1 mg/kg). Cd exposure resulted in severe lesions in the liver tissue, as evidenced by extensive necrosis, cytoarchitectural aberrations, significant cellular infiltration around the portal vein, and vascular congestion of the hepatocytes [11]. (c) Hg poisoning in a family mimicking an epidemic. The symptom shown is a rash on the lower extremities [12]. (d) As contamination can cause a variety of typical skin lesions, including hyperpigmentation, keratosis, gangrene, and skin cancer [13].
Processes 13 03361 g001
Figure 2. ICP-MS Instruments [19].
Processes 13 03361 g002
Figure 3. Schematic diagram of the key components of an ICP-MS, including the sample introduction system, the plasma torch for generating high-temperature plasma, and the mass spectrometer for ion analysis [20].
Processes 13 03361 g003
Figure 4. The ability of ICP-MS to remove interference from doubly charged ions (M++) in three modes, namely no gas, He collision cell, and low-kinetic-energy hydrogen (H2) collision cell, is shown in Figure 4. The background equivalent concentration (BEC) of the target elements in a solution containing 10 mg L−1 of interfering matrix is presented in the figure, including (1) calcium (Ca) isotopes in the strontium matrix (Sr) (e.g., 42Ca, 43Ca, and 4.4Ca), (2) scandium (Sc) in zirconium matrix (Zr), and (3) zinc (Zn) isotopes in barium matrix (Ba) (e.g., 66Zn, 67Zn, and 68Zn) [36].
Processes 13 03361 g004
Figure 5. Electrothermal evaporator system main components: A: Halogen lamp, B: glass chamber, C: evaporation extraction tube, D: bulb recessed chamber (with sample holder), (V1, V2) solenoid valve, (W) waste outlet, (CV1, CV2) valve control signal, (CT) temperature sensor signal, and (PPL) power supply wiring [28].
Processes 13 03361 g005
Figure 6. Standardized flow charts for ICP-MS analysis to eliminate interferences, with modular design to cover the key control points of the whole process.
Processes 13 03361 g006
Figure 7. As distribution in cereals [75].
Processes 13 03361 g007
Figure 8. (a) Quantitative imaging of As and Pb in rice internodes was performed. Concentrations of each element (in w/v ppm, i.e., ng/μL) were calculated based on the average signal intensity of the standard in the cryogenic compound (from a line in c[Na]) and the original sample volume at the ablation point [99]. (b) Imaging maps of the elemental distribution of As and Pb in white, parboiled, and whole (brown) rice were generated based on the analyte concentrations on the surface of the rice grains. LA-ICP-MS was used to strip the rice grains in three consecutive layers, corresponding to the layers of material removed by the 1st, 2nd, and 3rd ablations, respectively [100].
Processes 13 03361 g008
Figure 9. LA-ICP-MS distribution of 208Pb in a longitudinal section of a high-Pb-content wheat grain along a crease; the color scale represents the signal intensity. The optical image in the upper left identifies the visible structures in the longitudinal section, including the grain tissues PE (periphery), AL (albumen layer), SE (starch endosperm), SL (glumes), and SC (seed coat) and the tissues VB (vascular bundles), PS (pigmented layer), and NP (nacreous protuberances) in the crease region (CR) [51].
Processes 13 03361 g009
Figure 10. Light microscope image of a polished cocoa bean sample (upper left) and the elemental distributions of 208Pb, 110Cd, 111Cd, 112Cd, 113Cd, and 114Cd obtained by LA-ICP-MS using oxygen as the pool gas. Upper samples marked with * are endosperms; hypocotyl and radicle regions are marked with # [101].
Processes 13 03361 g010
Figure 11. Quantitative distribution of 202Hg in 8 μm sections of two rainbow trout fry (based on different aquafeed feeding strategies). Left: fry 1 (direct Se/Hg supplementation); right: fry 2 (Se/Hg delivery via parental feeding). All data were normalized by 72Ge signal, and the top is a somatic view photo of the fry before slicing [102].
Processes 13 03361 g011
Figure 12. Localized LA-ICP-MS distribution of mercury in mouse brain, kidney, liver, and spleen (10 mm sections). Samples were treated with 24 h exposure: control | 55 mM iHg (inorganic mercury) | 55 mM iHg + Se | 55 mM MeHg (methylmercury) | 55 mM MeHg + Se | 55 mM Se (selenium-alone control) [103].
Processes 13 03361 g012
Table 1. Summary of ICP-MS Sample Preparation Techniques for Food Analysis.
CategorizationTechnical NameApplicable Samples/ScenariosAdvantagesLimitationsReferences
Conventional sample preparation processDry ashingHigh-organic samples (biological tissues and plant materials)Minimal reagent use; low contamination riskLoss of volatile elements; analyte adsorption on crucible surfaces-
Acid digestionComplex matrices (environmental solids and food)Handles organic/inorganic components, short time; less volatile lossRisk of contamination; matrix effects from residual salts/acids may require dilution-
Improved methods
Eco-friendly optimizationNADES (natural deep-eutectic solvents)–ultrasonic/microwave-assisted extractionToxic elements (As, Cd, and Pb) in food/plant samplesBiodegradable; nitric acid-free; high recovery; low environmental burdenRequires water content optimization to reduce viscosity[21]
Microwave–ultraviolet degradation (MW-UV)Cereals (rice and wheat)Reduced reagent toxicity; low residual carbon/acidity; digestate directly analyzableRequires controlled radiation conditions[22]
Enzymatic digestionFood matricesAvoids strong acids, reduces waste/volatile loss; aligns with atom economyEnzyme activity sensitive to pH/temperature[23]
Complex matrix optimizationEnzyme-ultrasonication-dilutionHigh-fat (cooking oil); high-fiber (spinach)Prevents nanoparticle dissolution/agglomeration; reduces salt/protein/fat interferenceDilution may reduce sensitivity; requires optimization[24]
Hot water extraction–As speciation preservationSeafood, cereals, and vegetablesPreserves As speciation; As(III) recovery up to 93–97%Requires precise temperature/time control[25]
Enzyme-extraction-graded filtrationWheat, flour, and high-fat samples (butter cookies)Separates micron/submicron particles; ethanol pretreatment prevents membrane foulingMulti-step process; complex handling[26]
Interference mitigationNon-instrumental methodsDilutionUniversalSimple, rapid matrix effect reductionReduces target sensitivity; may introduce impurities-
Microextraction (LPME/SPME/MSPE)Biological samplesEfficient matrix removal; automated operationRequires optimized adsorbents[27]
Introduction techniquesElectrothermal vaporization (ETV)Calcium phosphate-based bio-matricesAvoids co-evaporation; reduces memory effectsRequires optimized carrier gas flow/heating program[28]
Chemical vapor generation (CVG)Hg and As in complex matricesEliminates spectral/non-spectral interferencesLimited to volatile elements[29]
Membrane desolvation (MD)Vegetable oilsReduces interferences under non-thermal conditions; enhances solvent recoveryMembrane stability critical[30]
Instrumental improvementsCold plasma–collision cell (KED)High-salt/organic matricesDirect interference elimination without mathematical correctionRequires high RF power[31]
Gas modificationGaseous metal compoundsEliminates polyatomic/non-reactive gas interferencesRequires gas exchange device (GED)[32]
High-resolution ICP-MS (HR-ICP-MS)Complex biological matrices (e.g., serum)Interference-free quantification combined with ultrafiltrationHigh instrument cost[33]
Emerging techniquesTandem ICP-MSUltra-trace analysis (LOD: ng/L level)High efficiency/accuracy; ideal for nanomaterial quantificationRequires optimization of reaction gases[34]
Table 2. Comparison of commonly used elimination techniques for ICP-MS and their impact on recoveries.
Digestion Reagent CombinationTypical Recovery Target RangePotential Issues Affecting RecoveryReference
HNO3 (pure or primary)85–115%Low recovery of refractory elements; incomplete digestion of some species (e.g., Cr3+)[35]
HNO3 + H2O285–115%Impurities in H2O2 may cause contamination; vigorous reaction: risk of splattering/loss
HNO3 + HCl (Aqua Regia)80–110%Cl interference: severe polyatomic interferences (e.g., ArCl+ interferes with 75As); insoluble chloride precipitation: Ag+, Pb2+ (PbCl2), and Hg+ (Hg2Cl2); enhanced matrix effects from residual Cl
HNO3 + HCl + HF (Inverse Aqua Regia)75–110%F/Cl interference; high corrosivity (requires specialized vessels); insoluble fluoride precipitation; residual HF damages instrumentation and is hazardous
Table 3. Speciation, concentration ranges, analytical performance, and occurrence of As in food categories.
Morphology of AsFood CategoriesConcentration Range (mg/kg)Detection Limit (mg/kg)Recovery Rate (%)Key Findings and Method PerformanceReferences
Total AsSeafood>100.05 (ICP-MS)92–105Exceeds safety limits; validated via CRM DORM-4[42]
Algae5–120 *0.03 (ICP-MS)85–98* Eutrophic conditions increase levels by 3–5×; CRM NIES-19 verified[44]
iAsAlgae0.5–350.01 (HPLC-ICP-MS)88–102Converts inorganic to organic forms; spike recovery: 94 ± 6%[44]
Cereals0.02–0.350.005 (HPLC-ICP-MS)90–104Dominant in rice (60–80% of total As); inter-lab RSD <15%[43]
As5+Seafood<0.10.008 (HPLC-ICP-MS)84–97Minor oxidation state; co-elution resolved via anion-exchange[43]
AsBSeafood1–850.005 (HPLC-ICP-MS)95–108>90% total As; quantified using CRM BCR-627[43]
DMASeafood<0.050.003 (HPLC-ICP-MS)89–101Trace levels; separation confirmed with ESI-MS[43]
Cereals0.01–0.200.004 (HPLC-ICP-MS)91–106Major form in wheat (30–50% total As); precision RSD 8.2%[46]
MMACereals<0.010.002 (HPLC-ICP-MS)86–99Rarely detected; LOD verified via NIST SRM 1568b[46]
* Concentration under eutrophic conditions.
Table 4. Speciation, sources, contamination characteristics, and analytical performance of Pb in foods.
Morphology of PbFood CategoriesSources/SitesConcentration Range (mg/kg)Detection Limit (mg/kg)Recovery Rate (%)Pollution Mechanisms and RisksReference
Total PbPlant-based foodCrops0.15–2.3 Limit exceedance: 33%0.002 (ICP-MS)88–102Soil adsorption predominates, with 33% of wheat Pb exceeding the limit in industrial areas (exceeding the Chinese limit)[51]
Animal productsMeat/seafood0.02–0.450.001 (ICP-MS)91–106Enrichment through the food chain with high bio-availability
Particulate PbCerealsWheat bran1.8–12.5 (Industrial = 3.5×
transport zones)
0.005 (μ-XRF: micro-X-ray fluorescence)85–98Atmospheric deposition of PbSO4 particles directly adsorbed, accounting for 56% of the bran lead source
Soluble Pb2+CerealsWheat flour0.05–0.820.003 (AAS)89–104Highly efficient transfer of foliar absorption (leaf→seed); high water solubility and bio-availability
Soil-bound PbCereal rootsWheat root0.8–3.10.01 (XANES: X-ray absorption near-edge structure)82–96Root uptake less efficient than atmospheric deposition pathway
Organic PbAll foods<0.001 (TEL: Tetraethyl lead)0.0001 (GC-MS)75–88Low natural presence and low pollution contribution
Table 5. Speciation, distribution, risk characterization, and analytical performance of Cd in foods.
Morphology of CdFood CategoriesConcentration RangeLOD (mg/kg)Recovery (%)References
Non-residual Cd (exchange + carbonate bound)Marine sediment12–85 mg/kg
80–90% of total Cd
0.05 (BCR-SEP: BCR–sequential extraction protocol)92–105[56]
Cd-MTsAnimal offal0.5–8.7 mg/kg
Liver/kidney enrichment
0.01 (HPLC-ICP-MS)85–98[57]
Globulin/Albumin-bound CdRice seedBinding capacity: globulin > albumin > glutamate > alcohol-soluble proteins0.003 (SEC-ICP-MS: size exclusion chromatography–ICP-MS)88–102[59]
Gluten-bound CdRice endosperm0.15–2.1 mg/kg
Primary residue form
0.002 (SEC-ICP-MS)90–104[51]
Free Cd2+Plant-based food0.01–0.8 mg/kg0.001 (DPASV: differential pulse anodic stripping voltammetry)94–108[55]
Particulate Cd (CdS/CdO)Contaminated area food0.3–6.5 mg/kg0.02 (μ-XRF)78–92[55]
Table 6. Speciation, distribution, detection performance, and risk characterization of Hg in foods.
Morphology of HgFood CategoriesSources/MechanismsConcentration RangeLODRecovery (%)References
CH3Hg+Fish/aquacultureFood chain bio-accumulation0.1–1.8 mg/kg
>80% total Hg
0.003 (GC-ICP-MS: gas chromatography-ICP-MS)92–107[63]
Hg2+Rice/sedimentContaminated soil migration0.02–0.35 mg/kg
<20% total Hg
0.005 (CV-AAS: cold vapor–atomic absorption spectrometry)85–98[65]
PhHg+Food from industrially contaminated areasPesticide/fungicide residues<0.01 mg/kg0.001 (HPLC-CV-AFS: HPLC–cold vapor–atomic fluorescence spectrometry)75–90[64]
Hg0Processed foodEquipment contamination<0.001 mg/kg0.0003 (Au-amalgamation CV-AAS)65–82[66]
Heterogeneous accumulation of HgAlgaeSingle-cell uptake differencesMacro-algae: 0.05–0.8 mg/kg
Micro-algae: 0.2–1.5 mg/kg
0.002 (CV-AAS)88–103[66]
Table 7. Levels of 10 heavy metals in rural water, well water, and urban water (unit: μg/L).
ElementsRural WaterWell WaterUrban WaterBS 6920 LimitReference
Al1.725 ± 0.3602.456 ± 0.1402.247 ± 0.260200.00[85]
Cr1.854 ± 0.0100.092 ± 0.0102.006 ± 0.01850.00
Mn<LSL16.711 ± 0.0080.156 ± 0.08050.00
Fe<LSL1.608 ± 0.2001.766 ± 0.320200.00
Ni<LSL0.570 ± 0.0040.857 ± 0.07120.00
Se<LSL0.283 ± 0.1200.393 ± 0.13010.00
Cd<LSL0.592 ± 0.007<LSL5.00
Sb0.967 ± 0.0153.082 ± 0.0141.306 ± 0.0195.00
Ba28.790 ± 0.008226.597 ± 0.001122.120 ± 0.0121000.00
Pb0.290 ± 0.16018.732 ± 0.3100.897 ± 0.06125.00
Table 8. Research Overview of ICP-MS Application for Heavy Metals Detection in Foods.
Food CategoriesSpecific Foods/SamplesMain Metal Elements of ConcernReferences
SeafoodFish, shellfish, and shrimp from the four seas of Turkey (13 species)Pb, Cd, Hg, As[73]
SturgeonPb, Cd, Cu, Fe, Se, Hg[74]
CerealsBarley, oats, millet, corn, sorghum, Job’s tearsPb, Cd, Hg, As[75]
Oat milkPb, Cd, As[76]
Diverse milletPb, Cd, Hg, As, Al[78]
Corn seedling (hydroponic experiment)Pb, Cd, As[77]
DairyFresh milk (South Jakarta traditional farm)Pb, Cd, Hg, As[80]
Infant formula (multi-brand)Pb, Cd, Hg, As[81,82]
Potable waterBottled drinking waterHg[84]
Rural waterPb, As[85]
Well waterPb
VegetablesSpinachPb, Cd[86]
Carrot-
Potato-
HoneyTurkish honey-[87]
Italian honeyCr, As, Ni[88]
Disclaimer/Publisher’s Note: The statements, opinions and data contained in all publications are solely those of the individual author(s) and contributor(s) and not of MDPI and/or the editor(s). MDPI and/or the editor(s) disclaim responsibility for any injury to people or property resulting from any ideas, methods, instructions or products referred to in the content.