Article

Extraction pH Controls Assessed Biotoxicity of Chlorination Disinfection Byproducts from Amphoteric Precursors

1
School of Urban Construction, Changzhou University, Changzhou 213164, China
2
Department of Architectural and Environmental Engineering, Changzhou University Huaide College, Jingjiang 214500, China
3
Nanjing Institute of Environmental Science, Ministry of Ecology and Environment of the People’s Republic of China, Nanjing 210033, China
4
School of Resources and Environmental Engineering, Jiangsu University of Technology, Changzhou 213001, China
5
State Key Laboratory of Water Pollution Control and Green Resource Recycling, School of the Environment, Nanjing University, Nanjing 210023, China
*
Authors to whom correspondence should be addressed.
Processes 2025, 13(10), 3355; https://doi.org/10.3390/pr13103355
Submission received: 17 September 2025 / Revised: 14 October 2025 / Accepted: 17 October 2025 / Published: 20 October 2025
(This article belongs to the Section Biological Processes and Systems)

Abstract

Effect-based toxicity assessments are crucial for evaluating the risks of disinfection byproducts (DBPs), particularly unknown species, generated during drinking water chlorination. However, the accuracy of this approach is highly dependent on unbiased sample extraction. Conventional methods often employ single, low-pH extraction, which may fail to recover pH-sensitive amphoteric DBPs derived from amphoteric precursors (e.g., nitrogenous compounds). This study investigated how extraction pH affects the measured biotoxicity of DBPs formed from three model precursors: biopterin (Bip), cytosine (Cyt), and tryptophan (Trp). Under excess chlorine conditions, all three precursors degraded rapidly. The formation of aliphatic DBPs followed the order Trp > Cyt > Bip, and the maximum toxicity of the non-volatile extracts, assessed via a Vibrio fischeri bioassay, followed the reverse order: Bip > Trp > Cyt. This toxicity profile was significantly influenced by extraction pH, with maximum toxicity observed for Bip at around pH 4.0, under weakly acidic conditions for Trp, and under neutral to alkaline conditions for Cyt. For all precursors, the total organic carbon concentration remained constant throughout chlorination, indicating negligible mineralization and the predominant formation of non-aliphatic, likely heteroaromatic, products. These findings demonstrate that conventional extractions at a single low pH can lead to the incomplete recovery of toxic DBPs from amphoteric precursors. Therefore, pH-optimized extraction protocols are necessary for a more accurate risk assessment of chlorinated drinking water.

1. Introduction

The disinfection of drinking water has been pivotal in controlling waterborne infectious diseases and is widely recognized as one of the greatest public health achievements of the 20th century [1]. However, chemical reactions between disinfectants (especially freely available chlorine, FAC) and dissolved organic matter (DOM) inevitably generate complex mixtures of disinfection byproducts (DBPs) [2,3]. Epidemiological studies have repeatedly linked long-term exposure to chlorinated drinking water with an elevated risk of bladder cancer [4,5]. Furthermore, there is also evidence suggesting that exposure to DBPs is associated with other cancers (such as liver cancer and colon cancer), as well as acute, reproductive, and developmental toxicity [6,7].
To date, more than 700 DBPs have been identified across disinfectants and source water conditions, yet these species typically account for only a fraction of the total organic halogen measured in finished waters, leaving >50% of halogenated organic matter unresolved [8]. In most countries, trihalomethanes (THMs) and haloacetic acids (HAAs), which were among the earliest discovered carbonaceous DBPs (C-DBPs), are tightly regulated under the drinking water sanitation standards [9,10]. However, these regulated DBPs cannot fully account for the health risks observed in epidemiological studies; therefore, the unidentified portion of DBPs is generally considered to significantly contribute to overall toxicity [11]. Importantly, many unregulated nitrogenous DBPs (N-DBPs) have been found to display higher orders of magnitude for cytotoxicity and genotoxicity than regulated C-DBPs [12], and it is a critical concern that regulatory strategies centered on a small set of C-DBP surrogates may fail to capture the true toxicological burden of drinking water, potentially leading to inadequate public-health protection.
To address this concern, studies on DBPs increasingly complement targeted and untargeted chemical analyses with effect-based toxicity assessments of disinfected waters [13,14]. In this framework, DBP mixtures are operationally enriched from water (e.g., by liquid–liquid extraction or solid-phase extraction) into bioassay-compatible media, and the integrated biological activity of the concentrates is quantified using in vitro assays [13,14]. Unlike the focus on limited DBPs, effect-based assays provide a more realistic reflection of actual exposure scenarios. However, their interpretability critically depends on the sample preparation process that must comprehensively and unbiasedly capture all relevant toxic DBPs in disinfected water.
In practice, widely used extraction protocols may introduce systematic bias. Typically, the pH of the tested water samples is usually adjusted to an extremely low pH value (typically pH < 2, sometimes even pH < 0.5) prior to extraction, which is appropriate for acidic DBPs [15,16]. Yet numerous important precursors of harmful N-DBPs in source waters (e.g., amino acids, nucleobases, pterins) exhibit amphoteric properties, possessing both acidic and basic groups [17,18,19,20]. Transformation products (TPs) generated during disinfection may frequently retain these ionizable properties. Under strongly acidic conditions, while acidic groups are neutralized, basic groups within the molecule (such as amino groups, –NH2) undergo strong protonation, transforming into cationic forms (–NH3+). These positively charged cations exhibit high water solubility, preventing their effective partitioning into the organic solvent phase and thereby leading to their exclusion during the extraction process. Consequently, the total toxicity of drinking water rich in these amphoteric DBPs may be underestimated. Nonetheless, while the amphoteric precursors are ubiquitous in source water, especially algae-laden source water [21], the systematic evaluation of extraction pH on the assessed toxicity of their resulting DBP mixtures remains a critical, underexplored area.
In this study, we selected three naturally occurring and structurally representative nitrogenous precursors of biopterin (a pterin cofactor), cytosine (a pyrimidine nucleobase), and tryptophan (an aromatic amino acid) to investigate the influence of extraction pH on the assessed toxicity of DBPs generated during chlorination across distinct amphoteric chemotypes. Under simulated drinking water chlorination conditions, we (i) measured the chlorination behavior and aliphatic DBP formation for each precursor; (ii) performed liquid–liquid extraction of DBPs from chlorinated water across a series of pH gradients; and (iii) assessed the biotoxicity of each extract using Vibrio fischeri bioassays, thereby elucidating how extraction pH influenced toxicity estimation for DBPs derived from amphoteric precursors. Collectively, the findings of this study will provide critical evidence to rectify systematic biases in current toxicity-assessment protocols, advance the establishment of a more comprehensive framework for drinking water risk assessment, and ultimately promote the development of future regulatory standards.

2. Materials and Methods

2.1. Chemicals and Reagents

All the chemicals and reagents were of at least analytical purity. Bip was obtained from Beijing HWRK Chem Co., Ltd. (Beijing, China), Cyt and Trp were both purchased from Shanghai Aladdin Biochemical Technology Co., Ltd. (Shanghai, China) Concentrated sulfuric acid (H2SO4) and sodium chloride (NaCl) were from Sinopharm Chemical Reagent Co., Ltd. (Shanghai, China) Sodium hypochlorite (NaClO) solution (~5% w/v available chlorine), anhydrous sodium sulfate (Na2SO4), sodium arsenite (NaAsO2), sodium hydroxide (NaOH), disodium hydrogen phosphate (Na2HPO4), sodium dihydrogen phosphate (NaH2PO4), methylamine aqueous solution, 1,3,5-trimethoxybenzene (TMB), acetonitrile, formic acid, methyl tert-butyl ether (MTBE), and the calibration mix of HAAs with monochloro-acetic acids (MCAA), dichloro-acetic acids (DCAA), and trichloro-acetic acids (TCAA) were all purchased from Sigma-Aldrich (St. Louis, MO, USA). The other aliphatic DBPs standards, including chloroform (TCM), chloralhydrate (CH), HKs (including 1,1-dichloro-2-propanone—DCP and 1,1,1-trichloroacetone—TCP), HANs (including monochloro-, dichloro-, and trichloro-acetonitrile—MCAN, DCAN, and TCAN), HNMs (including monochloro- and dichloro-nitromethane—MCNM and DCNM) were purchased from Bailingwei Technology Co., Ltd. (Shanghai, China) Solutions in the experiments were all prepared with ultrapure water produced by a Millipore Milli-Q Water Purification System (Bedford, MA, USA).

2.2. Experimental Procedures

2.2.1. Evaluation of Chlorination Kinetics

Chlorination experiments were conducted on Bip, Cyt, and Trp using 100 mL solutions containing 20 μM of each precursor. The pH was maintained at 7.0 using a 5 mM phosphate buffer (PBS, a mixture of Na2HPO4 and NaH2PO4). In order to simulate a practical drinking water chlorination scenario, in which the disinfectant is present in excess over the precursors to ensure effective disinfection [22], the concentration of chlorine was adjusted to 400 μM by adding NaClO stock solution. During the whole experimental period, the solutions were kept in the dark and stirred at a rate of 200 r/min at room temperature (approximately 25 °C). At specific reaction times, 1.5 mL samples were transferred into 2 mL amber vials containing 150 μL of a chlorine quenching agent, TMB (100 mM) [20]. Subsequently, the residual concentrations of the three precursors were analyzed to perform kinetic fitting. The residual concentrations of FAC were analyzed by the DPD method [23].

2.2.2. Quantitation of Aliphatic DBPs

For the quantification of aliphatic DBPs resulting from the chlorination of Bip, Cyt, and Trp, 250 mL solutions of each precursor (20 μM, pH 7.0) were prepared and spiked with 400 μM chlorine. To prevent photolytic effects, reaction bottles were wrapped in tinfoil and continuously stirred. Samples (1.5 mL) were withdrawn at reaction times of 9, 24, and 72 h, transferred into amber vials, and immediately quenched with 10 mM TMB for HAAs analysis. Concurrently, 50 mL of each sample without quenching was withdrawn for the analysis of other aliphatic DBPs (TCM, CH, HKs, HANs, and HNMs) following U.S. EPA Method 551.1 [24].
Additionally, an additional 20 mL aliquot of the chlorinated samples was reserved for total organic carbon (TOC) determination (Multi N/C 3100 analyzer, Analytik Jena, Jena, Germany). The residual FAC was quenched with NaAsO2—a mildly reducing, inorganic quencher—prior to analysis [25]. TMB, an organic quencher, was intentionally avoided in this step because the introduction of organic carbon will interfere with the TOC measurement.

2.2.3. Assessment of Biotoxicity

Each precursor solution (20 μM) was chlorinated under dark conditions, with 400 μM chlorine at pH 7.0 and ~25 °C. After reaction intervals of 9, 24, and 72 h, an appropriate amount of solution was removed and divided into six 50 mL portions. The pH of these portions was individually adjusted to 2.0, 3.0, 4.0, 5.0, 6.0, and 8.0 using H2SO4 and NaOH, respectively. Another 50 mL aliquot was taken out without adjustment to maintain pH 7.0. Subsequently, 2.5 mL MTBE was added to each portion. After vigorous shaking and a standing time of 30 min, 1.5 mL of the upper MTBE layer was extracted from each sample bottle and transferred into a 10 mL tube. The MTBE solvent was then evaporated under a nitrogen stream at 50 °C. The dried DBPs were redissolved in 3 mL of phosphate buffer (pH 7.0, 5 mM) and filtered through a 0.22 μm polyether sulfone membrane. The resulting filtrate represented a 10-fold concentrated solution of DBPs from the chlorinated samples, which was then used for biotoxicity testing. Notably, to prevent toxicity interference from residual chlorine and its quenching agents, and to minimize the impact of the quenching agent on nitrogen-containing TPs, the liquid–liquid extraction was performed immediately on the chlorinated solutions without the addition of any quencher [20]. For control measurements, unchlorinated solutions of Bip, Cyt, and Trp (200 μM) along with 5 mM phosphate buffer were used. Overall, the extraction pH range tested was from 2.0 to 8.0, which allows for the systematic evaluation of how toxicity changes as the precursors and their transformation products shift from cationic to neutral or weakly alkaline forms. Strongly alkaline extraction conditions (pH > 8.0) were not considered in this study, because many halogenated DBPs are unstable under alkaline conditions and can undergo hydrolysis or dehalogenation through base-catalyzed reactions [26]. Testing at higher pH values could introduce new bias from DBP degradation, which would confound the interpretation of the biotoxicity results.
In the cases of chlorination kinetics evaluation and DBP quantification, the experiments were conducted in duplicate. For biotoxicity assessment, all samples were analyzed in triplicate. The schematic diagram of the experimental procedures of this study is displayed in Figure S1.

2.3. Analytical Methods

2.3.1. Analysis of Residual Precursors

The three precursors, Bip, Cyt, and Trp, were analyzed via a High-Performance Liquid Chromatography (HPLC) system (Agilent 1260, Agilent Technologies, Santa Clara, CA, USA). A diode array detector (DAD, Agilent 1290 Infinity II G7117B, Agilent Technologies, Santa Clara, CA, USA) was connected to detect the UV absorption signals of the precursors. The separation was achieved by a Poroshell 120 EC-C18 separation column (4.6 mm × 150 mm, 4 μm, Agilent, Santa Clara, CA, USA). The mobile phases consisted of acetonitrile and ultrapure water (with 0.2% formic acid). The flow was delivered in a gradient mode at a rate of 1 mL/min: from 5% acetonitrile + 95% water to 98% acetonitrile + 2% water over 6 min, held at 98% acetonitrile + 2% water from 6 to 12 min, adjusted back to 5% acetonitrile + 95% water at 12.1 min, and then held constant at 5% acetonitrile + 95% water until 18 min. The injection volume was set at 10 μL, and the column temperature was maintained at 35 °C. The detection wavelengths were specifically set at 275 nm for Bip, 260 nm for Cyt, and 280 nm for Trp.

2.3.2. Analysis of Aliphatic DBPs

For HAA quantification, samples were directly injected into an Agilent 1290 Infinity HPLC system linked to an AB SCIEX Qtrap 5500 triple quadrupole mass spectrometry system (AB Sciex, Framingham, MA, USA), following our previously established methods [10]. HAAs were separated using a Dionex IonPac AS16 ion exchange column (2 mm × 250 mm, Thermo, Sunnyvale, CA, USA). The mobile phase comprised a 0.7 M methylamine aqueous solution and acetonitrile in a 30:70 volume ratio, at a flow rate of 300 µL/min, employing isocratic elution at a column temperature of 30 °C. The injection volume was 10 µL. Mass spectrometric analysis utilized an Electrospray Ionization (ESI) source in negative ion mode, with settings including gas1 and gas2 at 40 psi, curtain gas at 30 psi, ion source temperature at 450 °C, and ion spray voltage at −4500 V.
Volatile DBPs were extracted and analyzed following U.S. EPA Method 551.1 [24], using a single quadrupole gas chromatography–mass spectrometry system (GC-MS, Trace GC Ultra-ISQ, Thermo, Waltham, MA, USA). The extraction process entailed: (i) adding 3 mL of MTBE, containing 100 µg/L of internal standard BFB, to a 50 mL water sample in a 60 mL amber glass bottle; (ii) adding 20 g of anhydrous Na2SO4, capping the bottle with a polytetrafluoroethylene-lined cap, and shaking vigorously for 2 min; (iii) allowing the sample to settle for 30 min before extracting 1 mL of the upper organic layer into a small vial. Samples were stored at −20 °C prior to analysis. The GC-MS parameters included an ion source operating on electron ionization (EI) at 70 eV, an ion source temperature of 280 °C, and scanning in selected ion monitoring (SIM) mode. The injection volume was 1 µL in split mode (12:1), with an injector temperature of 200 °C. The chromatographic separation was performed on a DB-5MS UI column (30 m × 0.25 mm I.D., 0.25 µm film thickness, Agilent, Waltham, MA, USA) using helium as the carrier gas at a flow rate of 0.8 mL/min, following a temperature program of holding at 35 °C for 5 min, then ramping at 10 °C/min to 100 °C, followed by a ramp at 40 °C/min to 280 °C and holding for 2 min.

2.3.3. Analysis of Biotoxicity

The biotoxicity of the samples was assessed using a Microtox® M500 analyzer (Morden Water, York, UK) based on the inhibition effects on luminescent bacteria, Vibrio fischeri, which is a commonly used, sensitive test organism for assessing the toxic effects of chlorination byproducts [27,28]. Analysis was conducted using the SOLO 81.9% toxicity screening mode (Microtox-Omni 4.2 software). Initially, lyophilized Vibrio fischeri was resuscitated by incubating it in a resuscitation solution at 5 °C for 10 min. Then, the bacteria were exposed to the test samples for 15 min. The inhibitory effects on bacterial luminescence were then quantitatively measured and recorded using Microtox-Omni 4.2 software. A 2% NaCl solution served as the negative control for the experiments.

3. Results and Discussions

3.1. Chlorination Kinetics of Three Amphoteric Precursors

The molecular structures and acid–base dissociation constants (pKa) of Bip, Cyt, and Trp are summarized in Table 1. Under oxidant-excess (pseudo-first-order) chlorination, concentration–time profiles (Figure 1a) exhibited rapid decay for all three precursors, with t1/2 < 0.5 min for Trp, 0.5–1 min for Bip, and 3–5 min for Cyt; after 20 min, ≤8% of each precursor remained. Pseudo–first-order fits (Figure 1b) yielded observed rate constants (kobs) of 3.085, 0.676, and 0.131 min−1 for Trp, Bip, and Cyt, respectively, indicating markedly greater apparent reactivity of Trp toward FAC relative to Bip and Cyt. Collectively, these kinetics data demonstrate that Trp, Bip, and Cyt underwent facile transformation during drinking water chlorination, implicating them as effective precursors for DBP formation.

3.2. DBP Formation During Chlorination of Three Amphoteric Precursors

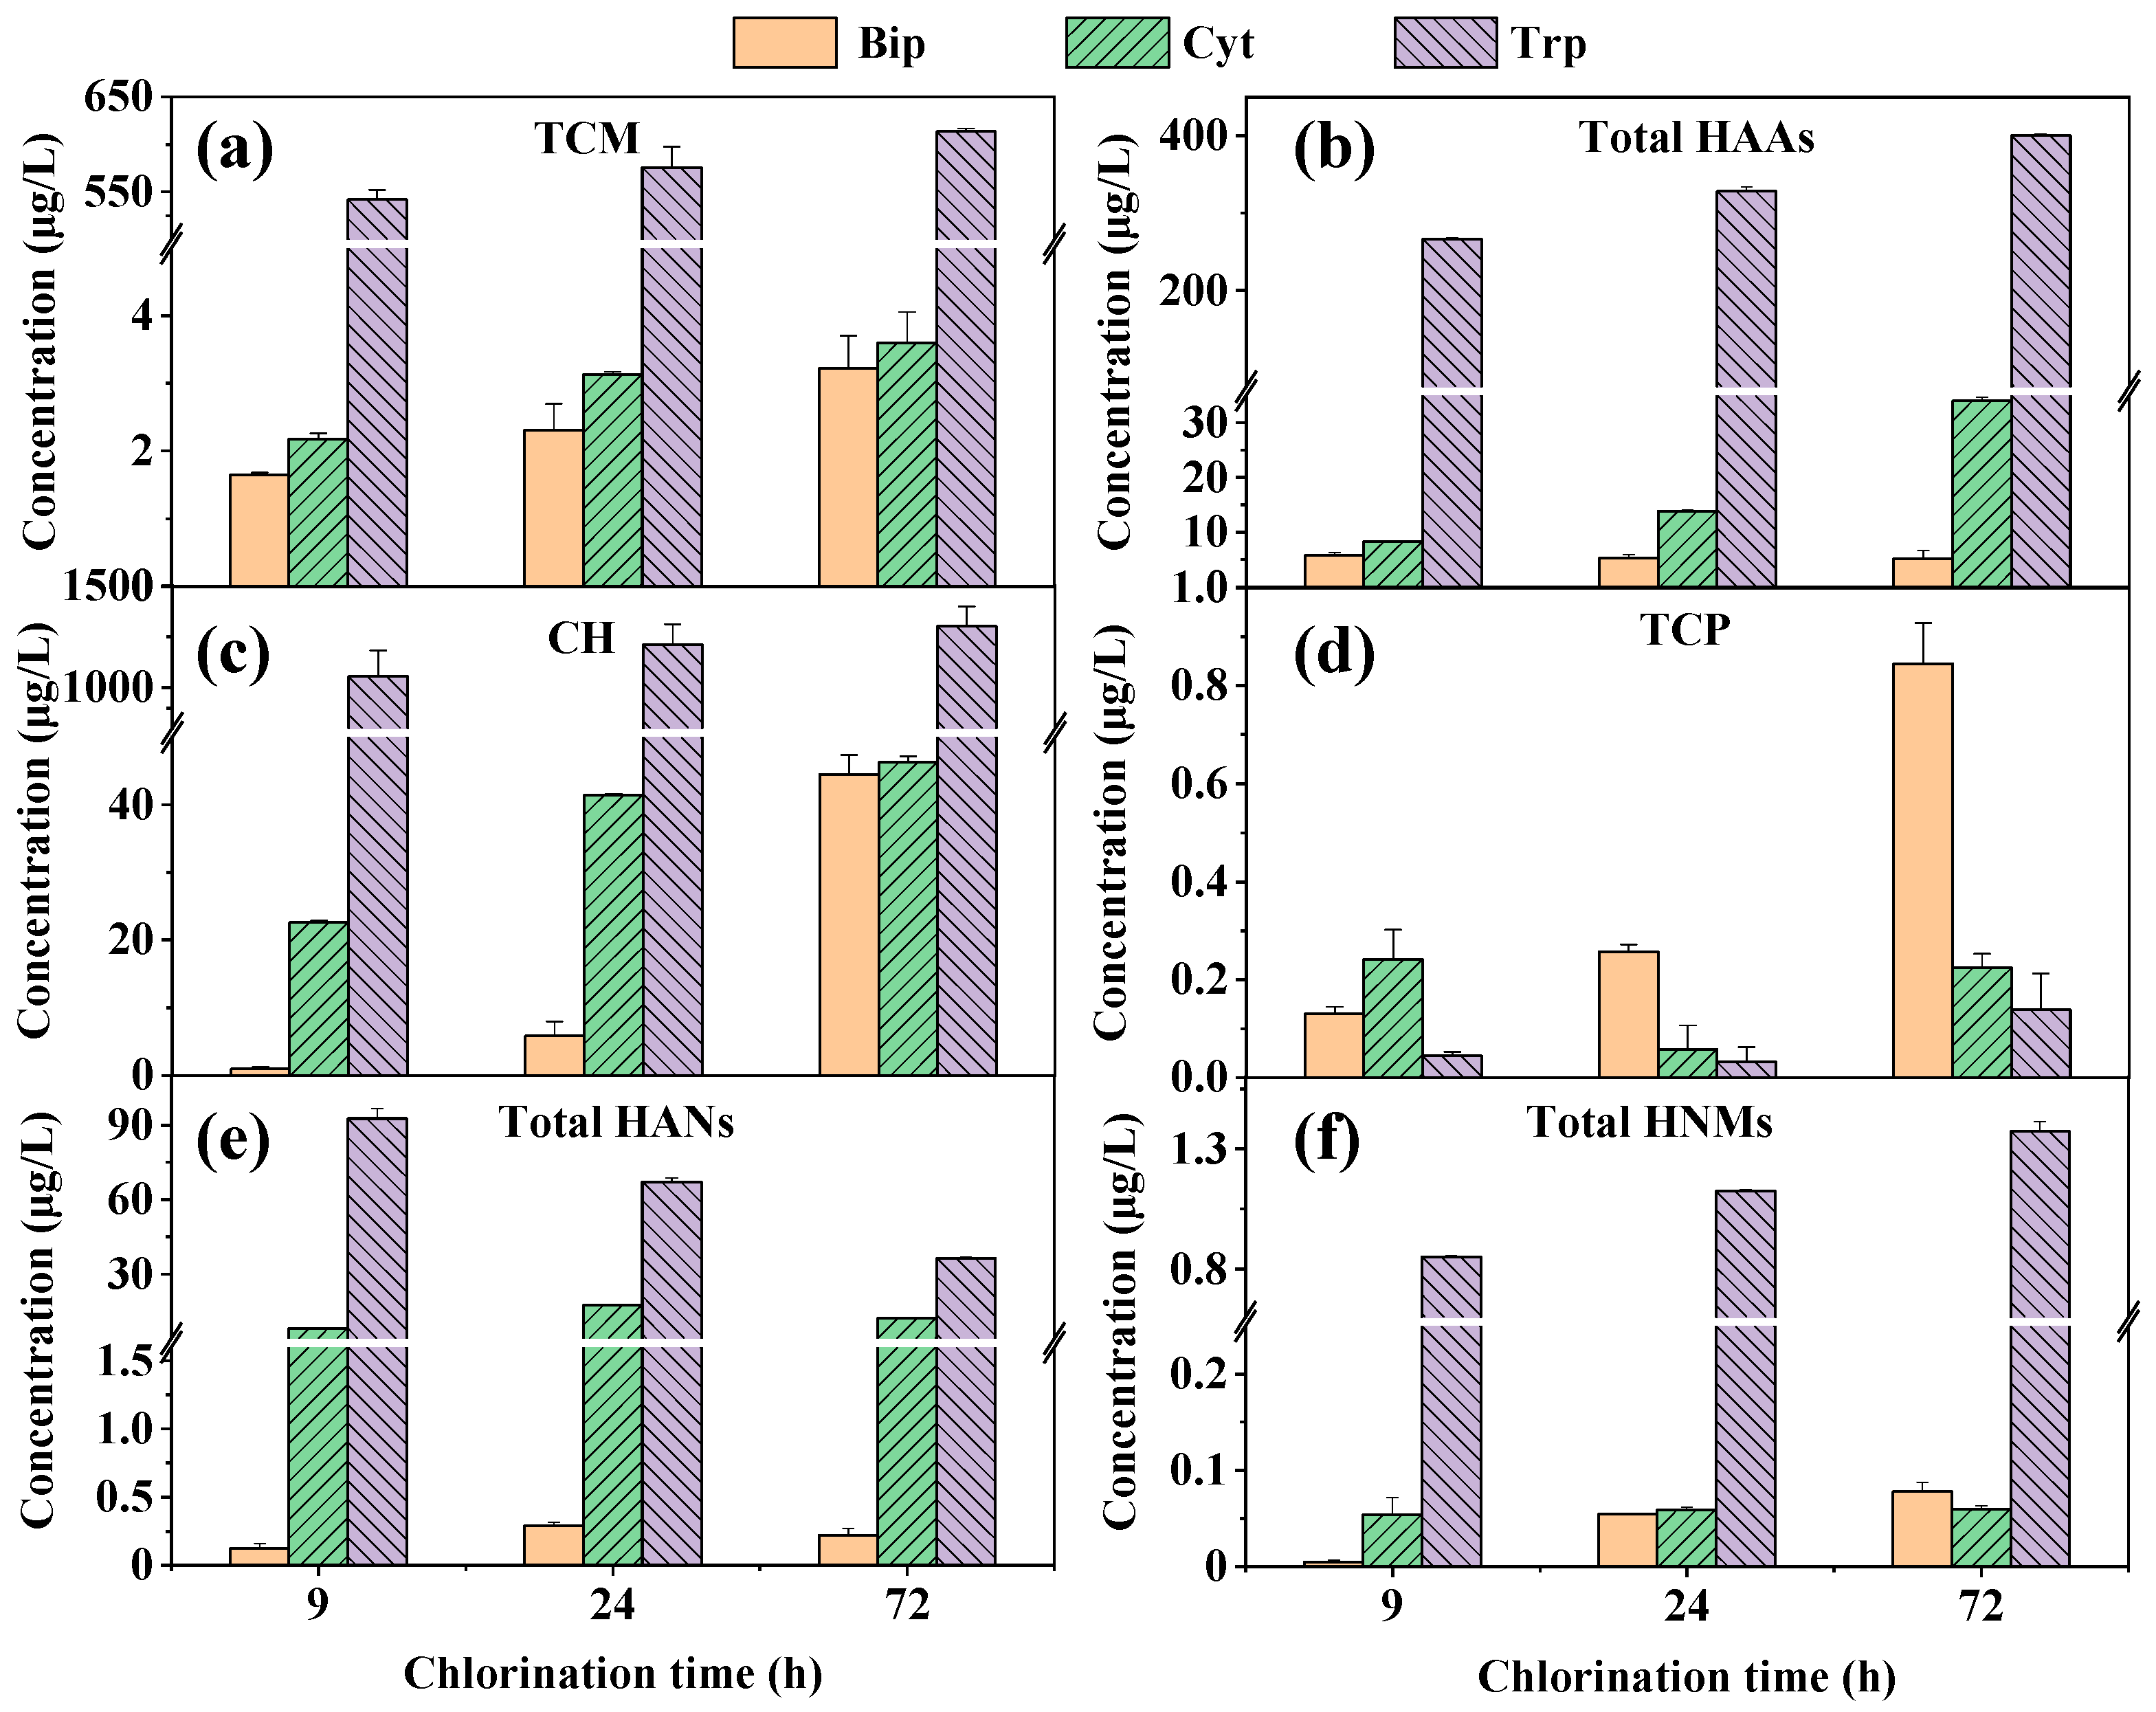
The formation of aliphatic C-DBPs and N-DBPs from Bip, Cyt, and Trp during chlorination is illustrated in Figure 2 and Figure S2. Among the 12 monitored aliphatic DBPs, the resulting DBPs mainly included TCM, MCAA, DCAA, TCAA, CH, TCP, DCAN, TCAN, DCNM, and TCNM. The residual FAC concentration after reactions at specific times (Figure S3) confirmed oxidant-excess conditions throughout, consistent with common practice in drinking water disinfection [22].
For C-DBPs, all three precursors exhibited increased formation of TCM and CH with prolonged chlorination time, consistent with previous studies indicating DBP formation as a function of contact time [29]. Among the three precursors, Trp was the most reactive, producing 613.25 μg/L of TCM and 1300.60 μg/L of CH after 72 h, while Bip showed the lowest reactivity with 3.22 μg/L for TCM and 44.49 μg/L for CH. In contrast, the formation potential for HAAs from Cyt and Trp increased with extended contact time, whereas HAAs from Bip remained relatively stable. This difference may be due to the distinct chlorination mechanisms of the precursors, with the aromatic ring cleavage in Cyt and Trp contributing to HAAs formation, whereas HAAs from Bip likely resulted from side-chain cleavage [30,31]. TCP was the least produced C-DBP for all precursors, as its instability and rapid hydrolysis to acetaldehyde under the influence of strong electron-withdrawing effects from its three chlorine atoms [32]. Subsequently, acetaldehyde reacted further with chlorine to form CH.
For N-DBPs, the formation patterns distinctly differed from those of C-DBPs. DCAN and TCNM were the primary species of HANs and HNMs, respectively (Figure S2), consistent with findings from previous studies on DBP formation from nucleic acid bases and amino acids [30,33]. However, the concentrations of HANs did not consistently increase over time. The highest HAN concentration from Trp was observed at 9 h (92.59 μg/L), while Bip and Cyt produced their highest concentrations of DCAN at 24 h (0.29 μg/L and 17.44 μg/L, respectively). Prior literature indicates that DCAN was unstable in the presence of excess chlorine and may degrade into dichloroacetamide and DCAA [34]. Peak yields of HNMs from all three precursors occurred at 72 h, with concentrations of 0.08 μg/L for Bip, 0.06 μg/L for Cyt, and 1.37 μg/L for Trp.
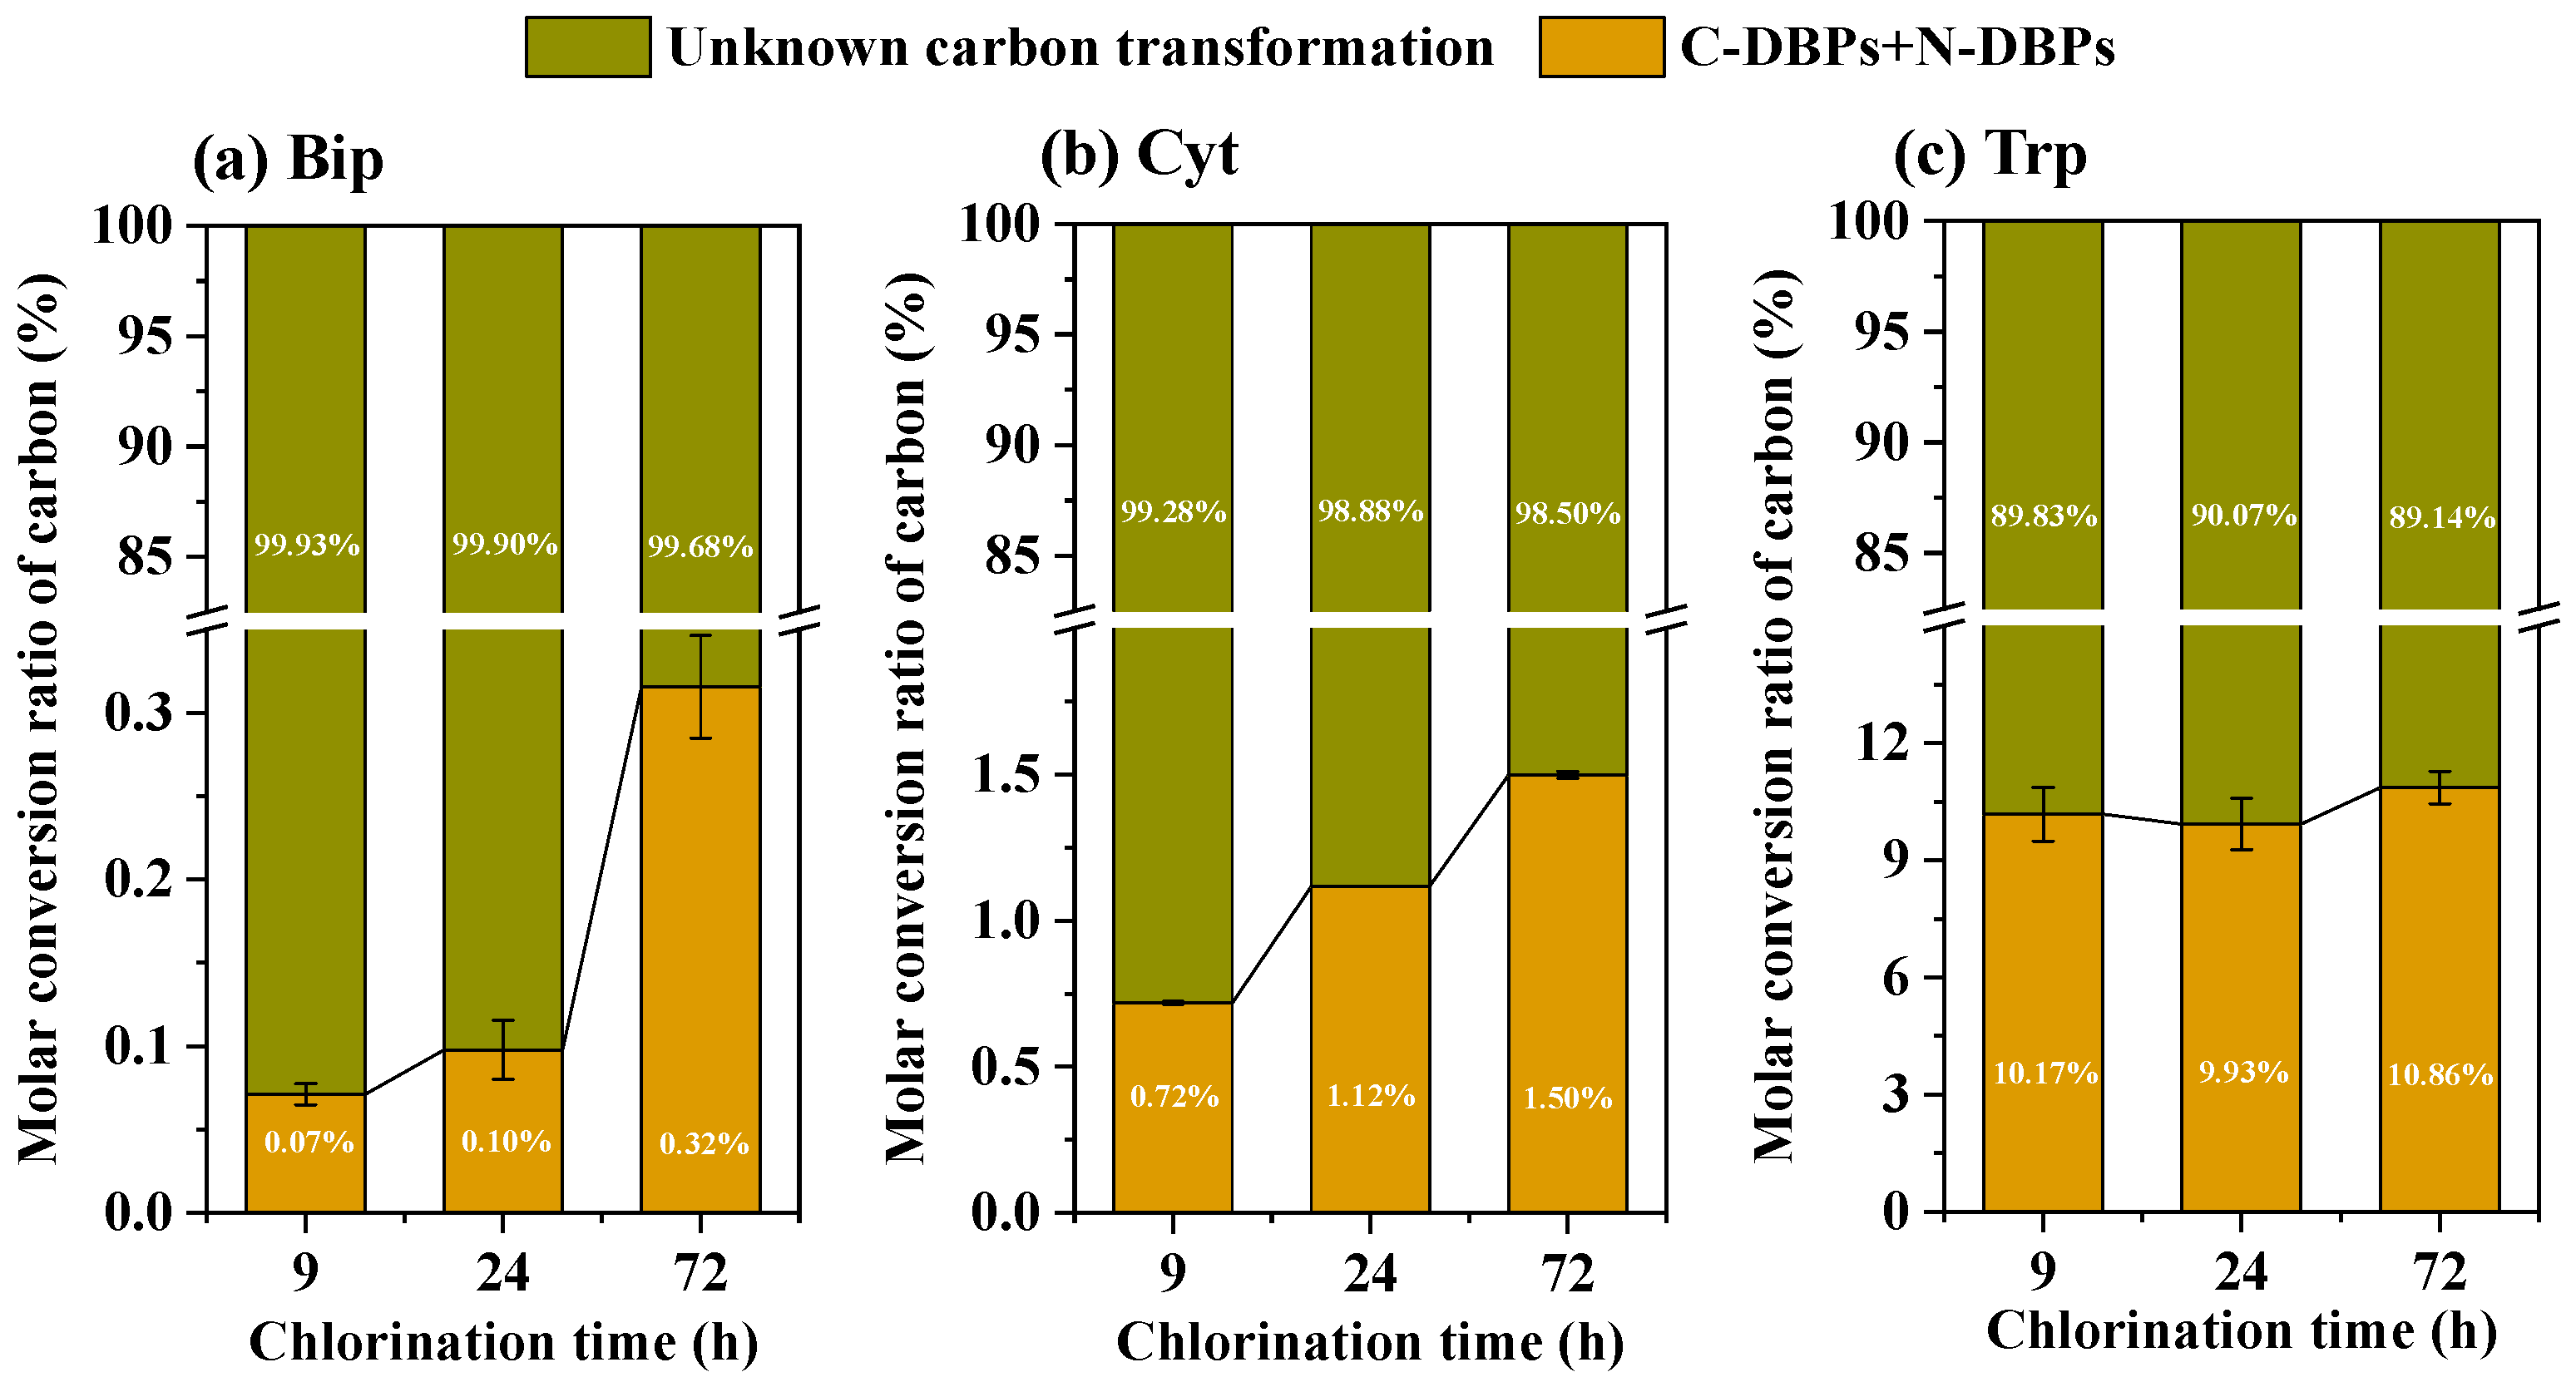
Across all chlorination times, the summed concentrations of monitored aliphatic DBPs, encompassing both carbonaceous and nitrogenous species, ranked in the order of Trp > Cyt > Bip (Figure S4). When normalized on a precursor-mole basis (Figure 3), the carbon-molar yields of these aliphatic targets followed the identical sequence. This trend is notable as it contrasts with the per-molecule carbon stoichiometry of the precursors (Trp > Bip > Cyt). Consequently, although Bip possesses more than double the carbon content of Cyt, it generated fewer monitored aliphatic DBPs per mole, strongly suggesting that a larger fraction of its carbon was diverted to non-aliphatic products. This interpretation is further corroborated by the observation that TOC remained essentially constant throughout the chlorination process for all three precursors (Figure S5), which is consistent with previous findings that chlorine is a relatively weak oxidant for mineralizing organic pollutants [35]. This indicates that mineralization was negligible and implies that the vast majority (close to or more than 90%) of the transformed carbon resides in uncharacterized species—possibly as halogenated aromatic or heterocyclic products that retain the parent structural framework.

3.3. Biotoxicity of Extracts Related to Extraction pH During Chlorination of Three Amphoteric Precursors

It is well-established that chlorination can transform non-toxic precursors into more toxic DBPs. Consequently, the biotoxicity of chlorinated solutions derived from Bip, Cyt, and Trp was evaluated using a luminescent bacteria bioassay, a sensitive and widely adopted method for assessing the toxic effects of DBP mixtures [27,28]. To prepare the samples for analysis, liquid–liquid extraction was employed. This step was critical not only for concentrating the analytes but also for mitigating potential interferences, namely by removing residual chlorine and avoiding the use of common quenching agents that can chemically reduce N-DBPs expected from these nitrogen-rich precursors [20,36]. It should be noted that this procedure inherently focuses the assessment on non-volatile DBPs, as volatile species were lost during the nitrogen-blowing concentration step. A pivotal variable in this analytical approach is the extraction pH. Given the amphoteric nature of the precursors, it is probable that their aromatic or heterocyclic TPs also exhibit amphiprotic properties. Therefore, the pH of the aqueous sample governs the speciation of these compounds by modulating their protonation state, thereby regulating their partitioning efficiency into the organic solvent.
As illustrated in Figure 4, the precursors exist predominantly in their neutral, most extractable form within specific pH ranges: 2.23–7.89 for Bip, 4.16–12.28 for Cyt, and 2.46–9.41 for Trp. Assuming the pKa values of the partially formed cyclic nitrogenous TPs are comparable to those of their precursors, maximizing their recovery necessitates conducting extraction within a pH range favorable to their neutral state. This premise challenges widely applied analytical protocols that mandate sample adjustment to a highly acidic pH [16]. Therefore, the influence of extraction pH on the measured toxicity of the DBP mixtures was systematically evaluated.
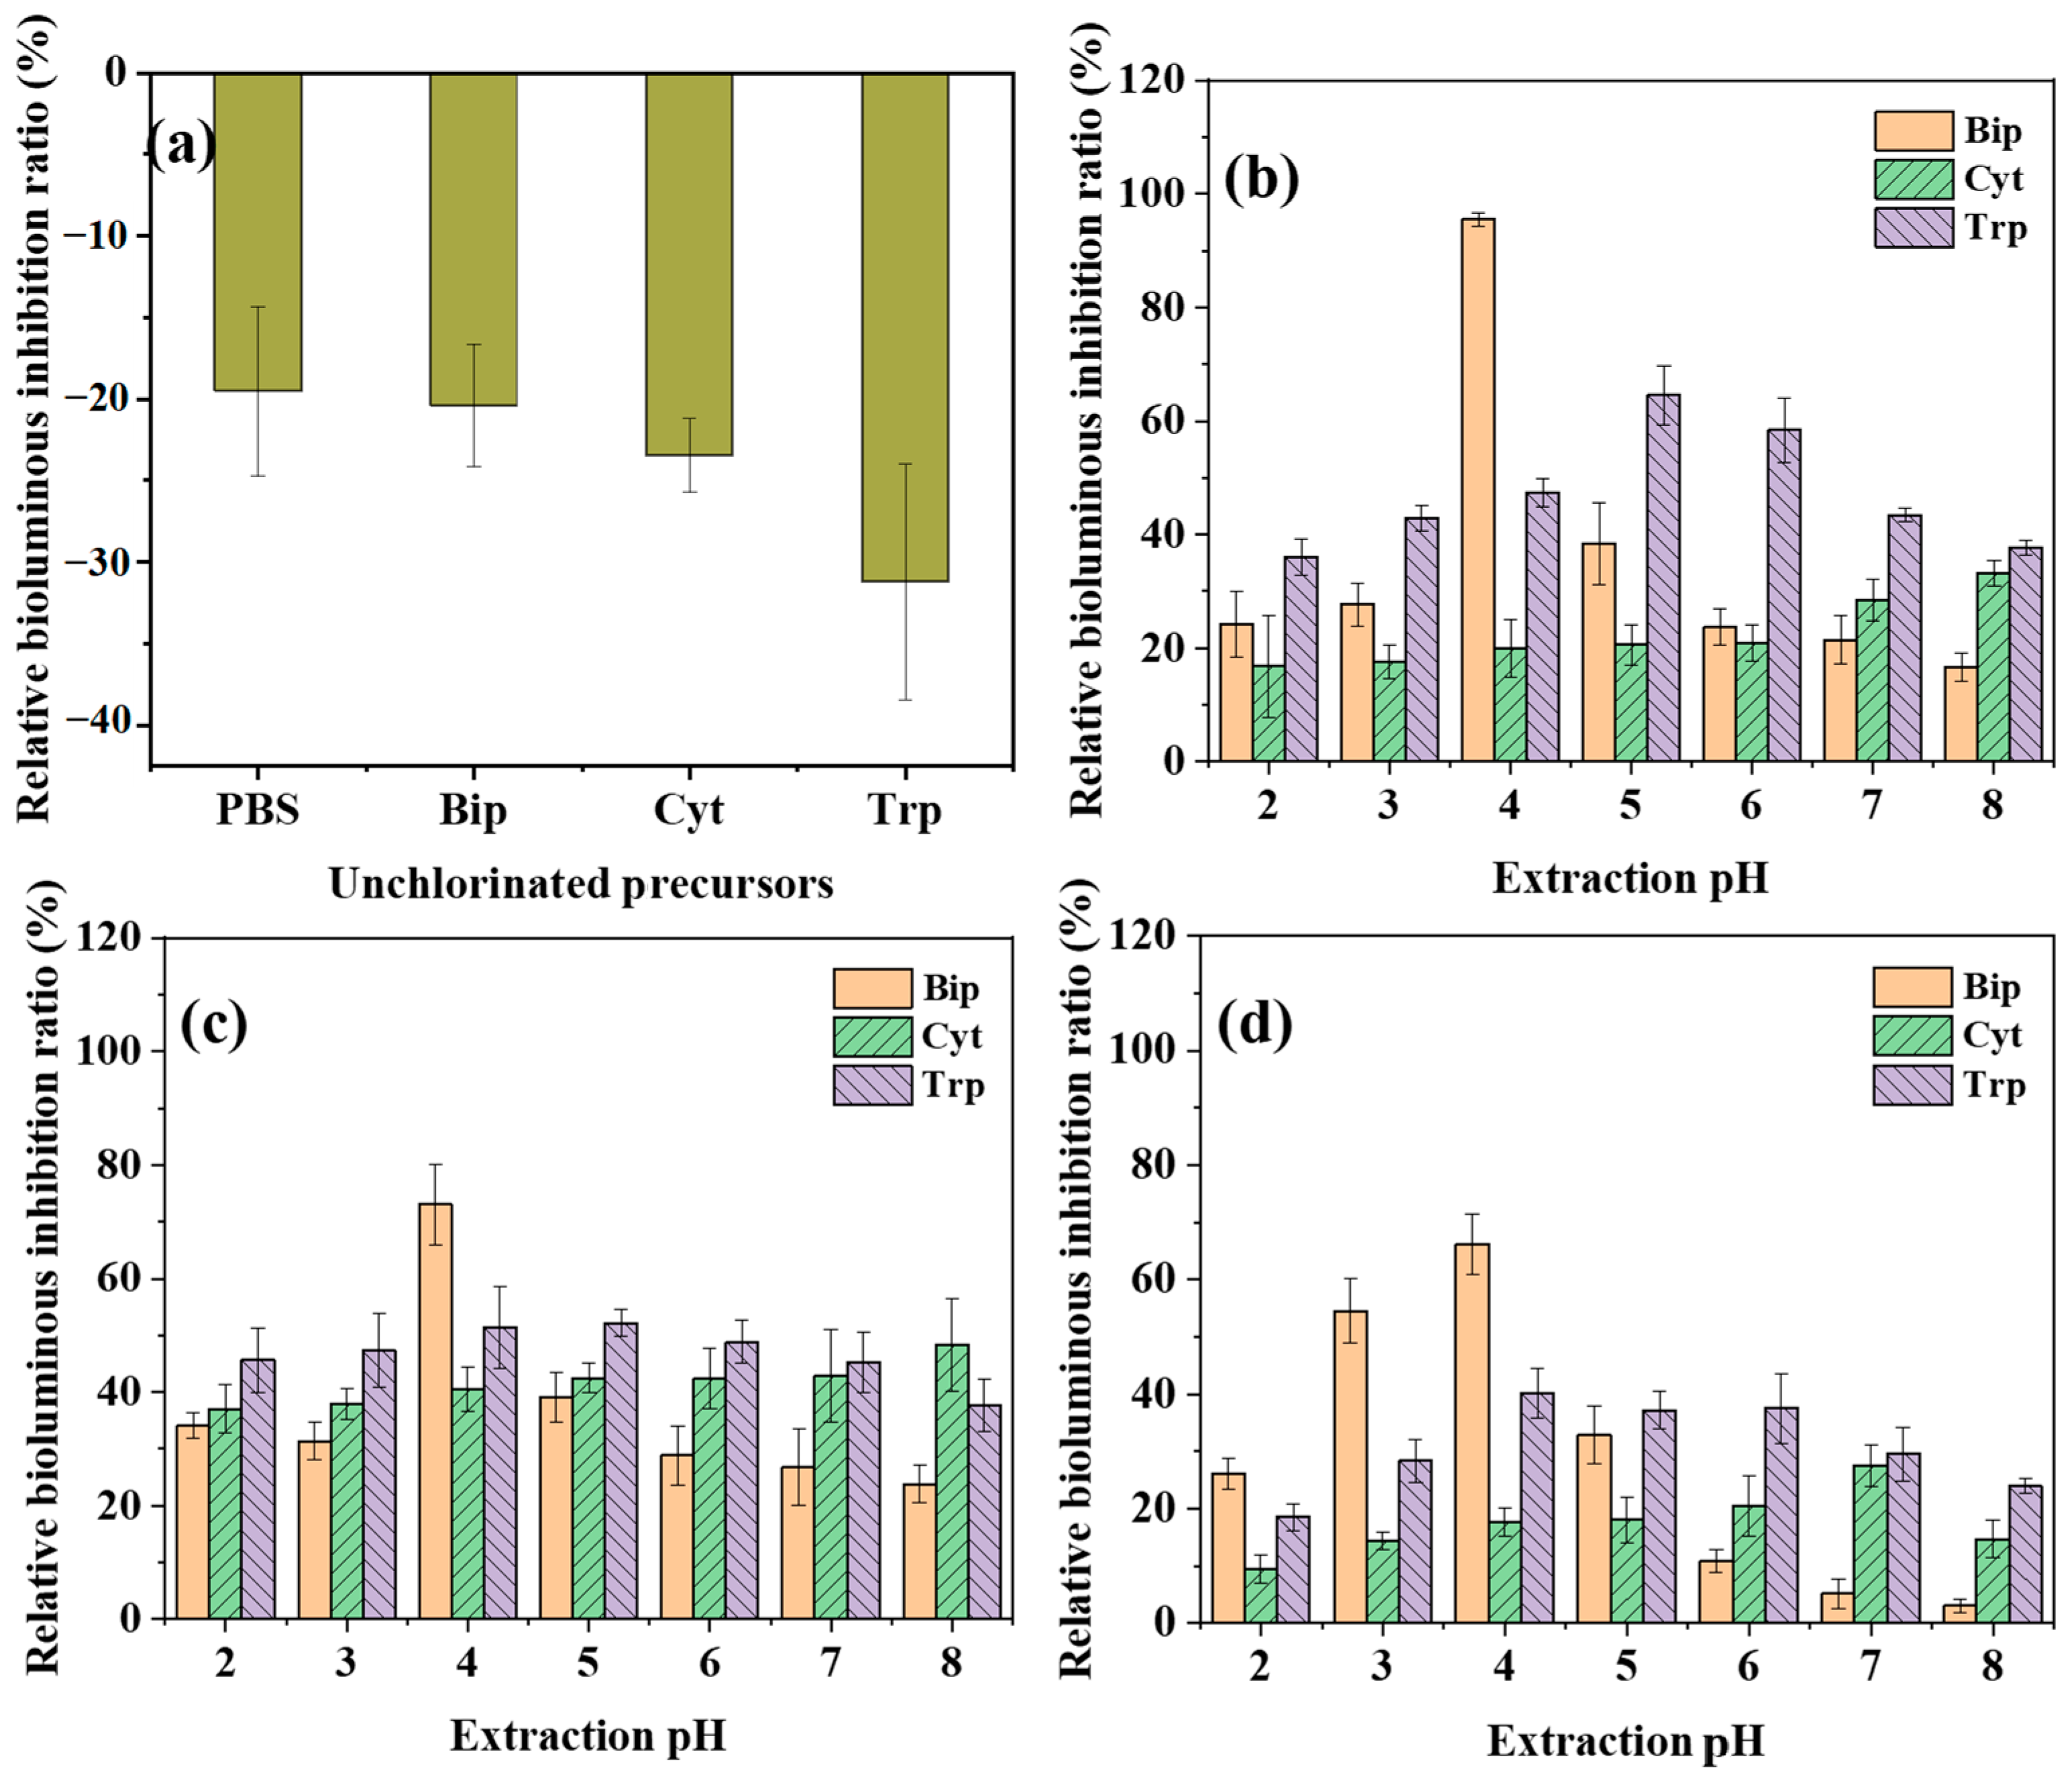
As a baseline, control experiments confirmed that the unchlorinated precursors (Bip, Cyt, and Trp) and the PBS matrix exhibited no inhibitory effects on Vibrio fischeri, indicating their non-toxicity (Figure 5a). Conversely, all extracts from the chlorinated solutions displayed measurable toxicity, underscoring the formation of hazardous byproducts during chlorination (Figure 5b–d).
Crucially, the extraction pH proved to be a significant determinant of the observed toxicity, with the magnitude of its influence being highly precursor-dependent. For Bip, the toxicity of its chlorinated products was exceptionally sensitive to pH. Across all reaction times (9, 24, and 72 h), the highest toxicity was consistently observed in extracts prepared at pH 4.0, with a general trend of decreasing toxicity at higher and lower pH values. In contrast, the toxicity profile for Cyt was markedly different. For 9 and 24 h reactions, the toxic response intensified with increasing pH, while for the 72 h reaction, toxicity peaked at pH 7.0. Trp exhibited an intermediate behavior, with toxicity profiles peaking under mildly acidic conditions at around pH 5.0.
A comparative analysis revealed two key findings. First, the maximum achievable inhibitory effects of chlorinated extracts on Vibrio fischeri followed a consistent rank order of Bip > Trp > Cyt regardless of reaction time, which was inconsistent with the trend of total aliphatic DBP generation (Figure S4). This indicates that although Bip produced limited amounts of conventional small-molecule aliphatic DBPs during chlorination, it may pose a threat to drinking water health by generating substantial quantities of non-volatile heterocyclic DBPs. Further research employing high-resolution mass spectrometry is warranted to identify these toxic transformation products and elucidate their structure-biotoxicity relationships. Second, the degree of pH sensitivity, defined by the difference between the maximum and minimum toxicity observed across the pH range, also followed a distinct order: Bip > Trp > Cyt. This differential sensitivity correlates strongly with the physicochemical properties of the parent molecules: precursors with a narrower pH window for their neutral, extractable form (e.g., Bip) yielded a mixture of TPs whose collective toxicity was most dependent on the extraction pH (Figure 4a). Cyt, which remains neutral over the broadest pH range (Figure 4b), produced TPs with the least pH-sensitive toxicity profile. Furthermore, the maximum toxicity for Bip and Trp generally decreased with prolonged chlorination time, whereas that for Cyt did not, suggesting that the initial non-volatile TPs formed from Bip and Trp may be inherently more toxic than subsequent degradation products.
These findings critically demonstrate that reliance on a single, standardized extraction pH can systematically and substantially underestimate the true toxicological burden of DBPs, particularly for those derived from structurally complex, amphoteric precursors. This issue is especially pertinent to the treatment of algal-rich source waters, which are abundant in amphoteric DBP precursors such as amino acids and pterins. Consequently, conventional pretreatment protocols for toxicity testing may significantly misjudge the risks of disinfecting such water bodies. Instead, to accurately assess the biotoxicity of chlorination-derived DBPs from amphoteric precursors (e.g., nitrogen-containing compounds), the pH value for sample pretreatment must be selected with caution and rationality. In future works, it is also recommended to assess the impact of extraction pH values on other valuable toxicity endpoints (e.g., genotoxicity and cytotoxicity), so as to provide a more comprehensive toxicological profile for the disinfected water.

4. Conclusions

(1)
The amphoteric precursors Bip, Cyt, and Trp were highly reactive with chlorine, readily forming a range of aliphatic DBPs, with formation yields following the order of Trp > Cyt > Bip.
(2)
A critical disconnect existed between the quantity of measured aliphatic DBPs and the biotoxicity of extracted non-volatile DBPs. Bip, which produced the lowest mass of monitored aliphatic DBPs, generated a mixture of non-volatile TPs that exhibited the highest biotoxicity.
(3)
Extraction pH was a variable that cannot be overlooked in the biotoxicity assessment of DBPs derived from amphoteric precursors. The measured toxicity of chlorinated extracts was profoundly pH-dependent, and the optimal pH for recovering the most potent toxic species varied significantly among the precursors.

Supplementary Materials

The following supporting information can be downloaded at https://www.mdpi.com/article/10.3390/pr13103355/s1. Figure S1: Schematic diagram of experimental procedures of this study. Figure S2: Formation of HAAs, HANs, and HNMs after chlorination of Bip, Cyt, and Trp for a specific time. Figure S3: Residual FAC concentration after reaction with three amphoteric precursors at specific times; Figure S4: Total DBP formation during chlorination of Bip, Cyt, and Trp; Figure S5: TOC concentration of chlorinated waters.

Author Contributions

Conceptualization, Y.Z., Z.W. and S.C.; Methodology, Y.Z. and S.X.; Formal analysis, S.X., J.Z. and H.F.; Investigation, S.X. and H.L.; Resources, Y.Z. and C.B.; Writing—original draft preparation, Y.Z.; Writing—review and editing, Z.W., S.C. and G.R.; Supervision, Z.W. and S.C.; Funding acquisition, Y.Z. and S.C. All authors have read and agreed to the published version of the manuscript.

Funding

This research was funded by Changzhou Leading Innovative Talents Introduction and Cultivation Project (CQ20240122), the Science and Technology Project of Changzhou City (CJ20250043), the Talent Introduction Research Project of Jiangsu University of Technology (KYY24050), and the Talent Introduction Research Project of Changzhou University (ZMF23020223). The APC was funded by the Talent Introduction Research Project of Changzhou University.

Data Availability Statement

The original contributions presented in this study are included in the article. Further inquiries can be directed to the corresponding authors.

Conflicts of Interest

The authors declare no conflicts of interest.

References

  1. Li, X.-F.; Mitch, W.A. Drinking Water Disinfection Byproducts (DBPs) and Human Health Effects: Multidisciplinary Challenges and Opportunities. Environ. Sci. Technol. 2018, 52, 1681–1689. [Google Scholar] [CrossRef]
  2. Hua, G.; Kim, J.; Reckhow, D.A. Disinfection Byproduct Formation from Lignin Precursors. Water Res. 2014, 63, 285–295. [Google Scholar] [CrossRef]
  3. Chuang, Y.H.; Lin, A.Y.; Wang, X.H.; Tung, H.H. The Contribution of Dissolved Organic Nitrogen and Chloramines to Nitrogenous Disinfection Byproduct Formation from Natural Organic Matter. Water Res. 2013, 47, 1308–1316. [Google Scholar] [CrossRef]
  4. Evlampidou, I.; Font-Ribera, L.; Rojas-Rueda, D.; Gracia-Lavedan, E.; Costet, N.; Pearce, N.; Vineis, P.; Jaakkola, J.J.K.; Delloye, F.; Makris, K.C.; et al. Trihalomethanes in Drinking Water and Bladder Cancer Burden in the European Union. Environ. Health Persp. 2020, 128, 017001. [Google Scholar] [CrossRef]
  5. Diana, M.; Felipe-Sotelo, M.; Bond, T. Disinfection Byproducts Potentially Responsible for the Association between Chlorinated Drinking Water and Bladder Cancer: A review. Water Res. 2019, 162, 492–504. [Google Scholar] [CrossRef]
  6. Aslani, H.; Hosseini, M.-S.; Mohammadi, S.; Naghavi-Behzad, M. Drinking Water Disinfection By-products and Their Carcinogenicity, A Review of Unseen Crisis. Int. J. Cancer Manag. 2019, 12, e88930. [Google Scholar] [CrossRef]
  7. Wu, Y.; Wei, W.; Luo, J.; Pan, Y.; Yang, M.; Hua, M.; Chu, W.; Shuang, C.; Li, A. Comparative Toxicity Analyses from Different Endpoints: Are New Cyclic Disinfection Byproducts (DBPs) More Toxic than Common Aliphatic DBPs? Environ. Sci. Technol. 2022, 56, 194–207. [Google Scholar] [CrossRef] [PubMed]
  8. Han, J.; Zhang, X.; Jiang, J.; Li, W. How Much of the Total Organic Halogen and Developmental Toxicity of Chlorinated Drinking Water Might Be Attributed to Aromatic Halogenated DBPs? Environ. Sci. Technol. 2021, 55, 5906–5916. [Google Scholar] [CrossRef] [PubMed]
  9. Mao, Y.; Guo, D.; Yao, W.; Wang, X.; Yang, H.; Xie, Y.F.; Komarneni, S.; Yu, G.; Wang, Y. Effects of Conventional Ozonation and Electro-peroxone Pretreatment of Surface Water on Disinfection By-product Formation during Subsequent Chlorination. Water Res. 2018, 130, 322–332. [Google Scholar] [CrossRef]
  10. Cheng, S.; Wu, Y.-P.; Young, T.R.; Dodd, M.C.; Wu, J.; Zhang, H.; Huo, Z.-L.; Qian, Y.-T.; Li, Y.; Li, W.-T.; et al. Rapid Determination of Trace Haloacetic Acids in Water and Wastewater using Non-suppressed Ion Chromatography with Electrospray Ionization-tandem Mass Spectrometry. Sci. Total Environ. 2021, 754, 142297. [Google Scholar] [CrossRef]
  11. Kalita, I.; Kamilaris, A.; Havinga, P.; Reva, I. Assessing the Health Impact of Disinfection Byproducts in Drinking Water. ACS ES&T Water 2024, 4, 1564–1578. [Google Scholar] [CrossRef] [PubMed]
  12. Kali, S.; Khan, M.; Ghaffar, M.S.; Rasheed, S.; Waseem, A.; Iqbal, M.M.; Bilal Khan Niazi, M.; Zafar, M.I. Occurrence, Influencing Factors, Toxicity, Regulations, and Abatement Approaches for Disinfection By-products in Chlorinated Drinking Water: A Comprehensive Review. Environ. Pollut. 2021, 281, 116950. [Google Scholar] [CrossRef]
  13. Li, W.; Han, J.; Zhang, X.; Chen, G.; Yang, Y. Contributions of Pharmaceuticals to DBP Formation and Developmental Toxicity in Chlorination of NOM-containing Source Water. Environ. Sci. Technol. 2023, 57, 18775–18787. [Google Scholar] [CrossRef] [PubMed]
  14. Han, J.; Zhang, X. Evaluating the Comparative Toxicity of DBP Mixtures from Different Disinfection Scenarios: A New Approach by Combining Freeze-Drying or Rotoevaporation with a Marine Polychaete Bioassay. Environ. Sci. Technol. 2018, 52, 10552–10561. [Google Scholar] [CrossRef] [PubMed]
  15. Method 552.3 Determination of Haloacetic Acids and Dalapon in Drinking Water by Liquid-Liquid Microextraction, Derivatization, and Gas Chromatography with Electron Capture Detection, United States Environmental Protection Agency. 2003. Available online: https://onesearch.library.wwu.edu/discovery/fulldisplay?docid=alma9993042367301453&context=L&vid=01ALLIANCE_WWU:WWU&lang=en&search_scope=DN_and_CI&adaptor=Local%20Search%20Engine&tab=Summit_Plus_Articles&query=sub,exact,Drinking%20water%20--%20Testing%20--%20Methodology&offset=0 (accessed on 15 September 2025).
  16. Tang, H.; Zhong, H.; Pan, Y.; Zhou, Q.; Huo, Z.; Chu, W.; Xu, B. A New Group of Heterocyclic Nitrogenous Disinfection Byproducts (DBPs) in Drinking Water: Role of Extraction pH in Unknown DBP Exploration. Environ. Sci. Technol. 2021, 55, 6764–6772. [Google Scholar] [CrossRef]
  17. Bond, T.; Mokhtar Kamal, N.H.; Bonnisseau, T.; Templeton, M.R. Disinfection By-product Formation from the Chlorination and Chloramination of Amines. J. Hazard. Mater. 2014, 278, 288–296. [Google Scholar] [CrossRef]
  18. Zhang, H.; Gao, P.; Liu, Y.; Du, Z.; Feng, L.; Zhang, L. Effects of Different Types of Nitrogen Sources in Water on the Formation Potentials of Nitrogenous Disinfection By-products in Chloramine Disinfection Process Based on Isotope Labeling. Sci. Total Environ. 2022, 842, 156692. [Google Scholar] [CrossRef]
  19. Sun, G.; Kaw, H.Y.; Zhou, M.; Guo, P.; Zhu, L.; Wang, W. Chlorinated Nucleotides and Analogs as Potential Disinfection Byproducts in Drinking Water. J. Hazard. Mater. 2023, 452, 131242. [Google Scholar] [CrossRef]
  20. Zuo, Y.; Cheng, S.; Han, Y.; Pu, L.; Du, E.; Peng, M.; Li, A.; Li, W. Chlorination of Biopterin in Water: Deciphering the Kinetics, Disinfection Byproducts, and Toxicity. Environ. Sci. Technol. 2024, 58, 20137–20146. [Google Scholar] [CrossRef]
  21. Siquerolo, L.V.; Ramos, R.M.B.; Monteiro, P.I.; Silveira, G.F.; Bassetti, F.d.J.; Coral, L.A.d.A. Impact of the UV/H2O2 Process on Assimilable Organic Carbon and Trihalomethane Formation in Cyanobacteria-Contaminated Waters. Processes 2025, 13, 23. [Google Scholar] [CrossRef]
  22. Tan, J.; Allard, S.; Gruchlik, Y.; McDonald, S.; Joll, C.A.; Heitz, A. Impact of bromide on halogen incorporation into organic moieties in chlorinated drinking water treatment and distribution systems. Sci. Total Environ. 2016, 541, 1572–1580. [Google Scholar] [CrossRef]
  23. Golaszewski, G.; Seux, R. The Kinetics of the Action of Chloroisocyanurates on Three Bacteria: Pseudomonas aeruginosa, Streptococcus faecalis and Staphylococcus aureus. Water Res. 1994, 28, 207–217. [Google Scholar] [CrossRef]
  24. Method 551.1 Determination of Chlorination Disinfection Byproducts, Chlorinated Solvents, and Halogenated Pesticides/Herbicides in Drinking Water by Liquid-Liquid Extraction and Gas Chromatography with Electron-Capture Detection, United States Environmental Protection Agency. 1995. Available online: https://www.epa.gov/sites/default/files/2015-06/documents/epa-551.1.pdf (accessed on 19 October 2025).
  25. Li, Y.; Zhang, X.; Shang, C. Effect of Reductive Property of Activated Carbon on Total Organic Halogen Analysis. Environ. Sci. Technol. 2010, 44, 2105–2111. [Google Scholar] [CrossRef]
  26. Hua, G.; Reckhow, D.A. Effect of Alkaline pH on the Stability of Halogenated DBPs. J. Am. Water Works Ass. 2012, 104, E107–E120. [Google Scholar] [CrossRef]
  27. Medici, A.; Luongo, G.; Di Fabio, G.; Zarrelli, A. Environmental Fate of Organic Sunscreens during Water Disinfection Processes: The Formation of Degradation By-Products and Their Toxicological Profiles. Molecules 2022, 27, 4467. [Google Scholar] [CrossRef]
  28. Lee, J.-S.; Hong, S.; Lee, J.; Choi, T.S.; Rhie, K.; Khim, J.S. Evaluation of Residual Toxicity of Hypochlorite-treated Water Using Bioluminescent Microbes and Microalgae: Implications for Ballast Water Management. Ecotox. Environ. Saf. 2019, 167, 130–137. [Google Scholar] [CrossRef]
  29. Wang, T.; Deng, L.; Tan, C.; Hu, J.; Singh, R.P. Comparative Analysis of Chlorinated Disinfection Byproducts Formation From 4-nitrophenol and 2-amino-4-nitrophenol During UV/ post-chlorination. Sci. Total Environ. 2024, 927, 172200. [Google Scholar] [CrossRef]
  30. Zhang, B.; Xian, Q.; Gong, T.; Li, Y.; Li, A.; Feng, J. DBPs Formation and Genotoxicity During Chlorination of Pyrimidines and Purines Bases. Chem. Eng. J. 2017, 307, 884–890. [Google Scholar] [CrossRef]
  31. Hua, L.-C.; Kim, E.; McCurry, D.L.; Huang, C.; Mitch, W.A. Novel Chlorination Byproducts of Tryptophan: Initial High-Yield Transformation Products versus Small Molecule Disinfection Byproducts. Environ. Sci. Technol. Lett. 2020, 7, 149–155. [Google Scholar] [CrossRef]
  32. Ding, S.; Wu, M.; Xiao, R.; Fang, C.; Wang, Q.; Xu, B.; Chu, W. Evaluation of N-acetylcysteine and Glutathione as Quenching Agents for the Analysis of Halogenated Disinfection By-products. J. Environ. Sci. 2022, 117, 71–79. [Google Scholar] [CrossRef] [PubMed]
  33. Yang, X.; Shen, Q.; Guo, W.; Peng, J.; Liang, Y. Precursors and nitrogen origins of trichloronitromethane and dichloroacetonitrile during chlorination/chloramination. Chemosphere 2012, 88, 25–32. [Google Scholar] [CrossRef]
  34. Shah, A.D.; Mitch, W.A. Halonitroalkanes, Halonitriles, Haloamides, and N-Nitrosamines: A Critical Review of Nitrogenous Disinfection Byproduct Formation Pathways. Environ. Sci. Technol. 2012, 46, 119–131. [Google Scholar] [CrossRef]
  35. Mazur, D.M.; Lebedev, A.T. Transformation of Organic Compounds during Water Chlorination/Bromination: Formation Pathways for Disinfection By-Products (A Review). J. Anal. Chem. 2022, 77, 1705–1728. [Google Scholar] [CrossRef]
  36. Huang, K.; MacKay, A.A. Microcystin-LR Degradation Kinetics during Chlorination: Role of Water Quality Conditions. Water Res. 2020, 185, 116305. [Google Scholar] [CrossRef]
Figure 1. (a) Changes in concentrations of Bip, Cyt, and Trp as a function of chlorination time; (b) Pseudo-first-order degradation kinetics of Bip, Cyt, and Trp. C represents the residual precursor concentration at specific chlorination time, C0 represents the initial precursor concentration, [precursor]0 = 20 μM, [FAC] = 400 μM, pH = 7.0, n = 2, and the error bar represents the standard deviation.
Processes 13 03355 g001
Figure 2. Formation of (a) chloroform (TCM), (b) total haloacetic acids (HAAs), (c) chloralhydrate (CH), (d) 1,1,1-trichloroacetone (TCP), (e) total halogenated acetonitrile (HANs), and (f) total halogenated nitromethane (HNMs) after chlorination of Bip, Cyt, and Trp for a specific time. Experimental conditions: [precursor]0 = 20 μM, [FAC] = 400 μM, pH = 7.0, and n = 2; error bar represents the standard deviation.
Processes 13 03355 g002
Figure 3. Molar conversion ratio of carbon after chlorination of (a) Bip, (b) Cyt, and (c) Trp for a specific time. [precursor]0 = 20 μM, [FAC] = 400 μM, pH = 7.0, and n = 2; error bar represents the standard deviation.
Processes 13 03355 g003
Figure 4. pH-dependent speciation of cationic, neutral and anionic species of (a) Bip, (b) Cyt, and (c) Trp.
Processes 13 03355 g004
Figure 5. Relative bioluminous inhibition ratio of (a) unchlorinated precursors and extracts related to extraction pH during chlorination of three amphoteric precursors for (b) 9 h, (c) 24 h, and (d) 72 h. [precursor]0 = 20 μM, [FAC] = 400 μM, pH = 7.0, and n = 3; error bar represents the standard deviation.
Processes 13 03355 g005
Table 1. Molecular information about biopterin, cytosine, and tryptophan.
PrecursorsFormulaMolecular WeightStructurespKa1pKa2
BipC9H11N5O3237.2Processes 13 03355 i0012.23 a7.89 a
CytC4H5N3O111.1Processes 13 03355 i0024.16 b12.28 b
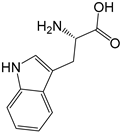
TrpC11H12N2O2204.2Processes 13 03355 i0032.46 a9.41 a
a pKa values are obtained from “Shanghai Institute of Organic Chemistry, Chinese Academy of Sciences. Chemical professional database (https://organchem.csdb.cn, accessed on 19 July 2025)”. b pKa values are obtained from the chemical data website “https://chemicalize.com” (accessed on 19 July 2025).
Disclaimer/Publisher’s Note: The statements, opinions and data contained in all publications are solely those of the individual author(s) and contributor(s) and not of MDPI and/or the editor(s). MDPI and/or the editor(s) disclaim responsibility for any injury to people or property resulting from any ideas, methods, instructions or products referred to in the content.