Article

Two-Step Statistical and Physical–Mechanical Optimization of Electric Arc Spraying Parameters for Enhanced Coating Adhesion

by
Nurtoleu Magazov
1,
Bauyrzhan Rakhadilov
2 and
Moldir Bayandinova
3,*
1
Scientific Centre “Protective and Functional Coatings”, D. Serikbayev East Kazakhstan Technical University, Ust-Kamenogorsk 070004, Kazakhstan
2
Plasma Science LLP, Ust-Kamenogorsk 070018, Kazakhstan
3
Department of Physics, Sarsen Amanzholov East Kazakhstan University, Ust-Kamenogorsk 070000, Kazakhstan
*
Author to whom correspondence should be addressed.
Processes 2025, 13(10), 3349; https://doi.org/10.3390/pr13103349
Submission received: 18 August 2025 / Revised: 7 October 2025 / Accepted: 13 October 2025 / Published: 19 October 2025
(This article belongs to the Section Manufacturing Processes and Systems)

Abstract

This paper presents the development and experimental verification of a second-order polynomial regression model for predicting the adhesion strength of coatings produced by electric arc metallization (EAM). The aim of the study is to optimize three key process parameters: current strength (I), carrier gas pressure (P) and nozzle-to-substrate distance (L) in order to maximize the adhesion strength of the coating to the substrate. Experimental data were obtained from the central composite plan within the response surface method (RSM) and processed using analysis of variance (ANOVA). A pronounced synergistic interaction between pressure and distance was found (P × L), whereas current strength had no statistically significant effect in the range investigated. Optimal parameters (I = 200 A, P = 6.5 bar, L = 190 mm) provided an adhesion strength of ~15.4 kN, which was within 8.5% of the model’s prediction, confirming its accuracy. The proposed two-stage approach—combining statistical modeling with experimental fine-tuning in the global extremum zone—made it possible to improve the accuracy of the forecast and link statistical dependencies with the physical and mechanical mechanisms of adhesion formation (kinetic energy of particles, residual thermoelastic stresses). This method provides engineering-based recommendations for industrial application of EAM, reduces the cost of parameter selection, and improves the reproducibility of coating properties.

1. Introduction

The intensive development of mechanical engineering, energy, and shipbuilding industries, as well as the global industrial transition to the “Industry 4.0” concept, significantly increases the demand for technologies aimed at hardening, restoring, and functionalizing surfaces that operate under extreme service conditions [1,2,3,4,5]. Structural components in these industries are exposed to high mechanical loads, abrasive wear, and aggressive media, which necessitates protective coatings characterized by high adhesion strength, wear resistance, and long-term durability.
Among various surface engineering technologies, electric arc metallization (EAM) occupies one of the leading positions due to its relatively low cost, high productivity, and ability to produce metallic and composite coatings with adjustable performance characteristics [6,7,8]. The process involves melting two consumable wires by an electric arc followed by atomization of the melt with a compressed gas stream. The thermal and kinetic states of the particles at the moment of impact on the substrate largely determine the microstructure, density, adhesion, and overall properties of the coating [9,10].
Nevertheless, ensuring stable adhesion strength and reproducibility of properties remains one of the central challenges in EAM. Numerous studies have shown that parameters such as arc current, carrier gas pressure, spray distance, wire feed rate, and spray angle influence the formation of the coating in a highly interdependent and often nonlinear manner [11,12,13]. For instance, Amir Darabi and Fardad Azarmi [14] reported that gas pressure and spray distance are dominant factors for Zn–Al coatings, whereas Gedzevičius and Valiulis [15] demonstrated that ignoring cross-interactions between parameters significantly reduces the accuracy of predicting adhesion strength and porosity. These findings emphasize the importance of considering parameter interactions and not limiting optimization to individual variables.
To address this complexity, modern approaches to process optimization rely on statistical methods of experimental design. Response surface methodology (RSM), in combination with analysis of variance (ANOVA), allows identification of significant parameters and their interactions, construction of second-order regression models, and prediction of coating properties near optimal conditions [16,17,18,19]. Several studies have demonstrated that optimization of spray parameters must account for the dynamic behavior of molten particles. For example, Fukumoto et al. [20] proposed a physical criterion for the splashing behavior of molten particles during thermal spraying, showing that impact dynamics and substrate temperature critically determine splat flattening and adhesion. Zhou et al. [21] further demonstrated that the presence and composition of a bond coat significantly affect the energy transfer and bonding mechanisms at the interface, emphasizing that neglecting the coupling between process and material parameters can reduce the accuracy of adhesion prediction and coating performance.
Despite these advances, many studies remain limited to single-stage optimization, which often leads to the identification of only local maxima and does not involve systematic verification near the global optimum [22,23,24]. Moreover, synergistic effects—such as the combined influence of spray pressure and distance (P × L)—are either considered superficially or ignored, which reduces the accuracy of predictions and hinders the development of reliable industrial recommendations.
At the same time, recent investigations have highlighted the potential of hybrid surface treatments combining arc spraying with additional modification methods. For example, laser post-treatment and hydrophobization of arc-sprayed coatings have been shown to provide enhanced corrosion protection for light alloys [25], while plasma texturing methods enable scalable fabrication of superhydrophobic metallic surfaces [26]. These approaches demonstrate that arc-sprayed coatings can serve as a platform for multifunctional surfaces. However, they also reinforce the need for a deeper understanding of how EAM process parameters determine coating adhesion, structure, and performance, particularly when aiming for reproducibility in industrial practice.
In this study, we address these gaps by developing a two-stage optimization strategy that combines statistical modeling with physical and mechanical justification of the processes. At the first stage, RSM and ANOVA are used to establish a second-order regression model describing the relationship between key process parameters and adhesion strength of EAM coatings. At the second stage, the model is refined and validated through physical interpretation, including calculation of particle kinetic energy, estimation of residual thermoelastic stresses, and experimental fine-tuning in the region of the global optimum.
The scientific novelty of this work lies in the integration of statistical optimization methods with physical and mechanical analysis, which ensures a transition from purely mathematical description to engineering-based recommendations for industrial application of EAM. Unlike most studies limited to one-step statistical treatment, the present research demonstrates and quantitatively confirms the decisive role of the P × L interaction in determining adhesion strength. Building on recent works on EAM parameter optimization [4,7], our study not only applies a two-step optimization (CCD/RSM followed by experimental refinement) but also provides an independent validation of the results and a physics-based rationale. This makes it possible to define narrow, industry-applicable operating windows that enhance coating adhesion, wear resistance, and reproducibility, bridging the gap between laboratory studies and industrial implementation.

2. Materials and Methods

2.1. Materials

Structural carbon steel grade 65 G [27] of the following chemical composition, wt%, was used as substrates: Mn—0.90–1.20; C—0.62–0.70; Si—0.17–0.37; Cu ≤ 0.20; Ni ≤ 0.25; Cr ≤ 0.25; S ≤ 0.035; P ≤ 0.035. The samples were fabricated as disks with a diameter of 25 mm and a thickness of 5 mm. Before sputtering, the surface was mechanically cleaned with an abrasive wheel to the degree Sa 3 according to ISO 8501-1, after which it was degreased with acetone.
The material for electric arc sputtering was steel casting wire 30XГCA (GOST 4543-2016, Diameter 1.6 mm; Severstal-Metiz, Cherepovets, Russia) with a diameter of 1.6 mm, characterized by high atomization and good adhesion to the steel substrate. Compressed air, purified from moisture and oil, supplied under controlled pressure, was used as a carrier gas.

2.2. Equipment

The sputtering was carried out on an SX-600 electric arc metallization machine (Guangzhou Sanxin Metal S&T Co., Ltd., Guangzhou, China) with adjustable current, gas pressure, and distance from the nozzle to the substrate.
The adhesion strength of the coating to the substrate was determined by the tear-off method according to the ASTM D4541 standard using the WDW-100KH universal testing machine (Laryee Technology Co., Beijing, China) with program control and load range up to 100 kN.
A universal high-strength adhesive with shear strength ≥ 70 MPa was used to fix the hook, and the curing time was 2 h at 120 ± 1 °C. Before bonding, the surfaces were sanded to a roughness of R(a) ≈ 2.5 μm (ISO 4287) to minimize adhesion variations due to differences in microrelief.

2.3. Experimental Design and Parameter Ranges

The experiment was planned using a central composite plan (CCD) within the RSM [28], which ensured that both linear and quadratic dependencies as well as crossover factor interactions were investigated. The chosen parameter values were aligned with literature data and pre-test results [7,29], which excluded regimes with apparently low adhesion and ensured representativeness for practical applications. The final parameter ranges (I: 186–314 A, P: 4–6 bar, L: 106–194 mm) were determined based on these findings. Preliminary tests revealed a significant decrease in adhesion outside these ranges, confirming the appropriateness of their selection for statistically sound experimental design.

2.4. Conducting the Experiments

A total of 17 experiments were conducted in the first series (Table 1), including factor, axial, and center points to ensure the statistical stability of the model.
For each combination of parameters, at least three samples were sputtered and then the adhesion strength was determined. Mean values and standard deviations (SDs), as well as the coefficient of variation (CV = SD/mean × 100%), were calculated. For the majority of points CV did not exceed 5%, which, according to the generally accepted criterion, confirms high reproducibility of the obtained results.
To clarify the behavior of the model near the optimum (Table 2), the second series of experiments (9 observations) with narrowed parameter ranges was carried out.

2.5. Mathematical Modeling

The dependence of coating adhesion strength on process parameters was described by a second-order polynomial regression model:
Y = b 0 + b 1 X 1 + b 2 X 2 + b 3 X 3 + b 12 X 1 X 2 + b 13 X 1 X 3 + b 23 X 2 X 3 + b 11 X 1 2 + b 22 X 2 2 + b 33 X 3 2
where: Y—coating adhesion strength; X1—current strength (I); X2—carrier gas pressure; (P); X3—distance from nozzle to bed (L); b0…b33—model coefficients calculated by the least squares method.

2.6. Diagnostics, Validation, and Data Processing

The quality of the constructed second-order regression model was evaluated using the coefficient of determination (R2) to determine the degree of fit of the predicted values to the experimental data, residual plot analysis to identify systematic deviations, and contour and three-dimensional plots of the response surface to visualize the interactions between the parameters and determine the region of optimum. Control tests in the zone corresponding to the predicted global extremum showed that the deviation of the predicted adhesion values from the experimental ones did not exceed 8.5%, which confirms the high accuracy of the model.
Model construction and analysis, calculation of coefficients, and their statistical verification were performed in the R 4.3.0 environment (R Core Team, Vienna, Austria). Analysis of variance (ANOVA) was used to assess the significance of factors at the significance level α = 0.05. Analysis of residuals confirmed that the assumptions of regression analysis were fulfilled. Visualization of response surfaces and contour plots was performed using the ggplot2 package, version 3.4.4.

3. Results

The study analyzed the effect of three process parameters of electric arc sputtering—current intensity (I), carrier gas pressure (P), and distance from nozzle to substrate (L)—on the adhesion strength of the coating. The interpretation of the results was performed taking into account the physical and mechanical mechanisms of interfacial bond formation and verified using a second-order polynomial regression model constructed by RSM.

3.1. Main Effects of Individual Factors (P, L, I)

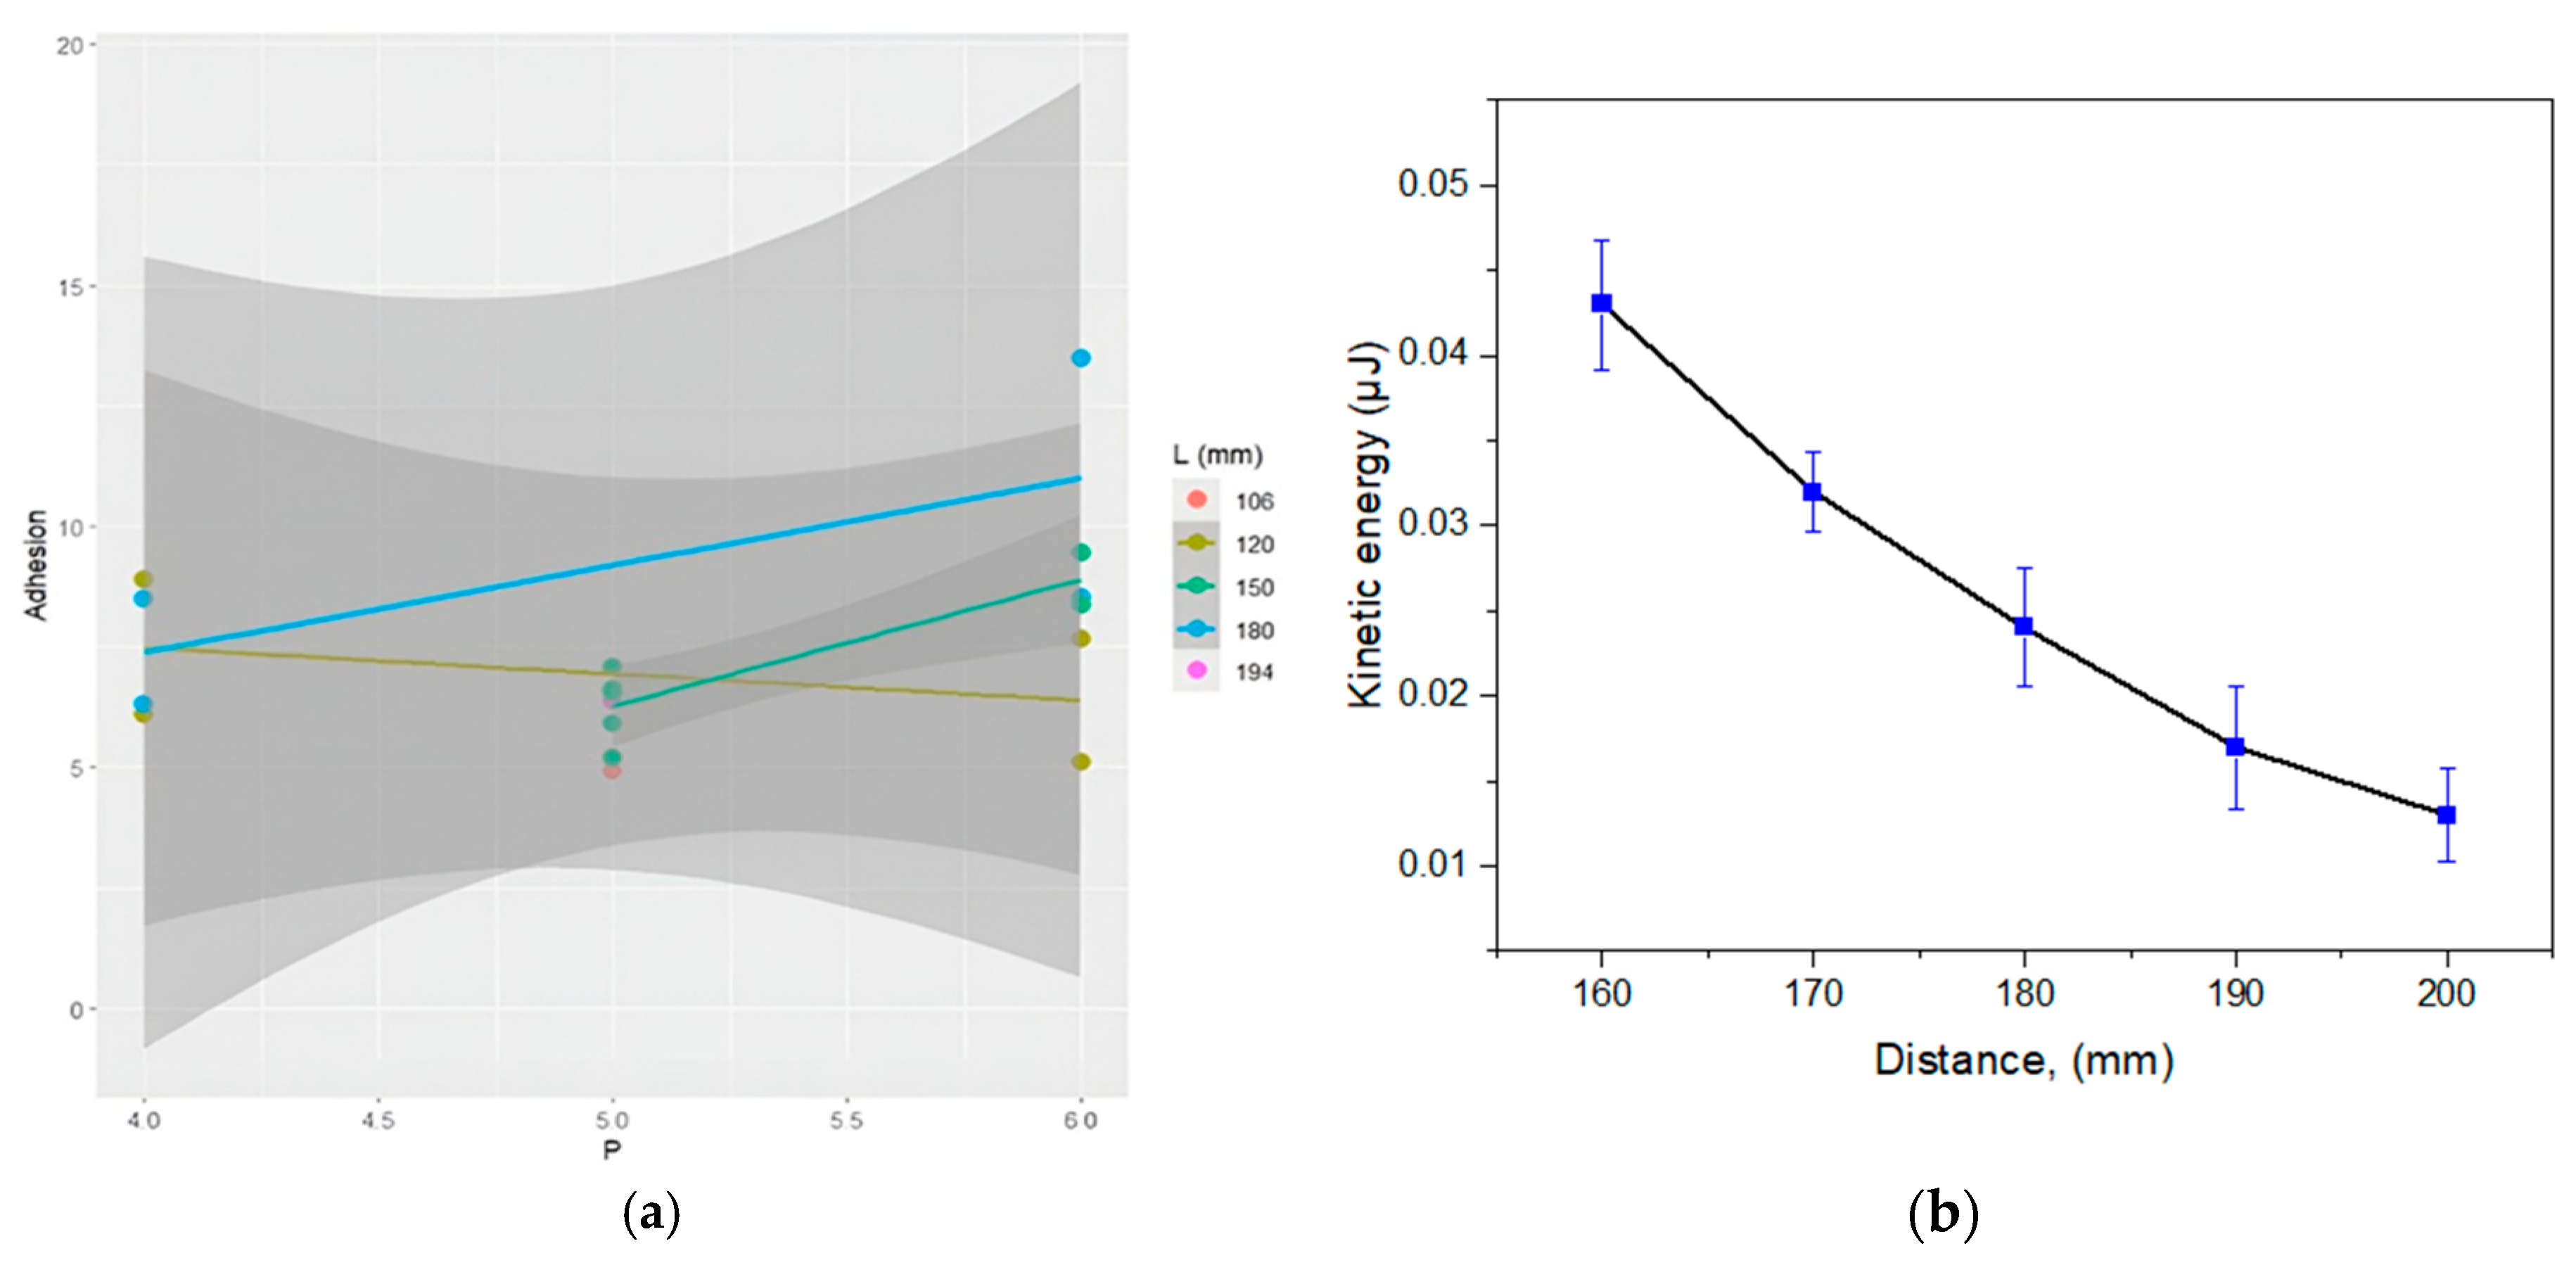
Figure 1 summarizes the main effects of P, L, and I on adhesion strength. Increasing pressure from 4.0 to 6.0 bar generally increases adhesion, particularly near L ≈ 180 mm. The stand-off distance shows a nonmonotonic behavior with an optimum around 175–190 mm, while current has only a secondary influence within the investigated range (p > 0.1). These trends are consistent with the literature [30,31]. At L = 120 mm, increasing P shortens residence time and intensifies convective cooling, so particles reach the substrate underheated and adhesion decreases. In contrast, at L = 180 mm the longer flight preserves temperature, and the higher momentum at elevated P improves splat flattening, increasing adhesion.

3.2. Effect of Stand-Off Distance (L) and Physical Rationale

The distance L governs the thermal and kinetic state of particles at impact. At L < 150 mm, particles arrive overheated, which promotes excessive melting/flattening and microstructural inhomogeneity; at L > 190 mm, subcooling reduces splat plasticity and, consequently, adhesion (see Figure 2a). The optimum range of 175–190 mm ensures a semi-molten state and maximizes mechanical anchoring. Similar qualitative results were reported by Zhou J. et al. [21].
For a quantitative rationale we use a kinetic-energy model with aerodynamic deceleration [32]:
E k i n = 1 2 · m · ϑ 2
With m = 4 3 π r 3 ρ . Substitution gives
E k i n = 1 2 · 4 3 π r 3 ρ · ϑ 2
The velocity decays with distance L as
υ L = ϑ 0 · e k L   ϑ 2 L = ϑ 0 2 · e 2 k L
Hence,
E k i n L = 2 3 π r 3 ρ ϑ 0 2 · e 2 k L
where:
E k i n —kinetic energy of the particle, J; r —particle radius, m;   ρ —material density, kg/m−3; ϑ 0 —initial particle velocity, ms−1; k—aerodynamic braking coefficient, m−1; L—distance from nozzle to substrate, m.
Using r = 20 μm, ρ = 7800 kg/m3, ϑ 0 = 200 m/s, k = 15 m−1 the energy decreases from ≈0.043 to ≈0.013 μJ as L increases from 0.16 to 0.20 m, which agrees with the observed drop in adhesion under the same conditions (Figure 2b).

3.3. Interaction Between Pressure and Distance (P × L): Response Surface Analysis

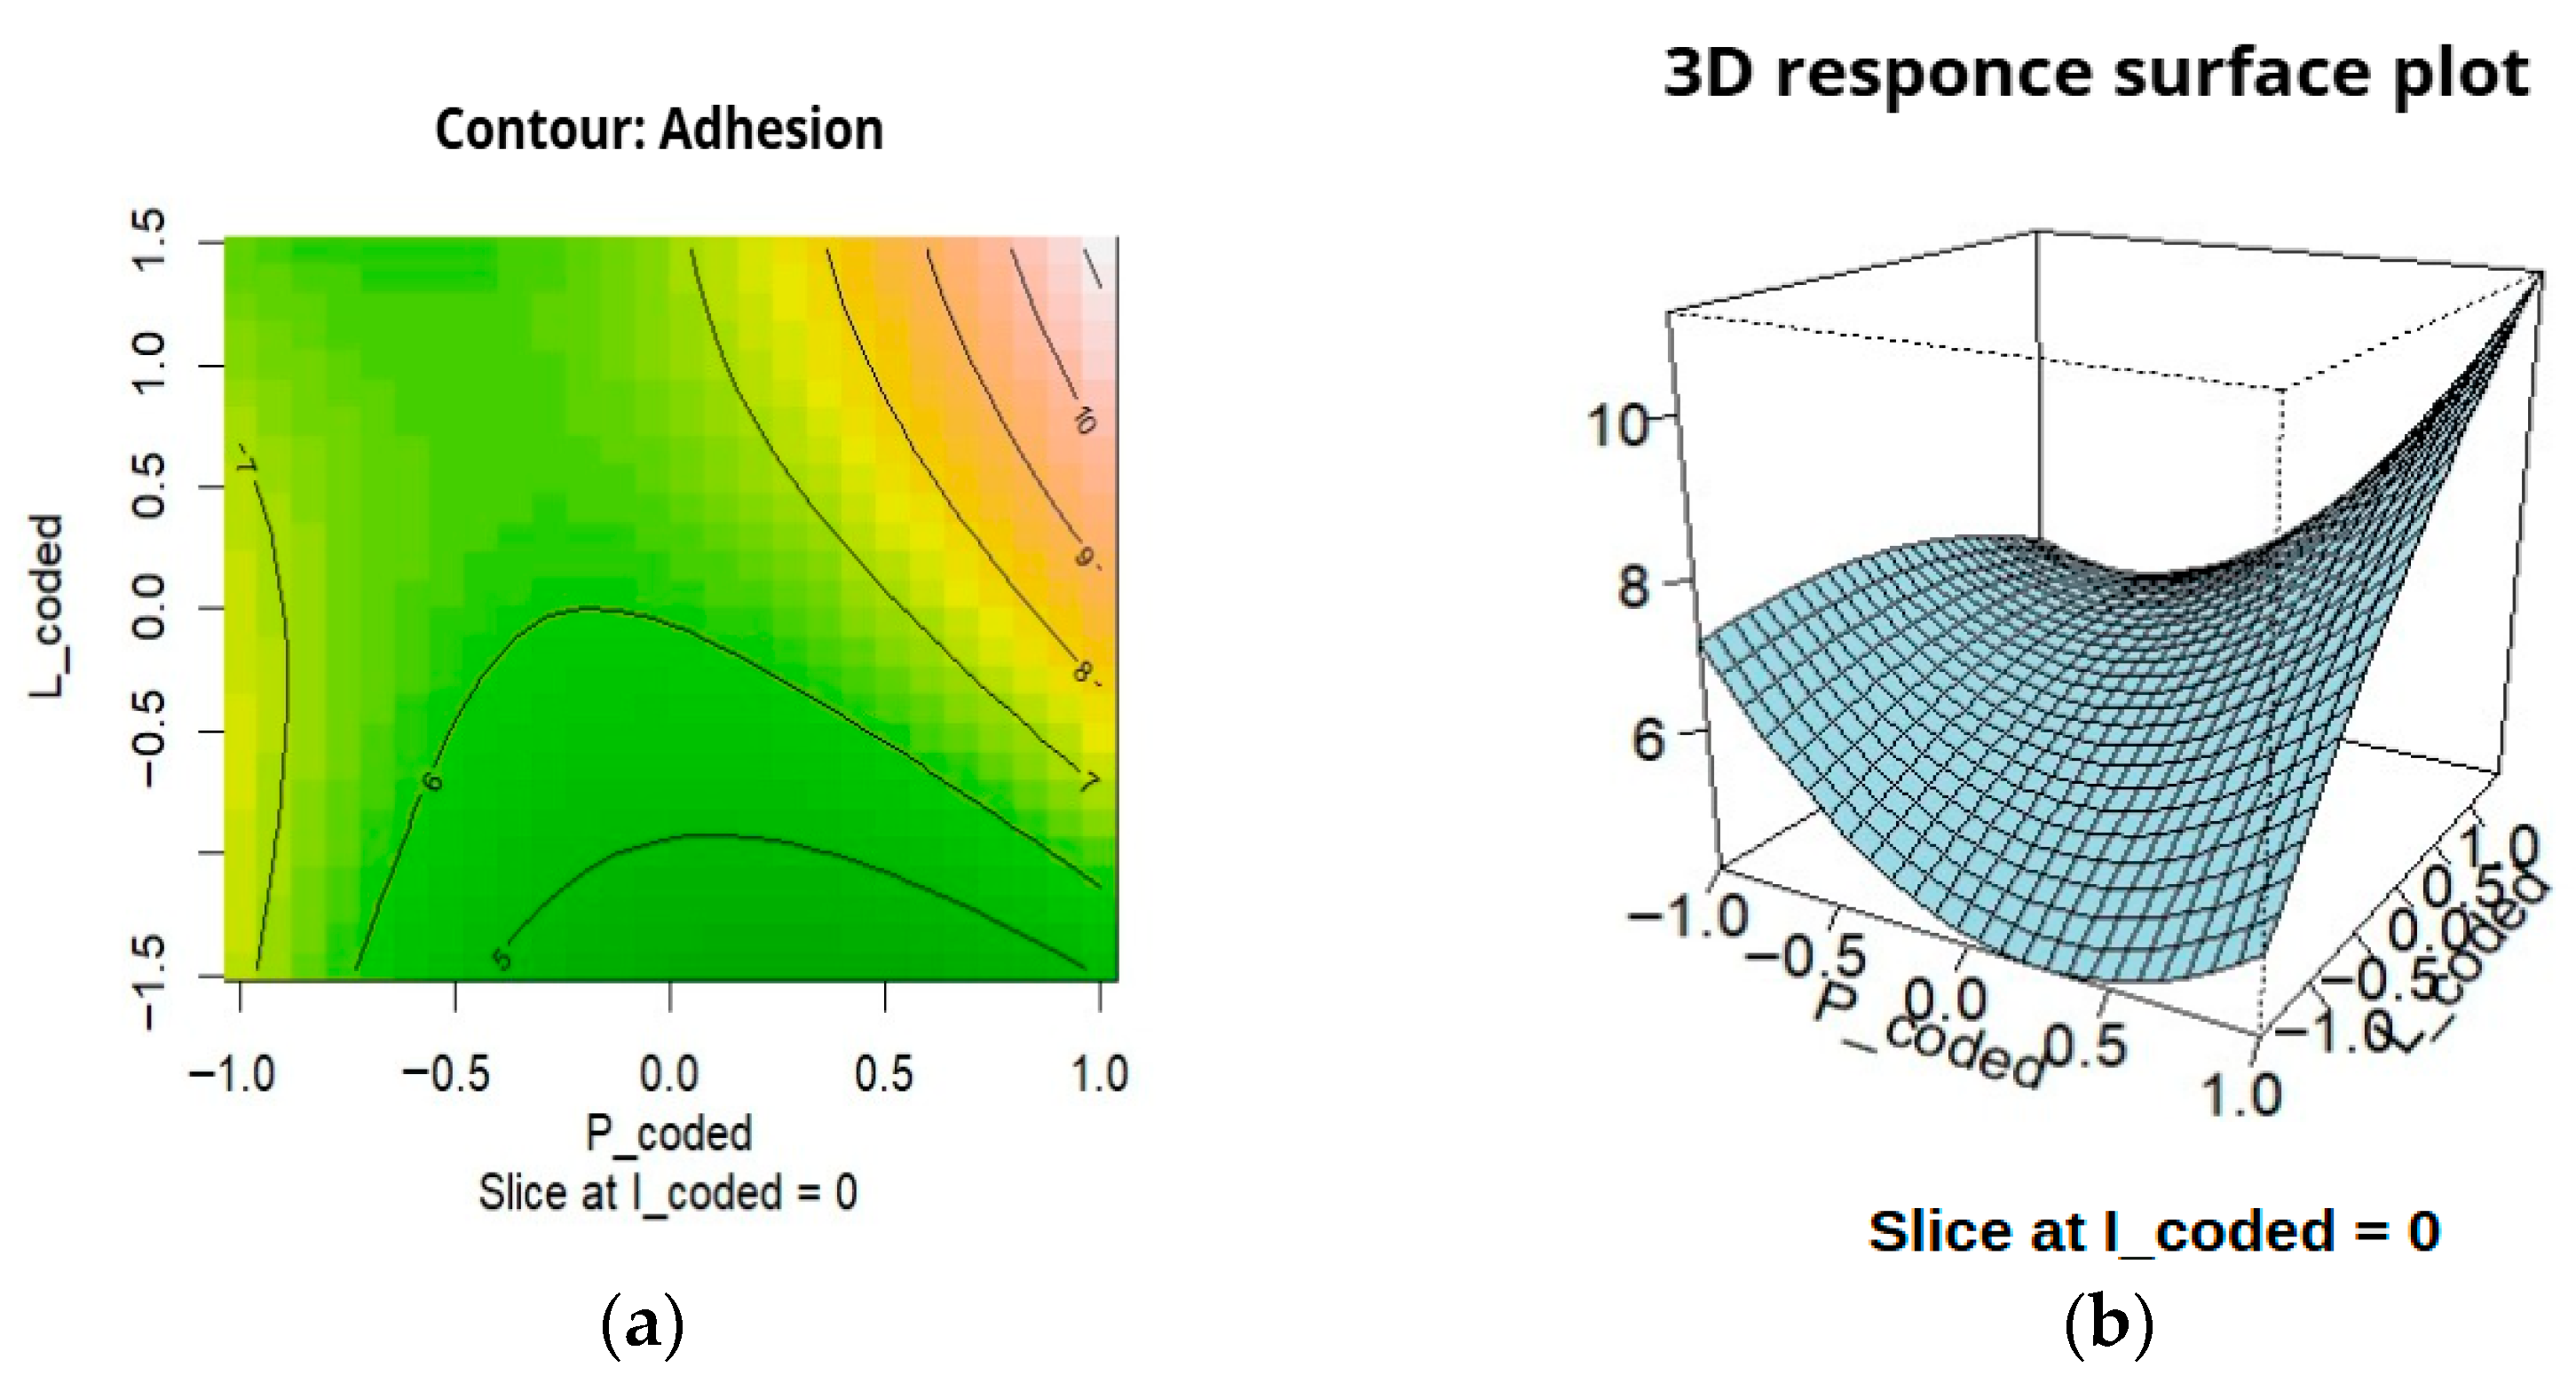
The largest contribution to the adhesion strength is made by the P × L interaction. Analysis of the response surface (Figure 3a,b) revealed a global maximum at P = 6.5 bar and L = 190 mm. Although the statistical significance (p = 0.079) does not strictly meet α = 0.05, in a high-variability process such as EAM this effect can still be regarded as practically significant—especially when supported by direct experimental confirmation. Spatial modeling also delineates zones of sharp adhesion drop upon deviations from the optimum, which is important for practical process tuning.

3.4. Validation and Reliability of the Model

Although the obtained R2 value (0.5877) is relatively low, it is considered acceptable for electric arc metallization processes characterized by inherently high variability. The model reliably captures the main trends and successfully identifies the optimum, while a significant part of the variance is due to other uncontrolled factors typical for EAM—such as minor fluctuations in arc stability and subtle variations in the substrate surface state.
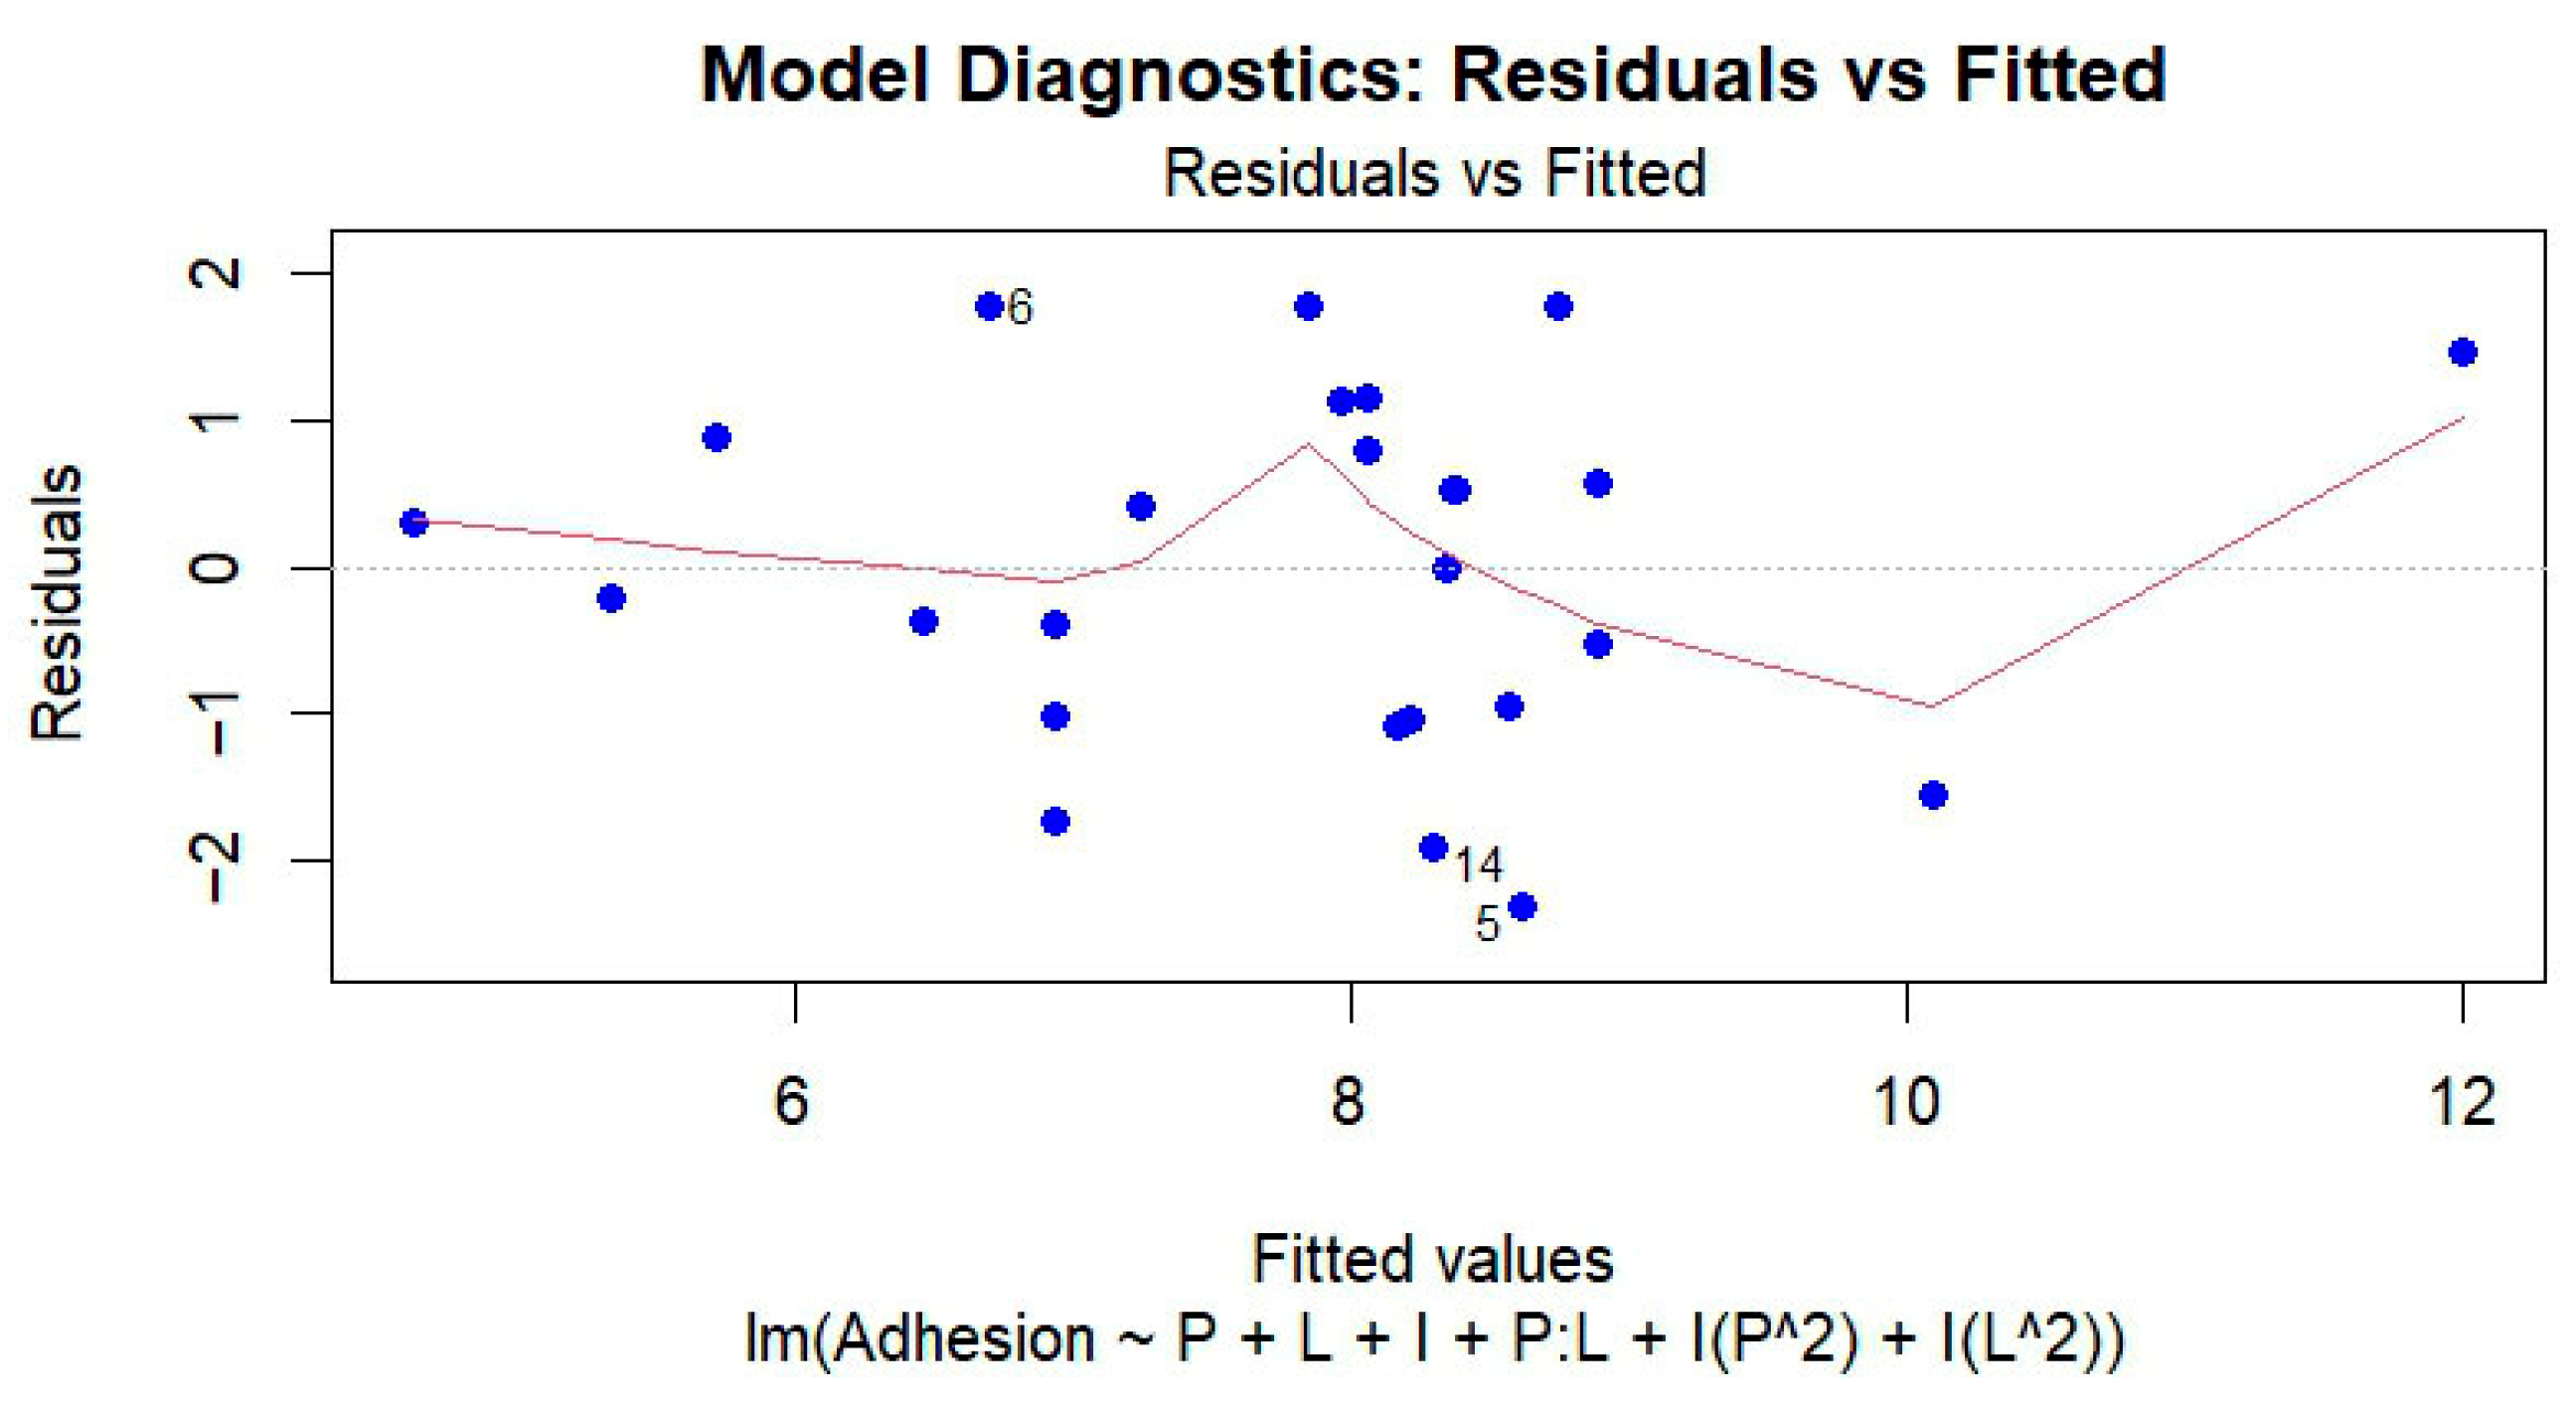
Control tests in the optimal mode (I = 200 A, P = 6.5 bar, L = 190 mm) gave a deviation from the calculated values of less than 8.5%, confirming the adequacy of the model. Analysis of the residuals (Figure 4) confirmed the fulfillment of the assumptions of the regression analysis. The solid horizontal line in Figure 5 corresponds to zero residuals, providing a reference for evaluating the distribution and symmetry of deviations between experimental and predicted values. Numeric labels near the points indicate experiment numbers from Table 1, allowing direct comparison with the input parameters. Therefore, despite the moderate R2, the model provides a valid predictive framework and is comparable to similar RSM studies [33]. To further improve prediction accuracy in future studies, dimensionality reduction methods (e.g., PCA) and regularization techniques (e.g., Lasso regression) are recommended.
Residual thermal stresses affecting adhesion strength and scattering values arise during cooling of the coating due to the difference in the coefficients of linear thermal expansion of the coating and the substrate, as well as a significant temperature difference during the sputtering process. Their approximate estimation is performed by the theory of thermoelectricity of multilayer systems. For the case when the substrate is much stiffer than the coating and cooled together with it, the following expression is used:
σ r e s = E c E s E c 1 ν s + E s ( 1 ν c ) · ( α s α c ) · T
where E c E s are the elastic moduli of the coating and the substrate; ν s   ν c   are their Poisson’s ratios; α s ,   α c are the coefficients of linear thermal expansion; T is the temperature difference.
In the special case, at E s E c , the equation is simplified to:
σ r e s E c 1 ν c · ( α s α c ) · T
It is this approximate form that is used in the present study to evaluate the stresses during the coating of 30CrHSA steel on a 65 G steel substrate.

3.5. Comparison with Experiment

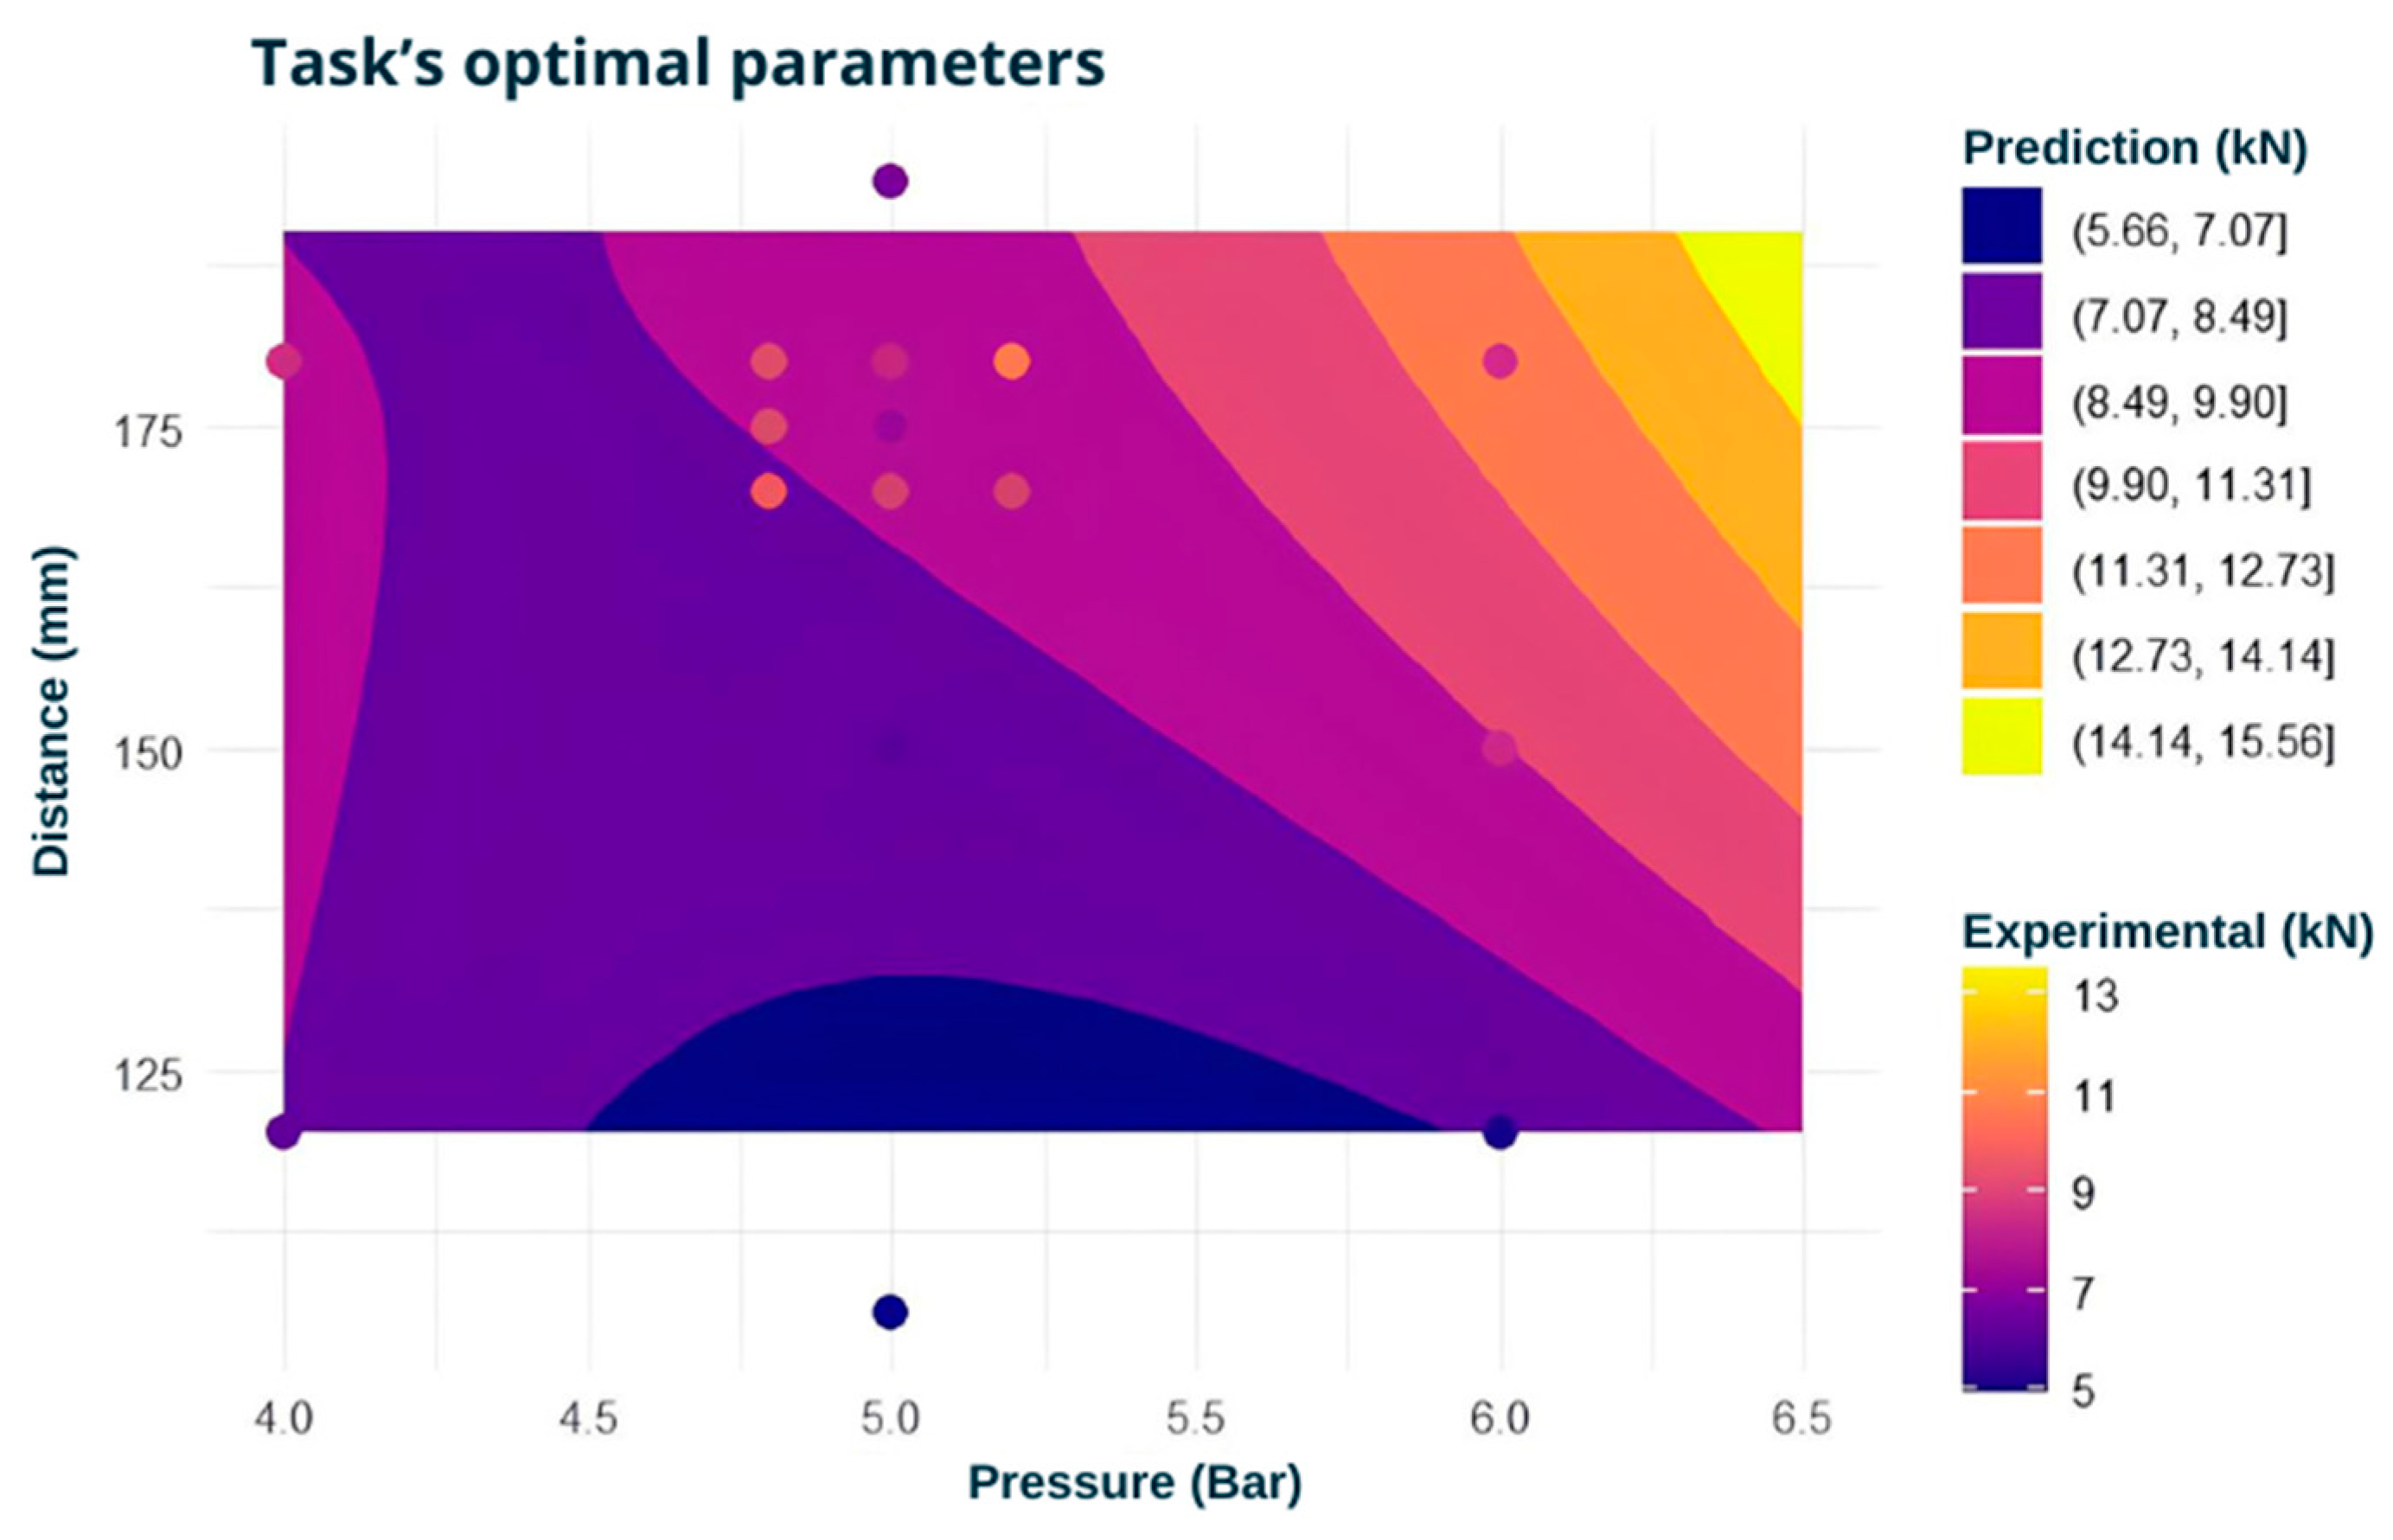
Comparison of the model and experimental data (Figure 5) showed that the areas of maximum adhesion (P = 5.2–5.5 bar; L = 175–180 mm) coincided with the prediction. The area of maximum is surrounded by an area of sharp gradient decrease in strength, which is also observed in the models [15,17].

3.6. Spatial Representation of the Optimum

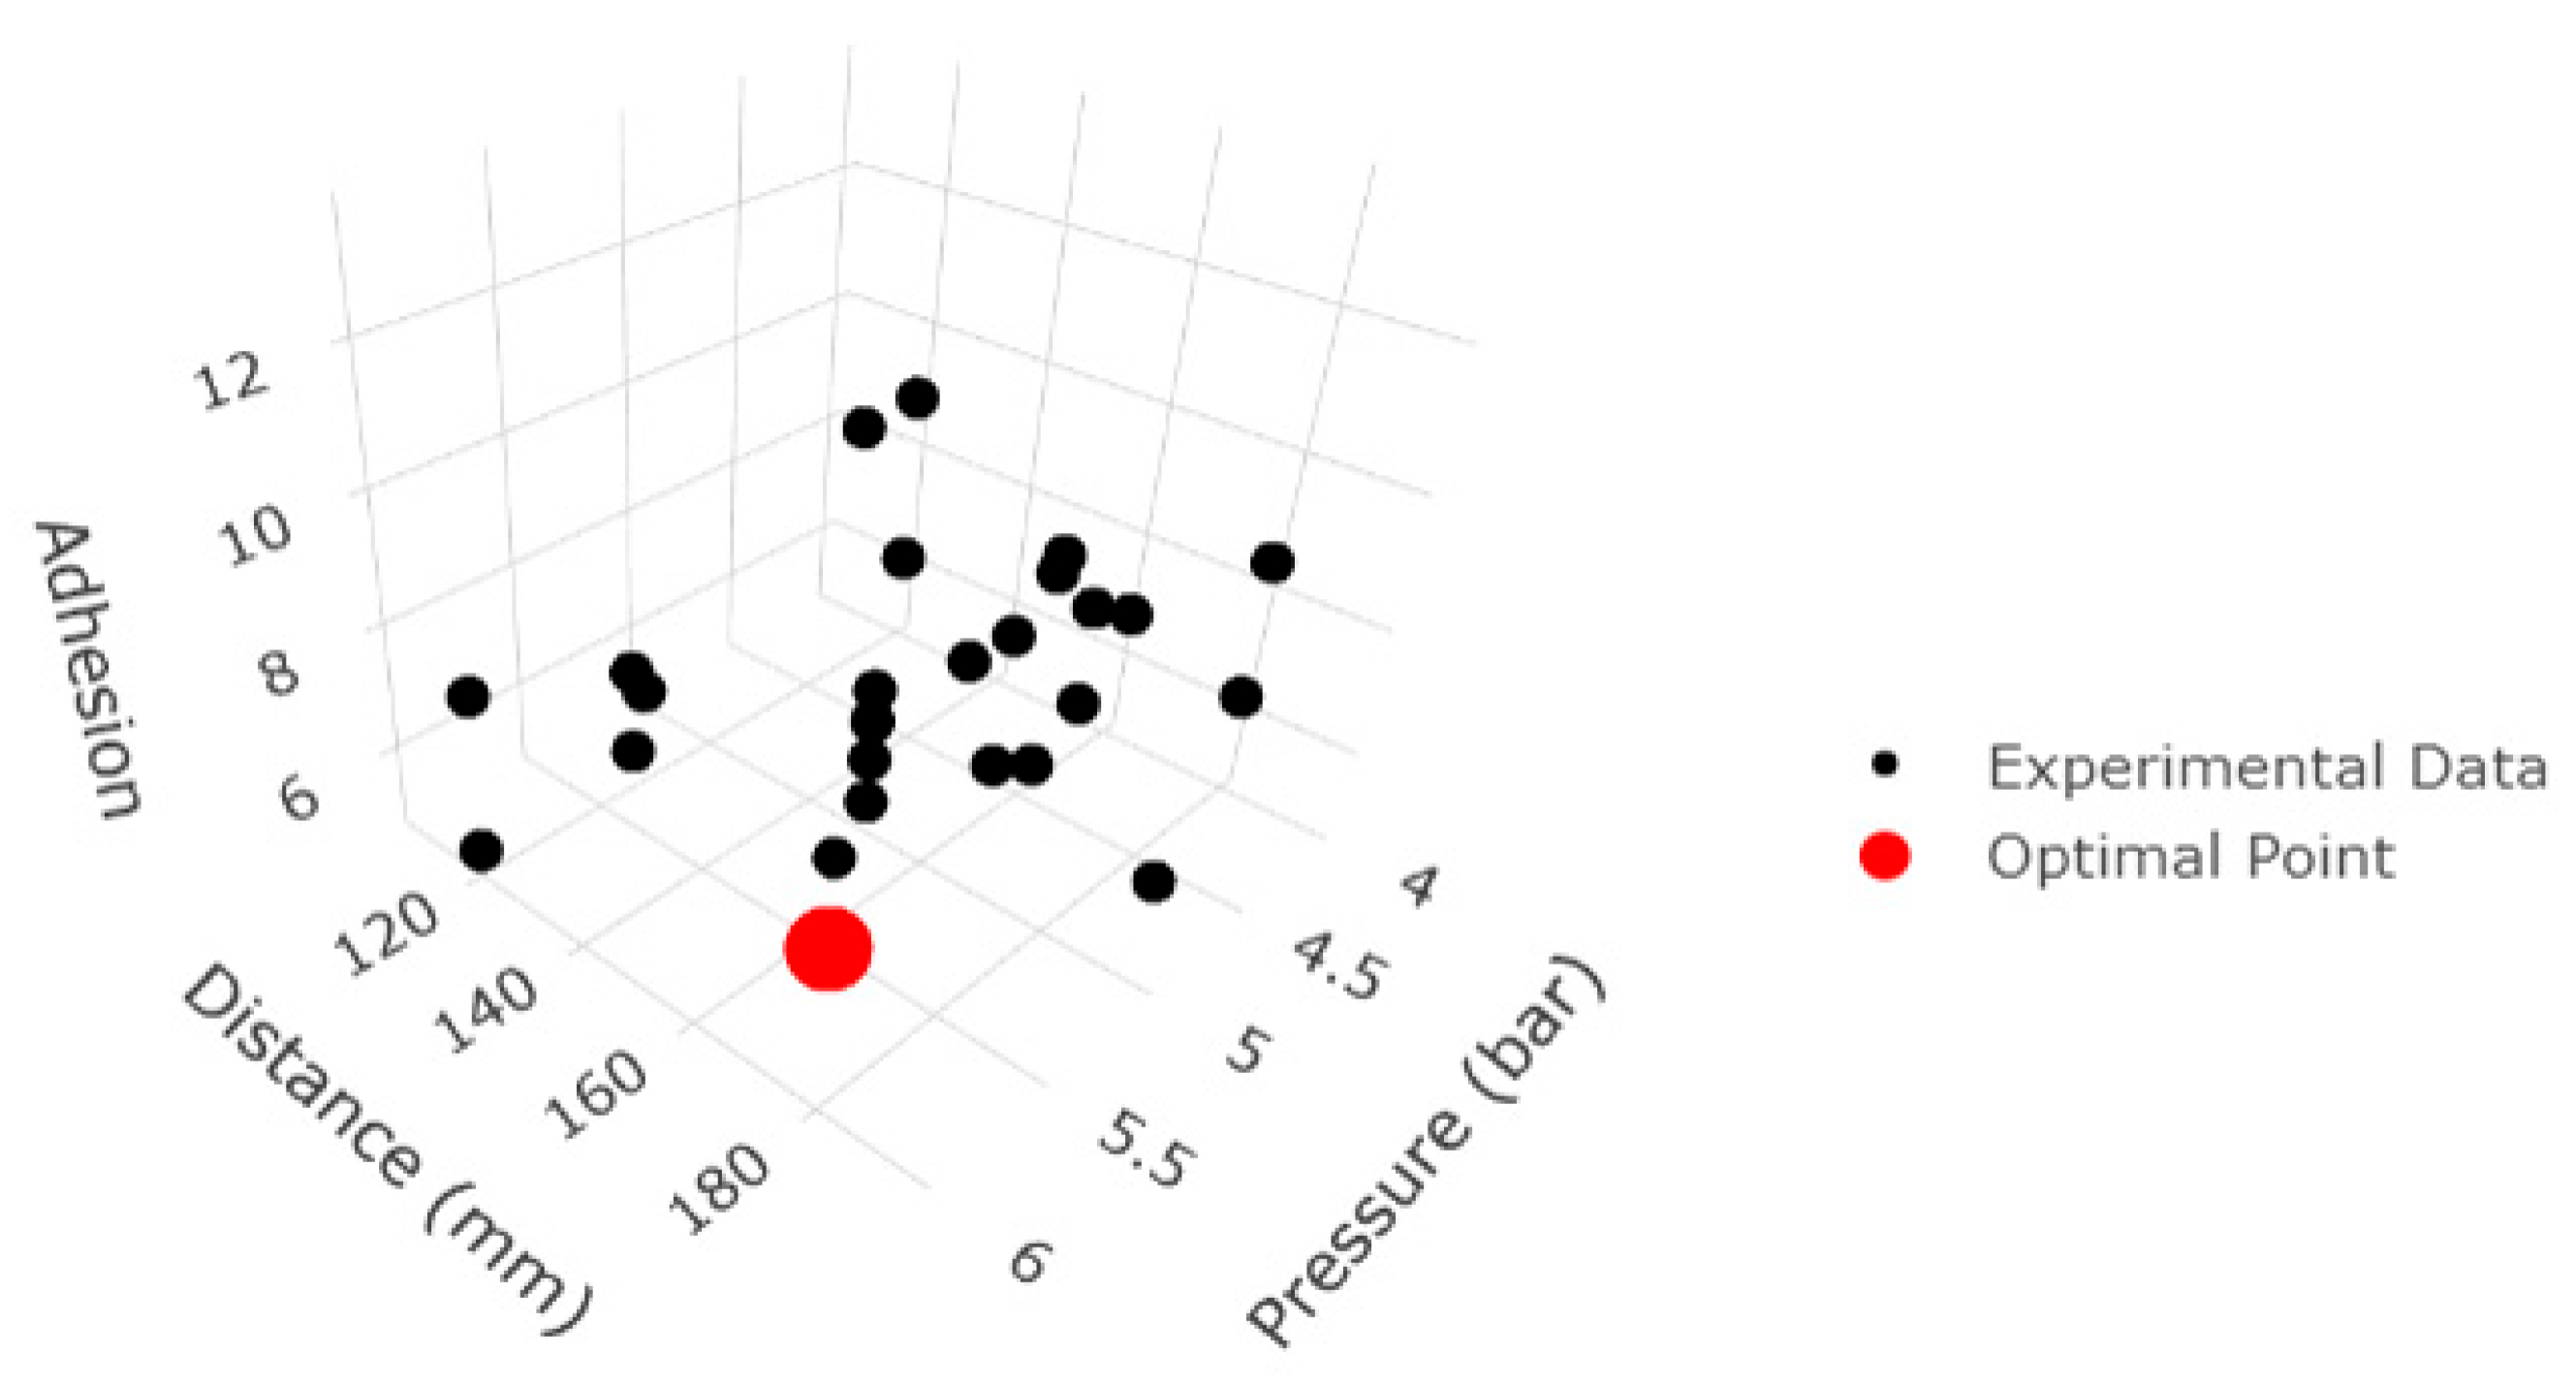
Figure 6 shows the distribution of the experimental data with the global maximum localized. Tests in this regime gave an adhesion of 13.50–14.70 kN with a calculated value of 15.39 kN, which confirms the high predictive accuracy of the model and agrees with the conclusions of [20].

3.7. Summary Generalization

Statistical and physical–mechanical analysis showed that: the key factor is the P × L interaction, which provides a balance of particle velocity and temperature; the current strength has a secondary influence and can be varied within acceptable limits without significant damage to adhesion; two-stage optimization with verification in the zone of extremum provides high prediction accuracy and allows forming practical recommendations for industrial applications.
The obtained results can be integrated into automated EAM process control systems to improve the stability and reproducibility of coating characteristics.

4. Conclusions

The central outcome of this research is the implementation of a two-step optimization methodology that combines statistical modeling (RSM and ANOVA) with experimental fine-tuning in the global extremum zone. This approach not only improves predictive accuracy but also bridges the gap between statistical description and physical–mechanical interpretation, providing a robust framework for industrial application of electric arc metallization.
In the course of the study, a second-order polynomial regression model describing the nonlinear relationship between current strength, carrier gas pressure, and the nozzle-to-substrate distance was constructed and experimentally confirmed. The interaction between pressure and distance (P × L) was identified as the decisive factor, while current strength had only a secondary influence. The average deviation between the calculated and experimental adhesion values did not exceed 9%, confirming the adequacy of the model.
The physical and mechanical interpretation, through the calculation of the kinetic energy of particles and residual thermoelastic stresses, made it possible to link the optimal modes to the micromechanisms of adhesion strength formation.
The practical significance of the work lies in the fact that the proposed parameter ranges (carrier gas pressure 6.4–6.6 bar, distance 185–195 mm, current 200–230 A) can be directly applied in industry. The developed methodology reduces the number of necessary experiments, lowers the cost of parameter selection, and ensures the reproducibility of coating properties. The results can be integrated into automated EAM process control systems within the concept of “smart manufacturing,” significantly expanding the possibilities of applying the method in mechanical engineering, energy, and equipment repair.

Author Contributions

Conceptualization, B.R.; methodology, N.M.; software, N.M.; formal analysis, M.B.; investigation, B.R.; resources, M.B.; data curation, N.M.; writing—original draft preparation, M.B.; writing—review and editing, N.M.; visualization, N.M.; supervision, B.R.; project administration, B.R.; funding acquisition, N.M. All authors have read and agreed to the published version of the manuscript.

Funding

This research was funded by the Committee on Science of the Ministry of Science and Higher Education of the Republic of Kazakhstan, under the IRN program № BR21882370.

Data Availability Statement

The original contributions presented in this study are included in the article. Further inquiries can be directed to the corresponding author.

Conflicts of Interest

Author Rakhadilov Bauyrzhan was employed by the company Plasma Science LLP. The remaining authors declare that the research was conducted in the absence of any commercial or financial relationships that could be construed as a potential conflict of interest.

References

  1. Mozetič, M. Surface Modification to Improve Properties of Materials. Materials 2019, 12, 441. [Google Scholar] [CrossRef]
  2. Maksakova, O.V.; Pogrebnjak, A.D.; Buranich, V.V.; Ivashchenko, V.I.; Baimoldanova, L.S.; Rokosz, K.; Raaen, S.; Malovana, N. Theoretical and experimental investigation of multiplayer (TiAlSiY)N/CrN coating before and after gold ions implantation. High Temp. Mater. Process. Int. Q. High-Technol. Plasma Process. 2021, 25, 57–70. [Google Scholar] [CrossRef]
  3. Rakhadilov, B.; Bayandinova, M.; Kussainov, R.; Maulit, A. Electrolyte-plasma surface hardening of hollow steel applicator needles for point injection of liquid mineral fertilizers. AIMS Mater. Sci. 2024, 11, 295–308. [Google Scholar] [CrossRef]
  4. Molbossynov, Y.; Rakhadilov, B.; Magazov, N.; Apsezhanova, A.; Kussainov, A. Impact of gas pressure and spray distance on coating formation in electric arc metallization. Phys. Sci. Technol. 2025, 12, 14–26. [Google Scholar] [CrossRef]
  5. Skakov, M.; Bayandinova, M.; Kozhakhmetov, Y.; Tuyakbaev, B. Microstructure and Corrosion Resistance of Composite Based on Ultra-High Molecular Weight Polyethylene in Acidic Media. Coatings 2025, 15, 89. [Google Scholar] [CrossRef]
  6. Horner, A.L.; Hall, A.C.; McCloskey, J.F. The effect of process parameters on Twin Wire Arc spray pattern shape. Coatings 2015, 5, 115–123. [Google Scholar] [CrossRef]
  7. Rakhadilov, B.; Buitkenov, D.; Apsezhanova, A.; Kakimzhanov, D.; Nabioldina, A.; Magazov, N. Selection of Optimal Process Parameters for Arc Metallization. Coatings 2025, 15, 300. [Google Scholar] [CrossRef]
  8. Ružbarský, J.; Panda, A. Plasma and Thermal Spraying; Springer: Berlin/Heidelberg, Germany, 2017. [Google Scholar]
  9. Palani, P.K.; Murugan, N. Selection of parameters of pulsed current gas metal arc welding. J. Mater. Process. Technol. 2006, 172, 1–10. [Google Scholar] [CrossRef]
  10. Carlsson, L.S.; Samuelsson, P.B.; Jönsson, P.G. Predicting the electrical energy consumption of electric arc furnaces using statistical modeling. Metals 2019, 9, 959. [Google Scholar] [CrossRef]
  11. Royanov, V.; Zakharova, I.; Lavrova, E. Development of properties of spray flow and nature of pressure distribution in electric arc metalization. Bocmoчнo-Еврoпейский журнал передoвых технoлoгий 2017, 6, 41–49. [Google Scholar] [CrossRef]
  12. Rakhadilov, B.; Muktanova, N.; Kengesbekov, A.; Magazov, N. Use of Computational Fluid Dynamics (CFD) Methods to Analyze Combustion Chamber Processes at HVOF Spraying and Their Comparison with Experimental Data. Modelling 2025, 6, 4. [Google Scholar] [CrossRef]
  13. Skakov, M.K.; Ocheredko, I.A.; Bayandinova, M.B.; Tuyakbaev, B.T. The impact of technological parameters of the torch to physical and chemical properties of a gas-thermal burner for spraying ultra-high molecular weight polyethylene. Phys. Sci. Technol. 2022, 9, 59–68. [Google Scholar] [CrossRef]
  14. Darabi, A.; Azarmi, F. Investigation on relationship between microstructural characteristics and mechanical properties of wire-arc-sprayed Zn-Al coating. J. Therm. Spray Technol. 2020, 29, 297–307. [Google Scholar] [CrossRef]
  15. Gedzevicius, I.; Valiulis, A.V. Analysis of wire arc spraying process variables on coatings properties. J. Mater. Process. Technol. 2006, 175, 206–211. [Google Scholar] [CrossRef]
  16. Yurdgülü, H.I.; Sadeler, R.; Koç, B. Optimization of multiple outputs of electric arc spray coating parameters for EN AW 7020-T6. Proc. Inst. Mech. Eng. Part E J. Process Mech. Eng. 2025, 09544089251317383. [Google Scholar] [CrossRef]
  17. Davis, J.R. Handbook of Thermal Spray Technology; ASM International: Almere, The Netherlands, 2004; p. 131. [Google Scholar]
  18. Montgomery, D.C. Design and Analysis of Experiments; Wiley: Hoboken, NJ, USA, 2017; p. 735. [Google Scholar]
  19. Myers, R.H.; Montgomery, D.C.; Anderson-Cook, C.M. Response Surface Methodology: Process and Product Optimization Using Designed Experiments; John Wiley & Sons: Hoboken, NJ, USA, 2016. [Google Scholar]
  20. Fukumoto, M.; Nishioka, E.; Nishiyama, T. New criterion for splashing in flattening of thermal sprayed particles onto flat substrate surface. Surf. Coat. Technol. 2002, 161, 103–110. [Google Scholar] [CrossRef]
  21. Zhou, J.; Jiang, J.; Deng, L.; Huang, J.; Yuan, J.; Cao, X. Influence of bond coat on thermal shock resistance and thermal ablation resistance for polymer matrix composites. Front. Mater. 2021, 8, 672617. [Google Scholar] [CrossRef]
  22. Ndumia, J.N.; Kang, M.; Gbenontin, B.V.; Lin, J.; Liu, J.; Li, H.; Nyambura, S.M. Optimizing parameters of arc-sprayed Fe-based coatings using the response surface methodology. J. Therm. Spray Technol. 2023, 32, 2202–2220. [Google Scholar] [CrossRef]
  23. Das, B.K.; Jha, D.N.; Sahu, S.K.; Yadav, A.K.; Raman, R.K.; Kartikeyan, M. Analysis of Variance (ANOVA) and Design of Experiments. In Concept Building in Fisheries Data Analysis; Springer: Singapore, 2022; pp. 119–136. [Google Scholar]
  24. Rakhadilov, B.; Muktanova, N.; Seitkhanova, A.; Kakimzhanov, D.; Dautbekov, M. Investigation of the Influence of the Oxygen Flow Rate on the Mechanical, Structural and Operational Properties of 86WC-10Co-4Cr Coatings, as Determined Using the High-Velocity Oxyfuel Spraying Method. Coatings 2024, 14, 1275. [Google Scholar] [CrossRef]
  25. Boinovich, L.B.; Domantovsky, A.G.; Emelyanenko, A.M.; Emelyanenko, K.A. Synergism of Arc Spraying, Laser Processing, and Hydrophobization for Long-Lasting Corrosion Protection of MA8 Magnesium Alloy. Adv. Eng. Mater. 2025, 27, 2401708. [Google Scholar] [CrossRef]
  26. Ellinas, K.; Dimitrakellis, P.; Sarkiris, P.; Gogolides, E. A Review of Fabrication Methods, Properties and Applications of Superhydrophobic Metals. Processes 2021, 9, 666. [Google Scholar] [CrossRef]
  27. GOST 14959-2016; Spring Nonalloy and Alloy Steel Product. Specifications. Standartinform: Moscow, Russia, 2016.
  28. Branch, B.; Ionita, A.; Clements, B.E.; Montgomery, D.S.; Jensen, B.J.; Patterson, B.; Dattelbaum, D.M. Controlling shockwave dynamics using architecture in periodic porous materials. J. Appl. Phys. 2017, 121, 13. [Google Scholar] [CrossRef]
  29. Rakhadilov, B.; Magazov, N.; Kakimzhanov, D.; Apsezhanova, A.; Molbossynov, Y.; Kengesbekov, A. Influence of Spraying Process Parameters on the Characteristics of Steel Coatings Produced by Arc Spraying Method. Coatings 2024, 14, 1145. [Google Scholar] [CrossRef]
  30. Bae, G.; Xiong, Y.; Kumar, S.; Kang, K.; Lee, C. General aspects of interface bonding in kinetic sprayed coatings. Acta Mater. 2008, 56, 4858–4868. [Google Scholar] [CrossRef]
  31. Mahendru, P.; Tembely, M.; Dolatabadi, A. Artificial intelligence models for analyzing thermally sprayed functional coatings. J. Therm. Spray Technol. 2023, 32, 388–400. [Google Scholar] [CrossRef]
  32. Strokovsky, E.A. Lectures on the Fundamentals of Kinematics of Elementary Processes. In University Book; University Book Publishing House: Moscow, Russia, 2010; 298p. (In Russian) [Google Scholar]
  33. Venkatachalapathy, V.; Katiyar, N.K.; Matthews, A.; Endrino, J.L.; Goel, S. A Guiding Framework for Process Parameter Optimisation of Thermal Spraying. Coatings 2023, 13, 713. [Google Scholar] [CrossRef]
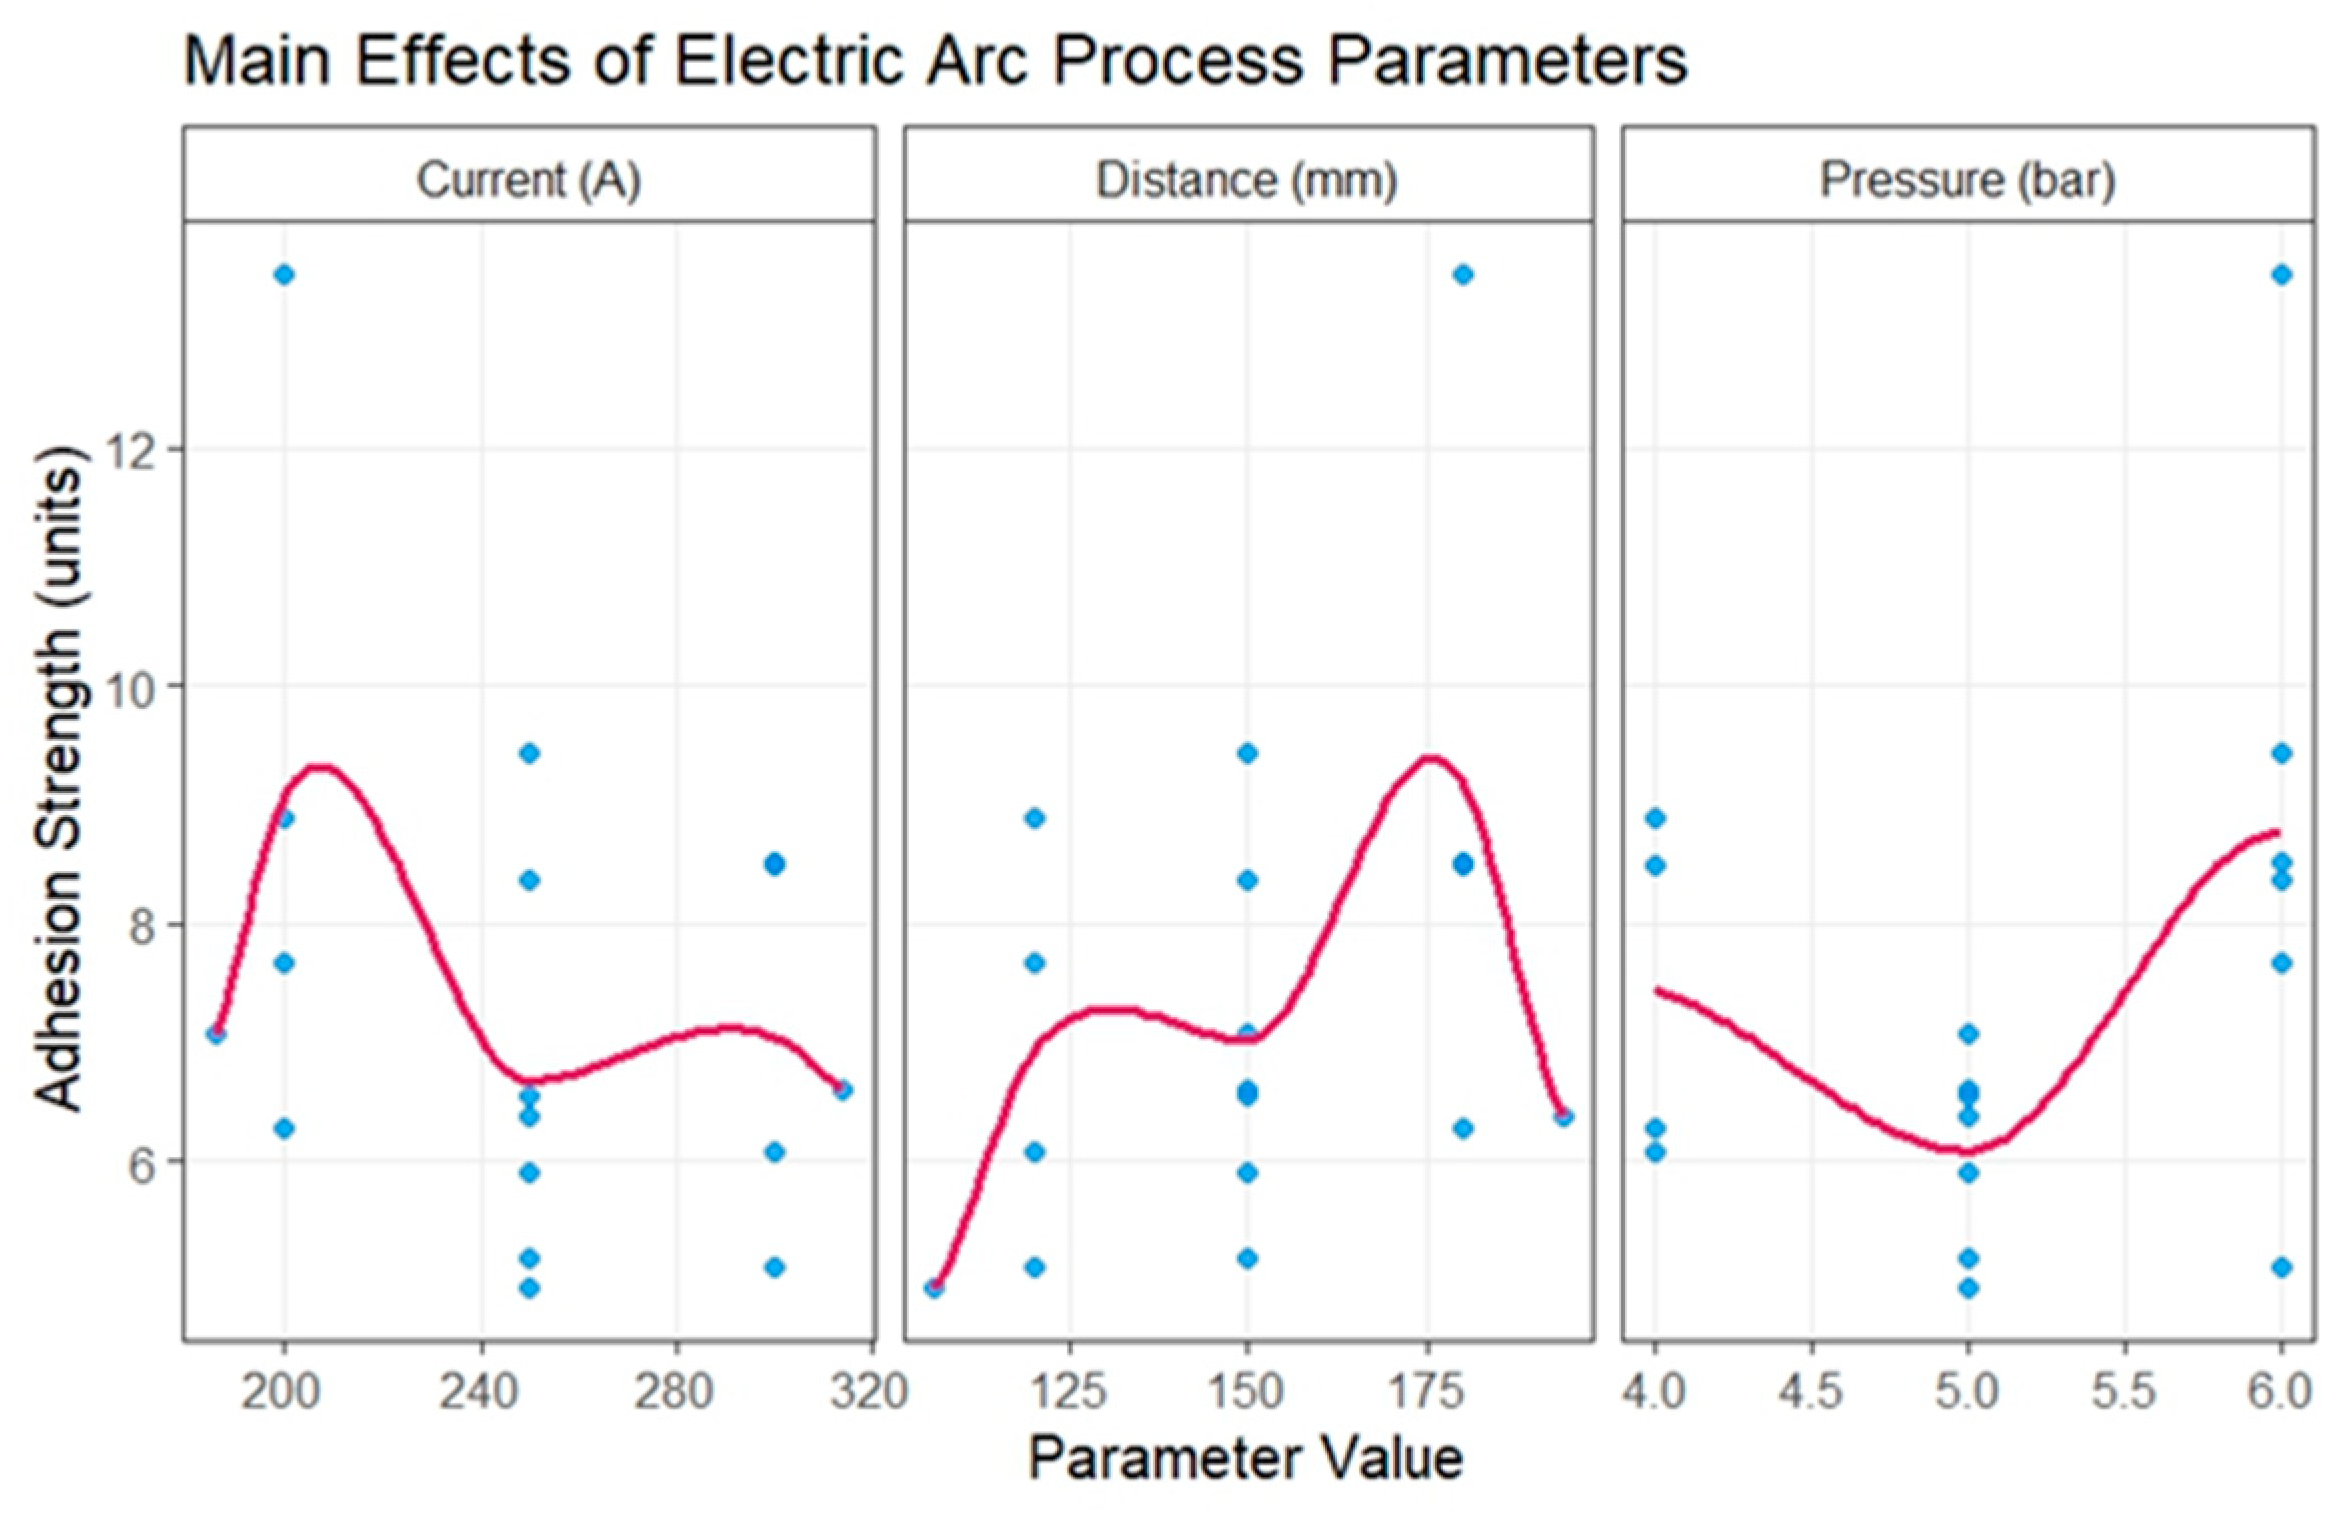
Figure 1. Main effects of electric arc metallization parameters on the adhesion strength of the coating.
Processes 13 03349 g001
Figure 2. (a) Dependence of adhesion strength on pressure at different stand-off distances (symbols encode L; error bars show ±SD; exact values are listed in Table 1); (b) attenuation of particle kinetic energy with distance.
Processes 13 03349 g002
Figure 3. Contour plot (a) and 3D response surface (b) showing the effect of pressure (P) and spraying distance (L) on the coating adhesion strength.
Processes 13 03349 g003
Figure 4. Residuals versus fitted values: scatter plot of residuals relative to the regression model. Numeric labels indicate experiment numbers from Table 1.
Processes 13 03349 g004
Figure 5. Contour diagram of the adhesion strength model response in pressure–distance coordinates with overlay of experimental values.
Processes 13 03349 g005
Figure 6. Spatial distribution of experimental data and optimal adhesion point in pressure–distance–strength coordinates.
Processes 13 03349 g006
Table 1. Parameters selected and adhesion values obtained.
I (A)P (Bar)L (mm)CommentAdhesion (kN)SD (±kN)
12004.0120factorial (−1, −1, −1)8.89120.39
23004.0120factorial (+1, −1, −1)6.08900.27
32006.0120factorial (−1, +1, −1)7.66440.34
43006.0120factorial (+1, +1, −1)5.12020.23
52004.0180factorial (−1, −1, +1)6.29240.28
63004.0180factorial (+1, −1, +1)8.48220.37
72006.0180factorial (−1, +1, +1)13.47300.59
83006.0180factorial (+1, +1, +1)8.53060.37
91865.0150axial (−α, 0, 0)7.08000.31
103145.0150axial (+α, 0, 0)6.59960.31
112504.0150axial (0, −α, 0)9.44740.41
122506.0150axial (0, +α, 0)8.36220.37
132505.0106axial (0, 0, −α)4.93100.22
142505.0194axial (0, 0, +α)6.37760.28
152505.0150center point (0, 0, 0)5.19220.23
162505.0150center point (repeat)6.54880.29
172505.0150center point (repeat)5.91980.26
Table 2. Results of refining experiments.
Current (A)Pressure (Bar)Distance (mm)Adhesion (kN)
(SD)
12304.81709.62 (±0.28)
22305.01709.08 (±0.27)
32305.21709.21 (±0.27)
42304.81758.85 (±0.26)
52305.01757.16 (±0.21)
62305.21758.34 (±0.24)
72304.81808.89 (±0.26)
82305.01807.61 (±0.22)
92305.218010.52 (±0.31)
Disclaimer/Publisher’s Note: The statements, opinions and data contained in all publications are solely those of the individual author(s) and contributor(s) and not of MDPI and/or the editor(s). MDPI and/or the editor(s) disclaim responsibility for any injury to people or property resulting from any ideas, methods, instructions or products referred to in the content.