Article

Study on the Thermodynamic Behavior of Large Volume Liquid Hydrogen Bottle Under the Coupling of Different Motion States and Operational Parameters

1
Special Equipment Safety Supervision Inspection Institute of Jiangsu Province, Changzhou 213125, China
2
School of Safety Science and Engineering, Changzhou University, Changzhou 213164, China
*
Author to whom correspondence should be addressed.
Processes 2025, 13(10), 3340; https://doi.org/10.3390/pr13103340
Submission received: 26 September 2025 / Revised: 13 October 2025 / Accepted: 14 October 2025 / Published: 18 October 2025
(This article belongs to the Section Chemical Processes and Systems)

Abstract

To investigate the variations in the thermodynamic behavior of large-volume liquid hydrogen tanks under different influencing factors, a numerical model for liquid hydrogen tanks was developed. The changes in thermodynamic behavior in vehicle-mounted liquid hydrogen bottles under different motion states, different operational pressures, and different insulation thicknesses, and their mutual coupling scenarios were studied. The results show that the movement makes the phase state in the liquid hydrogen bottle more uniform, the pressure drop rate faster, and the temperature lower: the heating rate in the liquid hydrogen bottle at 0.85 MPa operational pressure is lower than that at 0.5 MPa and 1.2 MPa. When the operational pressure is coupled with the motion state, the influence of the motion state on the thermodynamic behavior of the fluid is dominant: the temperature near the wall rises rapidly. The temperature near the tank wall rises rapidly; however, as the thickness of the insulation layer increases, both the heating rate inside the liquid hydrogen tank and the temperature difference within the tank gradually tend to stabilize and become uniform.

1. Introduction

With the advancement of science and technology, hydrogen energy has come into the spotlight of industrial development worldwide. In recent years, liquid hydrogen storage and transportation have garnered significant attention, primarily owing to their high volumetric energy density, small space occupation, and convenient transportation [1]. Large-volume on-vehicle liquid hydrogen tanks stand out among numerous liquid hydrogen containers due to their high mobility and large storage capacity. China has made great breakthroughs in the development of large-capacity vehicle liquid hydrogen storage systems. However, due to the small latent heat of liquid hydrogen vaporization, it is easy to evaporate, resulting in increased pressure in the container and the risk of explosion [2]. Therefore, it is particularly critical to study the influencing factors of the thermodynamic behavior of large-volume liquid hydrogen bottles for vehicles.
In recent years, a large number of scholars have conducted research on sloshing during the storage and transportation of liquid hydrogen. Zhu [3] et al. conducted a simulation study on the large-amplitude sloshing behavior of on-vehicle liquid hydrogen tanks under extreme acceleration, and concluded that large-amplitude sloshing leads to a decrease in the gas-phase temperature and an increase in the liquid-phase temperature inside the tank. Through numerical simulation, Hou et al. [4] explored the influence of different longitudinal external excitations on the volume fraction of liquid hydrogen in the tank under a microgravity environment. The results indicate that high-frequency excitation exerts a more significant influence on the volume fraction of liquid hydrogen than large-amplitude excitation. Liu et al. [5] investigated the effect of sinusoidal sloshing on the free surface of liquid hydrogen tanks via numerical simulation. It was found that the closer the free surface is to the tank wall, the larger the sloshing amplitude and the more significant the pressure variation. Smith et al. [6] established a thermodynamic model to study the evaporation rate of ship-borne liquid hydrogen storage tanks under different weather, motion speeds, and other factors, and concluded that sloshing can reduce the evaporation rate of liquid hydrogen. Jeon [7,8] studied the influencing factors of the thermodynamic characteristics of C-type fuel tank through the combination of experiment and simulation, and showed that the total amount of evaporated gas in the tank increased with the increase in the filling rate. Ryu et al. [9] simulated the fluid behavior of on-orbit liquid hydrogen storage tanks at different sloshing frequencies. The results show that the greater the sloshing frequency, the more evaporated gas is generated. Liu, Zheng, and Lv [10,11,12] investigated the effects of sinusoidal excitation on the parameters of liquid hydrogen storage tanks using numerical simulation methods. The results indicate that excitation exerts a significant influence on the thermal performance of the tank.
The variations in the thermodynamic behavior of liquid hydrogen tanks are mainly reflected in the pressure and temperature inside the tanks. Kang, Li, Jiang, and Wu et al. [13,14,15,16,17,18], respectively, conducted studies on the insulation layers of liquid hydrogen storage tanks, and proposed the advantages of applying multi-layer composite materials to the insulation layers of such tanks. Joseph J. et al. [19] investigated the impact of the insulation layer thickness on the internal storage tank through simulation. The results indicate that as the thickness of the insulation layer decreases, the thermal stratification inside the tank intensifies, and the internal pressure increases significantly. Wang, Shen, and Zhu et al. [20,21,22] investigated the influence of different parameters on the pressurization rate via simulation. It is concluded that the temperature in the vapor chamber and the mass transfer rate at the vapor–liquid interface are the two primary parameters that determine the pressurization rate. A.A. Boryaev et al. [23] summarized the calculation methods of liquid hydrogen filling, storage and transportation, pressurization, and discharge processes based on experiments and numerical simulations. D.O. Barnett [24] conducted experimental studies on the thermal stratification of liquid nitrogen and liquid oxygen in spherical tanks and found that the thermal stratification laws of spherical tanks and cylindrical tanks are similar. Xie, Zhu [25,26] studied the influence of temperature, pressure, and filling rate on the evaporation state of common cryogenic adiabatic cylinders through experiments and simulations. It was concluded that the evaporation rate of cryogenic cylinders increases with the increase in pressure and decreases with the decrease in filling rate, and the temperature has little effect on the temperature distribution in the gas phase. Shahin et al. [27] studied a technology to predict the heat transfer coefficient of liquid hydrogen in the tube through artificial intelligence, which improved the accuracy of prediction. Zhang et al. [28] proposed a thermodynamic behavior simulation scheme of liquid hydrogen from gas–liquid stratification to the critical state when the external temperature is constant, which greatly improves the simulation accuracy. Wang et al. [29] developed a semi-empirical analytical model to study the thermodynamic behavior of liquid hydrogen in low-filling-rate liquid hydrogen storage tanks. The study found that the thermal response of liquid hydrogen storage tanks is slow, and pressurization can slow down the evaporation of the heel liquid. The above scholars have focused on the variations in temperature and pressure inside liquid hydrogen tanks under different ambient temperatures and filling rate conditions.
From the above research, it can be seen that the current research at home and abroad mainly focuses on the thermodynamic behavior changes in liquid hydrogen containers under static or sinusoidal excitation shaking conditions. However, relatively few studies have focused on the thermodynamic behavior of liquid hydrogen tanks during startup or braking processes—i.e., under conditions of constant acceleration. This research gap is particularly notable regarding the influencing factors that affect the thermodynamic behavior of large-volume on-board liquid hydrogen tanks.
In the present study, the research object is defined as the large-volume on-board liquid hydrogen tank. With the engineering object as a reference, numerical simulation is employed to compare the thermodynamic behavior of large-volume on-board liquid hydrogen tanks under varying motion states, operating pressures, and insulation layer thicknesses. The change law provides a reference for the safe storage and transportation of large-volume vehicle-mounted liquid hydrogen bottles.

2. Numerical Theory Basis

2.1. Basic Conservation Equation

As a fluid, liquid hydrogen and its evaporated gas need to satisfy the basic conservation equation when they are stored and transported in a vehicle-mounted liquid hydrogen bottle [30]. The control equation is as follows:
Continuity equation:
ρ t + ( ρ u ¯ ) = S m
Momentum equation:
t · ρ u ¯ + ρ u ¯ u ¯ = P + μ + μ t u ¯ + u ¯ T + ρ g
Energy equation:
t · ρ E + u ¯ ρ E + p = K T + S t
where, t is time, s; ρ is the density, kg/m3; u ¯ is the average velocity vector, m/s; S m is the mass source term, kg/(s·m3); P is pressure, Pa; μ is the dynamic molecular viscosity, Pa s ; μ t is the turbulent viscosity, Pa·s; g is the acceleration of gravity, kg/m3; S t is the energy source term, W/m3; T is the temperature, K; E is the total energy per unit mass flow, J/kg; K is the thermal conductivity of fluid, W/(m·K).

2.2. Turbulence Model

During the storage and transportation of large-volume vehicle-mounted liquid hydrogen bottles, the internal fluid domain is in a turbulent state. The introduction of the standard kε model can improve the calculation efficiency under the premise of ensuring the accuracy of the calculation. The formula is as follows.
t · ρ k + x i · ρ k u i = x j · μ + μ t σ k · k x j + E k + E b ρ ε Y M
t · ρ ε + ρ u i ε x i = x j · μ + μ t σ ε · ε x j + E k + C 3 ε E b G 1 ε · ε k C 2 ε ρ · ε 2 k
where k is the turbulent kinetic energy, J; ε is the dissipation rate, m/s3; the turbulent kinetic energy generated by E k is the average velocity gradient, J; E b is the turbulent kinetic energy produced by the buoyancy effect, J; u i is the velocity component, m/s; μ t is the turbulent viscosity, Pa∙s; Y M is the effect of pulsating expansion on dissipation rate, J.

2.3. Evaporation–Condensation Model

In large-volume on-board liquid hydrogen tanks, liquid hydrogen undergoes phase changes during transportation due to factors such as environmental heat leakage. To accurately characterize the phase-change processes within the liquid hydrogen tank, the Lee model, which belongs to the evaporation–condensation model category, is incorporated for the simulation analysis [31]. The mass transfer equation involved in the Lee model is as follows:
α q ρ q t + α q ρ q V q = m ˙ l q m ˙ q l
m ˙ l q = r e v a α l ρ l · T l T s a t T s a t
m ˙ q l = r c o n α q ρ q · T s a t T q T s a t
Combined with the research of Yang, the heat and mass transfer of the gas–liquid two-phase interface is determined as follows:
S m = r e v a α l ρ l · T l T s a t T s a t   T l T s a t r c o n α q ρ q · T s a t T q T s a t   T s a t T l
S h = S m · H
where q is the gas phase; l is the liquid phase; α q is the gas volume fraction; α l is the liquid volume fraction; ρ q is the gas phase density, kg/m3; ρ l is the liquid phase density, kg/m3; V q is the gas phase velocity, m/s; m ˙ l q , m ˙ q l are the mass flow rate of evaporation and condensation, kg/(s·m3); T l is the liquid phase temperature, K; T s a t is the saturation temperature, K; T q is the gas phase temperature, K; r e v a   and r c o n are the evaporation and condensation coefficients, respectively, r e v a = 0.00001 , r c o n = 0.0001 can be obtained by trial and error method, s−1; H is the latent heat, kJ/kmol. The parameters such as the latent heat and saturation temperature of liquid hydrogen were determined by consulting the works of Chen et al. [32].

2.4. Theoretical Basis of Heat Conduction

Heat transfer in stationary fluids and solids occurs exclusively through thermal conduction, whereas in moving fluids, both thermal conduction and thermal convection are involved in the heat transfer process [33]. The internal fluid is affected by convective heat transfer during the movement of the liquid hydrogen storage bottle. The energy conservation equation considering the convective term is shown in Equation (10).
t · ρ c v T + x · ρ u c p T + y · ρ v c p T + z · ρ w c p T = x · k · T x + y · k · T y + z k · T z + S
where c v is the specific heat at constant volume, J/(kg·K); c p is the specific heat at constant pressure, J/(kg·K); u, v, w are the axial velocities of the x, y, z axes, respectively, m/s; S is the energy source term, J/(m3·s).

3. Structural Modeling of Large Volume Vehicle Liquid Hydrogen Bottle

The chosen large-volume on-board liquid hydrogen tank model, featuring a diameter of 1.2 m and a length of 2.3 m, serves as the reference for modeling. The internal storage tank measures 2 m in length and 1 m in diameter. The inner and outer storage tanks are the insulated layer and vacuum layer. The physical part and the model part of the liquid hydrogen bottle are given in Figure 1 and Figure 2, respectively. Connectors that are irrelevant to this simulation have been excluded.
The boiling point of liquid hydrogen is extremely low (about 20.369 K at standard atmospheric pressure), and the latent heat of vaporization is small. In the vehicle transmission, the chain reaction of ‘temperature rise–partial vaporization–pressure rise’ occurs easily due to external heat intrusion.
Before the start of transmission, the temperature of the liquid hydrogen in the liquid hydrogen bottle is maintained at the saturation temperature (initial setting of 20 K to avoid initial vaporization), and the gas phase temperature is gradiently stratified along the opposite direction of gravity (positive z-axis) (20 K~20.369 K). At this time, the gas–liquid two-phase is in dynamic equilibrium and the pressure is stable.
When the vehicle starts/brakes (constant acceleration), the liquid hydrogen shakes due to inertia, the disturbance of the gas–liquid interface intensifies, the contact area of the two phases increases, and the heat of the liquid phase is transferred to the gas phase, resulting in a slight increase in the liquid phase temperature. If the insulation layer is not insulated enough, the external heat continues to invade, and the liquid hydrogen temperature will gradually approach the saturation temperature, triggering a large amount of vaporization.
If the temperature continues to rise above the saturation temperature, the liquid hydrogen vaporizes violently, and the pressure in the bottle rises rapidly. It is necessary to release the evaporated gas (BOG) through the pressure relief valve to maintain the safe pressure. This process will further cause the liquid hydrogen temperature to drop (vaporization endothermic), forming a ‘heating–vaporization–cooling–reheating’ cycle.

3.1. Model Simplification

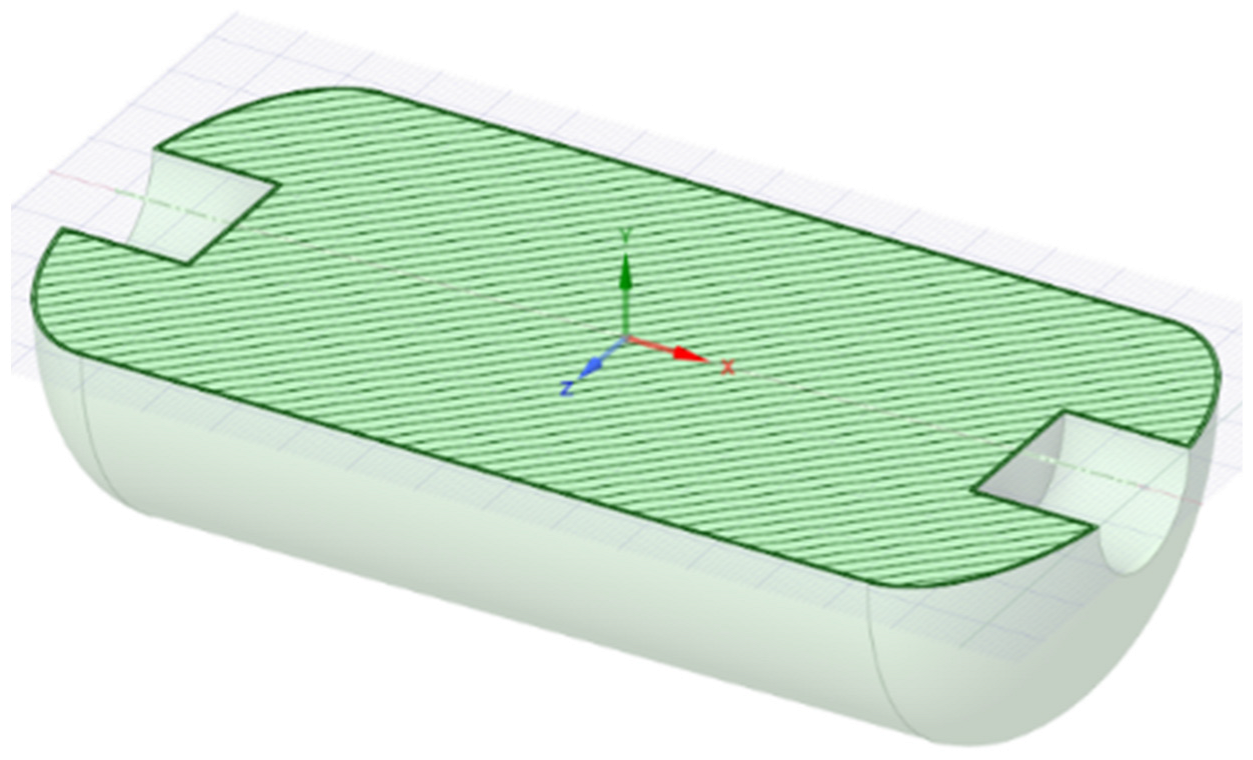
Drawing on the findings from Li et al. [34], the model was simplified: the insulation layer and the inner storage tank were selected as the computational domain, and an external heat source was applied to the outer wall of the insulation layer. The coordinate origin is positioned at the center of the fluid domain, with coordinates of (0 m, 0 m, 0 m). The structure of the insulation layer and its internal fluid domain, as well as the profile of the computational domain, are illustrated in Figure 3.

3.2. Mesh Generation and Boundary Conditions

3.2.1. Meshing

Using our previous research method [35], the model is divided into polyhedral meshes. A 10-layer boundary layer is set in the fluid domain near the tank wall, and the divided grid profile is shown in Figure 4.

3.2.2. Boundary Conditions and Initial Conditions

Using the heat flux density of the multi-layer insulation material (MLI) studied by Zheng [36] under low-temperature vacuum conditions, the heat leakage of the liquid hydrogen bottle is calculated to be 10.55 W, which is set as the heat source heat of the external wall of the insulation layer. Qu [37] measured the thermal conductivity and other parameters of the liquid hydrogen storage bottle material in the liquid hydrogen storage bottle.
The initial temperature of the liquid hydrogen inside the liquid hydrogen tank is set to 20 K. For gaseous hydrogen, its temperature increases along the positive direction of the Z-axis, covering a range from 20 K to 20.369 K. Additionally, the operating pressure is specified at the coordinate point x, y, z (0 m, 0 m, 0.49 m). The operating pressure and temperature were set to 101,325 Pa and 20 K, respectively. For the transient calculation, the time step was configured as 2 ms.
Meanwhile, five monitoring points (A, B, C, D, and E) were arranged at 0.1-m intervals above the gas–liquid interface inside the storage tank. The distribution of the initial temperature and the monitoring points is illustrated in Figure 5.

3.3. Grid Independence Verification

To ensure the accuracy of the grid model, a set of grid verification conditions with an operational pressure of 101,325 Pa, ambient temperature of 293 K, and insulation layer thickness of 0.2 m were set up. Under the condition of a grid size of 0.03 m, 0.02 m, and 0.01 m, the temperatures of the monitoring points under different grid numbers were analyzed and compared.
The temperatures and errors of each monitoring point at 6 s under different grid sizes are shown in Table 1. Among them, the maximum difference between the grid sizes of 0.02 m and 0.03 m is only 0.2581%. In order to save the calculation time, the simulation grid size is determined to be 0.02 m and the number of grids is 443,482.

3.4. Validation of Model Accuracy

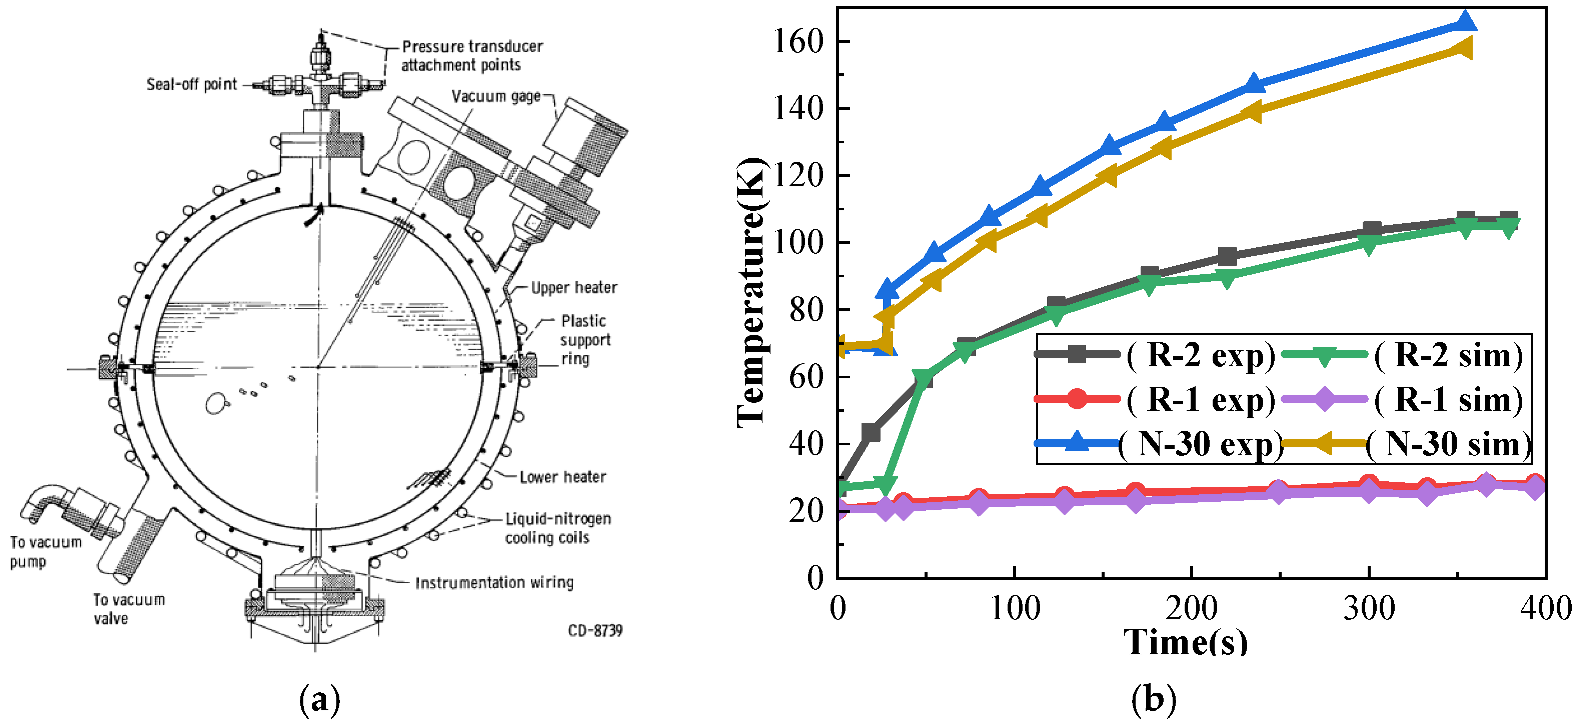
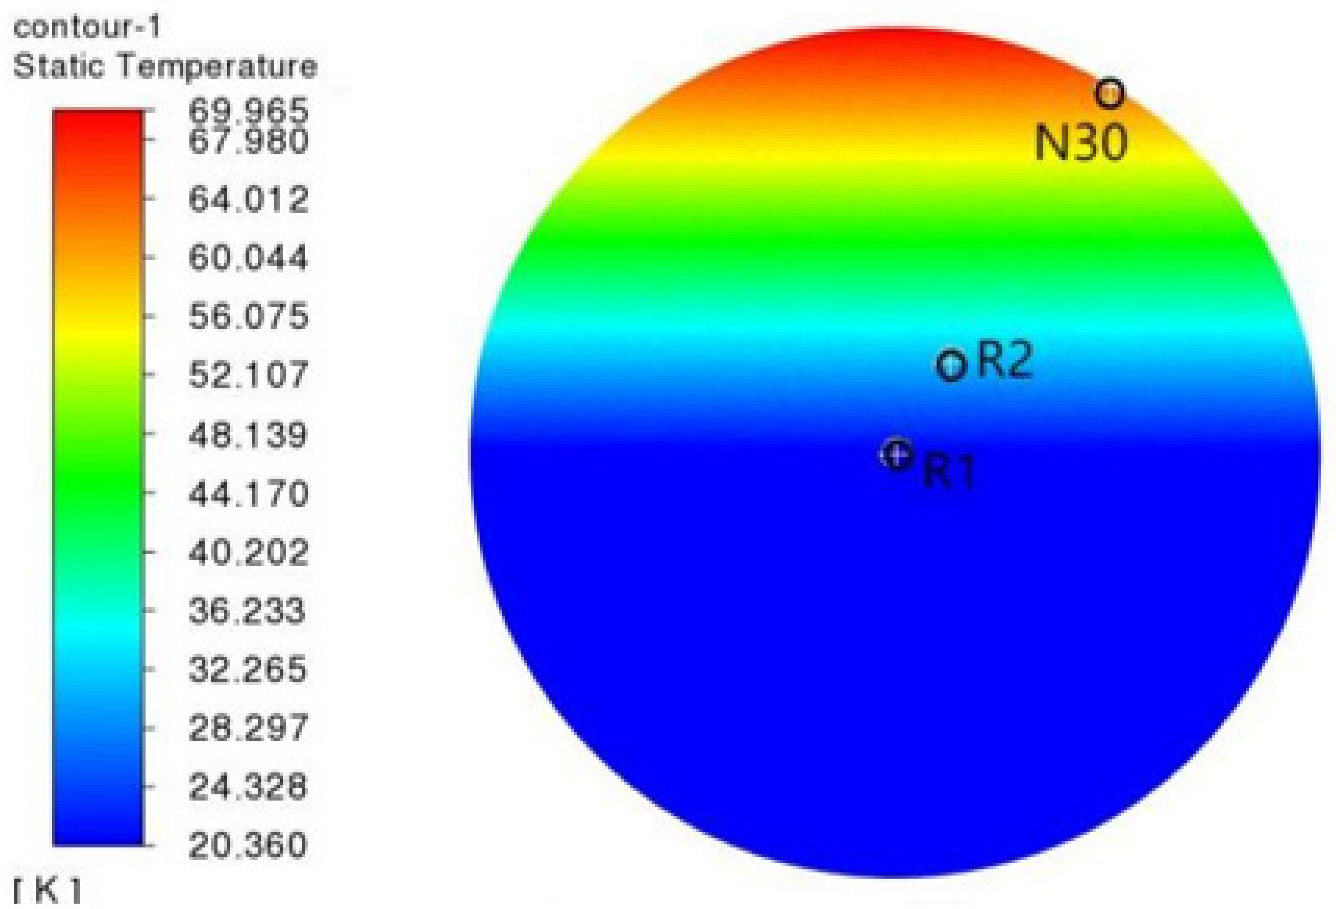
The measured values of the temperature probes at N30, R2, and R1 in the experiment of J.C. Aydelott et al. [38] were used as the reference group. The spherical tank model used in the experiment and the temperature–time distribution curve obtained in the experiment are shown in Figure 6. The specific placement positions and the final temperature distribution are illustrated in Figure 7. The results of the simulation analysis are presented in Table 2. The NASA experiment used a vacuum-jacketed spherical liquid hydrogen storage tank with a diameter of 23 cm, a wall thickness of 0.0254 cm, and was surrounded by an ejector heater. R1 and R2 are 11.43 cm and 7.37 cm away from the tank wall, respectively, and N30 is close to the tank wall. Therefore, the simulation group liquid hydrogen tank model is set to a vacuum spherical tank with a diameter of 23 cm, an inner tank diameter of 20 cm, and a wall thickness of 0.0254 cm. The tank material is austenitic stainless steel. The heat source is set at the same position as the actual position of the experimental group.
According to the above comparison, the model meets the research requirements.

3.5. Simulation Conditions and Group Settings

In this paper, under the condition of ambient temperature 293 K, different insulation thicknesses (0.2 m, 0.35 m, 0.5 m), and different operational pressures (0.5 MPa, 0.85 MPa, 1.2 MPa), the changes in the thermodynamic behavior of the large volume vehicle liquid hydrogen bottle under static and moving conditions are studied. The detailed simulation conditions are shown in Table 3. The initial filling rate of the liquid hydrogen storage bottle is set to 70%.

4. Simulation Results and Analysis

4.1. Thermodynamic Changes of Fluid in the Liquid Hydrogen Bottle Under Different Motion States

In order to observe the thermodynamic behavior of the fluid domain in different motion states more intuitively, taking the static and moving states of operating conditions 1 and 4 as examples, Figure 8 shows the phase, pressure, and temperature distribution of the longitudinal section of the fluid domain at 3 s, 6 s, 9 s, and 120 s.
When combined with Figure 8a–d, it can be observed that due to the influence of the initial temperature difference between the gas and liquid phases, at the beginning of the simulation, the heat and mass transfer between the gas and liquid phases in condition 1 is more intense, and the fluid domain in the bottle is generally characterized by the top and bottom of the liquid hydrogen bottle. The gas–liquid two-phase is relatively stable, and the two sides of the gas–liquid interface are more chaotic. Different from operating condition 1 in the static state, due to the movement of the fluid domain, the phase transition occurs at the bottom of the liquid hydrogen bottle under operating condition 4 at 6 s, and the original liquid phase region appears to demonstrate gas phase stratification, while the original gas phase region appears to demonstrate the liquefaction phenomenon. This is because the movement leads to the mixing of the gas–liquid phases, which greatly improves the contact area of the two phases and aggravates the heat and mass transfer between the two phases. In addition, since the fluid domain in operating condition 4 tends to be static at 6 s, the conversion of kinetic energy also promotes this phenomenon. With the passage of simulation time, at 9 s, the phase distributions of condition 1 and condition 4 are basically the same. At 120 s, the stable liquid region of condition 4 is thinner than that of condition 1, and the phase stratification is more regular than that of condition 1 after movement.
Combined with Figure 8e–h, it can be observed that as time elapses, the overall pressure under operating conditions 1 and 4 decreases due to the movement of the fluid domain, with a more significant pressure reduction observed under condition 4.
It can be observed in Figure 8i–l that the overall temperature variation remains extremely small throughout the entire simulation process. At the time of 3 s and 6 s, the temperature near the wall and the gas–liquid interface is higher. Owing to the movement of the fluid domain, the position of the gas–liquid two-phase interface changes continuously. This dynamic adjustment results in a more uniform temperature distribution under operating condition 4, while the maximum temperature observed is slightly lower than that in the static state. At 120 s, temperature stratification can be observed only at the top of the liquid hydrogen bottle near the wall. It can be observed that the presence of motion contributes to a more uniform temperature distribution inside the liquid hydrogen tank. Meanwhile, within a specific time period, the temperature of the fluid domain under dynamic conditions is lower than that under static conditions.
In conclusion, the motion state facilitates the heat and mass transfer phenomenon between the gas and liquid phases within the fluid domain of the liquid hydrogen tank. This effect renders the phase distribution inside the liquid hydrogen tank more uniform compared with that under static conditions, while also accelerating the pressure drop rate and resulting in a lower temperature.

4.2. Thermodynamic Changes of the Fluid in the Liquid Hydrogen Bottle Under the Coupling of Different Operating Pressures and Motion States

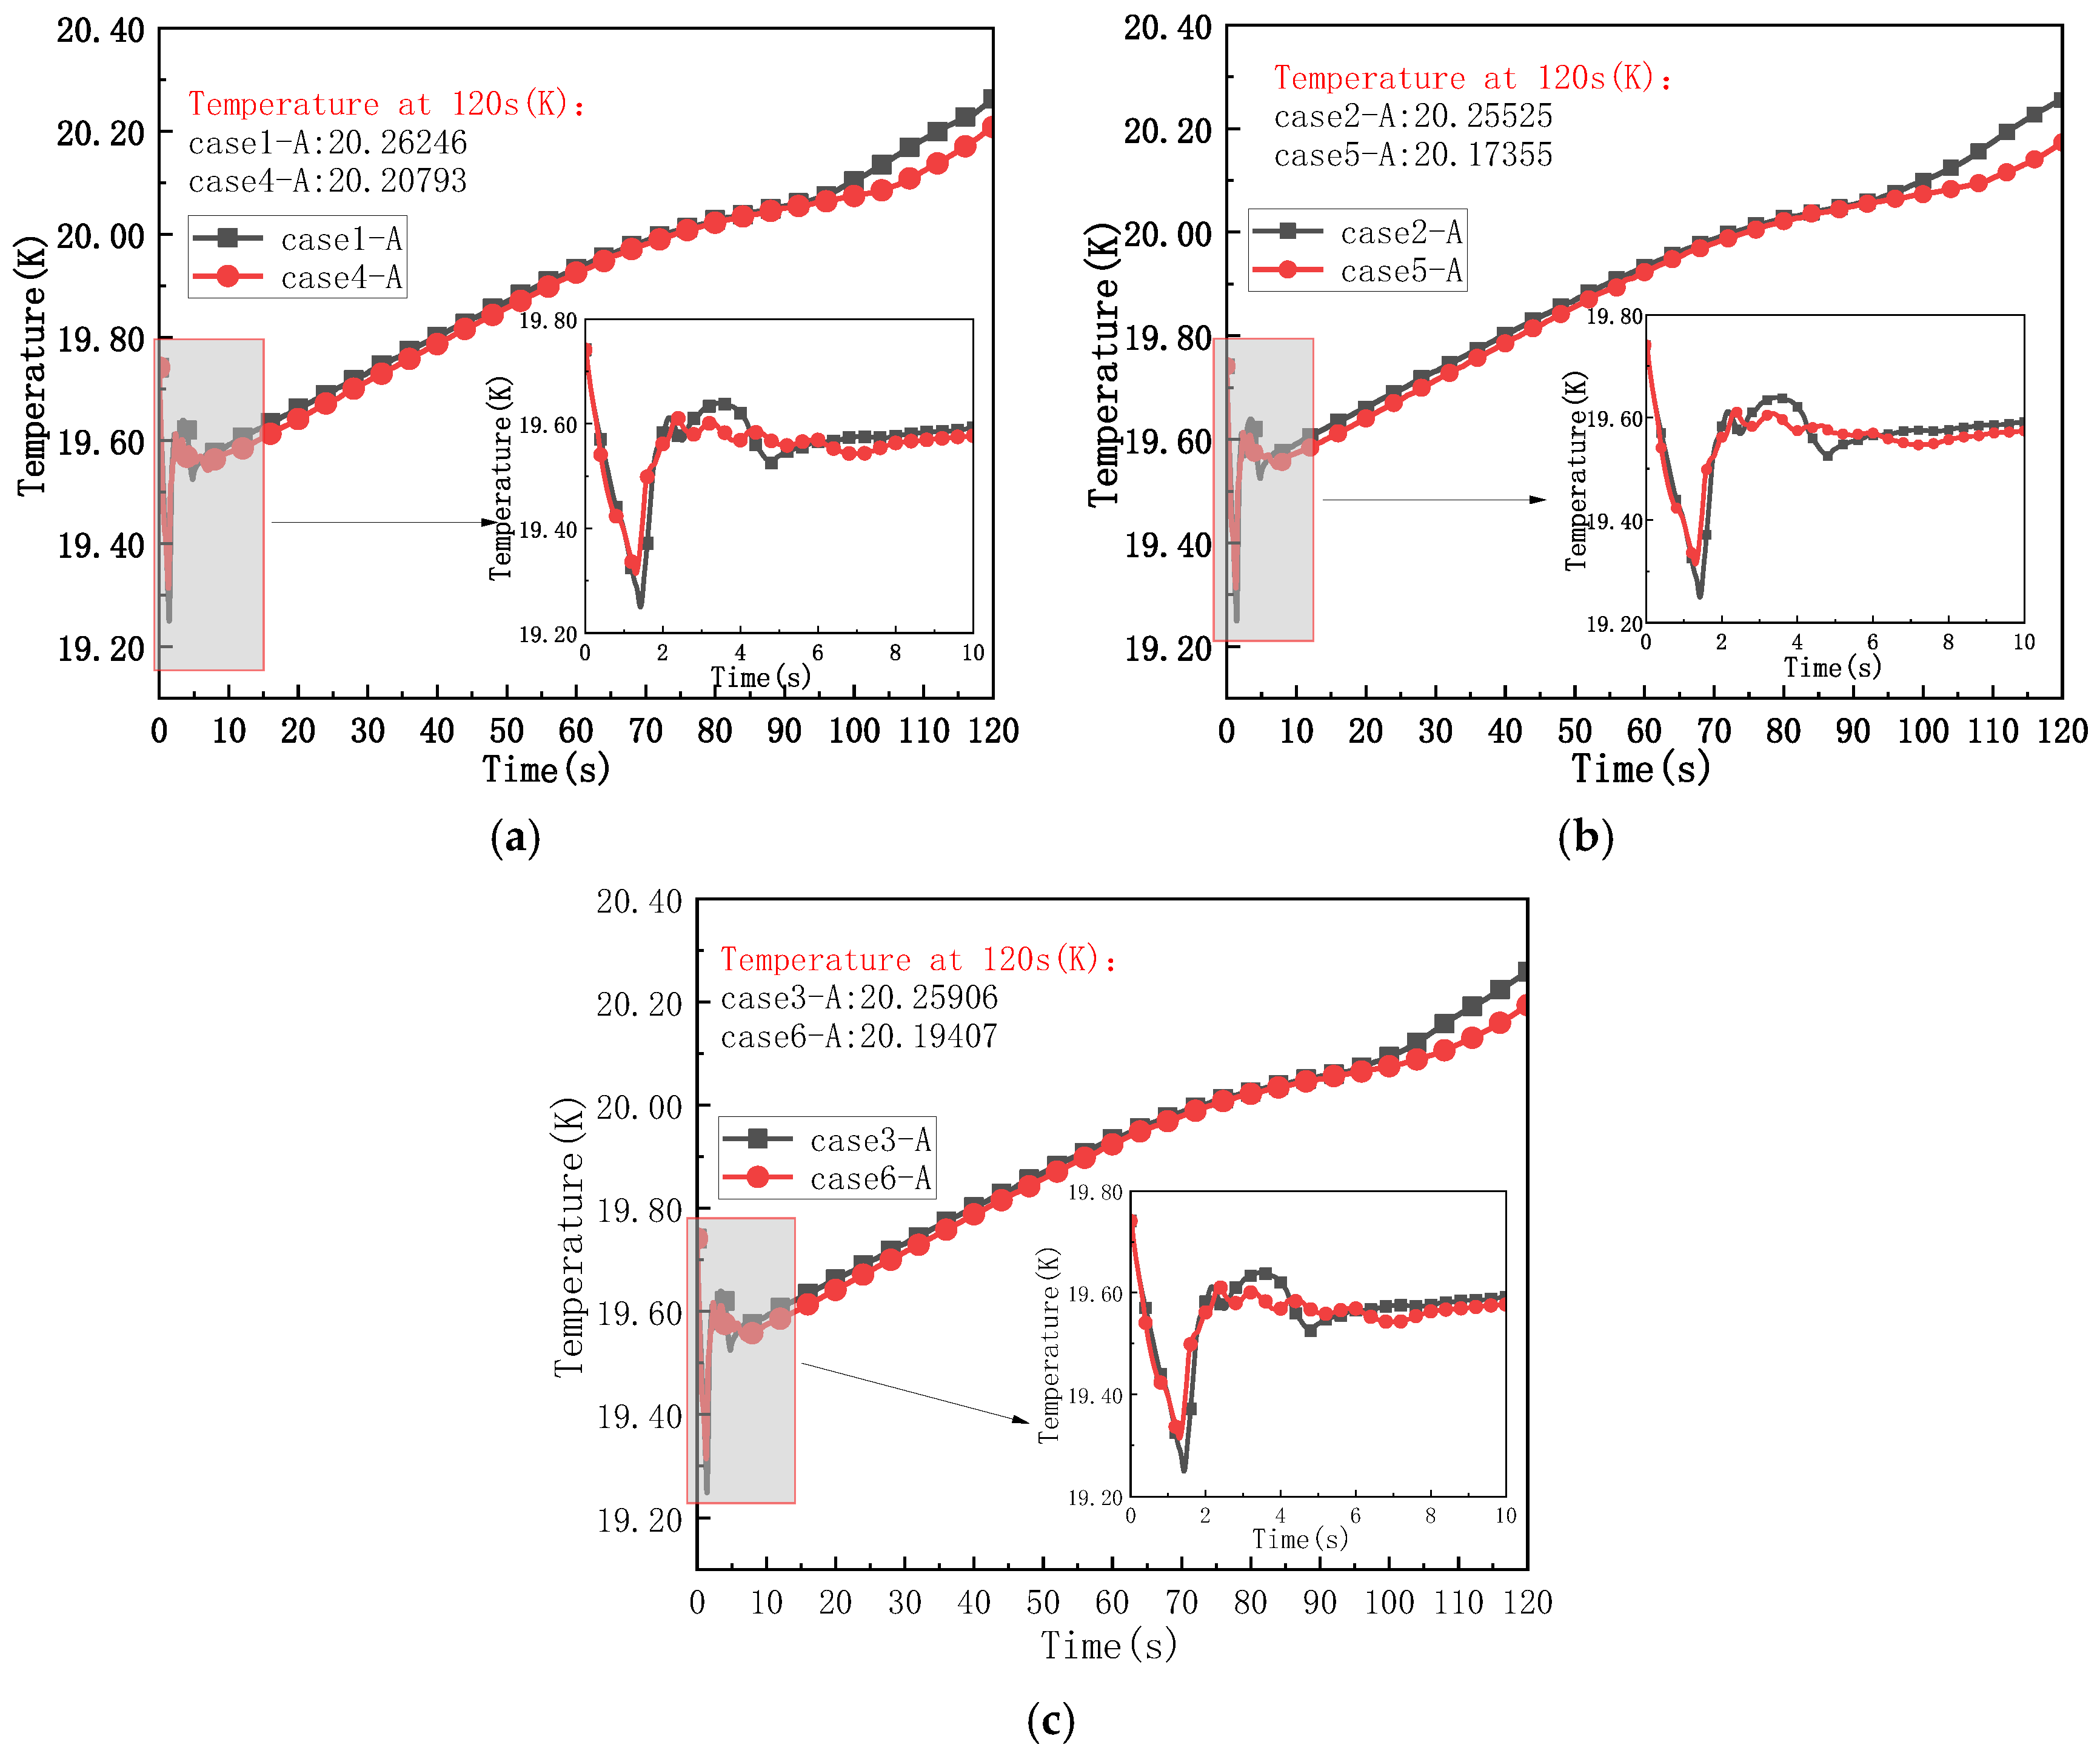
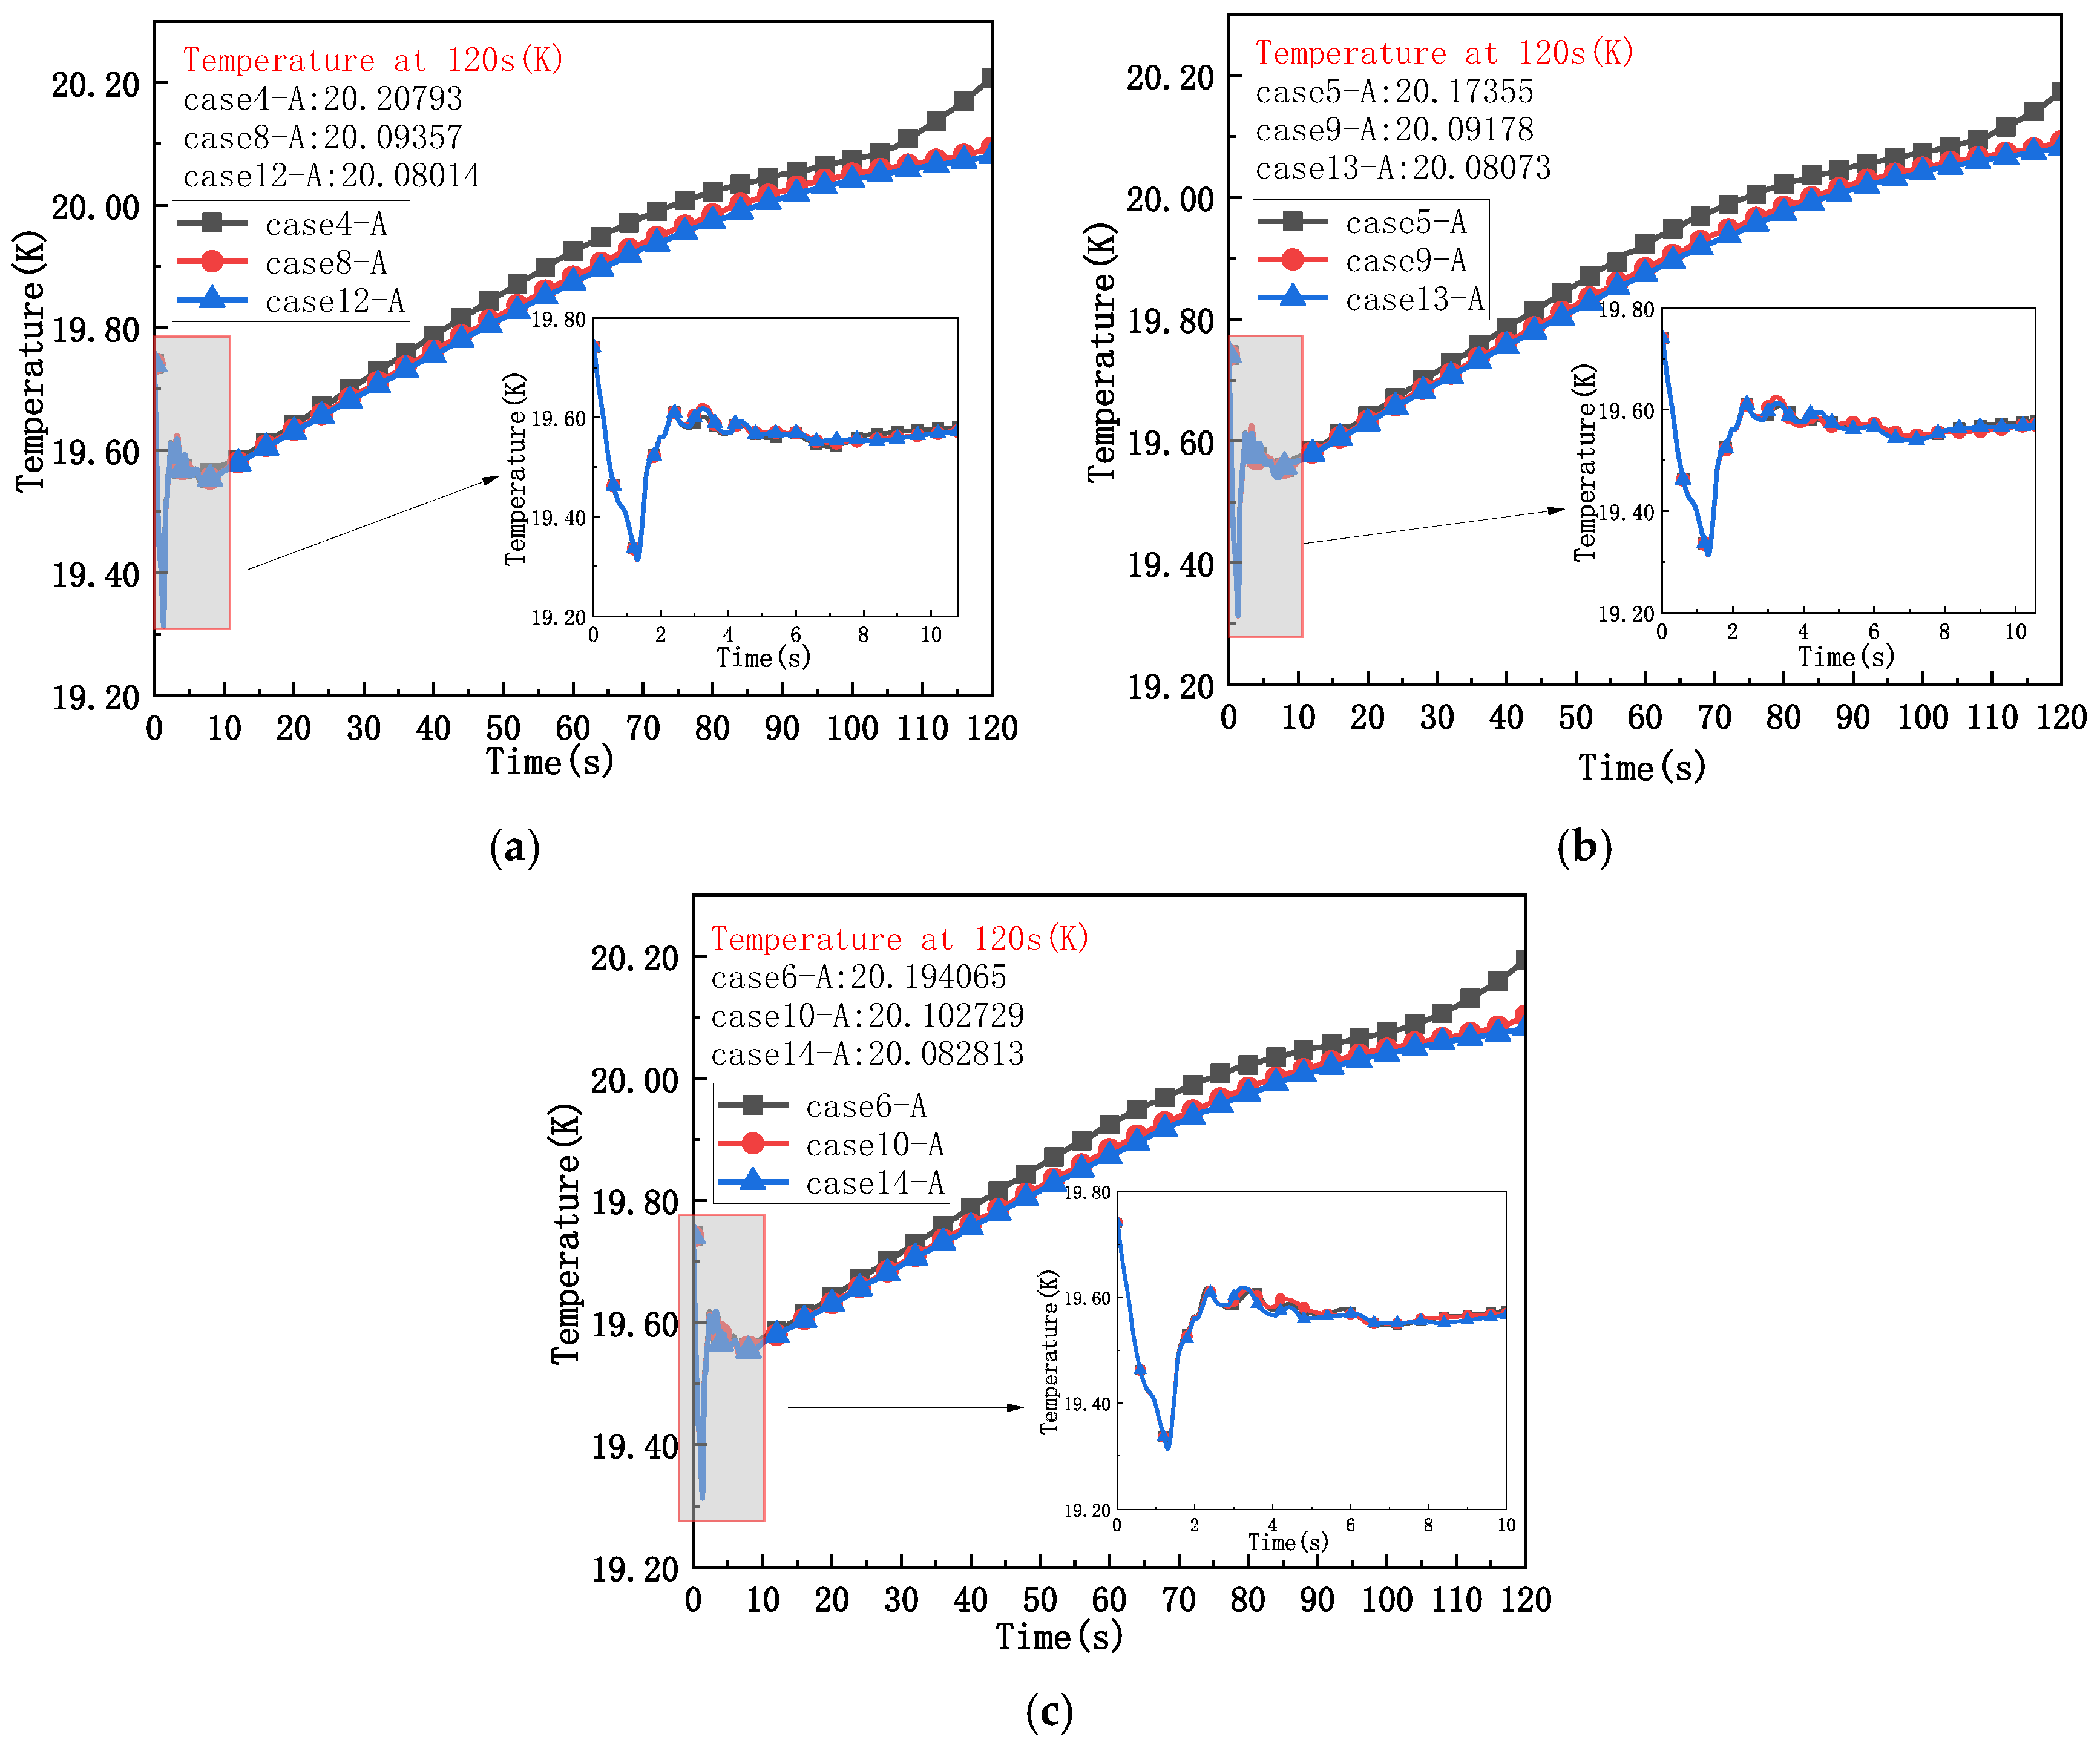
Based on the preceding research and analysis, variations in the motion state exert an impact on the thermodynamic performance of the liquid hydrogen cylinder. In order to further study the influence of different motion states and operating pressure coupling conditions on the thermodynamic performance of the liquid hydrogen cylinder, the temperature distribution change image with time at the detection point A of working conditions 1–6 is drawn for comparative analysis, as shown in Figure 9.
Comparing Figure 9a–c, the temperature changes of the static conditions 1, 2, 3 and motion conditions 4, 5, 6 point A are basically the same, but there are also subtle differences. At 120 s, compared with the temperature difference of point A under 0.5 MPa and 1.2 MPa, the temperature difference under 0.85 MPa is larger. The temperature of point A in conditions 1–6 shows an overall upward trend. Combined with Figure 8 i,j and Figure 9, it can be seen that the temperature fluctuates within 10 s. The temperature fluctuation range under static conditions is larger than that under moving conditions. The movement increases the heat and mass transfer efficiency in the fluid domain, and the temperature difference in the fluid domain is small. In addition, under the three operating pressures of 0.5 MPa, 0.85 MPa, and 1.2 MPa, the temperature at point A at 120 s is different. When the operating pressure is 0.5 MPa, the temperatures of working conditions 1 and 4 reach the highest values of static motion under three operating pressures, which are 20.26246 K and 20.20793 K, respectively. With the increase in the operating pressure, the temperature at the detection point A at 120 s under different conditions decreases first and then increases.
At the same time, the temperature growth rate at point A of conditions 1–6 is basically the same, which gradually decreases during the period of 10 s–100 s, and gradually increases during the period of 100 s–120 s. At 120 s, the temperature growth rate of condition 5 corresponding to a 0.85 MPa operating pressure is the lowest.
In addition, compared with the temperature change at point A under conditions 1–6, it can be seen that the change in the motion state has a greater influence on temperature than the change in the operating pressure, and the change in the motion state has a dominant influence on temperature.
It can be seen that the changes in the operating pressure and motion state have an effect on the heating rate in the liquid hydrogen bottle. Compared with 1.2 MPa and 0.5 MPa, a moderate operating pressure (0.85 MPa) can slow down the heating rate in the liquid hydrogen bottle and prolong the dormancy period of liquid hydrogen to reduce the possible evaporation gas. Under the coupling of the operating pressure and motion state, the change in the motion state has a dominant effect on the temperature of the fluid domain in the liquid hydrogen bottle.

4.3. Change in the Thermodynamic Behavior of Fluid in the Liquid Hydrogen Bottle Under the Coupling of Different Insulation Thicknesses and Operating Pressures

The conditions 4–6, 8–10, and 12–14 are divided into three groups according to the same operating pressure. The temperature change at the detection point A is taken to study the thermodynamic behavior of the liquid hydrogen bottle with the change of the insulation layer, as shown in Figure 10.
From Figure 10, it can be seen that as the thickness of the insulation layer increases from 0.2 m to 0.35 m, the temperature growth at the detection point A at different operating pressures is significantly reduced, which is consistent with the previous conclusions. Compared with 0.5 MPa and 1.2 MPa, the temperature rise is less when the operating pressure is 0.85 MPa.
As the thickness of the insulation layer increases from 0.35 m to 0.5 m, under the pressures of 0.5 MPa, 0.85 MPa, and 1.2 MPa, the temperature rise at detection point A ceases to decrease further and instead becomes consistent with that observed when the insulation layer thickness is 0.35 m. This indicates that increasing the thickness of the insulation layer can reduce the heating rate inside the liquid hydrogen tank; however, this effect does not diminish as the insulation layer thickness continues to increase. Once the thickness of the insulation layer reaches a certain threshold, the heating rate inside the liquid hydrogen tank will barely continue to change and may even approach zero.
It can be seen that the change law of fluid temperature in the liquid hydrogen bottle under the coupling of the insulation layer thickness and operating pressure is dominated by the operating pressure when the thickness of the insulation layer is low. When the thickness of the insulation layer increases to a certain value, it is dominated by the thickness of the insulation layer. At this time, the heating rate in the liquid hydrogen bottle basically does not change.

4.4. Thermodynamic Changes of Fluid in the Liquid Hydrogen Bottle with Different Insulation Thicknesses and Different Positions in the Liquid Hydrogen Bottle

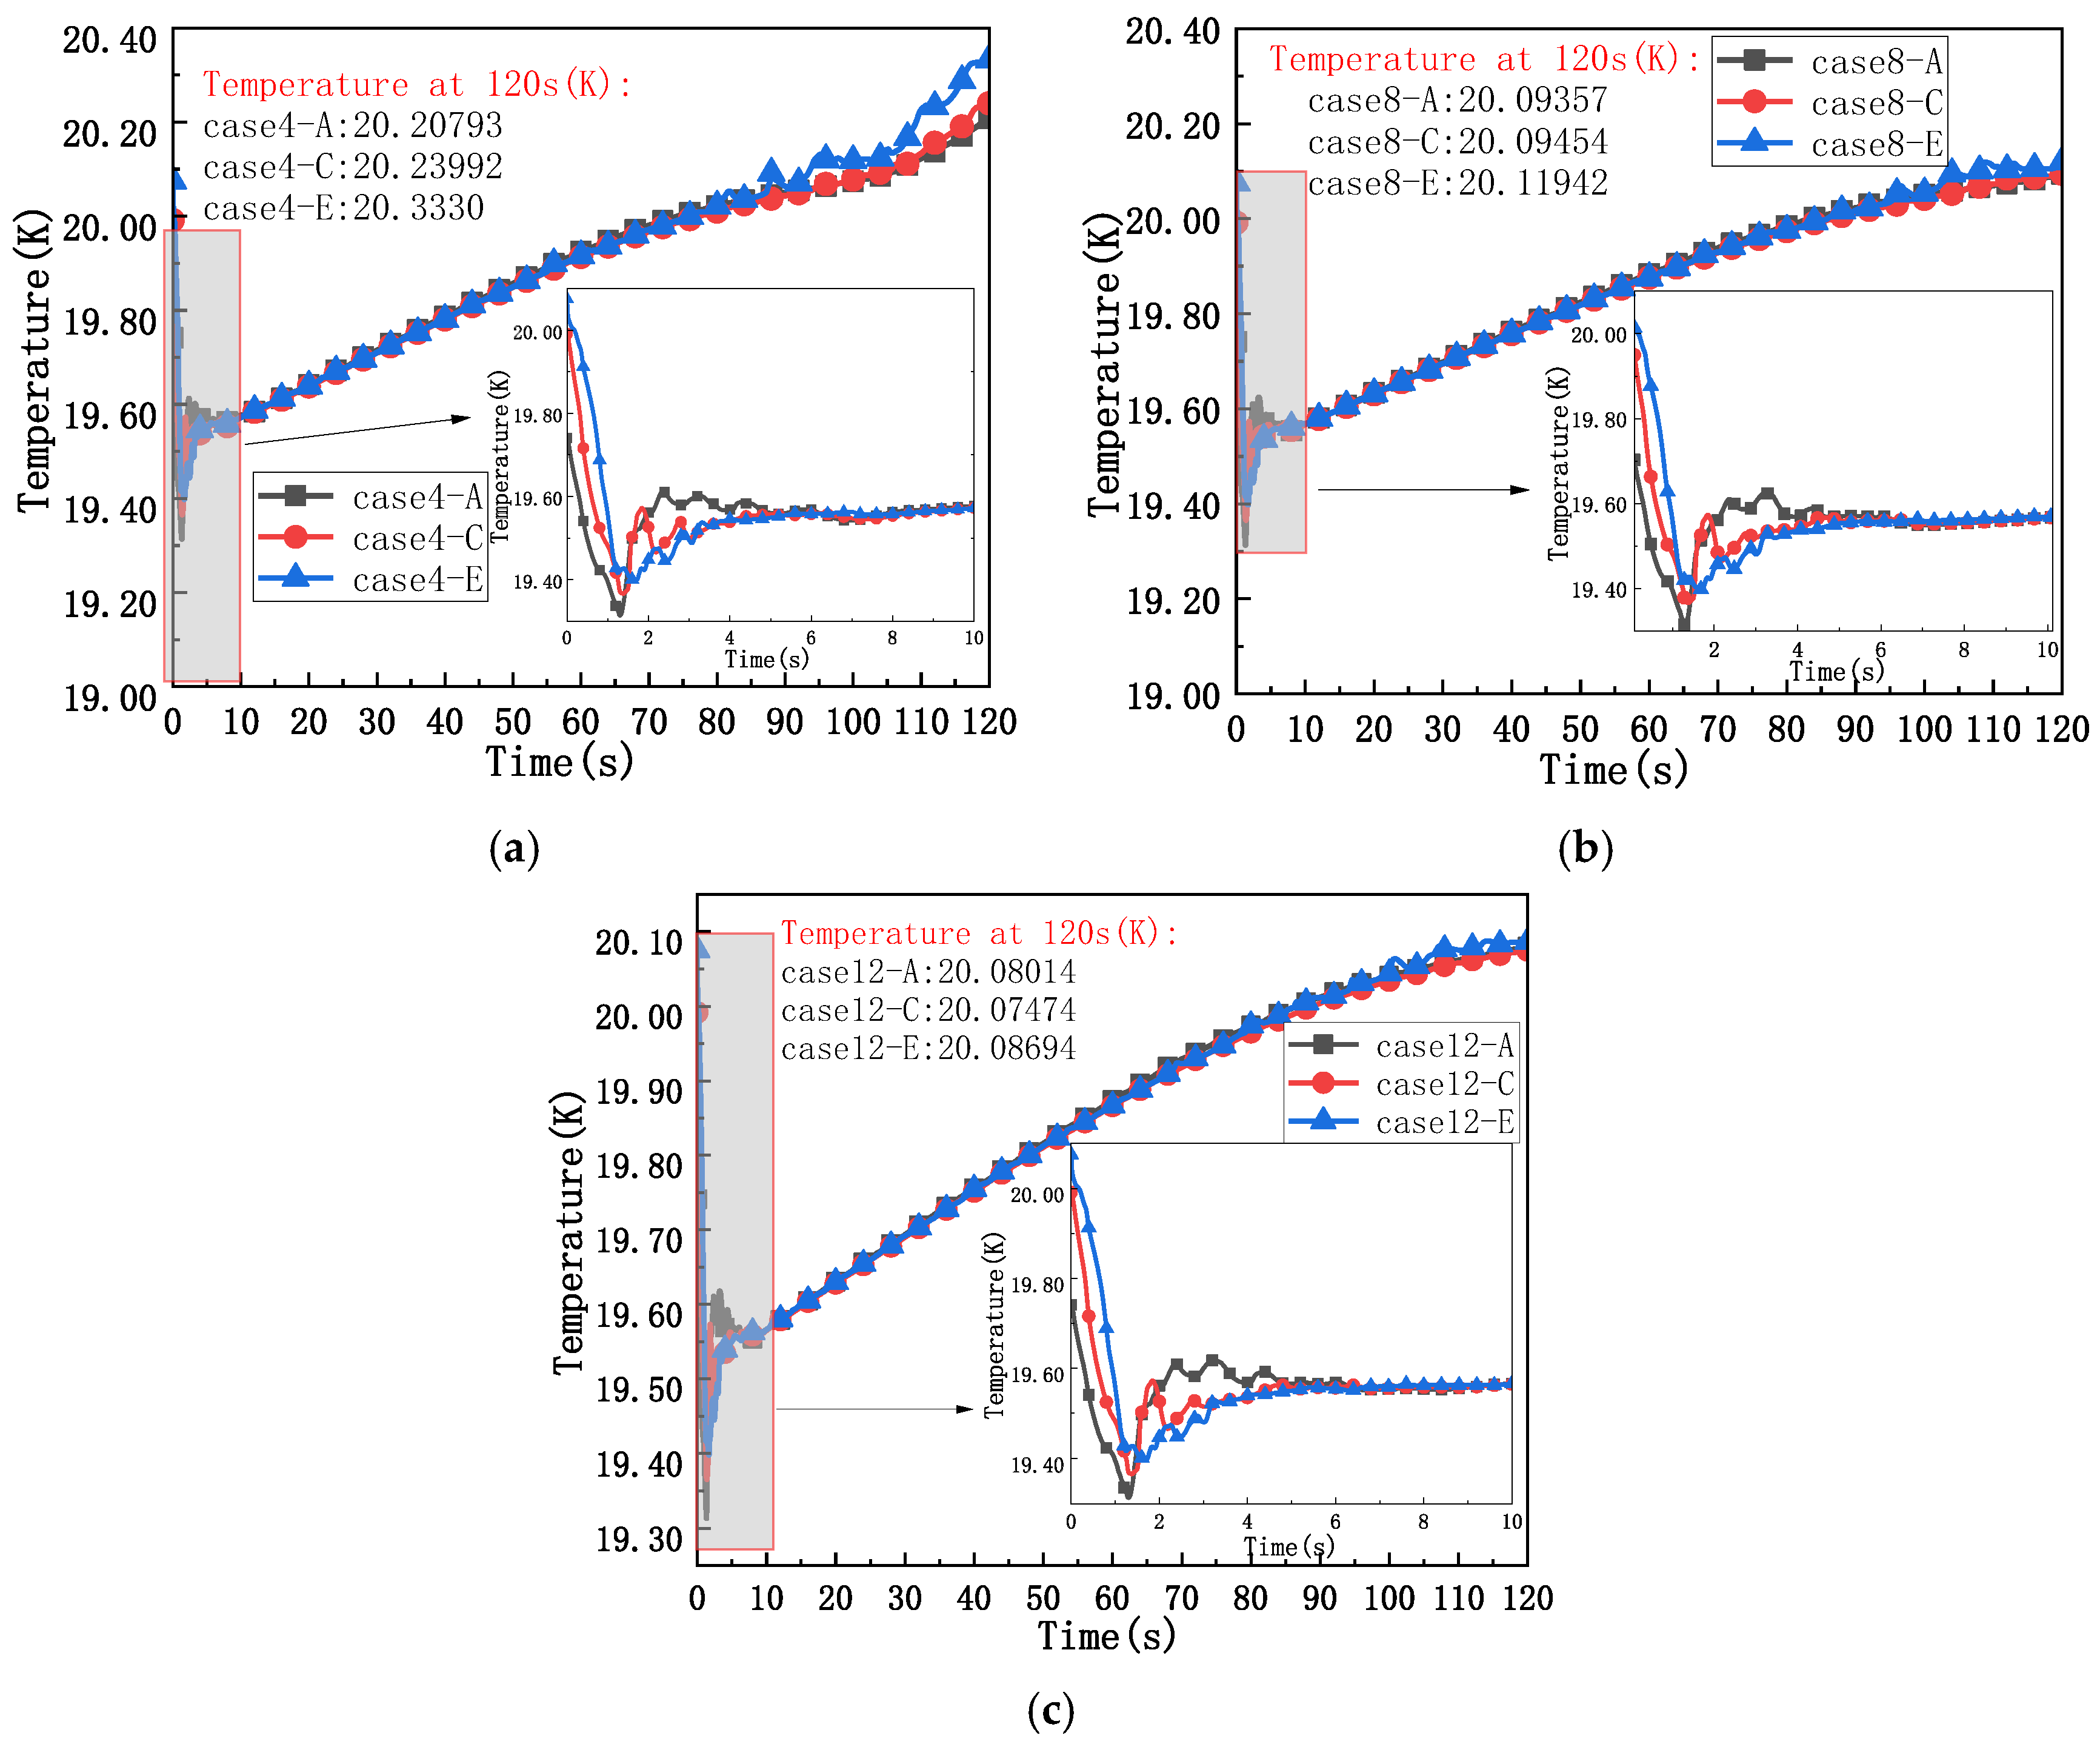
To investigate the changes in thermodynamic behavior at different insulation thicknesses and across different locations within the liquid hydrogen tank, detection points A, C, and E under conditions 4, 8, and 12 were selected as the research subjects. The temperature changes at the detection points A, C, and E are shown in Figure 11 below.
It can be observed in Figure 11 that the temperature at the detection point closer to the bottle wall is higher under different insulation thicknesses. Taking condition 4 as an example, the temperature gradually increases with the position of the detection point approaching the wall at 120 s, which is 20.20793 K, 20.23992 K, and 20.3330 K, respectively. It can be seen in Figure 11a that when the thickness of the insulation layer is 0.2 m, the thickness of the insulation layer has little blocking effect on the external heat source, and the heat transfer from the external heat conduction is higher than that in the internal fluid domain. The heating rate at the detection points A, C, and E of condition 4 continues to increase after the liquid hydrogen bottle stops moving, and the closer to the wall, the higher the heating rate at the detection point.
As shown in Figure 11b, when the thickness of the insulation layer becomes 0.35 m, the insulation layer blocks most of the external heat, so that the heat transfer in the fluid domain of the liquid hydrogen bottle is higher than the external heat conduction. When the liquid hydrogen bottle stops moving, the heating rate of each detection point in condition 8 gradually decreases and tends to zero. As shown in Figure 11c, when the thickness of the insulation layer continues to increase to 0.5 m, there is no significant change in the temperature rate at each detection point in condition 12 compared with that in condition 8. The temperature at each detection point is slightly lower than that in condition 8, but it is very small. At 120 s, the temperature at detection points A, C, and E in condition 8 is 20.09357 K, 20.09454 K, and 20.11942 K, respectively. The temperature at the same detection point in condition 12 is 20.08014 K, 20.07474 K, and 20.08694 K, respectively.
It can be observed that with the same insulation layer thickness, the temperature rise rate near the tank wall is consistently higher than that at the locations far from the wall. Increasing the thickness of the insulation layer can mitigate this phenomenon, thereby helping the overall temperature of the fluid domain inside the liquid hydrogen tank to remain at a relatively consistent level.

5. Conclusions

This study investigated the variation patterns and influencing factors of the short-term thermodynamic behavior of the fluid domain within a liquid hydrogen tank under different motion states, operating pressures, and insulation thicknesses during the storage and transportation of liquid hydrogen. The main conclusions are as follows:
  • In comparison with the changes in the thermodynamic behavior of the fluid within the liquid hydrogen tank under static conditions, motion enhances the heat and mass transfer between the gas and liquid phases inside the tank. This results in a more uniform phase distribution within the liquid hydrogen tank than that observed under static conditions, along with an accelerated pressure drop rate and a lower temperature. The uniform acceleration (such as acceleration of 4.4 m/s2) during vehicle start-up is similar to the uniform deceleration state during braking. Both of them can promote the heat and mass transfer of gas–liquid two-phase, increase the uniformity of phase state in the liquid hydrogen bottle by about 3.8% (compared with stationary), and reduce the temperature by 0.044~0.055 K. In the case of the same absolute value of acceleration, the difference between the effects of acceleration and deceleration on thermodynamic behavior is less than 0.5%, which can be classified as the common effect of the ‘non-stationary motion state’.
  • The changes in the operating pressure and motion state have an effect on the heating rate in the liquid hydrogen bottle. Compared with 1.2 MPa and 0.5 MPa, a moderate operating pressure (0.85 MPa) can slow down the heating rate in the liquid hydrogen bottle and prolong the dormancy period of liquid hydrogen to reduce the possible evaporation gas. Under the coupling of the operating pressure and motion state, the change in the motion state has a dominant influence on the temperature of the fluid domain in the liquid hydrogen bottle.
  • The variation law of fluid temperature in a liquid hydrogen bottle under the coupling of insulation layer thickness and operating pressure is dominated by the operating pressure when the thickness of insulation layer is low, and when the thickness of the insulation layer increases to a certain value, it is dominated by the thickness of the insulation layer, and the heating rate in the liquid hydrogen bottle basically does not change.
  • When the position in the liquid hydrogen bottle and the thickness of the insulation layer change, and when the thickness of the insulation layer is small, the temperature in the liquid hydrogen bottle changes, showing that the near-wall temperature growth rate is always higher than the far-wall temperature growth rate. As the thickness of the insulation layer increases, this phenomenon is mitigated, and the temperature rise rates at different locations inside the liquid hydrogen tank tend to converge.
This study primarily investigated the effects of the insulation layer thickness, operating pressure, and motion state on the thermodynamic behavior inside the liquid hydrogen tank. However, the configuration of the motion state adopted in this work is relatively simplistic. The subsequent research will focus on the different motion conditions that may occur during the transportation of the liquid hydrogen bottle. A simulation study was conducted on the changes in thermodynamic behavior within a liquid hydrogen tank under different motion conditions, including sloshing in various directions and uniform linear motion.

Author Contributions

Conceptualization, J.S., Y.L., F.L. and H.Z.; Methodology, Y.H. and H.Z.; Validation, H.Z.; Resources, J.S. and Y.H.; Writing—original draft, J.S. and Y.L.; Writing—review and editing, Y.L.; Visualization, F.L.; Funding acquisition, Y.H. All authors have read and agreed to the published version of the manuscript.

Funding

This project is supported by the National Key Research and Development Plan (No. 2022YFB4002803), Jiangsu Province Carbon Peak Carbon Neutralization Technology Innovation Special Fund (BE2022001).

Data Availability Statement

The original contributions presented in this study are included in the article. Further inquiries can be directed to the corresponding author.

Conflicts of Interest

The authors declare no conflicts of interest.

References

  1. Yao, S.; Yang, X. Research progress of lossless and safe storage technology for cryogenic liquid tanks. Int. J. Green Energy 2022, 19, 1230–1251. [Google Scholar] [CrossRef]
  2. Birk, A.M.; Cunningham, M.H. Liquid temperature stratification and its effect on BLEVEs and their hazards. J. Hazard. Mater. 1996, 48, 219–237. [Google Scholar] [CrossRef]
  3. Zhu, Y.; Bu, Y.; Gao, W.; Xie, F.; Guo, W.; Li, Y. Numerical Study on Thermodynamic Coupling Characteristics of Fluid Sloshing in a Liquid Hydrogen Tank for Heavy-Duty Trucks. Energies 2023, 16, 1851. [Google Scholar] [CrossRef]
  4. Hou, C.; Yu, Y.; Liu, X.; Ding, J.; Cui, Z. Effects of longitudinal excitation on liquid hydrogen sloshing in spacecraft storage tanks under microgravity conditions. Int. J. Hydrogen Energy 2023, 51, 765–780. [Google Scholar] [CrossRef]
  5. Liu, Z.; Feng, Y.; Lei, G.; Li, Y. Fluid sloshing dynamic performance in a liquid hydrogen tank. Int. J. Hydrogen Energy 2019, 44, 13885–13894. [Google Scholar] [CrossRef]
  6. Smith, J.R.; Gkantonas, S.; Mastorakos, E. Modelling of Boil-Off and Sloshing Relevant to Future Liquid Hydrogen Carriers. Energies 2022, 15, 2046. [Google Scholar] [CrossRef]
  7. Jeon, G.M.; Park, J.C.; Kim, J.W.; Lee, Y.B.; Kim, D.S.; Kang, D.E.; Lee, S.B.; Lee, S.W.; Ryu, M.C. Experimental and numerical investigation of change in boil-off gas and thermodynamic characteristics according to filling ratio in a C-type cryogenic liquid fuel tank. Energy 2022, 255, 124530. [Google Scholar] [CrossRef]
  8. Chung, S.-M.; Jeon, G.-M.; Park, J.-C. Numerical approach to analyze fluid flow in a type C tank for liquefied hydrogen carrier (part 1: Sloshing flow). Int. J. Hydrogen Energy 2022, 47, 5609–5626. [Google Scholar] [CrossRef]
  9. Ryu, M.-R.; Yun, S.; Kim, B.-K.; Kang, D.; Kim, G.; Lee, H. Numerical analysis of sloshing effects in cryogenic liquefied-hydrogen storage tanks for trains under various vibration conditions. Cryogenics 2024, 143, 103961. [Google Scholar] [CrossRef]
  10. Liu, Z.; Feng, Y.; Lei, G.; Li, Y. Fluid thermal stratification in a non-isothermal liquid hydrogen tank under sloshing excitation. Int. J. Hydrogen Energy 2018, 43, 22622–22635. [Google Scholar] [CrossRef]
  11. Zheng, Z.; Xu, A.; Jiang, W.; Wang, B.; Sun, P.; Li, P.; Huang, Y. Simulation of sloshing and settling behavior of liquid hydrogen in an insulated tank during coastal period. Int. J. Hydrogen Energy 2025, 97, 117–129. [Google Scholar] [CrossRef]
  12. Lv, H.; Chen, L.; Zhang, Z.; Chen, S.; Hou, Y. Numerical study on thermodynamic characteristics of large-scale liquid hydrogen tank with baffles under sloshing conditions. Int. J. Hydrogen Energy 2024, 57, 562–574. [Google Scholar] [CrossRef]
  13. Kang, D.-H.; An, J.-H.; Lee, C.-J. Numerical modeling and optimization of thermal insulation for liquid hydrogen storage tanks. Energy 2024, 291, 130143. [Google Scholar] [CrossRef]
  14. Li, K.; Wen, J.; Xin, B.; Zhou, A.; Wang, S. Transient-state modeling and thermodynamic analysis of self-pressurization liquid hydrogen tank considering effect of vacuum multi-layer insulation coupled with vapor-cooled shield. Energy 2024, 286, 129450. [Google Scholar] [CrossRef]
  15. Jiang, W.; Sun, P.; Li, P.; Zuo, Z.; Huang, Y. Transient thermal behavior of multi-layer insulation coupled with vapor cooled shield used for liquid hydrogen storage bottle. Energy 2021, 231, 120859. [Google Scholar] [CrossRef]
  16. Wu, J.; Xie, R.; Yu, M.; Luo, C.; Wang, B.; Zhang, X.; Jiang, L. Techno-economic analysis on the performance of hydrogen adsorbents in the vacuum layer of cryogenic liquid storage bottle. Int. J. Hydrogen Energy 2024, 88, 132–141. [Google Scholar] [CrossRef]
  17. Li, K.; Wen, J.; Wang, S. Insulation and cost optimization of vapor-cooled shield coupled with para-to-ortho hydrogen conversion based on self-pressurization model of liquid hydrogen bottle and NSGA-II. J. Energy Storage 2024, 99, 113229. [Google Scholar] [CrossRef]
  18. Zheng, J.; Chen, L.; Xu, X.; Guo, L.; Zhou, Y.; Wang, J. A novel insulation system based on active cooling without power input for liquid hydrogen storage. Energy 2019, 182, 1–10. [Google Scholar] [CrossRef]
  19. Joseph, J.; Agrawal, G.; Agarwal, D.K.; Pisharady, J.C.; Kumar, S.S. Effect of insulation thickness on pressure evolution and thermal stratification in a cryogenic bottle. Appl. Therm. Eng. 2017, 111, 1629–1639. [Google Scholar] [CrossRef]
  20. Wang, H.; Wang, B.; Pan, Q.; Wu, Y.; Jiang, L.; Wang, Z.; Gan, Z. Modeling and thermodynamic analysis of thermal performance in self-pressurized liquid hydrogen bottles. Int. J. Hydrogen Energy 2022, 47, 30530–30545. [Google Scholar] [CrossRef]
  21. Shen, Y.; Wang, D.; Lv, H.; Zhang, C. Dispersion characteristics of large-scale liquid hydrogen spills in a real-world liquid hydrogen refueling station with various releasing and environmental conditions. Renew. Energy 2024, 236, 121327. [Google Scholar] [CrossRef]
  22. Zhu, S.; Fang, S.; Bao, S.; Zhi, X.; Wang, K.; Qiu, L. Efficient cooling strategies for liquid hydrogen pipelines: A comparative analysis. Renew. Energy 2024, 236, 121488. [Google Scholar] [CrossRef]
  23. Boryaev, A.; Chernyaev, I.; Yuqing, Z. Heat and mass transfer and hydrodynamics in cryogenic hydrogen fuel systems. Fuel 2022, 321, 124004. [Google Scholar] [CrossRef]
  24. Barnett, D.O. Liquid nitrogen stratification analysis and experiments in a partially filled, spherical container. Adv. Cryog. Eng. 1967, 13, 174–185. [Google Scholar]
  25. Zhu, H.Q.; Xie, L.H.; Cao, Y.B.; Zhang, X. Study on influence of pressure and filling level on mass flow of cryogenic insulated cylinder. Cryog. Supercond. 2022, 50, 97–102. [Google Scholar]
  26. Zhu, H.Q.; Feng, Y.K.; Cai, Y.B.; Zhang, X.; Wei, G.M.; Zhang, J.F. Study on temperature distribution in the gas phase of cryogenic vessels. China Sci. Pap. 2021, 16, 97–103. [Google Scholar]
  27. Bonab, S.A.; Yazdani-Asrami, M. Investigation on the heat transfer estimation of subcooled liquid hydrogen for transportation applications using intelligent technique. Int. J. Hydrogen Energy 2024, 84, 468–479. [Google Scholar] [CrossRef]
  28. Zhang, L.; Wang, E.; Shi, J. Dynamic thermal performance of cryogenic liquid hydrogen heating from gas-liquid stratification to supercritical under a constant heat flux condition: A two-step simulation. Int. J. Hydrogen Energy 2024, 136, 1242–1250. [Google Scholar] [CrossRef]
  29. Wang, J.; Webley, P.A.; Hughes, T.J. Thermodynamic modelling of low fill levels in cryogenic storage bottles for application to liquid hydrogen maritime transport. Appl. Therm. Eng. 2024, 256, 124054. [Google Scholar] [CrossRef]
  30. Wang, Q.; Liu, X.; Li, M.; Su, D.; Dang, C. Numerical simulation of heat transfer characteristics of falling-film evaporation of R32/R134a non-azeotropic refrigerant outside a horizontal tube. Int. Commun. Heat Mass Transf. 2023, 148, 107001. [Google Scholar] [CrossRef]
  31. Liu, Z.; Sunden, B.; Yuan, J. VOF modeling and analysis of filmwise condensation between vertical parallel plates. Heat Transf. Res. 2022, 43, 47–68. [Google Scholar] [CrossRef]
  32. Chen, G.B.; Bao, R.; Huang, Y.H. Low Temperature Engineering Technology: Data Volume; Chemical Industry Press: Beijing, China, 2006. [Google Scholar]
  33. Tao, W.Q. Heat Transfer: Fundamentals and Engineering Applications, 5th ed.; Higher Education Press: Beijing, China, 2019. [Google Scholar]
  34. Li, S.; Yan, Y.; Wei, W.; Wang, Z.; Ni, Z. Numerical simulation on the thermal dynamic behavior of liquid hydrogen in a storage bottle for trailers. Case Stud. Therm. Eng. 2022, 40, 102520. [Google Scholar] [CrossRef]
  35. Liu, Y.; Hao, Y.; Li, F.; Shen, J.; Xing, Z.; Zhou, H. Simulation study on the influencing factors of thermal conductivity of large-volume vehicle-mounted liquid hydrogen bottles under different filling rates. Int. J. Hydrogen Energy 2024, 69, 804–816. [Google Scholar] [CrossRef]
  36. Zheng, J.; Chen, L.; Wang, J.; Xi, X.; Zhou, H.; Zhou, Y.; Wang, J. Thermodynamic analysis and comparison of four insulation schemes for liquid hydrogen storage bottle. Energy Convers. Manag. 2019, 186, 526–534. [Google Scholar] [CrossRef]
  37. Qu, Q.X.; Huang, C.J.; Sun, W.T. Application and Analysis of Austenitic Stainless Steel in Cryogenic Propellant Tank of Launch Vehicle. In Proceedings of the China Materials Conference 2024, Guangzhou, China, 8–11 July 2024. [Google Scholar]
  38. Aydelott, J.C. Normal Gravity Self-Pressurization of 9-Inch-/23 cm/Diameter Spherical Liquid Hydrogen Tankage; Technical Report; NASA: Cleveland, OH, USA, 1967.
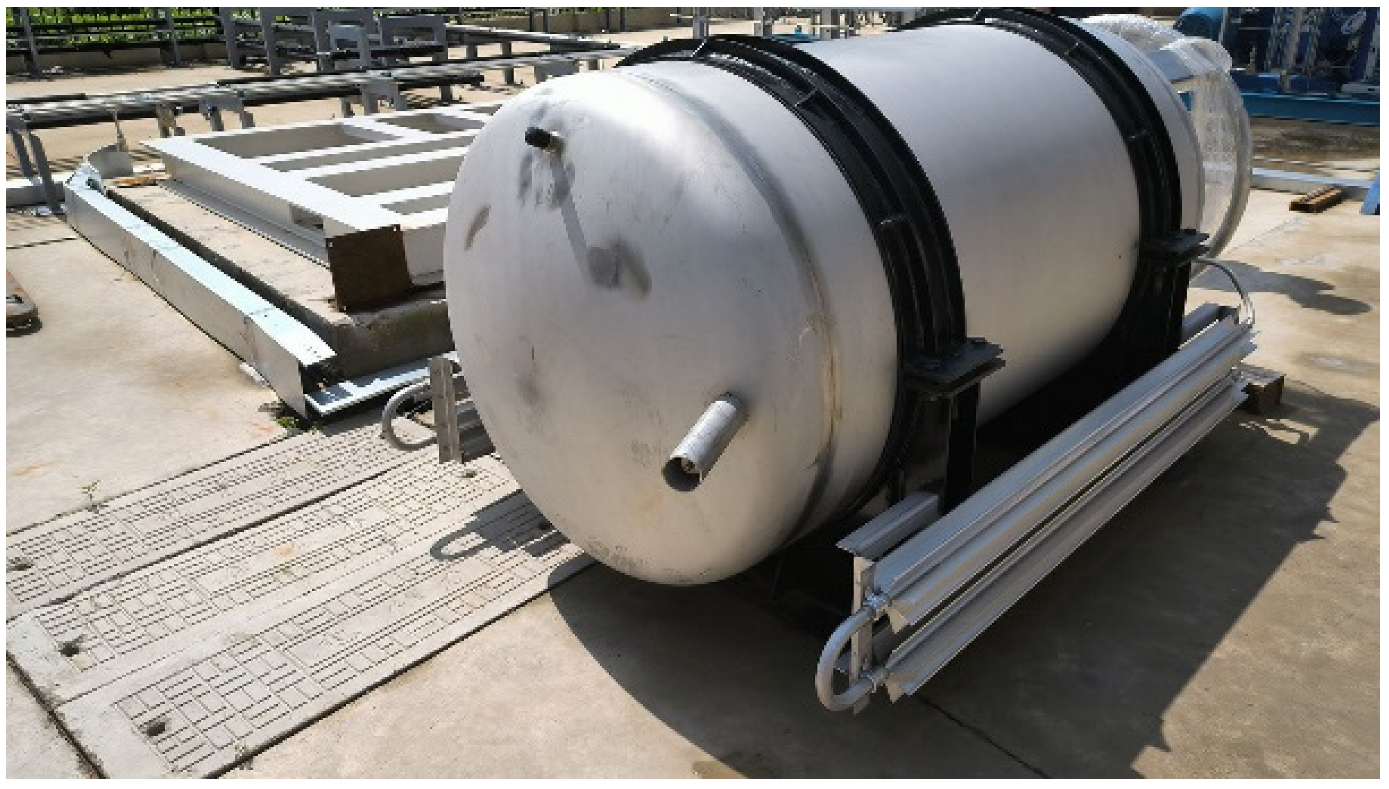
Figure 1. Liquid hydrogen bottle physical.
Processes 13 03340 g001
Figure 2. Section structure of the liquid hydrogen bottle model.
Processes 13 03340 g002
Figure 3. Cross-section structure of the inner storage bottle and fluid computational domain.
Processes 13 03340 g003
Figure 4. Grid profile.
Processes 13 03340 g004
Figure 5. Initial temperature field and distribution of monitoring points.
Processes 13 03340 g005
Figure 6. The temperature distribution with time measured using the NASA spherical tank model and probes at different positions. (a) NASA spherical tank model. (b) The temperature distribution with time measured by the probe at different positions.
Processes 13 03340 g006
Figure 7. The accuracy of the model verifies the final temperature distribution.
Processes 13 03340 g007
Figure 8. Phase, pressure, and temperature contours of the longitudinal section of the liquid hydrogen cylinder at different times in conditions 1 and 4. (a) Phase distribution of the liquid hydrogen cylinder longitudinal section at 3 s and 6 s under condition 1. (b) Phase distribution of the liquid hydrogen cylinder longitudinal section at 3 s and 6 s under condition 4. (c) Phase distribution of the liquid hydrogen cylinder longitudinal section at 9 s and 120 s under condition 1. (d) Phase distribution of the liquid hydrogen cylinder longitudinal section at 9 s and 120 s under condition 4. (e) Pressure distribution of the liquid hydrogen cylinder longitudinal section at 3 s and 6 s under condition 1. (f) Pressure distribution of the liquid hydrogen cylinder longitudinal section at 3 s and 6 s under condition 4. (g) Pressure distribution of the liquid hydrogen cylinder longitudinal section at 9 s and 120 s under condition 1. (h) Pressure distribution of the liquid hydrogen cylinder longitudinal section at 9 s and 120 s under condition 4. (i) Temperature distribution of the liquid hydrogen cylinder longitudinal section at 1 s and 6 s under condition 1. (j) Temperature distribution of the liquid hydrogen cylinder longitudinal section at 1 s and 6 s under condition 4. (k) Temperature distribution of the liquid hydrogen cylinder longitudinal section at 9 s and 120 s under condition 1. (l) Temperature distribution of the liquid hydrogen cylinder longitudinal section at 9 s and 120 s under condition 4.
Processes 13 03340 g008aProcesses 13 03340 g008b
Figure 9. The temperature change at the detection point A when the operating pressure is changed under different motion states. (a) The temperature change image of detection point A with time under conditions 1 and 4. (b) The temperature change image of detection point A with time under conditions 2 and 5. (c) The temperature change image of detection point A with time under conditions 3 and 6.
Processes 13 03340 g009
Figure 10. The temperature change at the detection point A when the operating pressure is changed under different insulation thicknesses. (a) The temperature change image of detection point A of 4, 8, and 12 conditions with time. (b) The temperature change image of detection point A of 5, 9, and 13 conditions with time. (c). The temperature change image of detection point A of 6, 10, and 14 conditions with time.
Processes 13 03340 g010
Figure 11. Temperature changes at different detection points under different insulation thicknesses. (a) The image of temperature change with time at detection points A, C, and E in condition 4. (b) The image of temperature change with time at detection points A, C, and E in condition 8. (c) The image of temperature change with time at detection points A, C, and E in condition 12.
Processes 13 03340 g011
Table 1. Temperature and maximum error of each monitoring point at 6 s under different grid numbers.
Grid Size
m
Grid NumbersPoint A
K
Point B
K
Point C
K
Point D
K
Point E
K
Maximum Error%
0.0355,43518.891218.890318.890618.892819.00245.1454
0.02443,48219.865019.864119.864919.867219.87180.2581
0.013,547,85619.914719.915019.915319.918619.9223-
Table 2. The location of each monitoring point and simulation analysis.
Detector NumberPosition
cm
Experimental Value
K
Value of Simulation
K
Error
K
N30(11.499, 0, 5.7495)68.569.9651.415
R2(5.7495, 0, 2.8748)26.128.2972.197
R1(0, 0, 0)20.520.7280.228
Table 3. Simulation condition setting.
Simulation Condition NumberMotion StateOperational Pressure
MPa
Insulating Layer Thickness
m
1Static condition0.50.2
2Static condition0.850.2
3Static condition1.20.2
4Uniform deceleration linear motion
V m / s = 22 m / s 4.4 m / s 2 t s
0.50.2
50.85
61.2
7Static condition0.850.35
8Uniform deceleration linear motion
V m / s = 22 m / s 4.4 m / s 2 t s
0.50.35
90.85
101.2
11Static condition1.20.5
12Uniform deceleration linear motion
V m / s = 22 m / s 4.4 m / s 2 t s
0.50.5
130.85
141.2
Disclaimer/Publisher’s Note: The statements, opinions and data contained in all publications are solely those of the individual author(s) and contributor(s) and not of MDPI and/or the editor(s). MDPI and/or the editor(s) disclaim responsibility for any injury to people or property resulting from any ideas, methods, instructions or products referred to in the content.