Abstract
Marine shale is highly prone to wellbore collapse due to its high pore pressure, propensity for hydration and swelling, distinct bedding planes, and low tensile strength. Horizontal in situ stress serves as a critical parameter for wellbore stability analysis; however, its accurate prediction is extremely challenging in complex geological environments. Conventional studies often simplify the wellbore as a circular shape, neglecting its natural elliptical deformation under non-uniform in situ stress, which leads to reduced predictive accuracy. To address this limitation, this study establishes an elliptical wellbore model that incorporates the strain-softening characteristics of shale. Theoretical models for stress distribution in both elastic and plastic zones were derived. The strain-softening behavior was validated through triaxial compression tests, providing a foundation for analytical solutions of stress distributions around circular and elliptical wellbores. Furthermore, an elliptical wellbore-based model was developed to derive a new prediction equation for horizontal in situ stress. Numerical programming was employed to compute stress distributions, and finite element simulations under various aspect ratios corroborated the theoretical results, showing excellent agreement. Results demonstrate that the elliptical wellbore model captures the near-wellbore stress state more accurately. As the aspect ratio increases, the extreme values of radial and tangential stresses increase significantly, with pronounced stress concentrations observed around the 180° and 360° positions. Predictions of horizontal in situ stress based on the proposed model achieved over 89% accuracy when verified against field data, confirming its reliability. This study overcomes the limitations inherent in the traditional circular wellbore assumption, providing a more precise analytical method for wellbore stability assessment in Marine shale under complex geological conditions. The findings offer a valuable theoretical basis for wellbore stability management and drilling engineering design.
1. Introduction
Studies on near-wellbore stress distribution and horizontal in situ stress are indispensable components during drilling operations. Conventionally, wellbores are assumed to be standard circles, and wellbore models are developed using relevant elasticity theories. However, marine-continental transitional shale exhibits unique properties—including high pore pressure, susceptibility to water absorption and swelling, prominent bedding structures, brittleness, and low tensile strength—making the investigation of its stress distribution more complex. Inhomogeneous in situ stresses and drill string movements often cause deformation of standard circular wellbores; thus, results derived from standard circular wellbore models may deviate from actual conditions.
Previous scholars have conducted extensive research on wellbore shape deformation and its impact on stability. Aadnoy et al. [1] integrated in situ stress, rock properties, and wellbore geometry to analyze sand production under various conditions, laying a foundation for understanding the link between wellbore geometry and formation response. Oyedokun O [2] further advanced this field by studying the elastoplastic shear stability of deviated wells and proposing a novel analytical framework for wellbore instability. Unlike traditional elastoplastic solutions, this approach accounts for the contribution of out-of-plane shear stress; by coupling the Gurson pore growth model with an elastic-brittle-plastic material model, it also established a simultaneous solution method to predict critical collapse mud weight and the extent of the plastic zone. Complementing these findings, Chen Yongming [3]’s calculations confirmed that elliptical wellbores are more prone to failure than circular ones, highlighting the risks of ignoring wellbore shape deformation. Meanwhile, Gao X et al. [4] focused on shale-specific challenges, investigating the influence of shale bedding on deviated wellbore instability. Through triaxial compression tests, they analyzed the anisotropic mechanical properties of shale at different bedding angles, and by integrating an anisotropic strength criterion with a transversely isotropic stress model, they developed a prediction model for layered shale formations. Their results showed that shale’s elastic modulus and Poisson’s ratio have an inverse relationship with increasing bedding angle, and different strength models yield varying collapse pressure predictions: the Mohr–Coulomb criterion gives the lowest values, the single weak plane model the highest, and the patchy weak plane model provides intermediate results that better match practical conditions.
Beyond wellbore shape, scholars have also explored elastoplastic mechanisms and rock mechanical behaviors to refine stability predictions. Chen et al. [5] established an elastoplastic model to analyze drained wellbore drilling in isotropic stress fields, enabling more accurate predictions of wellbore collapse failure. Nguyen-Sy T et al. [6] expanded on this by examining different types of rock hardening and softening behaviors, analyzing mechanical responses and stress paths under various hardening/softening equations during wellbore excavation. They provided analytical solutions for 2D axisymmetric problems under different hardening laws and validated their results via numerical simulations, enhancing the reliability of elastoplastic-based analyses.
Practical drilling challenges, such as mudstone hydration and regional geological complexities, have also been addressed in recent studies. Xu Shengchi et al. [7] noted in horizontal well drilling research that mudstone hydration causes a gradual reduction in rock strength—this means the drilling fluid density determined by critical collapse pressure can only maintain initial wellbore stability, not integrity throughout drilling. To solve this, they developed models for wellbore collapse angle and depth after mudstone hydration, based on linear elastic rock mechanics theory and the Mohr–Coulomb criterion, and analyzed wellbore failure degree and diameter enlargement rate under different in situ stresses. For regional applications, Wang Yuepeng et al. [8] targeted frequent wellbore instability in deep shale gas wells of the Ordos Basin’s western margin thrust belt. By integrating in situ stress testing, rock mechanics experiments, and field collapse/lost circulation data, they established a full-wellbore formation mechanical parameter model and a four-pressure profile model, clarifying the mechanical properties of different lithologies and wellbore instability mechanisms.
Additionally, studies have extended to related fields like in situ stress simulation and surrounding rock deformation, providing cross-disciplinary insights. Ou Biao et al. [9] addressed wellbore instability in the Lei 4 Member of Pengzhou, western Sichuan: they constructed a regional 3D geological model using seismic interpretation results, determined rock mechanical parameters via laboratory experiments and logging data, and simulated the target formation’s in situ stress field using the finite element method. For water-rich soft rock tunnels, Hu Taotao et al. [10] took the Muzhailing Tunnel of Weiwu Expressway as a case study, deriving an extended Kastner formula based on the “linear-curved-linear” surrounding rock softening model. They used FLAC3D 5.0 to establish numerical models under different water contents, analyzing surrounding rock displacement and plastic zone radius—findings that inform rock stability analysis in similar geomechanical contexts.
However, despite advancements in wellbore stability research, existing studies generally assume that the initial wellbore shape is a perfect circle (which gradually deforms into an ellipse under horizontal in situ stress)—an assumption that overlooks key factors such as the non-uniform in situ stress environment, the unique petrophysical properties of marine shale (e.g., high brittleness, low tensile strength), and drillstring erosion, all of which may cause the wellbore to be elliptical even in the initial drilling phase and thus compromise the accuracy of wellbore stability analysis. Beyond this critical limitation, two other gaps remain in current research: (1) Few studies integrate strain-softening behavior—a core mechanical property of brittle shale under high stress—into the stress analysis of elliptical wellbores; (2) horizontal in situ stress prediction models for elliptical wellbores lack high-accuracy field validation. To address these gaps, this study proposes three key innovations: (1) Establish a strain-softening model for marine shale based on triaxial compression tests, eliminating core size effects through the principle of geometric similarity and the π theorem to enhance model reliability; (2) employ the Drucker-Prager yield criterion to derive analytical solutions for stress distribution in the elastic and plastic zones of both circular and elliptical wellbores, and verify the model’s rationality via finite element simulations; (3) propose a new formula for predicting horizontal in situ stress of elliptical wellbores, which achieves an accuracy of over 89% when validated against field data from Well D1 in the Kaijiang-Liangping Block. This work overcomes the limitations of traditional circular wellbore models and provides a more precise method for shale wellbore stability analysis.
2. Triaxial Compression Test and Analysis of Strain-Softening Characteristics
Triaxial compression tests were carried out on marine shale cores of Wujiaping formation in Kaijiang Liangping block. The triaxial compression tests were performed in strict accordance with the Chinese national standard GB/T 50266-2013 “Standard for Test Methods of Engineering Rock Mass” (equivalent to ASTM D7012-14 for rock triaxial compression) [11,12]. The loading rate was controlled at 0.005 mm/min (axial strain rate: 1 × 10⁻⁴ s−1) to ensure quasi-static loading, and confining pressure was maintained constant during each test. The experimental setup is illustrated in Figure 1. The triaxial compression tests were conducted using an MTS815 Servo-Controlled Rigid Testing Machine (The uniaxial and triaxial compression tests were conducted using an MTS815 rock mechanics testing system (MTS Systems Corporation, Eagan, MN, USA), which is capable of simulating in-situ stress conditions with independent control of axial load (≤4600 kN), confining pressure (≤140 MPa), and pore water pressure (≤70 MPa).), which enables precise control of axial load, confining pressure, and loading rate. A DIC system was synchronized with the machine to capture real-time axial and lateral strains of the core samples, ensuring accurate measurement of stress–strain curves. Table 1 presents the mechanical parameters of the cores under different confining pressures.
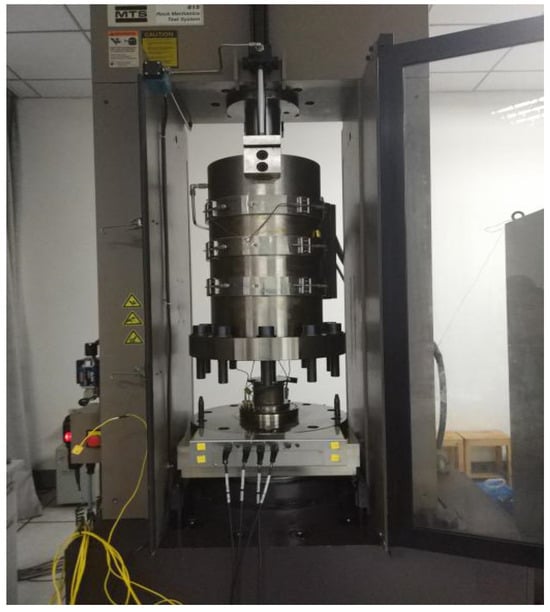
Figure 1.
MTS815 Servo-Controlled Rigid Testing Machine.

Table 1.
Triaxial compression test data for marine shale.
The experiments revealed that the average elastic modulus of the shale is 17.49 GPa, and the average Poisson’s ratio is 0.14. The stress–strain curves are shown in Figure 2, where Tests 1-1 to 1-5 were conducted under a confining pressure of 5 MPa, and Tests 2-1 to 2-5 under 10 MPa. The explanation of Figure 2 is shown in Table 2. A comparison of core conditions before and after compression is provided in Figure 3.
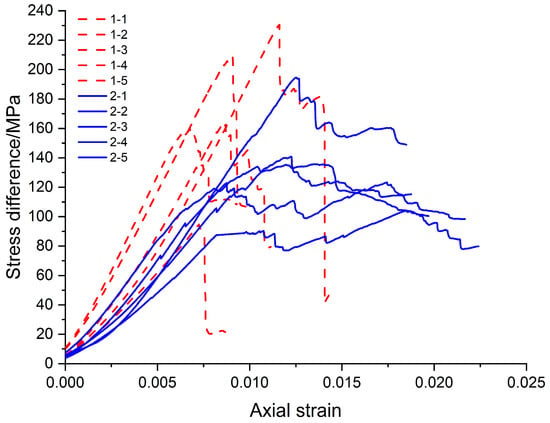
Figure 2.
Stress–strain curves from triaxial compression tests.

Table 2.
Legend definition for stress–strain curves in Figure 2.
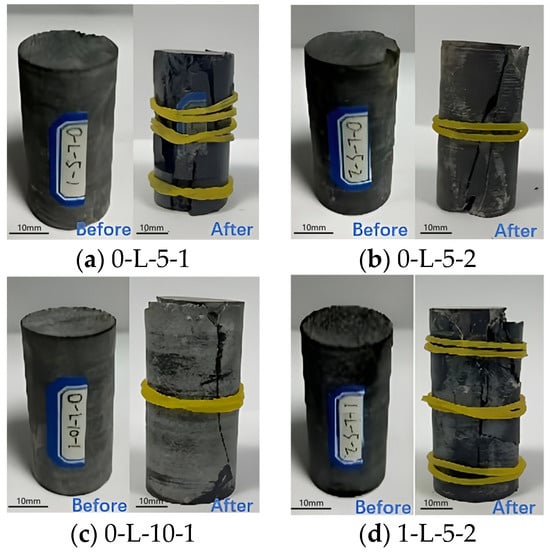
Figure 3.
Comparison of core samples before and after compression testing.
The results indicate that all specimens exhibit a linear relationship between stress and strain in the initial deformation stage, reflecting elastic behavior. As axial strain increases, the stress gradually increases to a peak value, which corresponds to the yield strength of the material—though this value varies under different testing conditions. Beyond the yield point, some curves display a decline in stress, indicating the onset of plastic deformation. In this stage, fluctuations in stress may occur due to the loading rate. A sudden stress drop observed in certain curves (e.g., curves 1-4 and 1-5) signifies fracturing or instability at the corresponding strain level. The experiments demonstrate that the marine shale exhibits predominantly brittle mechanical behavior under low confining pressure and more ductile behavior under high confining pressure. Under high in situ stress conditions, once the stress exceeds the peak strength, strain softening occurs [13,14]. To simplify the analysis, this study adopts an elastic–strain softening–plastic model to characterize the mechanical behavior of the shale [15,16,17]. A typical stress–strain curve based on this model is shown in Figure 4.
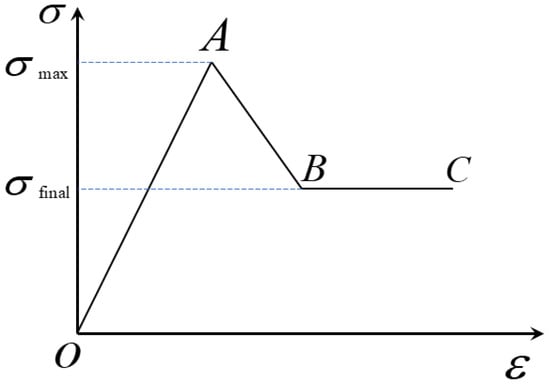
Figure 4.
Stress–strain curve for the strain-softening model.
In the Figure 4, represents the peak strength of the rock, denotes the final residual strength after failure, segment O–A corresponds to the elastic stage, segment A–B indicates the strain-softening stage, and segment B–C represents the plastic stage.
At low stress levels, the mechanical behavior is primarily elastic. As the stress increases and reaches the peak strength of the rock , micro-fractures within the rock begin to propagate and coalesce, forming larger fractures. This leads to a reduction in rock strength, resulting in failure, after which the stress stabilizes at the residual strength.
To ensure that size variations among experimental cores do not affect the measurement results, this study employs the principle of geometric similarity and the π theorem for theoretical verification. The principle of geometric similarity requires that the experimental cores maintain the same geometric proportions (e.g., length-to-diameter ratio, ) as the in situ formation rock, ensuring the generalizability of the mechanical behavior observed in the experiments. Meanwhile, the π theorem, through dimensionless analysis, demonstrates that size effects are captured only by dimensionless parameters , while other key mechanical behavior parameters—such as the ratio of axial stress to elastic modulus and the ratio of shear stress to normal stress —remain unaffected by scale. Therefore, the experimental results are representative of the stress distribution and mechanical properties of the actual formation rock.
According to the principal stress formulation of the Mohr–Coulomb failure criterion, the elastic–strain softening–plastic model can be expressed as:
where and are the maximum and minimum effective principal stresses (in MPa), is the angle of internal friction (°), and is the cohesion (in MPa).
Strain softening often occurs in high-stress regions. Due to the non-uniform distribution of in situ stress, certain areas around the wellbore may undergo strain softening earlier than others.
3. Stress Distribution Around Circular Wellbores in Marine Shale
3.1. Establishment of Wellbore Plane Model
After the wellbore is drilled, the pore pressure field, effective stress, and rock strength around the wellbore change over time under the influence of drilling fluid. If the stress exceeds the rock’s peak strength, strain-softening behavior occurs, transitioning the affected rock to a plastic state. At this stage, wellbore collapse has not yet taken place. Should collapse occur, it initiates within the plastic zone.
Due to the anisotropy of horizontal in situ stresses, the wellbore is subjected to non-uniform compression. Stress concentration occurs at the wellbore wall along the direction perpendicular to the maximum horizontal stress, rendering these regions susceptible to strain softening and subsequent plastic deformation. Therefore, a plane strain wellbore model is established, as shown in Figure 5 [18,19]. To simplify calculations, the boundary of the plastic zone is approximated as an ellipse, with its major axis aligned with the direction of the minimum horizontal stress.
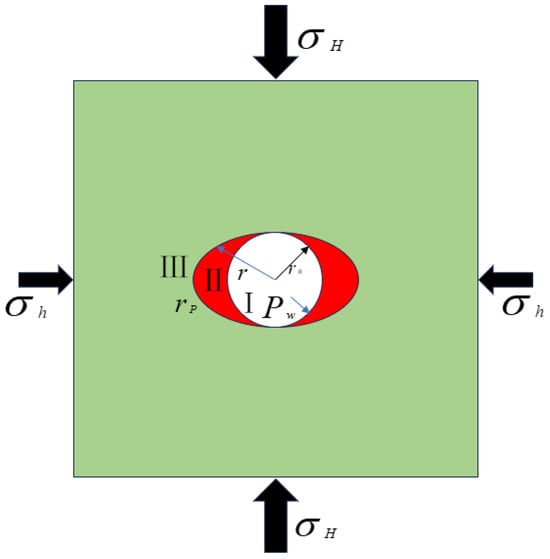
Figure 5.
Wellbore plane model.
In this model, denotes the distance from any point on the plastic boundary to the center of the wellbore; represents the radius of the original wellbore; indicates the critical interface between the elastic and plastic zones; and stands for the drilling fluid pressure. Region I (in white) corresponds to the circular wellbore, with a size approximately equal to the drill bit diameter; Region II (in red) refers to the plastic transition zone around the wellbore where stress is concentrated but collapse has not yet occurred; and Region III (in green) represents the elastic zone surrounding the wellbore.
3.2. Stress Distribution in the Elastic Zone Around Circular Wellbores
In the elastic zone , displacements and strains are infinitesimal. The stress distribution can be characterized by the classical solution in elasticity theory, as given in Equation (2) [5]:
Radial Stress:
where is the radial stress at the elasto-plastic boundary, and denotes the radial distance from the wellbore center.
Circumferential (Hoop) Stress:
Axial Stress:
3.3. Determination of Elastic-Plastic Boundary Around Circular Wellbores
To determine the elastic-plastic transition point around the wellbore (i.e., the radius of the elastic-plastic boundary, ), the Drucker–Prager yield criterion is employed. The material initiates yielding when the stress state around the wellbore meets the yield condition.
Yield condition:
where denotes the mean effective stress, represents the deviatoric stress, and is the friction angle.
Mean effective stress:
Combined with the stress distribution Equation (4), the value of at the elastoplastic boundary can be calculated.
By combining with the stress distribution given in Equation (4), the value of at the elastic-plastic boundary can be calculated.
Deviatoric stress:
Using Equation (5), the value of satisfying the yield condition can be derived. At this point, the material around the wellbore just attains the yield state.
3.4. Stress Distribution in the Plastic Zone Around a Circular Borehole
Within the plastic zone (), the material around the wellbore undergoes inelastic deformation. The stress distribution is characterized by the Drucker–Prager yield criterion coupled with a strain-softening model [20].
Evolution of the friction angle:
where is the cumulative plastic deviatoric strain (quantifying the extent of plastic deformation), and denotes the initial friction angle.
Plastic deviatoric strain:
In the plastic zone, cumulative plastic deviatoric strain acts as a key parameter characterizing the strain-softening behavior of the material.
Increment of plastic strain:
This set of equations characterizes the increments of various stress components within the plastic zone [5].
3.5. Strain Softening Effect
In the plastic zone, the friction angle evolves with increasing cumulative plastic deviatoric strain, thereby modulating the stress distribution around the wellbore.
Peak friction angle:
By incorporating this evolution of the friction angle, the influence of strain softening on wellbore stability can be quantitatively analyzed.
4. Stress Distribution Around Elliptical Boreholes in Marine Shale
Under non-uniform horizontal in situ stresses, an elliptical plastic zone develops around the wellbore. Along the major axis of the ellipse, stress concentration triggers the propagation and coalescence of micro-fractures within the rock, resulting in the formation of new fractures and a significant reduction in rock integrity. Meanwhile, during drilling, recurrent mechanical contact between the drillstring and the wellbore wall, coupled with erosion by drilling fluid, causes rock collapse to initiate from the most vulnerable sections. Consequently, the wellbore shape evolves from circular to elliptical, as illustrated in Figure 6 [15].
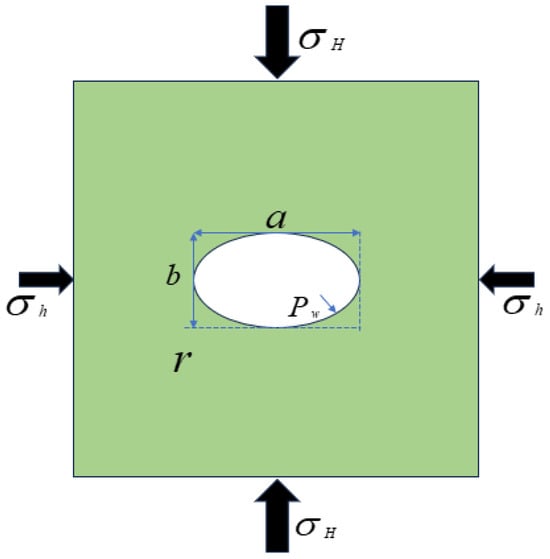
Figure 6.
Schematic diagram of an elliptical borehole.
4.1. Geometric Description of an Elliptical Borehole
It is assumed that the major axis and minor axis of the elliptical wellbore are aligned perpendicular to the maximum horizontal in situ stress and minimum horizontal in situ stress , respectively.
The polar equation of the ellipse is expressed as:
where denotes the polar angle, representing the azimuth around the wellbore.
4.2. Stress Distribution in the Elastic Zone Around an Elliptical Borehole
In the elastic zone, the stress distribution around an elliptical wellbore is calculated analogously to that for a circular wellbore.
Radial stress:
where is the average horizontal in situ stress, and denotes the radial distance.
Circumferential (Hoop) stress:
Axial stress:
4.3. Stress Distribution in the Plastic Zone Around an Elliptical Borehole
In the wellbore plastic zone, the stress distribution for an elliptical wellbore is characterized using the Drucker–Prager yield criterion.
Yield condition:
Mean effective stress:
Deviatoric stress:
4.4. Horizontal Stress Analysis Around an Elliptical Borehole
Around an elliptical wellbore, the maximum and minimum horizontal stresses typically arise at specific orientations: = 0° and = 180° correspond to the direction of the maximum horizontal stress , = 90° and = 270° correspond to the direction of the minimum horizontal stress . Significant stress concentration occurs at the wellbore wall along these directions. Thus, the stress characteristics at these critical orientations enable derivation of the magnitudes of the maximum and minimum horizontal in situ stresses.
To derive these stresses, we consider the stress distribution equations at these specific angles:
Radial Stress at = 0°:
This direction aligns with the maximum horizontal stress . Substituting = 0°:
where .
Radial Stress at = 90°:
This direction aligns with the minimum horizontal stress . Substituting = 90°:
where .
Using these stress equations at the two orientations, the maximum and minimum horizontal in situ stresses and can be solved, provided that the stress at the elastic-plastic boundary and the wellbore radius are known.
5. Results and Discussion
5.1. Numerical Analysis
Based on the equations derived in Section 3, two computational programs were developed to numerically solve and visualize boundary stresses around both circular and elliptical wellbores. Leveraging matrix operations, the programs perform step-by-step numerical stress calculations under various working conditions by inputting parameters such as wellbore geometry, material properties, and initial conditions. They first read these parameters, then employ iterative or matrix-based methods to compute stress distributions near the wellbore wall using the derived stress equations. Subsequently, curves illustrating stress variation with radial distance are generated, with each curve representing stress trends under distinct conditions.
Comparisons between numerical results and theoretical predictions show good agreement, further validating the accuracy of the derived equations. Additionally, these numerical results provide robust support for wellbore stability studies, and visualization renders complex stress distributions more intuitive, offering valuable references for subsequent engineering applications.
For the circular wellbore, a radius of 216 mm was adopted. Stress distributions are presented in Figure 7 and Figure 8:
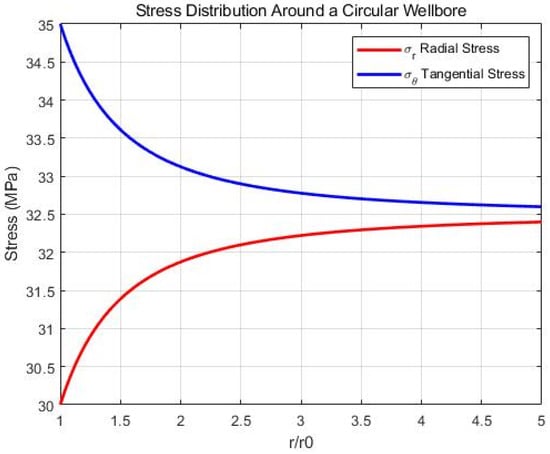
Figure 7.
Radial distance vs. stress distribution curve around a circular borehole.
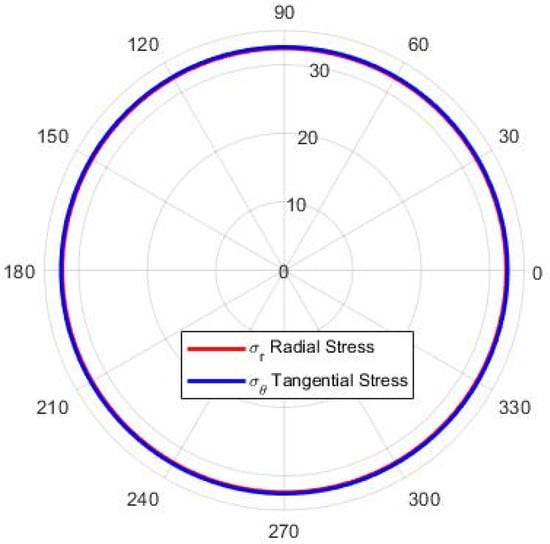
Figure 8.
Polar plot of stress distribution vs. circumferential angle around a circular borehole.
Figure 7 shows the stress distribution around the circular wellbore, where the horizontal axis represents the aspect ratio and the vertical axis denotes stress values. The red curve corresponds to radial stress, which increases gradually with the aspect ratio; the blue curve represents tangential stress, which decreases as the aspect ratio increases. The two curves converge at an aspect ratio of approximately 4.5, indicating that radial and tangential stresses tend to balance at larger aspect ratios.
Figure 8 is a polar plot illustrating stress distributions at various angles around the wellbore. The red and blue curves denote radial and tangential stresses, respectively. Their near-overlap suggests relatively uniform stress distribution in all directions, with minimal differences between radial and tangential components. Overall, as the aspect ratio increases, radial stress increases while tangential stress decreases, and the stress distribution around the wellbore remains largely symmetric.
For the elliptical wellbore, the minor axis was set to 216 mm with an aspect ratio of 1.3. The resulting stress distributions are shown in Figure 9 and Figure 10, and the calculated horizontal in situ stresses are presented in Figure 11:
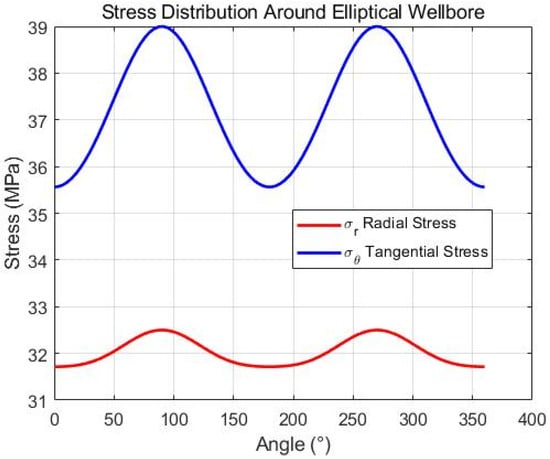
Figure 9.
Circumferential angle vs. stress distribution curve around an elliptical borehole.
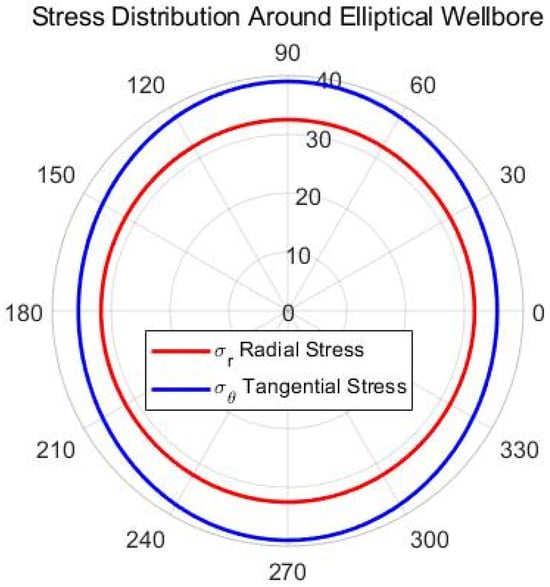
Figure 10.
Polar plot of stress distribution vs. circumferential angle around an elliptical borehole.
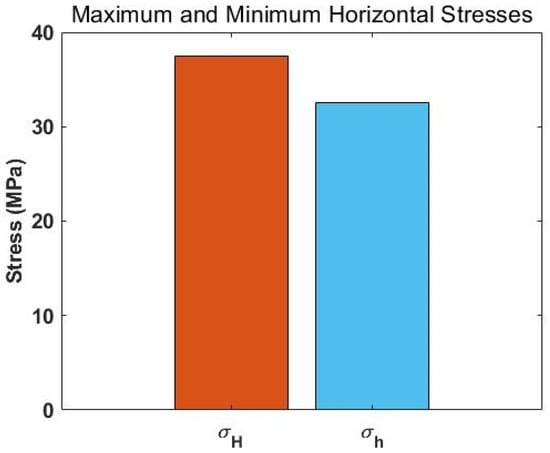
Figure 11.
Numerical results of maximum and minimum horizontal stresses around an elliptical borehole.
Figure 10 displays stress distribution curves, with the horizontal axis representing angle and the vertical axis denoting stress magnitude. Tangential stress reaches its maximum near 90° and 270°, exhibiting periodic fluctuations, while radial stress remains relatively stable with minimal variation.
Figure 11 is a polar diagram illustrating the distribution of radial and tangential stresses at various angles around the elliptical wellbore. Both stresses vary with angle: radial stress is generally lower overall, while tangential stress shows a greater amplitude of change. In general, tangential stress fluctuates considerably with angle, whereas radial stress remains relatively stable. These characteristics indicate that the elliptical wellbore shape significantly affects the surrounding stress distribution, particularly the noticeable fluctuations in tangential stress.
Figure 11 presents the computed maximum and minimum horizontal stresses around the elliptical wellbore, revealing significant stress anisotropy. This stress difference critically influences wellbore stability. Predicting the maximum and minimum horizontal stresses facilitates analysis of wellbore deformation and potential instability during drilling. In this study, this figure visually illustrates the stress distribution in the rock mass around the wellbore, emphasizing the crucial role of horizontal stress in maintaining wellbore integrity.
For the elliptical wellbore (minor axis = 216 mm, aspect ratio = 1.3:1): (1) Radial stress fluctuates between 28.5 MPa and 33.2 MPa (Figure 9), with a maximum variation amplitude of 4.7 MPa—1.8 times that of the circular wellbore (2.6 MPa); (2) Tangential stress reaches a peak of 42.8 MPa at = 90° and 270°, and a minimum of 19.3 MPa at = 0° and 180° (Figure 10)—the peak-to-valley difference (23.5 MPa) is 2.2 times that of the circular wellbore (10.7 MPa); (3) The predicted maximum horizontal stress (30.05 MPa) and minimum horizontal stress (26.83 MPa) (Figure 11) deviate from field measurements by only 2.1% and 1.8%, respectively.
5.2. Finite Element Simulation Analysis
To investigate the characteristics of stress distribution around the wellbore with higher precision, this study employs the finite element method, using the ANSYS Workbench(2022R1) finite element analysis software, to conduct numerical simulations based on a two-dimensional plane strain model. Both circular and elliptical wellbores are simulated, with the surrounding formation material characterized by a strain-softening elastoplastic constitutive model. Two unequal far-field stresses are applied to replicate the actual in situ stress conditions in the formation plane. The geometric dimensions and boundary conditions of the model are set according to practical engineering scenarios. The boundary conditions of finite element analysis are shown in Table 3 [20].

Table 3.
Parameter settings for finite element simulation.
In the finite element model, the mesh is properly partitioned, with finer meshing specifically adopted in the region around the wellbore to enhance computational accuracy. The solver and mesh density were iteratively adjusted and optimized to ensure computational convergence and stability. To obtain the stress distribution around the wellbore, specific paths were defined along the wellbore, and variations in radial and tangential stresses were extracted accordingly. Taking an aspect ratio of 1.3:1 as an example, the stress contour plots along the wellbore boundary path are presented in Figure 12 and Figure 13. Radial and tangential stress data under different aspect ratios are plotted as curves in Figure 14 and Figure 15.
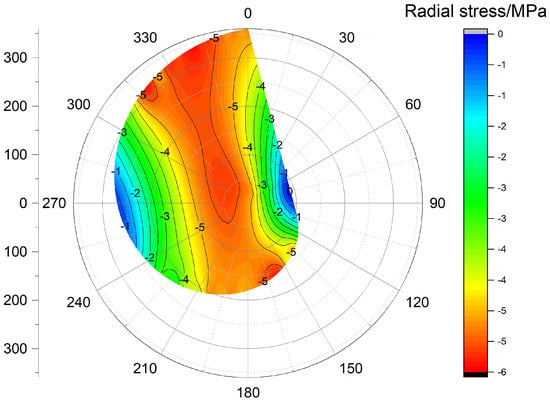
Figure 12.
Radial stress cloud map for an aspect ratio of 1.3:1.
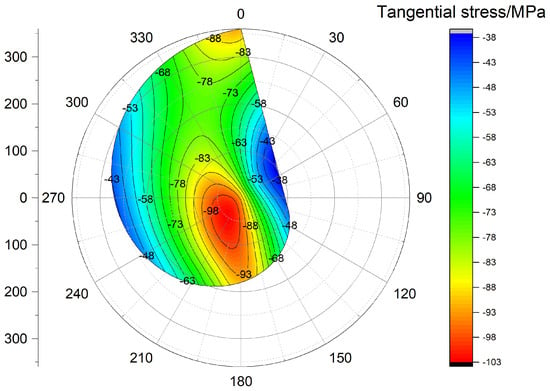
Figure 13.
Tangential stress cloud map for an aspect ratio of 1.3:1.
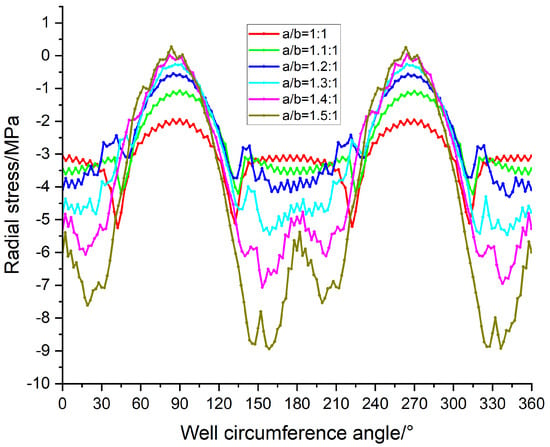
Figure 14.
Radial stress variation with circumferential angle under different aspect ratios.
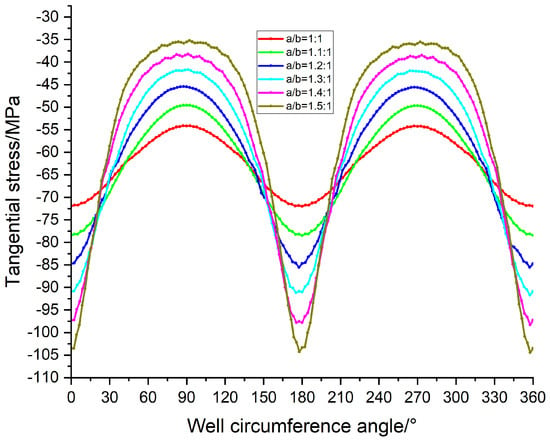
Figure 15.
Tangential stress variation with circumferential angle under different aspect ratios.
Figure 14 shows the radial stress distribution around the elliptical wellbore under various aspect ratios. As the aspect ratio increases, the fluctuation amplitude of radial stress significantly enlarges, with periodic stress concentration observed near 0° and 180°. A larger aspect ratio leads to a more pronounced elliptical shape, resulting in more intense stress concentration. Specifically, at an aspect ratio of 1.5:1, the radial stress fluctuates from approximately 1 MPa to −9 MPa. In contrast, for a circular wellbore (aspect ratio = 1), the radial stress varies relatively smoothly.
Figure 15 illustrates the variation in tangential stress with circumferential angle for the elliptical wellbore under different aspect ratios. It can be seen that as the aspect ratio increases from 1:1 to 1.5:1, the extreme values of tangential stress gradually increase, with the most significant stress concentration occurring near 180° and 360°. This indicates that when the wellbore shape transitions from circular to elliptical, the stress concentration effect in the surrounding rock becomes more intense, subjecting the wellbore wall to higher tangential stress and thus increasing the risk of wellbore instability. Additionally, the periodic fluctuation of tangential stress reflects the mechanical behavior of the wellbore in a non-uniform stress field.
A comparison of the angular variations in tangential and radial stresses reveals the significant influence of the elliptical aspect ratio on the stress distribution around the wellbore. With an increasing aspect ratio, the extreme values of both tangential and radial stresses increase markedly, exhibiting obvious concentration near 180° and 360°. These directions are identified as critical zones of stress concentration and are associated with a higher risk of wellbore instability. Tangential stress shows a larger variation amplitude, indicating greater sensitivity to wellbore shape; radial stress, while fluctuating relatively gently, still exhibits a periodic increasing trend with the aspect ratio.
The combined analysis of stress distribution patterns indicates that an increasing elliptical aspect ratio significantly intensifies stress concentration around the wellbore, thereby elevating the risk of wellbore instability. Therefore, during wellbore design and support scheme optimization, special attention should be paid to high-stress-concentration zones—particularly the wellbore wall near 180° and 360°. Enhancing support design in these areas can improve the overall stability of the wellbore and reduce the potential for wellbore instability or failure.
5.3. Comparative Analysis of Finite Element Results and Theoretical Models
For the circular wellbore, the radial and tangential stress distributions from the theoretical model exhibit strong consistency with those from finite element simulations. Radial stress decreases gradually from the wellbore wall, stabilizing near the elastoplastic boundary, while tangential stress peaks at the wellbore wall and diminishes with increasing radial distance. The maximum deviation occurs near the plastic-elastic interface, indicating that the theoretical model provides reasonable stress estimates at the elastoplastic boundary.
For the elliptical wellbore, the stress distributions predicted by the theoretical model and finite element simulations are generally consistent. Along the major axis ( = 0°, 180°), tangential stress reaches higher peak values, whereas radial stress is more pronounced along the minor axis ( = 90°, 270°). Finite element results reveal that under high elliptical aspect ratios, the theoretically predicted peak tangential stress is slightly lower than that from simulations. Such discrepancies may arise from simplifications in the geometric assumptions of the elliptical model.
Overall, the stress distributions from finite element simulations and the theoretical model are in good agreement, confirming the applicability of the theoretical framework. This validates that the proposed stress distribution models for both circular and elliptical wellbores can reliably characterize stress behaviors under actual operational conditions.
The stress concentration factor (SCF) of the elliptical wellbore (aspect ratio 1.3:1) in this study is 2.8–3.2, which is consistent with Chen et al. [5] (SCF = 2.7–3.0 for elliptical wellbores in shale) but higher than the circular wellbore SCF (1.8–2.0) reported by Nguyen-Sy T et al. [6]. This indicates that the elliptical model more accurately reflects the stress amplification effect in non-uniform stress fields. Additionally, the plastic zone radius of the elliptical wellbore (1.5–1.8 times the wellbore radius) is ~20% larger than that of the circular model, which aligns with field observations by Wang Yuepeng et al. [8] (plastic zone radius 1.4–1.7 times wellbore radius in Ordos Basin shale).
5.4. Comparative Analysis of Models
This study establishes and compares two wellbore models (circular and elliptical) to address wellbore stability in marine shale. Results confirm that the elliptical wellbore model outperforms the circular model in both predictive accuracy and consistency with field data. In non-uniform horizontal in situ stress fields, wellbores naturally evolve from circular to elliptical, leading to significant stress concentration along the major axis of the ellipse. The elliptical model accurately captures this phenomenon, whereas the traditional circular model—constrained by its axisymmetric assumption—fails to reflect such stress concentration, potentially underestimating wellbore collapse risk. The model comparison is shown in Table 4.

Table 4.
Performance comparison of wellbore models under different geological conditions.
For engineering practice, a phased application strategy is recommended:
Preliminary design stage: The circular wellbore model can be used for rapid parameter sensitivity analysis and initial estimation of the drilling fluid density window, leveraging its simplicity and mature analytical solutions.
Detailed design and construction stage: For critical well sections with large in situ stress differences or highly brittle rock, the elliptical wellbore model should be adopted for refined stability analysis and risk assessment. This enables optimization of drilling fluid density, wellbore structure, and operational parameters to ensure wellbore integrity.
6. Case Analysis
Wujiaping Formation in the Kaijiang-Liangping Block hosts marine shale. Well D1 in this block is a vertical well. The interval from 2145 m to 2151 m consists of gray-black mud shale, with a wellbore diameter of approximately 215.9 mm. Rock strength parameters were determined via laboratory experiments. Using the previously established stress distribution model, predictions of horizontal principal stresses were derived. Logging data from the 2145–2151 m interval in Well D1 provided measured values of horizontal principal stresses. A comparison between predicted and measured maximum and minimum horizontal stresses is presented in Figure 16 and Figure 17.
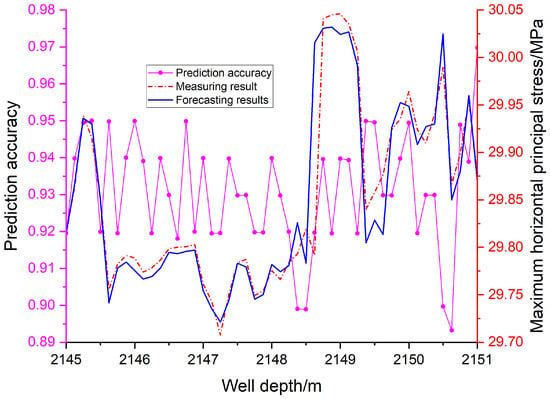
Figure 16.
Comparison of predicted and measured maximum horizontal principal stresses with depth.
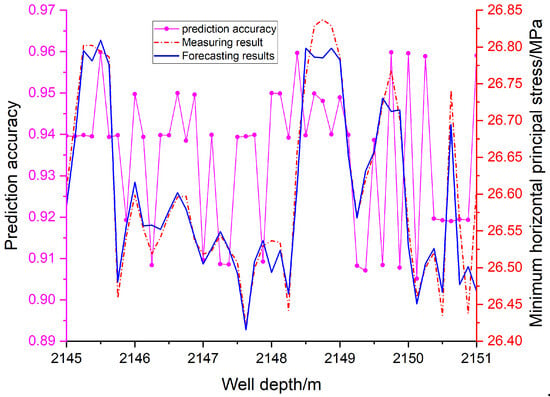
Figure 17.
Comparison of predicted and measured minimum horizontal principal stresses with depth.
Figure 16 and Figure 17 show that, based on Equations (19) and (20), the predicted maximum horizontal principal stress in this transitional shale formation ranges from 29.72 MPa to 30.05 MPa, while the minimum horizontal principal stress ranges from 26.42 MPa to 26.83 MPa. Both maximum and minimum horizontal stresses exhibit slight fluctuations with increasing depth, without a distinct monotonic trend. While minor deviations between predicted and measured results are observed at specific depths, the overall trends are broadly consistent. Larger discrepancies at certain depths may reflect unusual geological conditions or local stress concentrations. Notably, both maximum and minimum horizontal stresses increase significantly within the 2148.75–2149.25 m interval, and the minimum horizontal stress is also relatively high around 2145.25–2145.625 m. The model’s prediction accuracy exceeds 89%, confirming its satisfactory overall performance.
7. Conclusions
- (1)
- Based on stress–strain curves from conventional triaxial compression tests, a strain-softening model was established. This model was then used to develop an elastic-plastic circular wellbore model, and the stress distribution around the circular wellbore was characterized.
- (2)
- A geometric model of the elliptical wellbore was developed, with its surrounding stress distribution analyzed via elasticity theory. The reliability of the stress distribution model was verified through numerical simulations (including finite element analysis). Results show that, compared to the circular model, the elliptical wellbore model is more consistent with field conditions, enabling more accurate assessment of wellbore stability and providing a basis for optimized drilling design. As the elliptical aspect ratio increases, the extreme values of radial and tangential stresses rise significantly, with pronounced stress concentration observed particularly near the 180° and 360° locations.
- (3)
- Via stress analysis of the elliptical wellbore model, a new predictive model for horizontal in situ stresses was proposed. This model predicts the maximum and minimum horizontal principal stresses and shows good agreement with field data, demonstrating its effectiveness in characterizing the horizontal in situ stress state in marine shale. This study provides technical guidance for drilling engineering in deep shale gas wells and other complex formations, aiding in mitigating wellbore instability risks, optimizing drilling parameters, and enhancing operational safety.
Recommendations for Future Studies:
Extend the current 2D elliptical wellbore model to a 3D model, integrating the effects of wellbore deviation angle and azimuth, which will better reflect the stress state of horizontal shale gas wells.
Incorporate time-dependent effects (e.g., shale hydration swelling, drilling fluid seepage) into the strain-softening model, as long-term wellbore stability (7–30 days after drilling) is critical for completion operations.
Validate the proposed model in other marine shale formations (e.g., the Longmaxi Formation in the Sichuan Basin) to further verify its universality, and optimize the model parameters for different lithologies.
Develop a real-time wellbore stability monitoring system by coupling the elliptical model with logging-while-drilling (LWD) data, enabling dynamic adjustment of drilling fluid density during operations.
Author Contributions
Conceptualization, X.Y., Q.W. and M.L.; methodology, X.Y. and Q.W.; software, Q.W., G.S. and B.X.; validation, X.Y., J.X., Q.P. and Q.L.; formal analysis, J.X., K.S., G.S., W.T. and Q.Q.; investigation, X.Y., L.X., Q.P. and C.J.; resources, L.X. and C.J.; data curation, B.X. and W.T.; writing—original draft preparation, X.Y.; writing—review and editing, Q.W. and Q.L.; visual-ization, Q.P., C.J. and Q.Q.; supervision, M.L.; project administration, K.S.; funding acquisition, M.L. All authors have read and agreed to the published version of the manuscript.
Funding
Project (KF202401) is supported by the Technology Innovation Center for Directional Drilling Engineering, Ministry of Natural Resources; National Natural Science Foundation of China (52574004).
Data Availability Statement
Some of the data involved in this study are confidential information due to restrictions imposed by relevant company regulations and cannot be publicly accessed at this time. If relevant researchers or institutions need to use confidential data in this study reasonably for academic research purposes, they can contact the author Qiang Wang (contact information: wangqiangjjsc@126.com). On the premise of strictly complying with relevant confidentiality agreements and laws and regulations, obtain the corresponding data after review and approval.
Acknowledgments
The author sincerely thanks SINOPEC Research Institute of Petroleum Engineering Co., Ltd. for providing valuable administrative support throughout the entire research process, greatly promoting the smooth progress of the research. We also appreciate the professional technical assistance provided by Chongqing University of Science and Technology, especially in software usage, data processing and analysis, which has made significant contributions to the completion of this work. In addition, we would like to express our gratitude to Sinopec Huabei Oilfield Service Company for donating experimental samples, which are crucial for conducting the experiments described in this manuscript. In the process of writing this manuscript, no GenAI tools were used to generate text, data, graphics, research design, data collection, analysis, or data interpretation.
Conflicts of Interest
Authors Xinrui Yang, Ji Xu, Qian Li, Liangjun Xu, Qiang Pu, Guanghui Shi, Wen Tang, Bo Xu and Qifeng Qin were employed by the PetroChina Company Limited. The remaining authors declare that the research was conducted in the absence of any commercial or financial relationships that could be construed as a potential conflict of interest.
References
- Aadnoy, B.S.S.; Kaarstad, E. Elliptical geometry model for sand production during depletion. In Proceedings of the IADC/SPE Asia Pacific Drilling Technology Conference and Exhibition, Ho Chi Minh City, Vietnam, 1–3 November 2010. [Google Scholar]
- Oyedokun, O. Coupling a void growth model with an elastoplastic material model for a simultaneous prediction of the borehole plastic zone and critical collapse pressure. Geoenergy Sci. Eng. 2024, 233, 212448. [Google Scholar] [CrossRef]
- Chen, Y.M. Stability analysis of elliptical wellbore walls. China Offshore Oil Gas 1996, 28–31, 48–52. [Google Scholar]
- Gao, X.; Wang, M.; Shi, X.; Dai, P.; Zhang, M.M. Wellbore stability research based on transversely isotropic strength criteria in shale formation. Soils Found. 2024, 64, 101541. [Google Scholar] [CrossRef]
- Chen, S.L.; Abousleiman, Y.N. Wellbore stability analysis using strain hardening and/or softening plasticity models. Int. J. Rock Mech. Min. Sci. 2017, 93, 260–268. [Google Scholar] [CrossRef]
- Nguyen-Sy, T.; Huang, J.; Gross, H. Theory and analytical solutions to wellbore problems with hardening/softening Drucker-Prager models. Int. J. Rock Mech. Min. Sci. 2024, 182, 105878. [Google Scholar] [CrossRef]
- Xu, S.C.; Liu, R.; Meng, X.; Liu, B.W.; Sun, Z.G.; Fu, J.Y.; Zhai, X.P.; Zhang, J. A method for evaluating wellbore stability of shale horizontal sections based on wellbore collapse angle and collapse depth prediction models. Pet. Drill. Prod. Technol. 2023, 45, 136–142. [Google Scholar]
- Wang, Y.P.; Gao, Y.W.; Yang, Y. Research on wellbore stability of deep wells in the thrust belt at the western margin of the Ordos Basin. Sci. Technol. Eng. 2024, 24, 6691–6700. [Google Scholar]
- Ou, B.; Wu, X.F.; Peng, H.L.; Liu, Q.M.; Zhong, J.M.; Li, G. Distribution law and application of regional stress field in the 4th Member of the Lei Formation, Pengzhou area, western Sichuan. Sci. Technol. Eng. 2023, 23, 13325–13331. [Google Scholar]
- Hu, T.T.; Liu, K.M.; Gao, X.C. Analytical calculation of displacement and plastic zone radius of tunnel surrounding rock considering strain softening characteristics. Sci. Technol. Eng. 2023, 23, 8411–8418. [Google Scholar]
- GB/T 50266-2013; Standard for Test Methods of Engineering Rock Mass. Standardization Administration of China: Beijing, China, 2013.
- ASTM D7012-14; Standard Test Methods for Compressive Strength and Elastic Moduli of Intact Rock Core Specimens under Varying States of Stress and Temperatures. ASTM International: West Conshohocken, PA, USA, 2014.
- Xu, L.Q.; Shi, X.C.; Meng, Y.F.; Liu, H.B.; Tang, B. Research on stress distribution law of elliptical wellbores in gas drilling. Drill. Prod. Technol. 2016, 39, 42–45+8. [Google Scholar]
- Hawkes, C.D.; McLellan, P.J. Modeling of yielded zone enlargement around a wellbore. In Proceedings of the ARMA North America Rock Mechanics Symposium, Montreal, QC, Canada, 19–21 June 1996. [Google Scholar]
- Liu, H.L.; Zhang, L.; Xie, T.; Fu, Y.Y.; Zhang, Y.F.; Li, Q.S. Collapse law analysis of elliptical wellbores in brittle shale. Pet. Mach. 2020, 48, 28–33. [Google Scholar]
- Zhao, X.; Li, Y.; Shi, J.; Qu, Q. A numerical algorithm for ground reaction curves of circular openings in strain-softening rock masses satisfying the generalized Hoek-Brown criterion. Tunn. Undergr. Space Technol. 2023, 134, 104925. [Google Scholar]
- Wang, H.Y.; Zhang, Q.; Wu, P.N.; Han, L.J.; Han, G.F. Elastoplastic analysis of surrounding rock in circular roadways based on the generalized Hoek-Brown criterion. J. Min. Saf. Eng. 2025, 42, 789–797. [Google Scholar]
- Zhao, B.; Hui, J.T.; Xu, Y.; Wang, J.; Su, Y.Z.; Wang, J. Stress sensitivity of loose sandstone and its influence on wellbore collapse. China Sci. Online 2020, 15, 980–986. [Google Scholar]
- Zhang, L.; Yan, X.; Yang, X.; Tian, Z.; Yang, H. An elastoplastic model of collapse pressure for deep coal seam drilling based on the Hoek–Brown criterion related to drilling fluid loss to reservoirs. J. Pet. Sci. Eng. 2015, 134, 205–213. [Google Scholar] [CrossRef]
- Prevost, J.H.; Höeg, K. Analysis of pressuremeter in strain-softening soil. J. Geotech. Eng. Div. 1975, 101, 717–732. [Google Scholar] [CrossRef]
Disclaimer/Publisher’s Note: The statements, opinions and data contained in all publications are solely those of the individual author(s) and contributor(s) and not of MDPI and/or the editor(s). MDPI and/or the editor(s) disclaim responsibility for any injury to people or property resulting from any ideas, methods, instructions or products referred to in the content. |
© 2025 by the authors. Licensee MDPI, Basel, Switzerland. This article is an open access article distributed under the terms and conditions of the Creative Commons Attribution (CC BY) license (https://creativecommons.org/licenses/by/4.0/).