1. Introduction
Following the nuclear accidents at Three Mile Island in the United States in 1979, Chernobyl in the former Soviet Union in 1986, and particularly the Fukushima accident in Japan in 2011, it was recognized that severe nuclear accidents pose profound and far-reaching hazards and consequences. Thus, severe accidents and related issues have become a major focus in the field of nuclear safety research [
1]. As demonstrated by the Three Mile Island accident [
2], during the core melting process, relocated molten material may solidify and form a molten pool. As the pool expands, the surface crust of the molten pool may mechanically interact with internal structures (such as support plates, core shrouds, reactor vessel baffles, and other supporting components), leading to contact melting [
3]. Under severe accident conditions, the melting of support structures constitutes the primary source of the metallic layer in the lower head molten pool. The progression of their melting affects the thickness of this metallic layer [
4,
5]. The metallic layer induces a heat concentration effect on the lower head wall, thereby threatening the integrity of the reactor pressure vessel. Furthermore, in the case of dispersion fuel element reactor types, the low melting point of their fuel support matrix means that the high-temperature solidified crust can cause melting of the underlying fuel elements supporting it. These two aspects will thereby increase the uncertainty in the melt progression during severe core accidents. While the melt behavior of the core can currently be effectively assessed using system-level codes [
6], it remains challenging to accurately simulate the melting process of specific internal components or perform mechanistic analysis of their melting behavior [
7]. Regarding research on the melting behavior of internal reactor components, the current theoretical models primarily include radiation heat transfer models and melting–solidification models [
8], which are fundamentally non-contact melting models. However, the melting interaction between the corium crust and internal structures is a typical contact melting process. According to existing studies, contact melting can achieve a melting rate one to seven times higher than that of stationary melting under identical operational conditions [
9], significantly accelerating the core melt progression.
Contact melting refers to the phenomenon that occurs when a solid phase-change material is pressed against a heat source whose temperature exceeds the melting point of the phase-change material. It is currently widely applied in multiple fields such as energy storage, welding, geological exploration, and nuclear technology [
10]. Scholars including Emerman [
11], Moallemi [
12], and Chen [
13] have conducted studies on relevant contact melting models within the context of core melting, demonstrating the feasibility of applying this theory to nuclear-related issues. For contact melting processes involving moving heat sources, analytical models have been established for two-dimensional contact melting around heat sources with various geometries, including cylinders [
14,
15,
16], spheres [
17], ellipsoidal cylinders [
18], and parabolic cylinders [
19]. However, for internal reactor components, their dimensions are generally smaller than those of the core melt pool and simplifications to two-dimensional models may introduce deviations. Additionally, given the dynamic nature of severe accidents in reactors, the applicability of governing equations for contact melting under different thermal boundary conditions remains unclear and requires further analysis.
Due to the complex geometry of corium, this study adopts a simplified representation for the external morphology of the corium crust. Based on observations from the Three Mile Island accident, the corium crust typically forms a bowl-shaped structure [
20]. In this configuration, the central region of the corium crust exhibits relatively flat geometry, allowing its contact interface with the underlying stainless steel components to be approximated as horizontal. Consequently, a plate-like structure is employed to simulate the shape of the corium crust. Following reactor shutdown in a severe accident, a significant amount of decay heat continues to be generated. The thermal power declines rapidly within a relatively short period before transitioning to a more gradual decrease [
21]. According to research by Hong et al. [
22], the melting velocity experiences a brief increase (on the order of approximately 10
−6 s) after the initiation of contact melting before stabilizing at a quasi-steady level. Consequently, the melting process can be analyzed using a quasi-steady-state approach at each time step. This study employs a constant heat flux boundary condition to model the thermal characteristics at the surface of the corium crust. The rationality of the derived model was validated through experimental investigations, followed by a comprehensive sensitivity analysis of key parameters. Ultimately, governing equations applicable to contact melting phenomena under severe reactor accident conditions were established.
3. Experimental Validation
To validate the correctness of the derived governing equations, this study conducted contact melting experiments involving a flat-plate heat source and a single stainless steel plate. The validation was performed by comparing the experimental results with the predicted melting velocity. Given the prohibitively high cost of conducting contact melting experiments with stainless steel due to its extremely high melting point, and considering that the governing Equation (27) established in this work incorporates key thermophysical parameters such as thermal diffusivity (α) and dynamic viscosity (μ), the model is inherently universal and not restricted to any specific phase-change material. Therefore, employing a low-melting-point material for experimental validation not only significantly simplifies the setup and reduces costs but also effectively verifies the predictive accuracy and general applicability of the governing equation for the contact melting process.
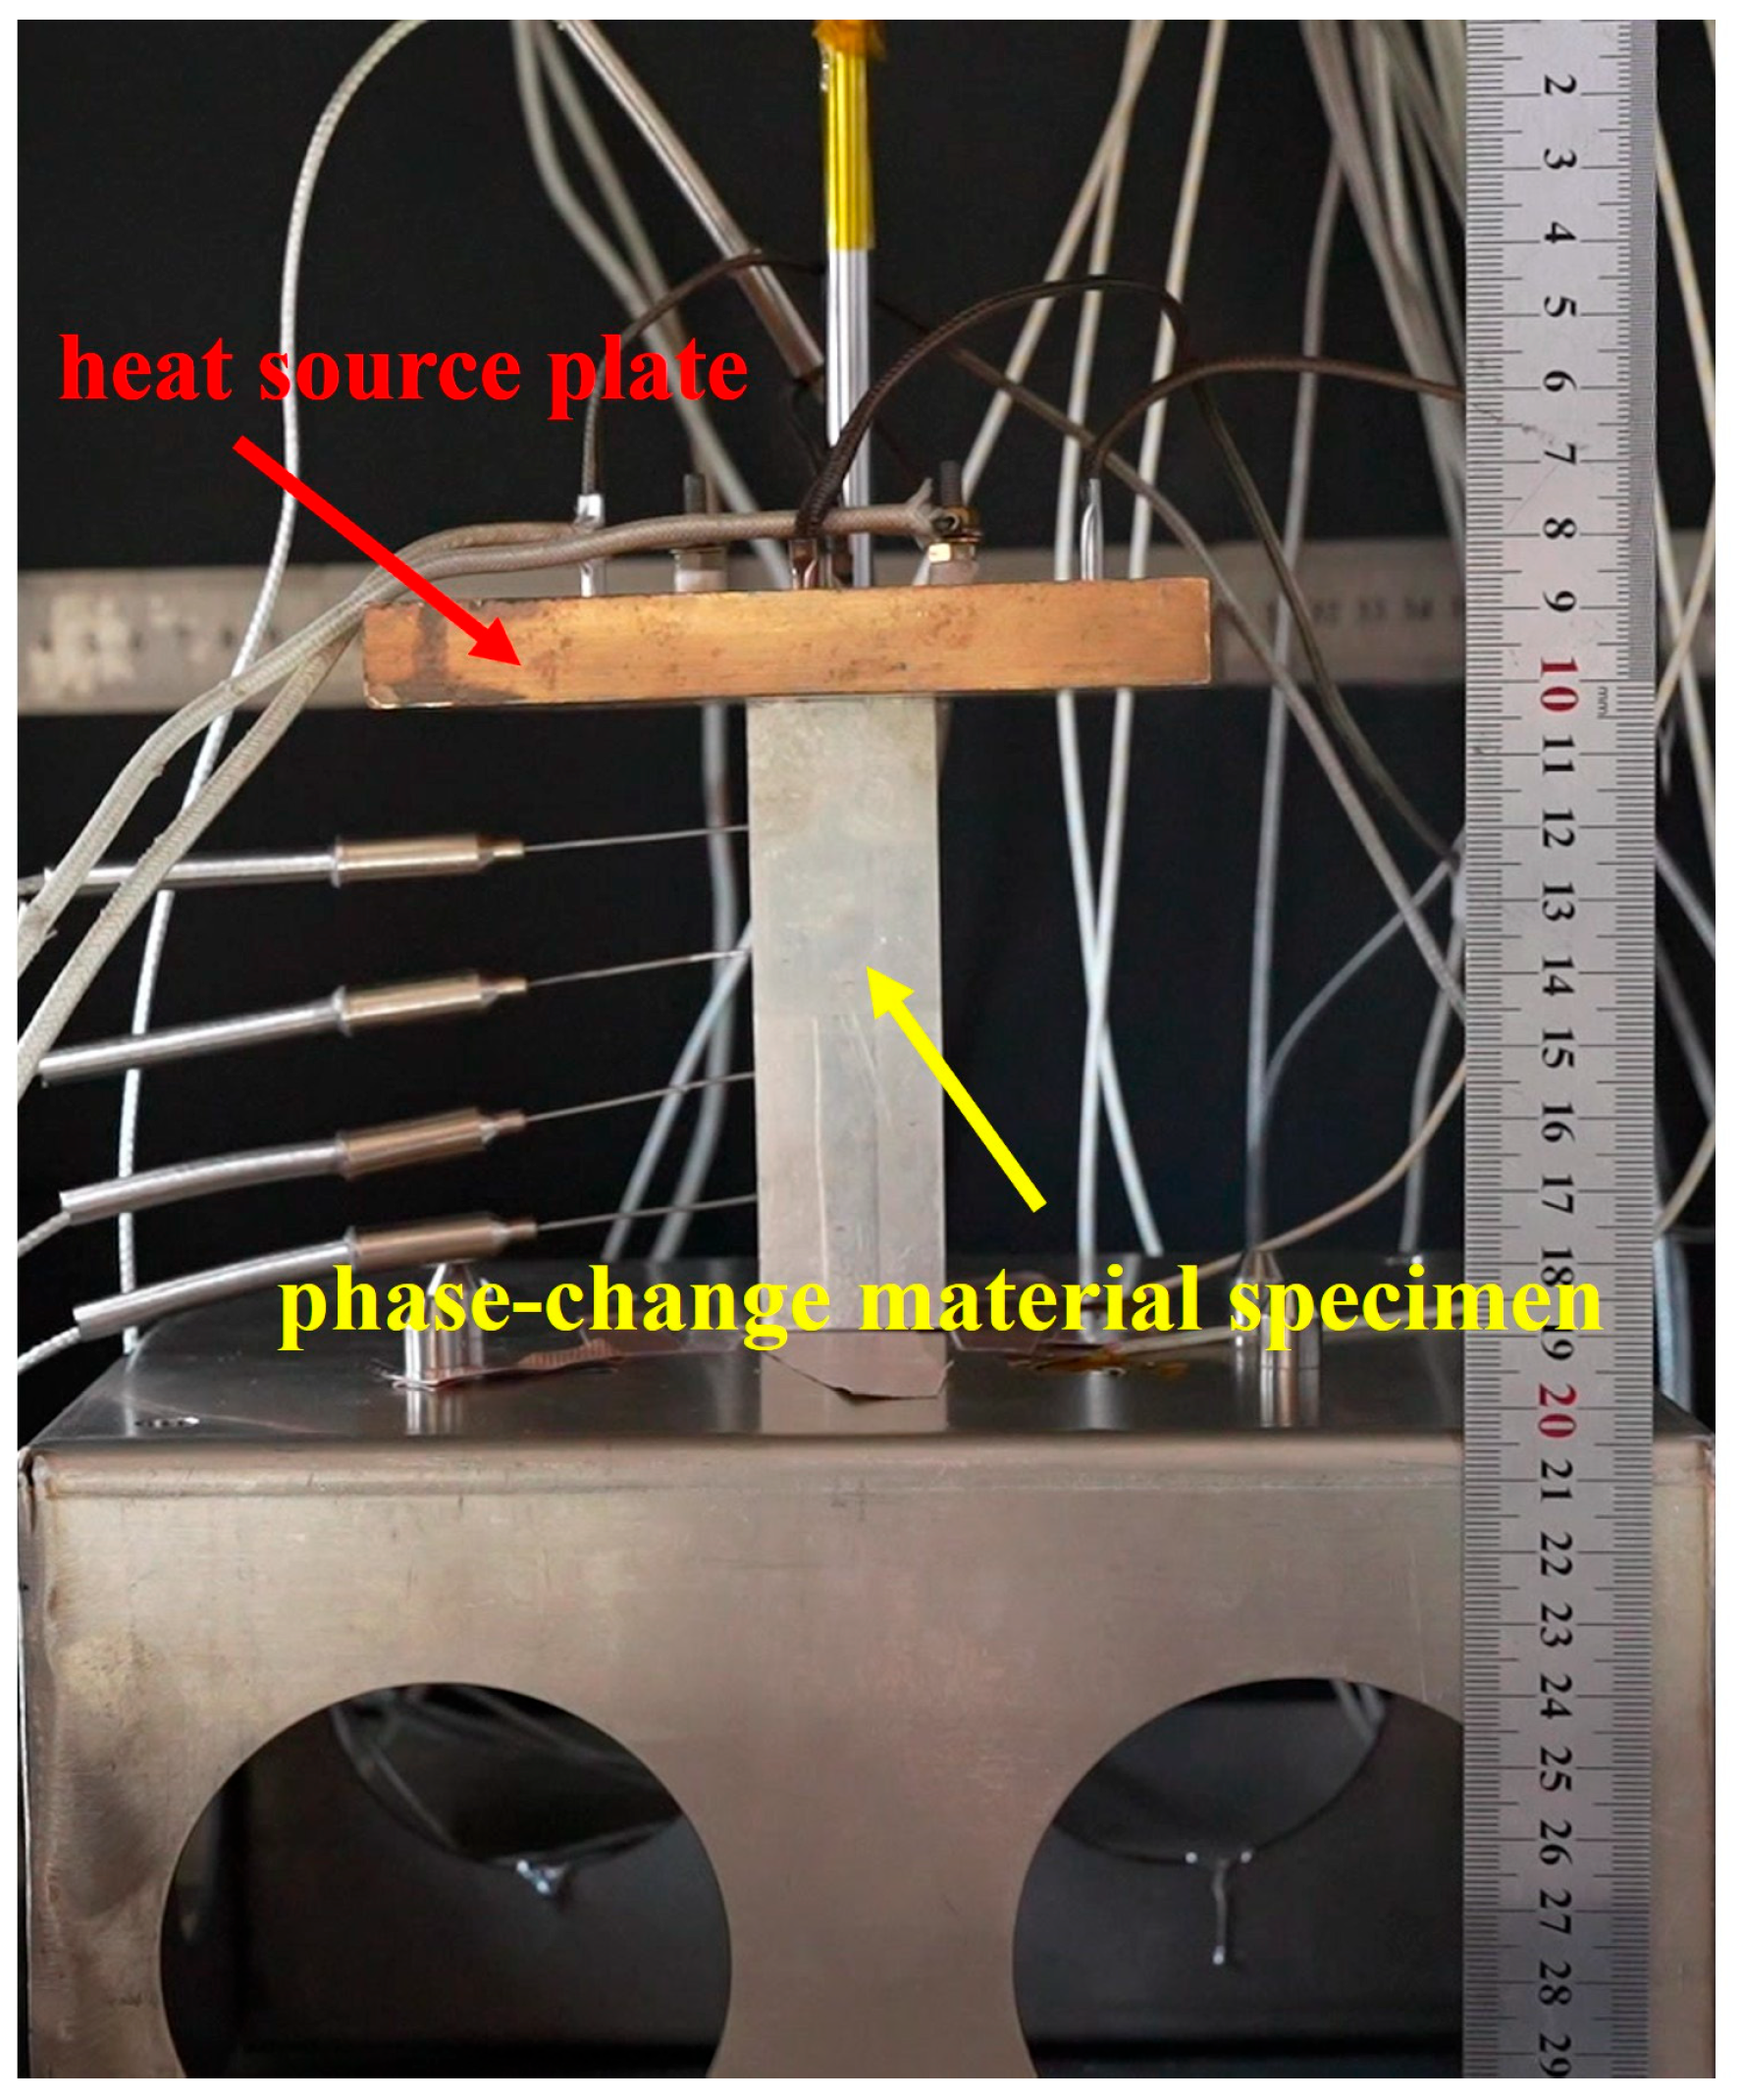
Figure 2 shows a schematic diagram of the experimental setup. The yellow metal indicated by the red arrow represents the heat source plate, while the silver metal indicated by the yellow arrow below corresponds to the plate-shaped phase-change material specimen. The heat source plate is made of copper and is equipped with embedded heating resistors wound around its interior to provide thermal power. Five temperature measurement points are uniformly distributed on the upper surface of the heat source to monitor the temperature variation of the copper plate. The phase-change material for melting is a tin block with dimensions of 3 cm × 2 cm × 10 cm, positioned directly beneath the copper heat source plate. The melting phase-change material is fixed on the workbench, aligned with the central axis of the heat source plate.
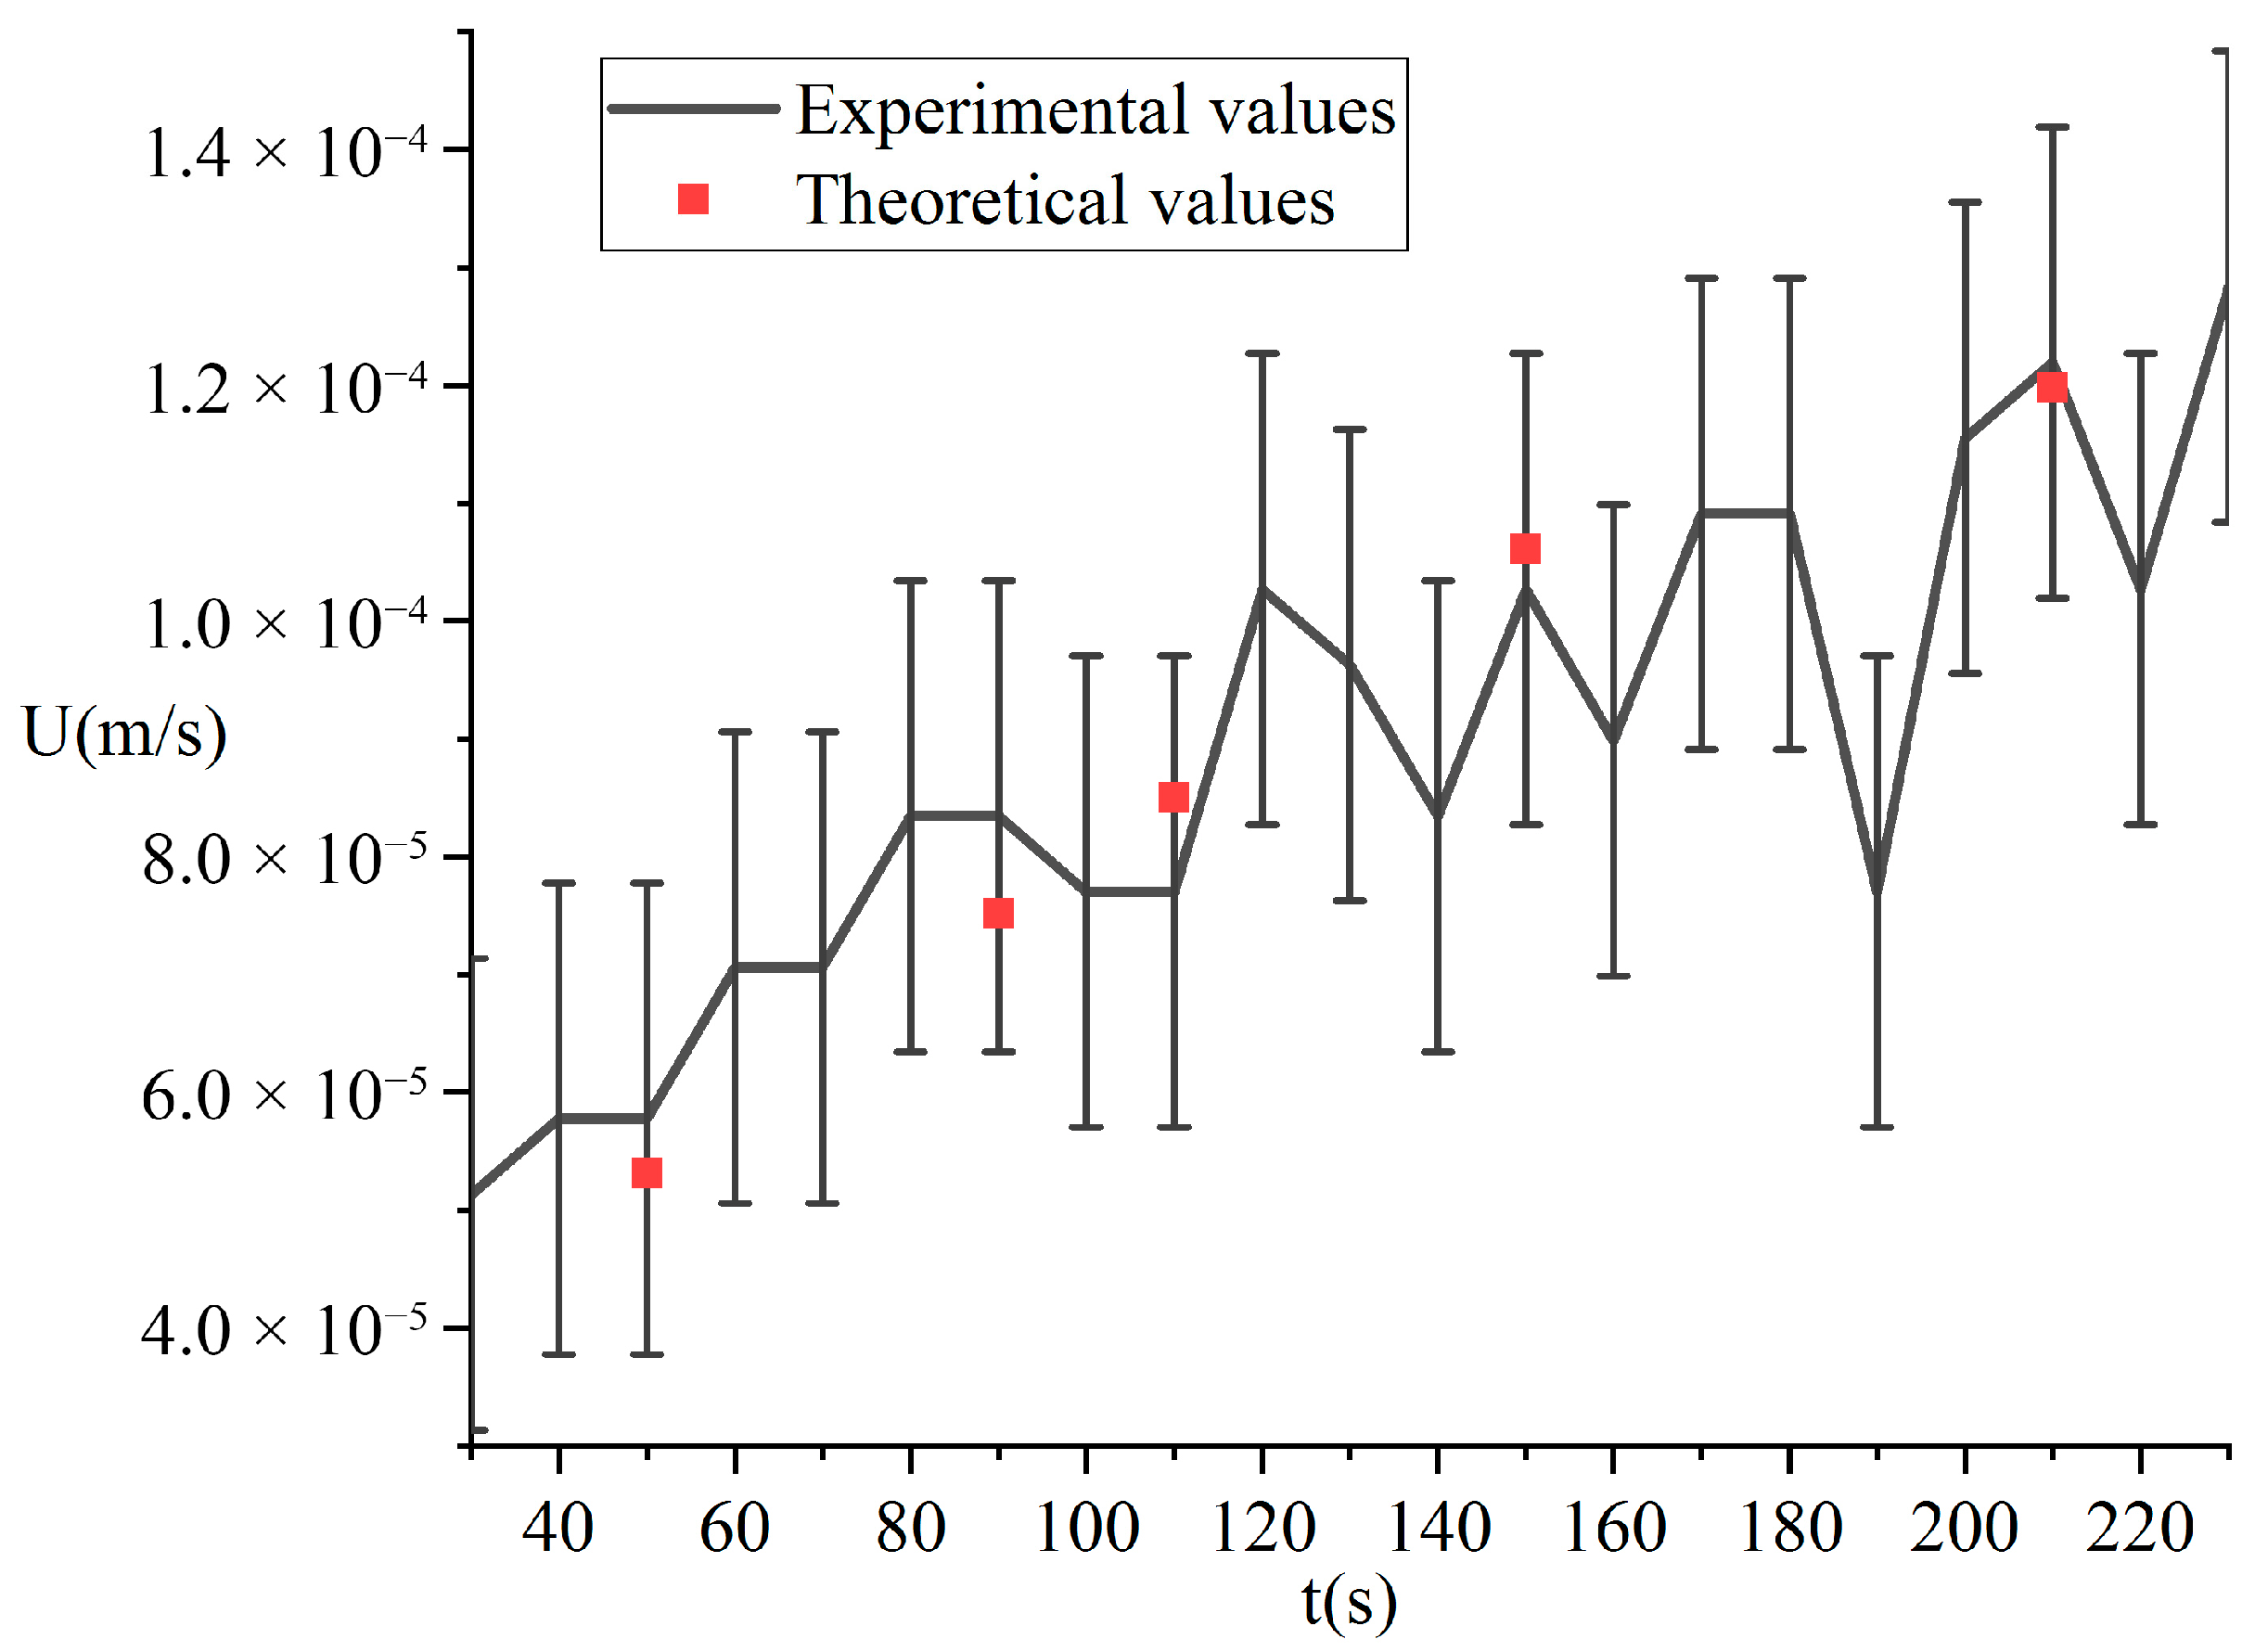
At the beginning of the experiment, a constant power of 300 W was applied to the copper heat source plate. After melting initiated, the downward melting distance hm was recorded every 10 s. The melting velocity was determined by differentiating hm using the central difference method. At five specific time points during the melting process, the heat flux q″ transferred from the heat source to the phase-change material was calculated based on temperature variations measured by the thermocouples on the heat source and the principle of energy conservation. Simultaneously, the heat flux qs″ transferred toward the phase-change material side at the melting interface was derived using temperature measurements at various heights of the phase-change material and the displacement of the contact surface. By substituting the obtained q″ and qs″ into Equation (27), along with the thermophysical properties of the experimental materials, the theoretical melting velocity was calculated.
The uncertainty in the melting velocity primarily originates from the reading of the melting distance h
m. Based on an experimental uncertainty analysis, the uncertainty in the melting velocity is estimated to be 2 × 10
−5 m/s. A comparison between the experimental and theoretical values of the melting velocity is shown in
Figure 3. As can be seen from the figure, the average error between the theoretical and experimental values is 6.8%, with a maximum error of 11%. The observed discrepancies primarily stem from two factors: firstly, fluctuations in data acquisition during melting velocity measurements due to the small melting distance; and secondly, systematic errors in the temperature data collection system. Nevertheless, the overall trends of the theoretical and experimental results show good agreement, demonstrating the rationality of the derived model and confirming the quasi-steady-state characteristics of the contact melting process.
4. Analysis and Discussion
To facilitate analysis, this study adopts the AP1000 reactor thermal power as a reference to normalize the heat flux q″, where q″
max represents the full-power heat flux of the AP1000. Assuming a core meltdown accident occurs one hour after reactor shutdown in a severe accident, the decay heat power at this point is approximately 1% of the rated full power. However, the formation of a molten pool through the accumulation of corium crust can lead to a significant increase in heat flux in localized regions. To account for this concentration effect and cover more severe scenarios, this study conservatively assumes a maximum local heat flux of up to 5% of the full-power heat flux [
27]. To closely represent internal reactor components, 1Cr18Ni9Ti stainless steel is selected as the phase-change material for analysis, with its thermophysical properties listed in
Table 1 [
19].
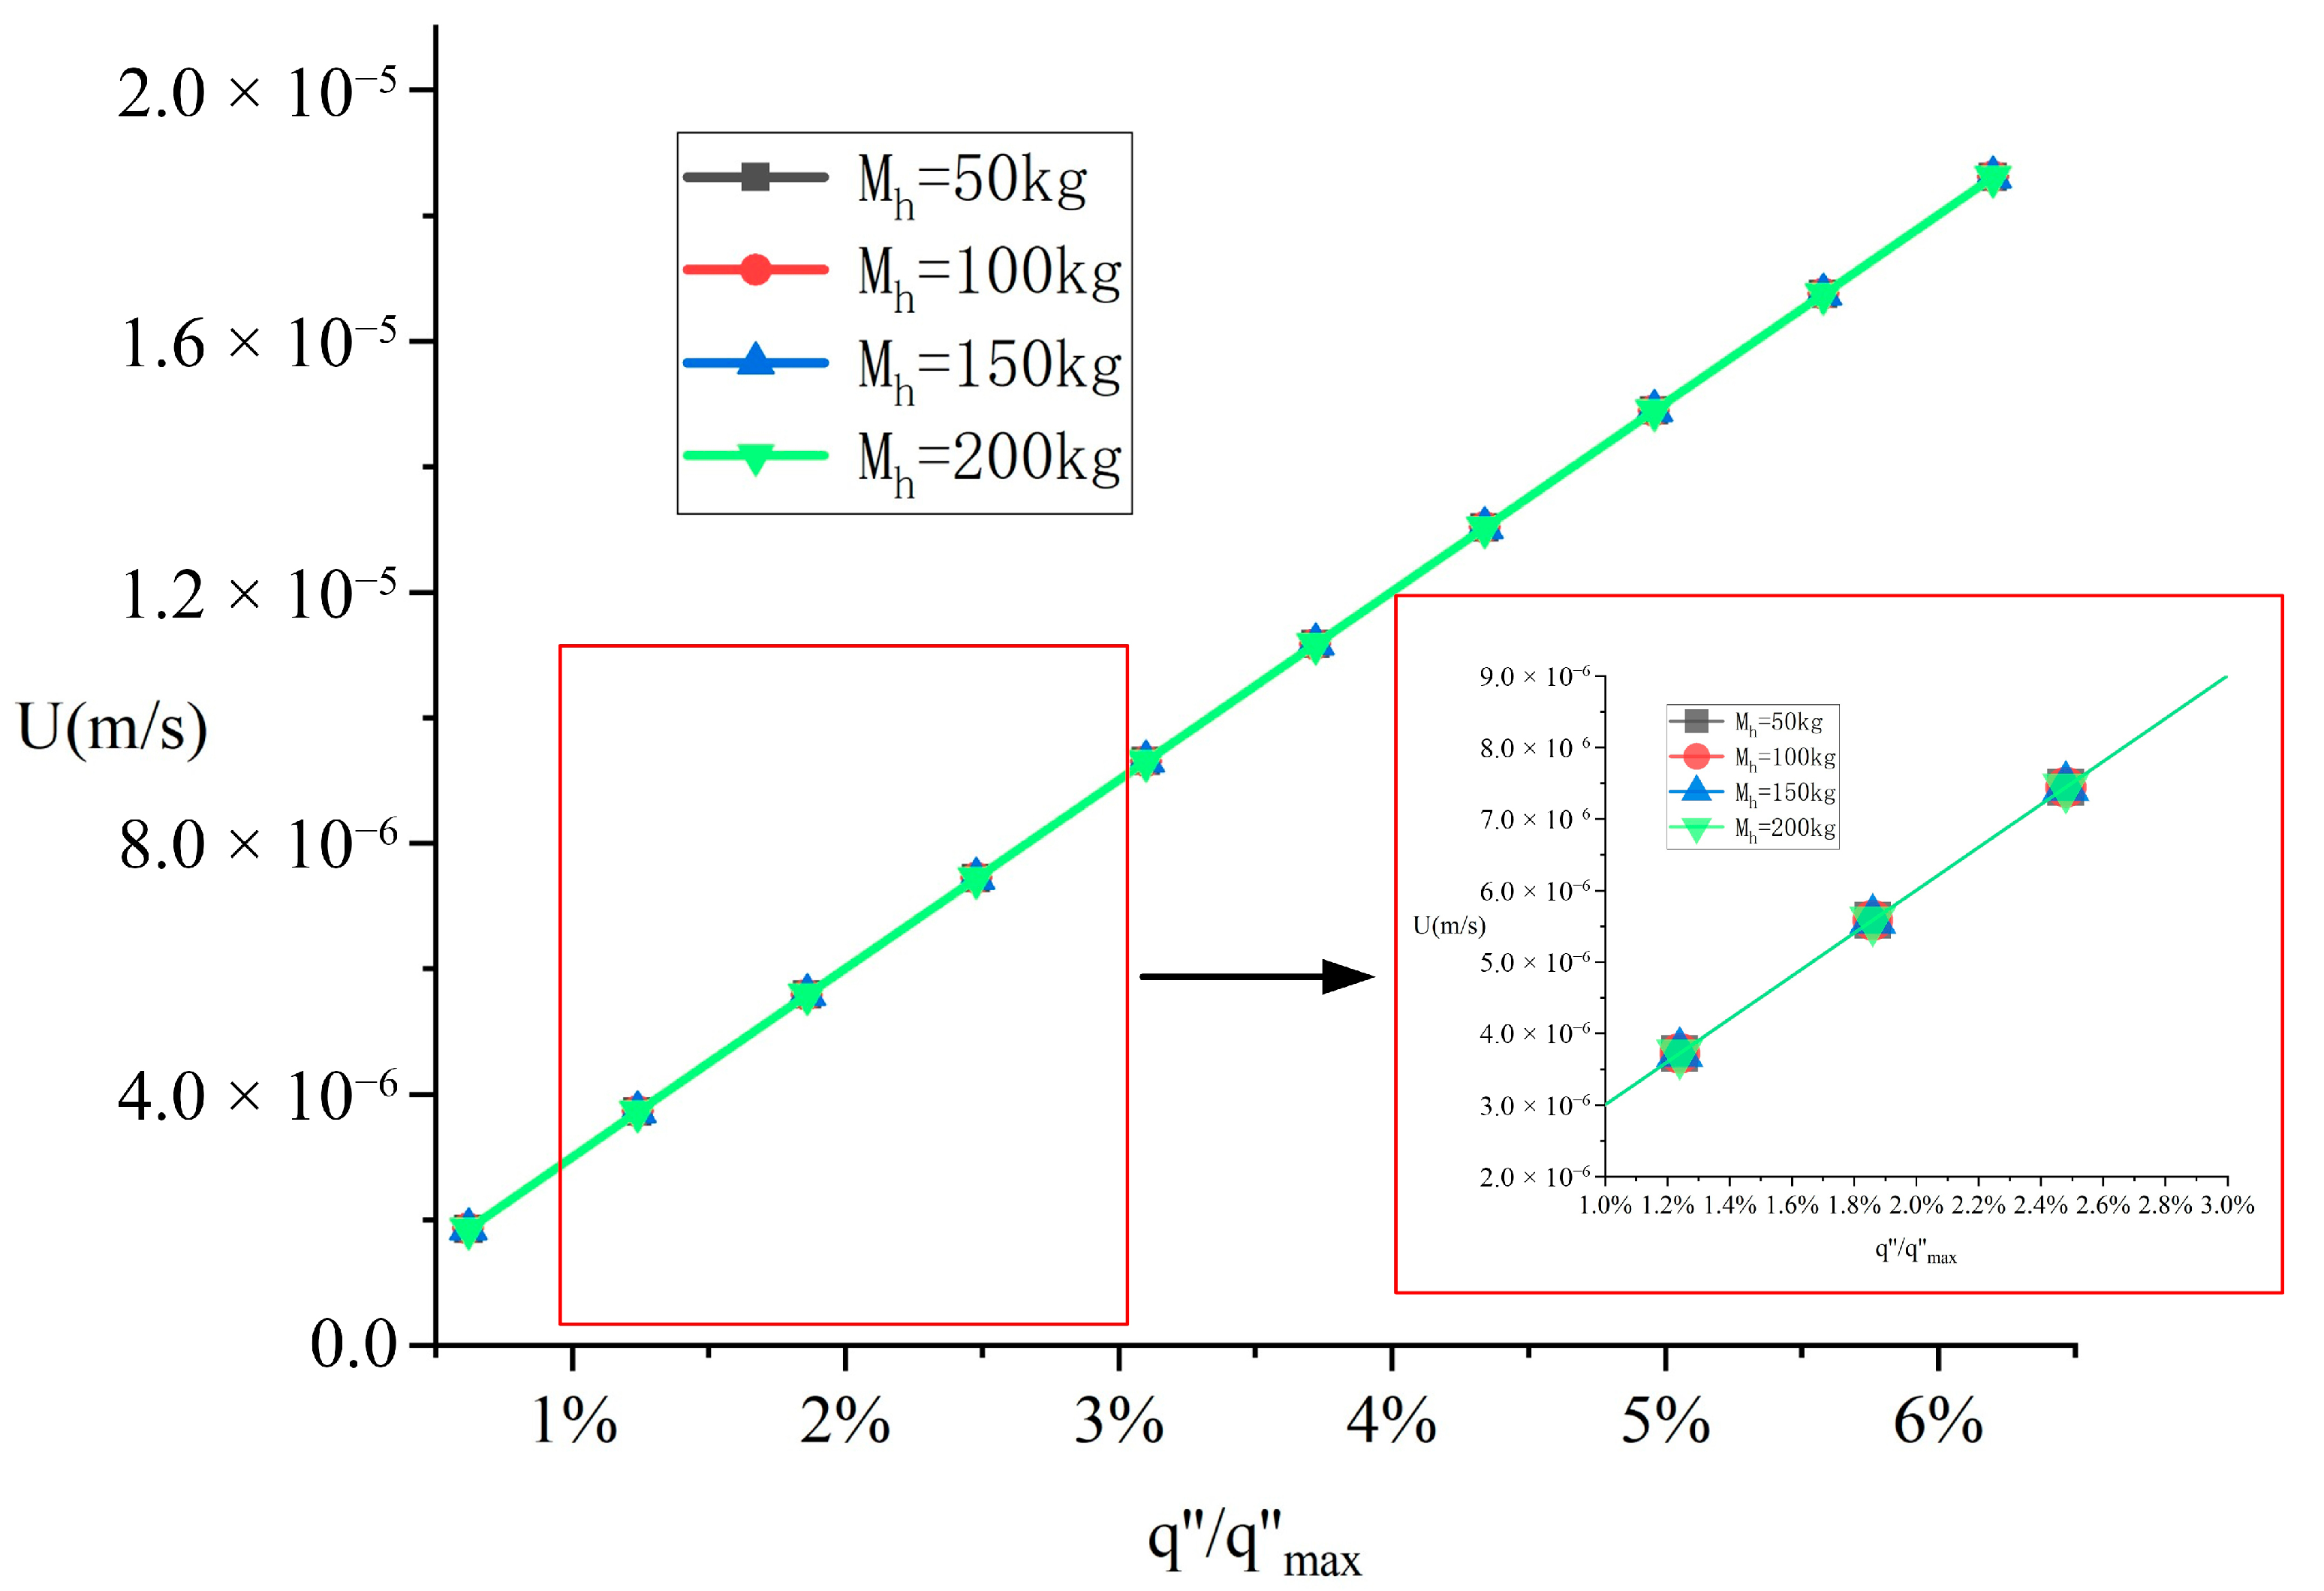
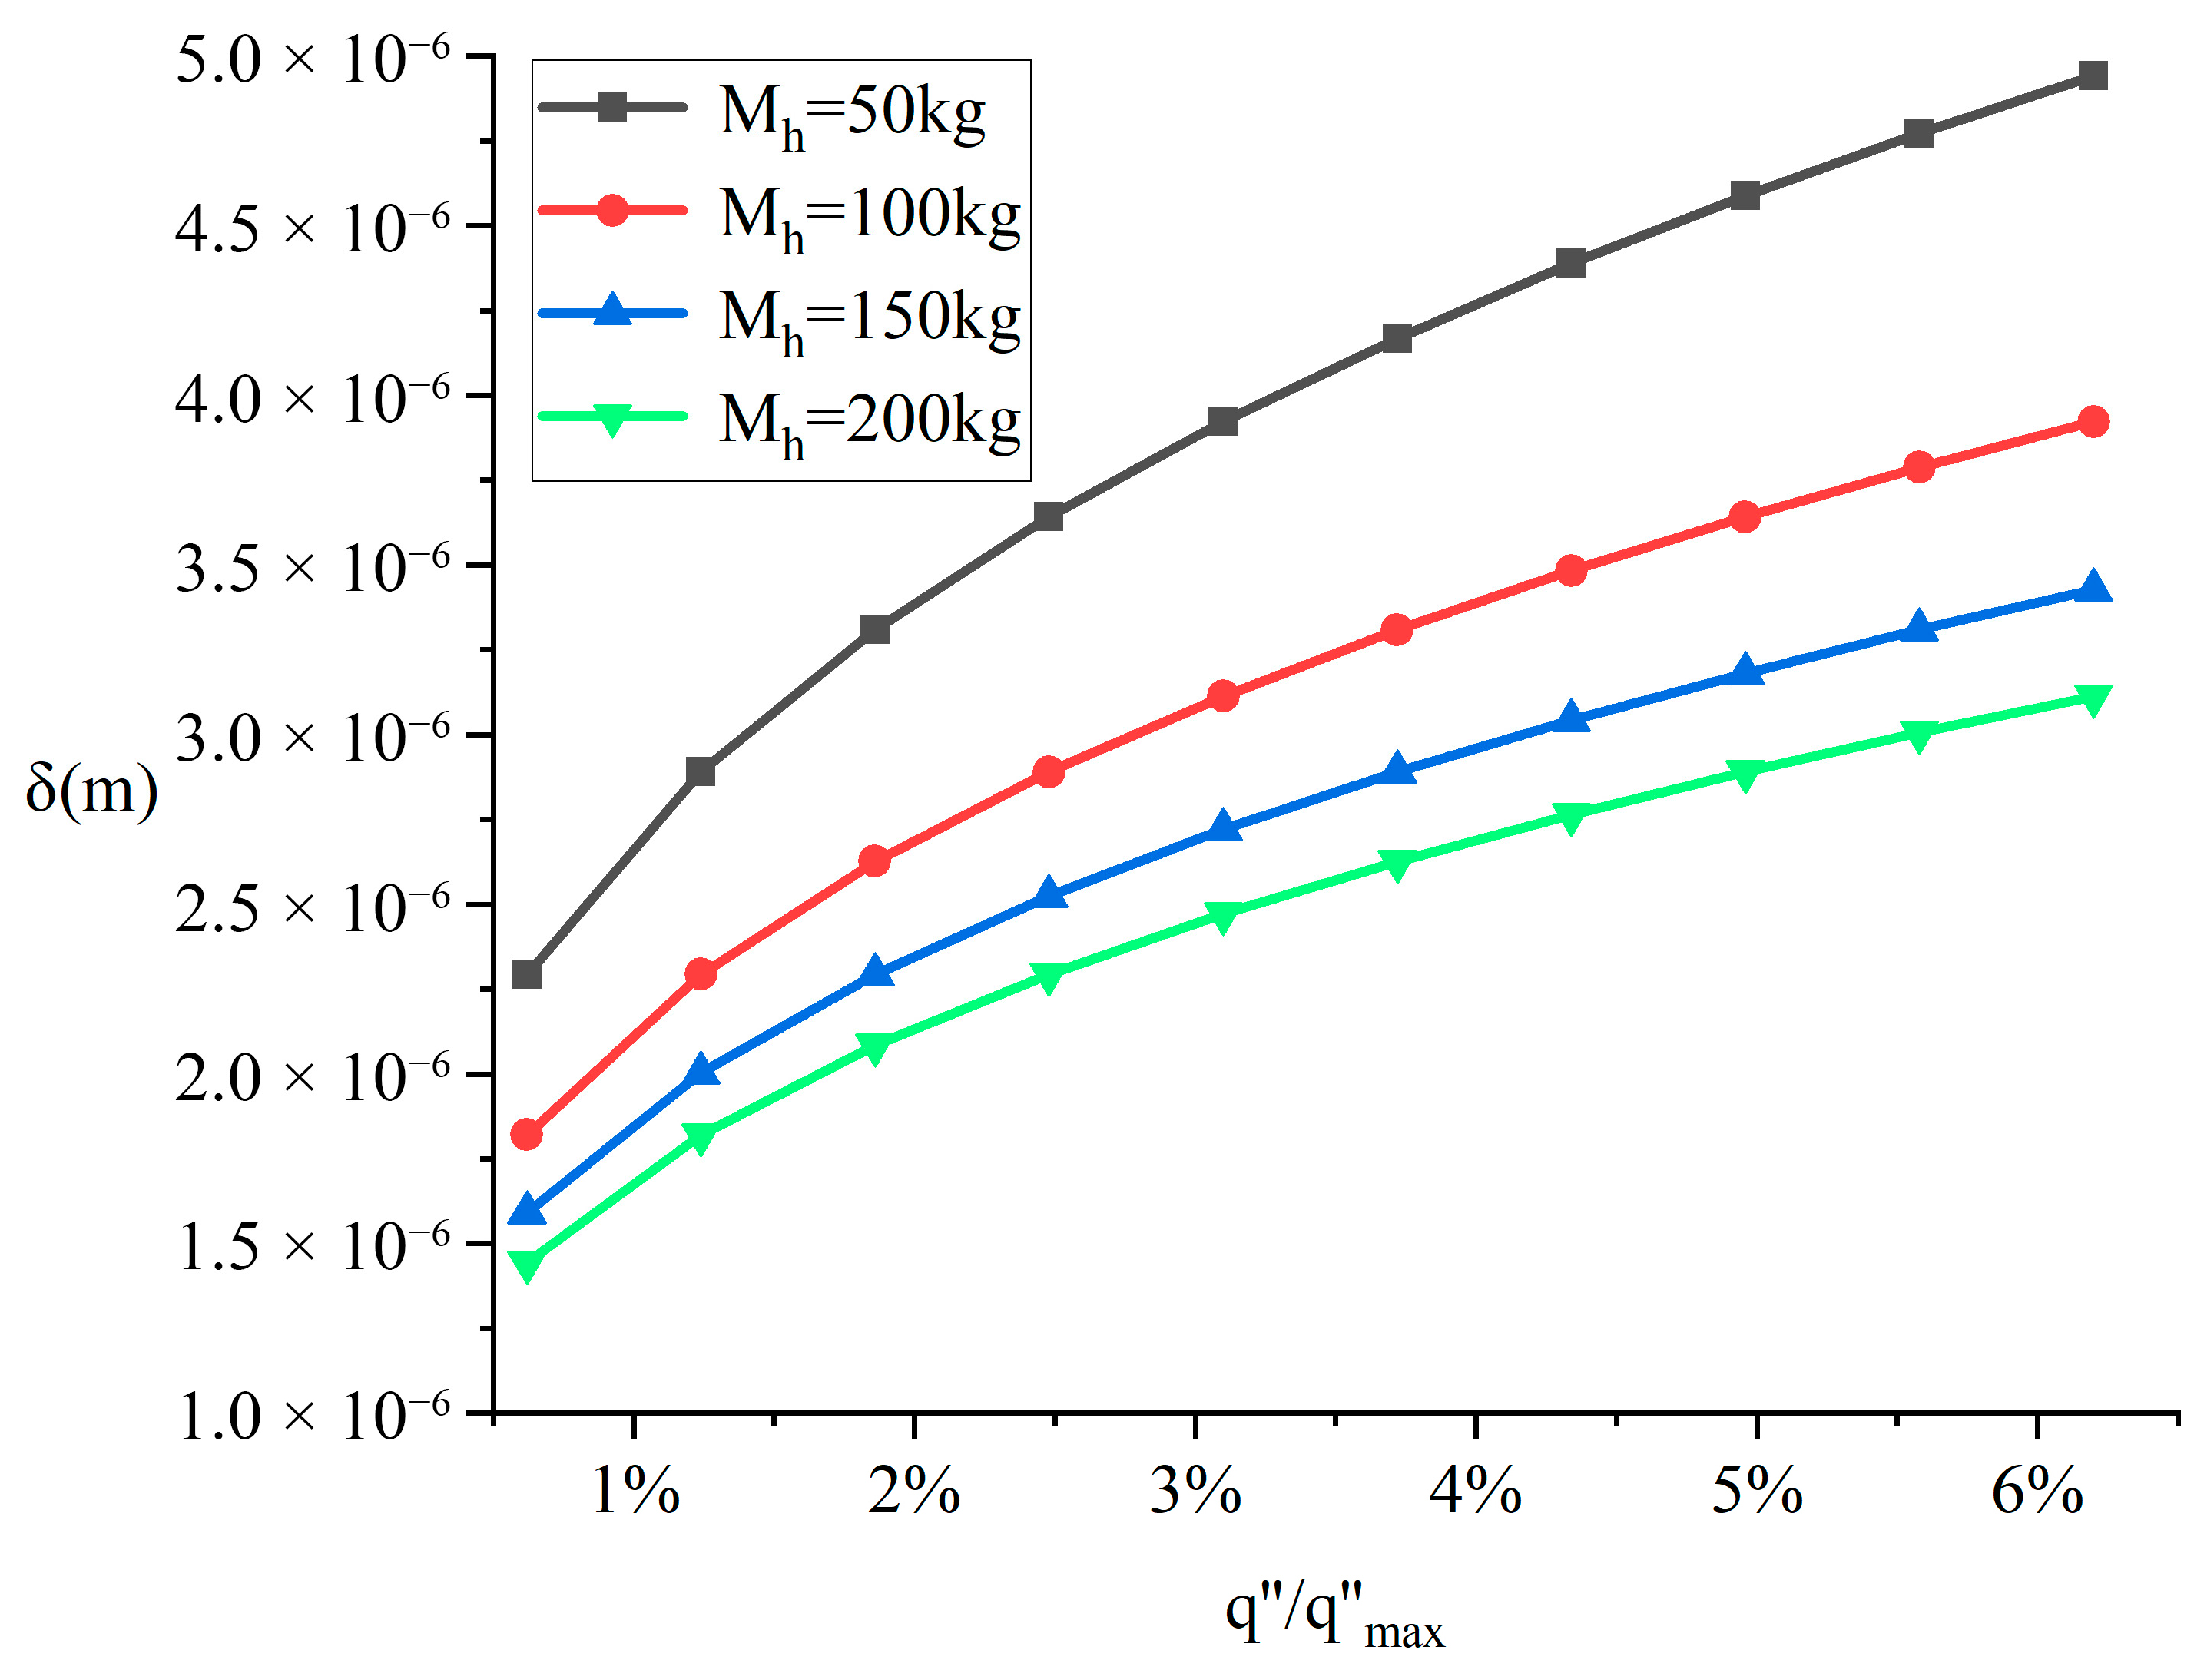
Figure 4 and
Figure 5, respectively, illustrate the variations of melting velocity and liquid film thickness with heat flux for a melting specimen of dimensions a = 0.2 m and b = 0.05 m under different heat source masses. Under the Neumann boundary condition, the melting velocity exhibits an approximately linear increase with rising heat flux, as shown in
Figure 4. Notably, the influence of heat source gravity variation on the melting velocity is extremely marginal, inducing differences of less than 0.002%. This indicates that the effect of heat source gravity on the melting rate is negligible, a conclusion consistent with experimental observations reported in previous studies [
28].
Figure 5 demonstrates the correlation between heat flux and liquid film thickness. As the heat flux increases, the liquid film thickness exhibits a monotonically increasing trend. Moreover, greater heat source gravity results in reduced liquid film thickness. This phenomenon can be explained by the liquid film pressure relationship in Equation (16): the liquid film pressure P is inversely proportional to the film thickness δ. When the gravity of the heating body increases, a higher liquid film pressure is required to maintain the force equilibrium of the film, leading to a corresponding reduction in film thickness. Furthermore, by comparing liquid film thicknesses under identical heat flux but different heat source masses, it can be observed that the influence of the heat source mass on film thickness gradually diminishes as the mass increases.
The contact area Sc and aspect ratio of the phase-change material ξ are key factors influencing the contact melting process. To independently analyze the respective mechanisms of these two parameters, this study employs a control variable approach: when examining the effect of contact area, the aspect ratio is maintained at four while varying the dimensions to alter the contact area; when investigating the impact of aspect ratio, the contact area is held constant while adjusting the side length proportions to modify the aspect ratio. Given the equivalent influence of the aspect ratio definition on parametric effects, and to simplify the presentation, the analysis assumes a < b during the aspect ratio investigation.
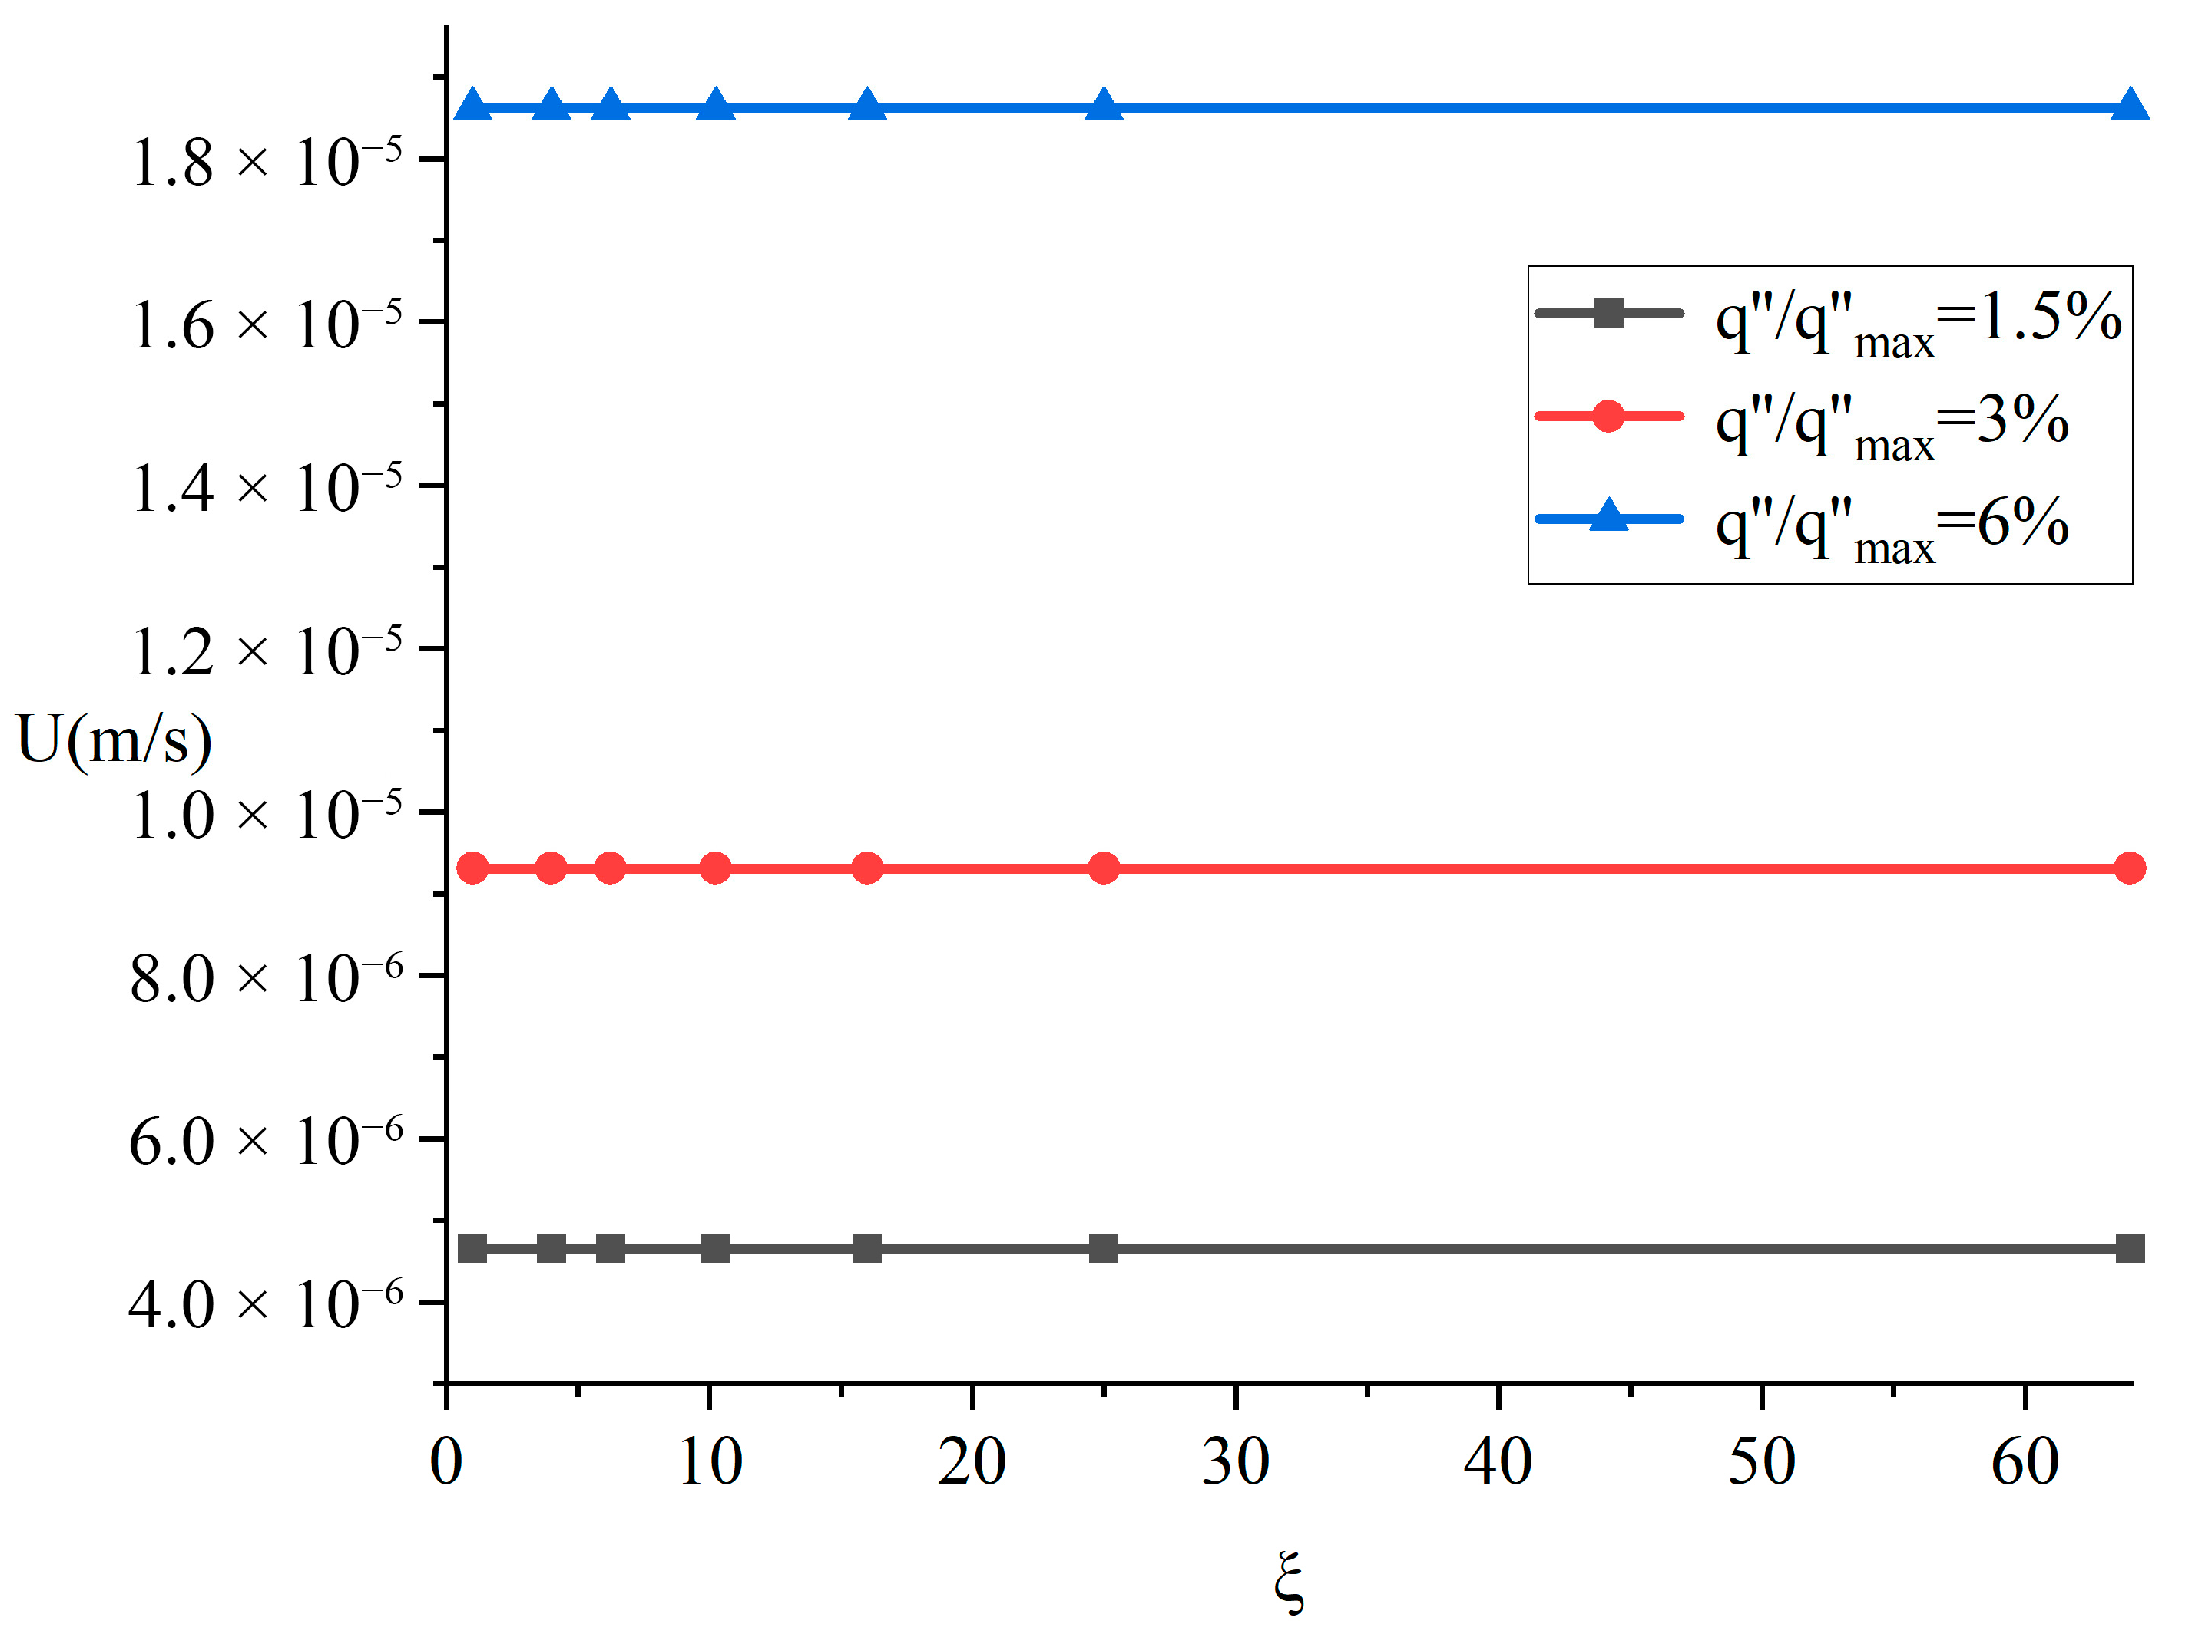
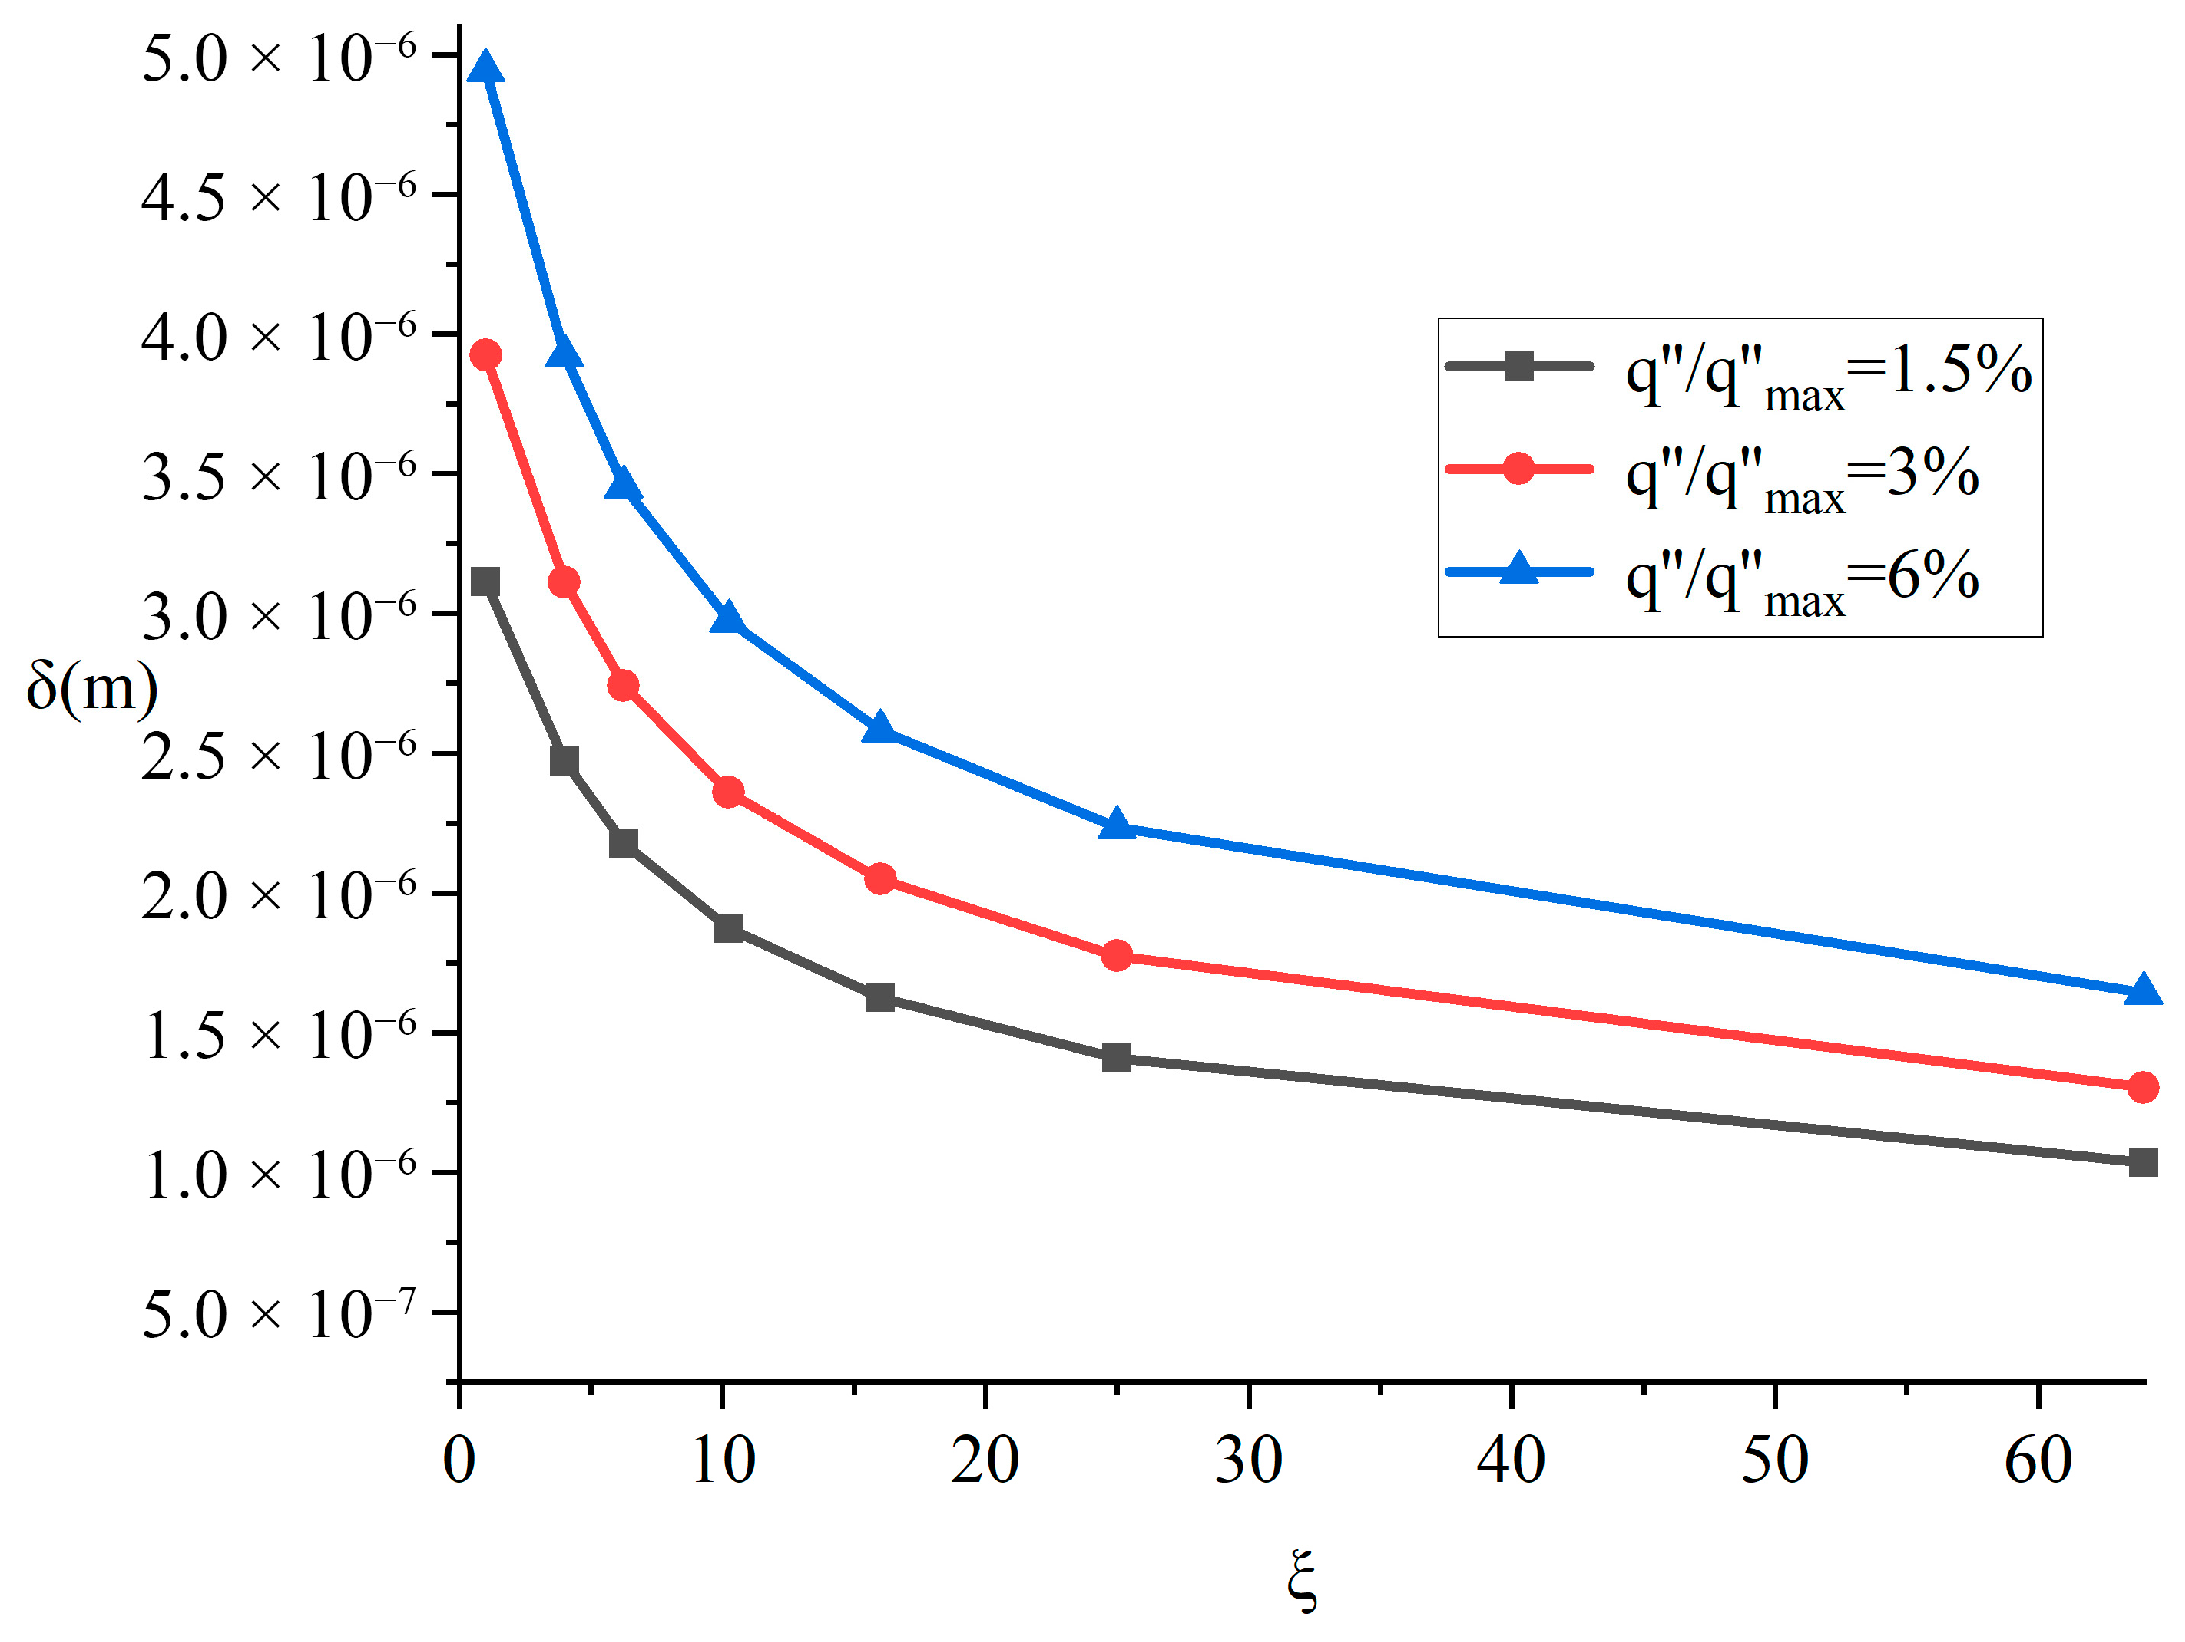
Figure 6 and
Figure 7 illustrate the influence of different aspect ratios on the contact melting process while maintaining a constant contact area of 4 cm
2. As shown in
Figure 6, the effect of aspect ratio on melting velocity is negligible. However, the liquid film thickness decreases significantly with increasing aspect ratio, as demonstrated in
Figure 7.
When the contact area remains constant, an increase in the aspect ratio implies a reduction in the dimension of the contact surface along one specific direction. This facilitates easier drainage of molten liquid from the shorter edges. Since the melting velocity remains largely unchanged, the total volume of molten liquid generated per unit time is constant. Consequently, more liquid flows out along the narrower side with smaller dimensions, leading to an increased flow velocity in this region. This significantly enhances the local convective heat transfer intensity. The intensified heat transfer reduces the temperature of the heat source contact surface. To maintain the constant heat flux boundary condition, the liquid film thickness must correspondingly decrease.
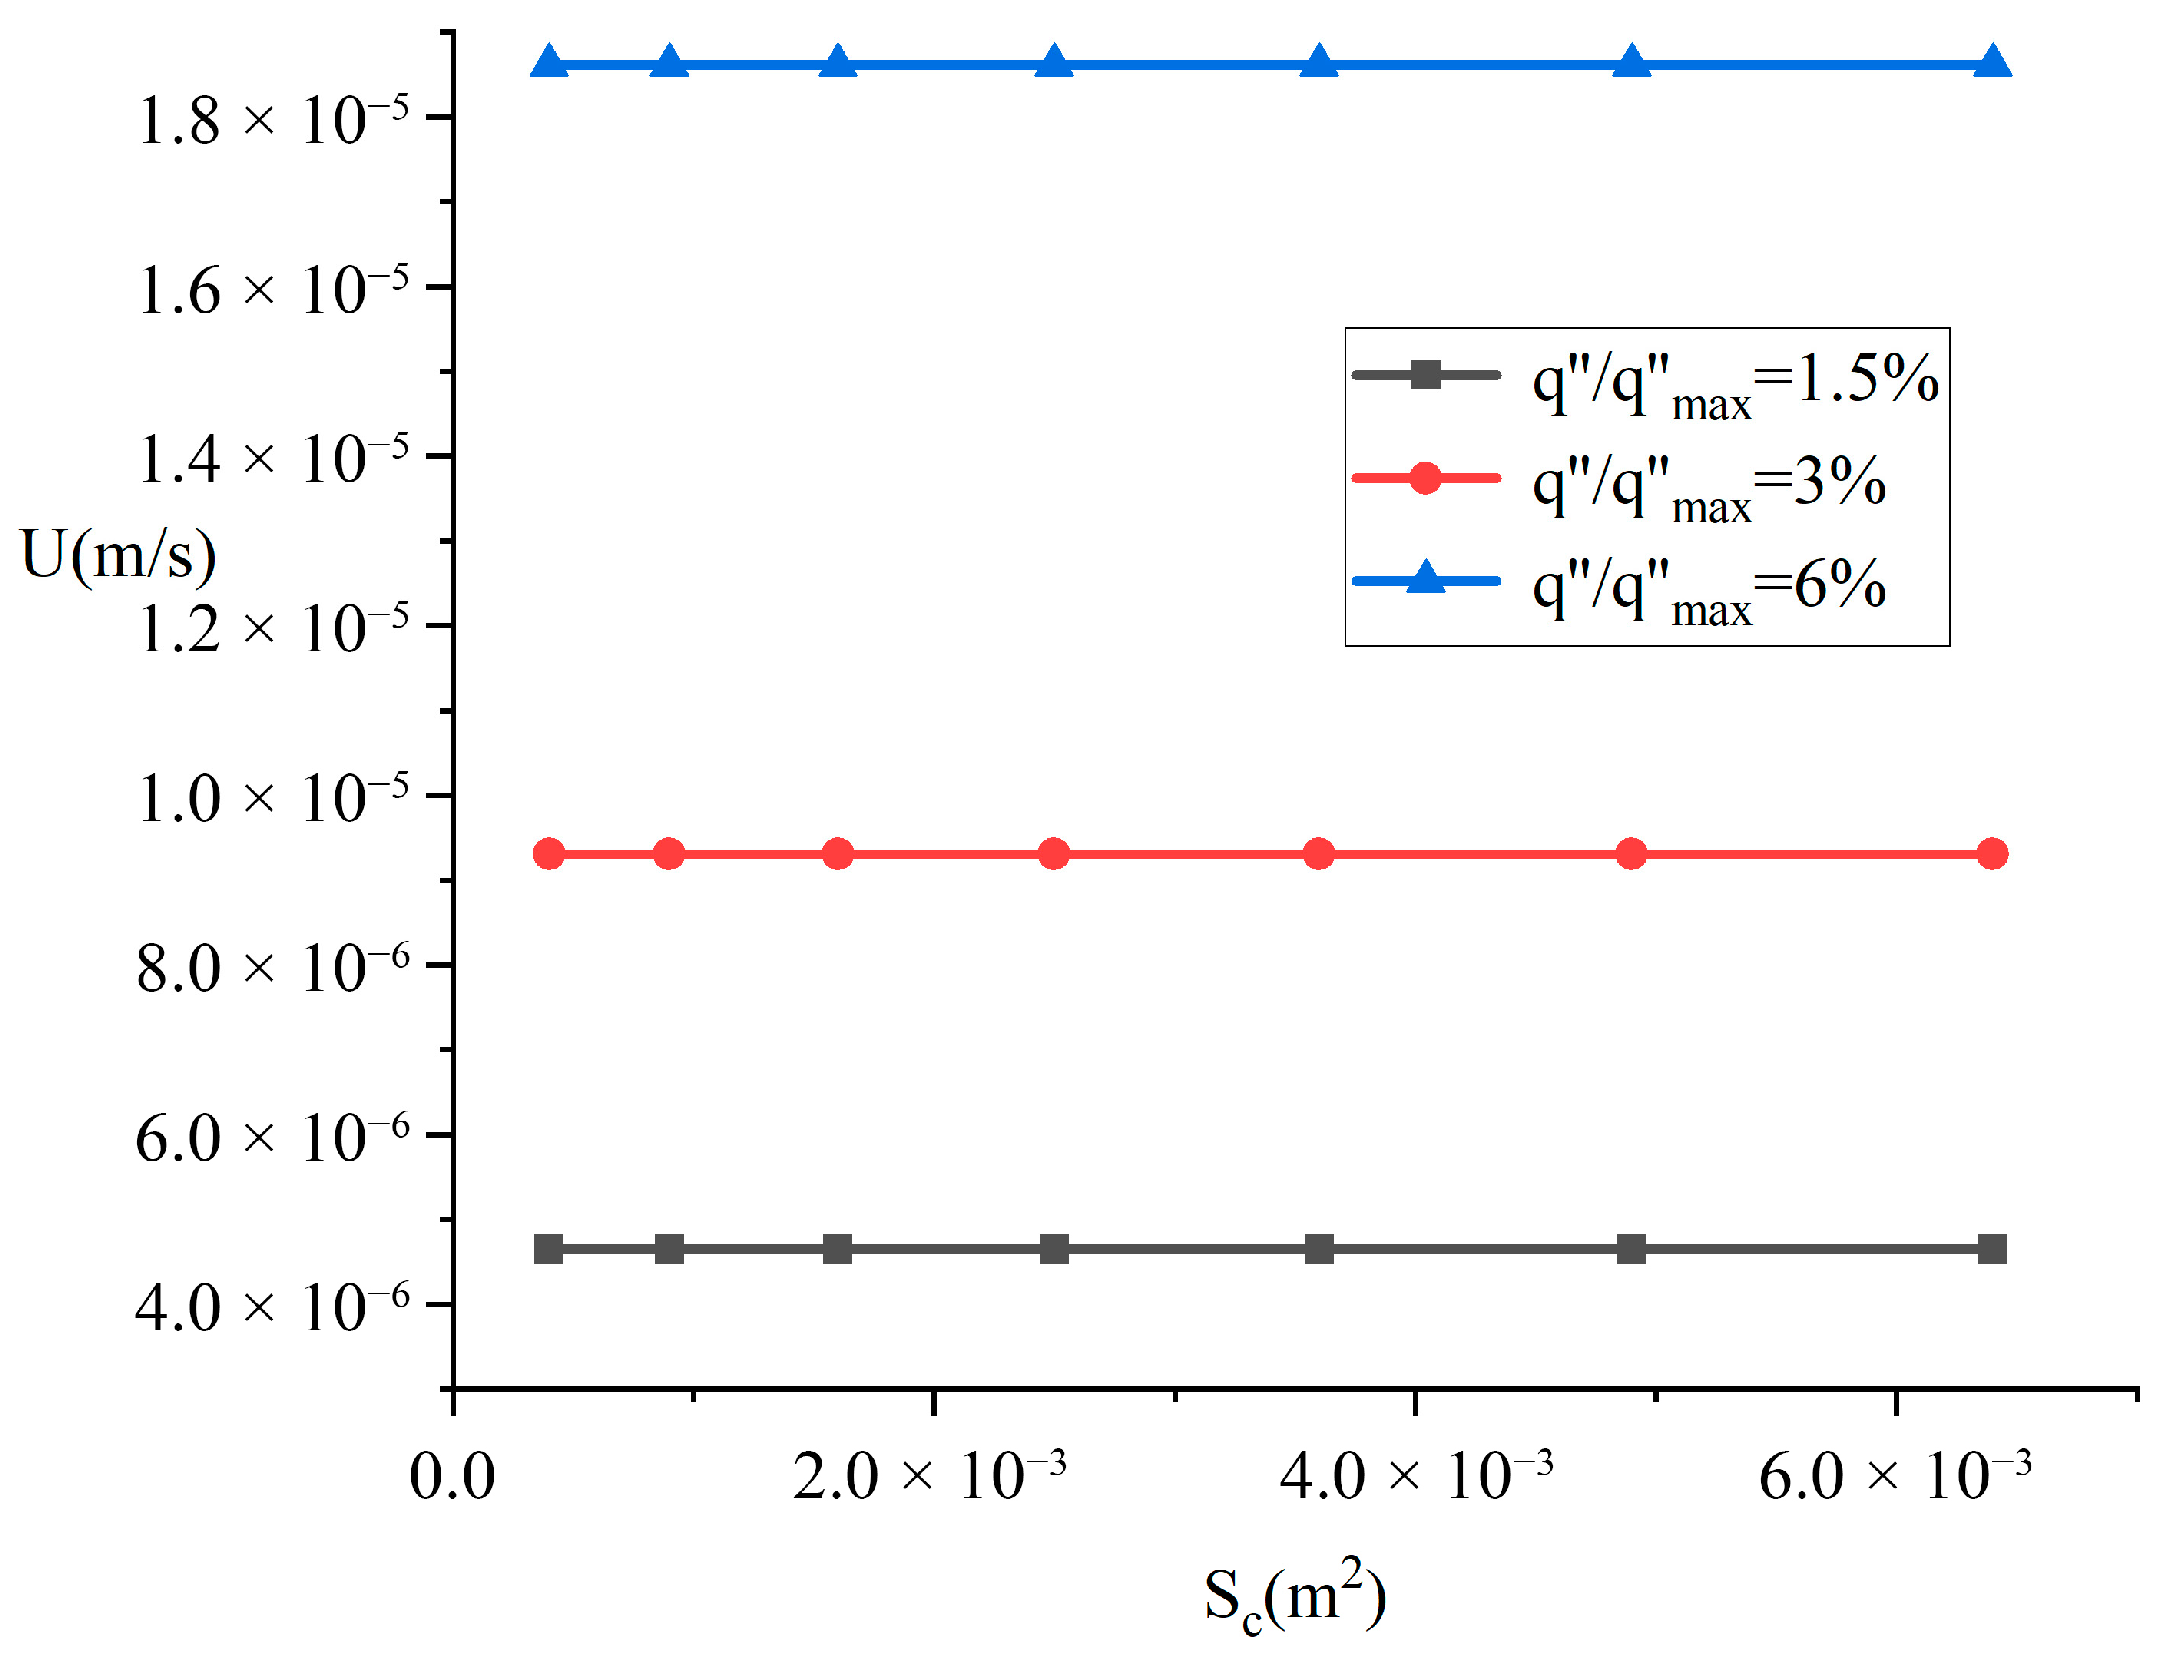
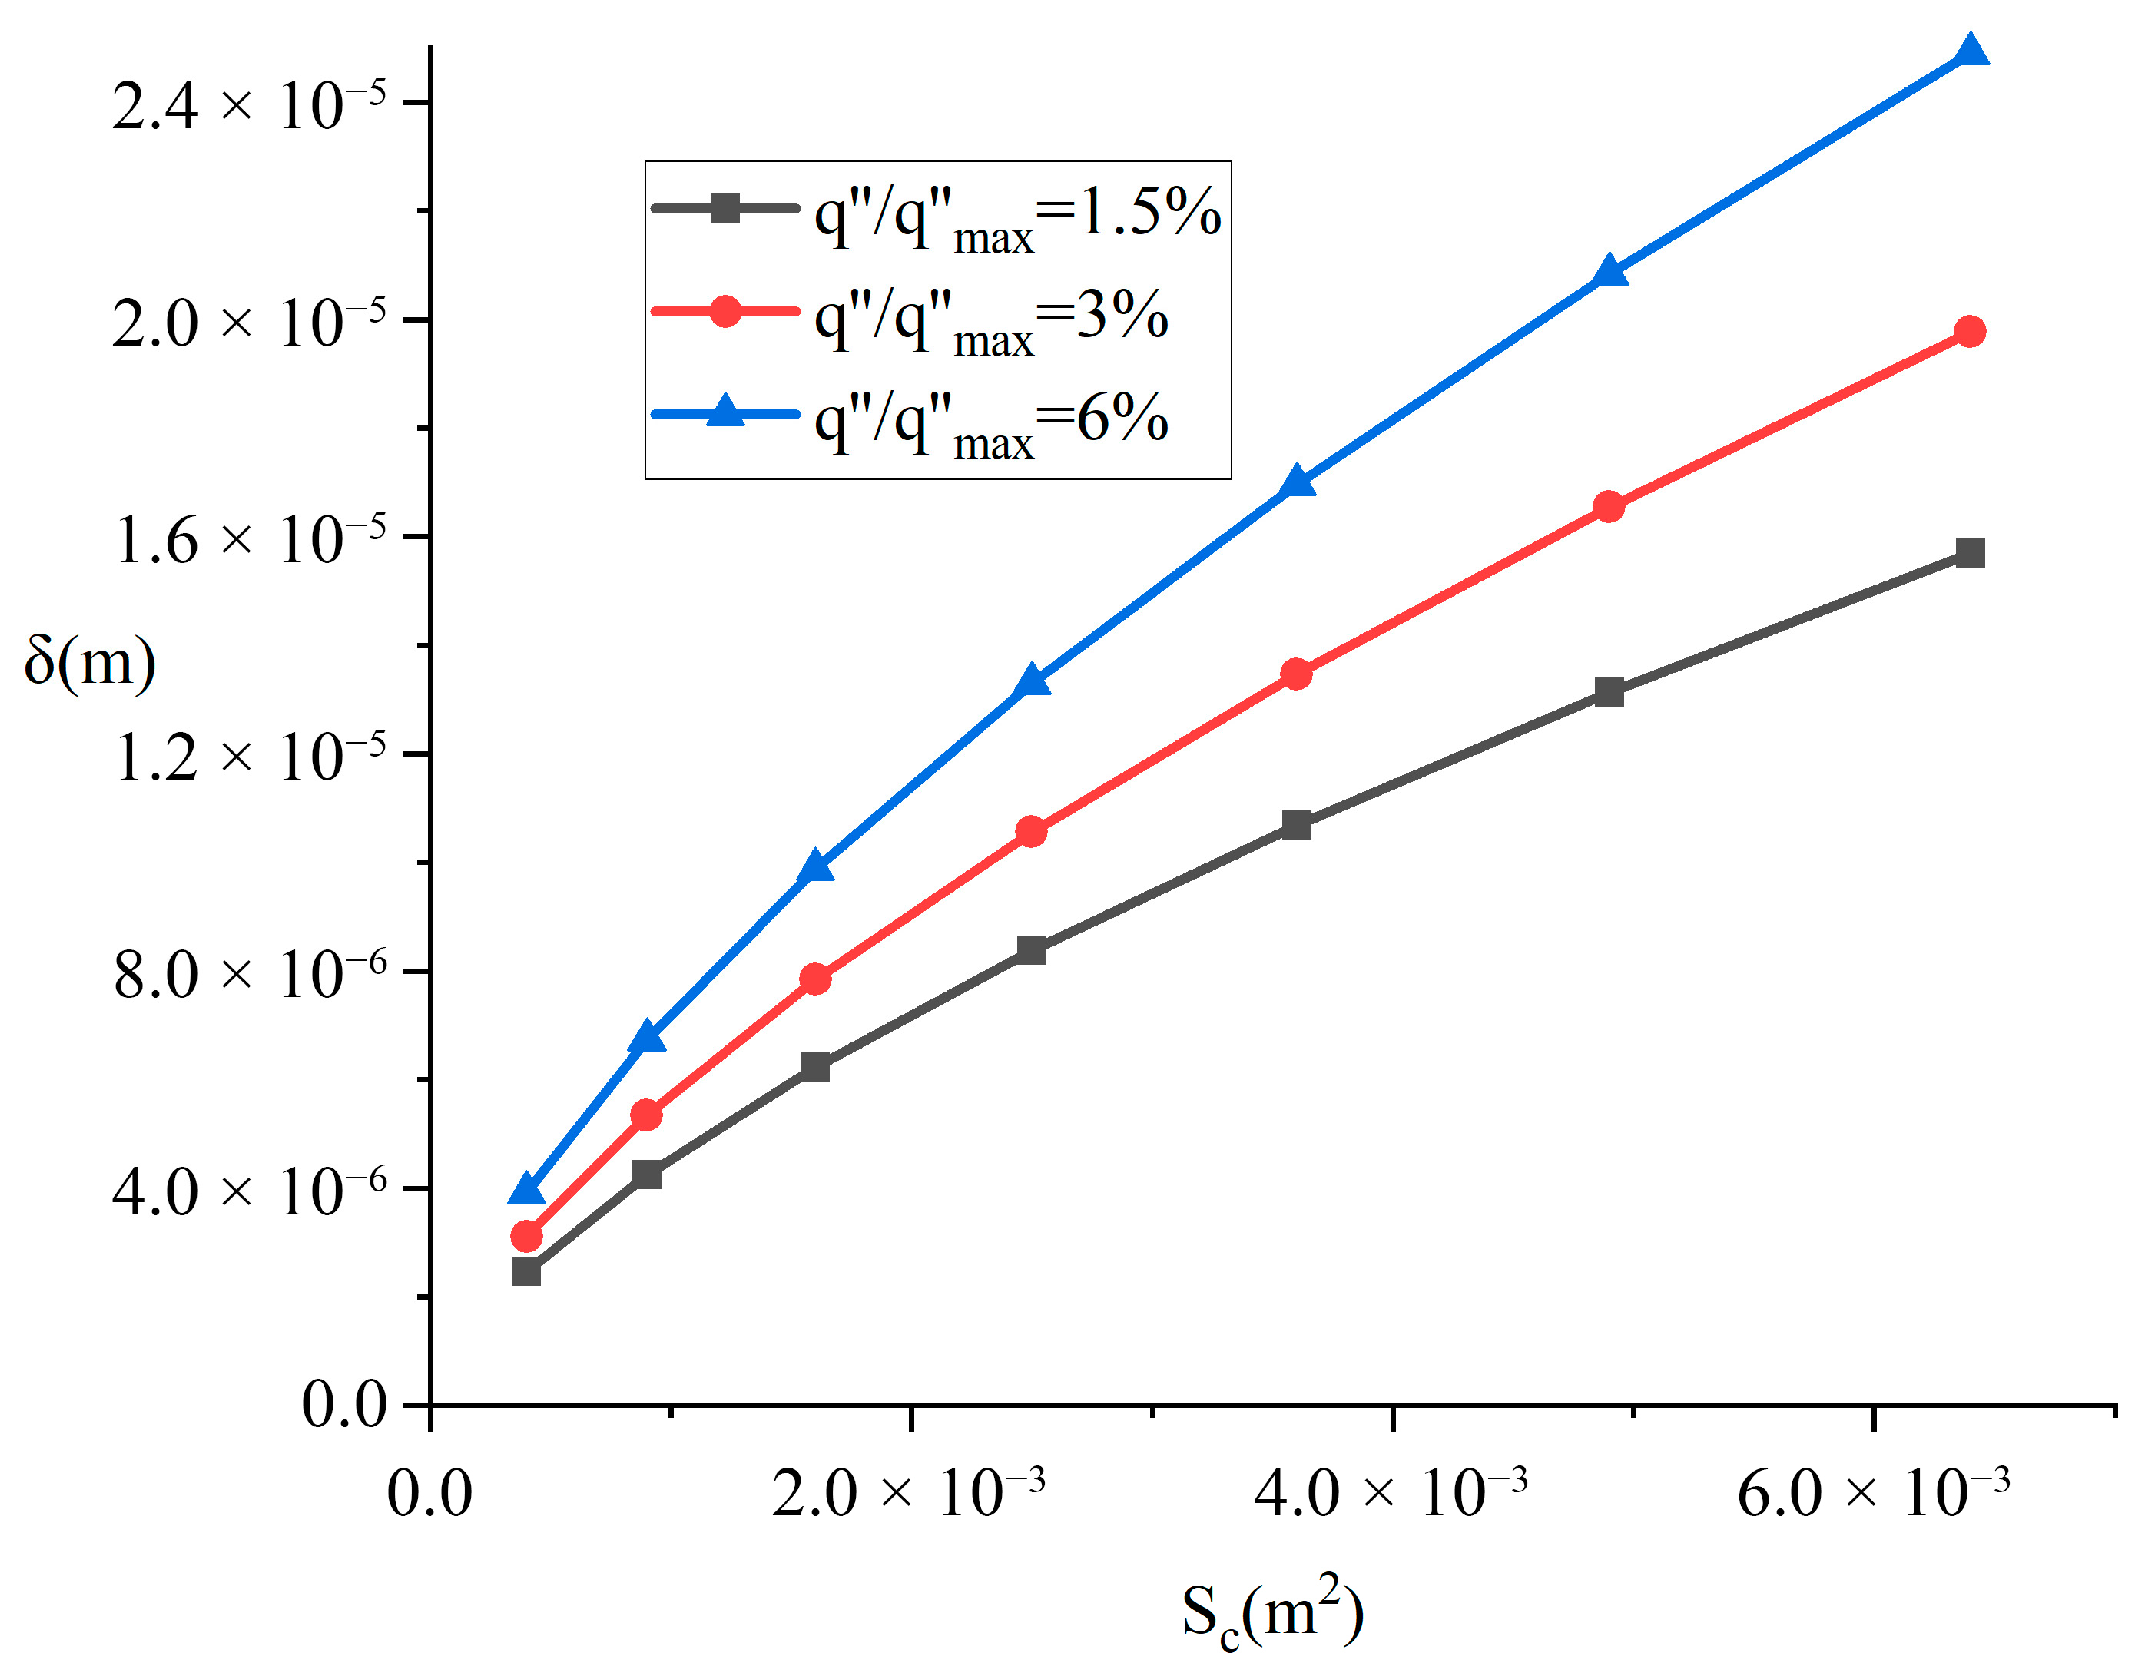
Figure 8 and
Figure 9 illustrate the variations of melting velocity and liquid film thickness with contact area under different heat flux conditions, while maintaining a fixed aspect ratio of four and a constant heat source mass of 100 kg. As observed in
Figure 8, the influence of contact area on melting velocity is minimal and essentially negligible.
Figure 9 demonstrates a proportional relationship between the contact area and liquid film thickness. Under the condition of constant total heat source mass, an increase in contact area leads to a reduction in the unit area pressure acting on the liquid film. According to Equation (16), which states that pressure is inversely proportional to liquid film thickness, this decrease in pressure results in an increase in film thickness.
Existing severe accident analysis codes predominantly employ one-dimensional or two-dimensional models to reduce computational complexity. However, such dimensional simplifications may significantly impact the predictive accuracy of key physical processes. It is therefore essential to evaluate the applicability of dimensional reduction in modeling contact melting phenomena involving internal reactor components.
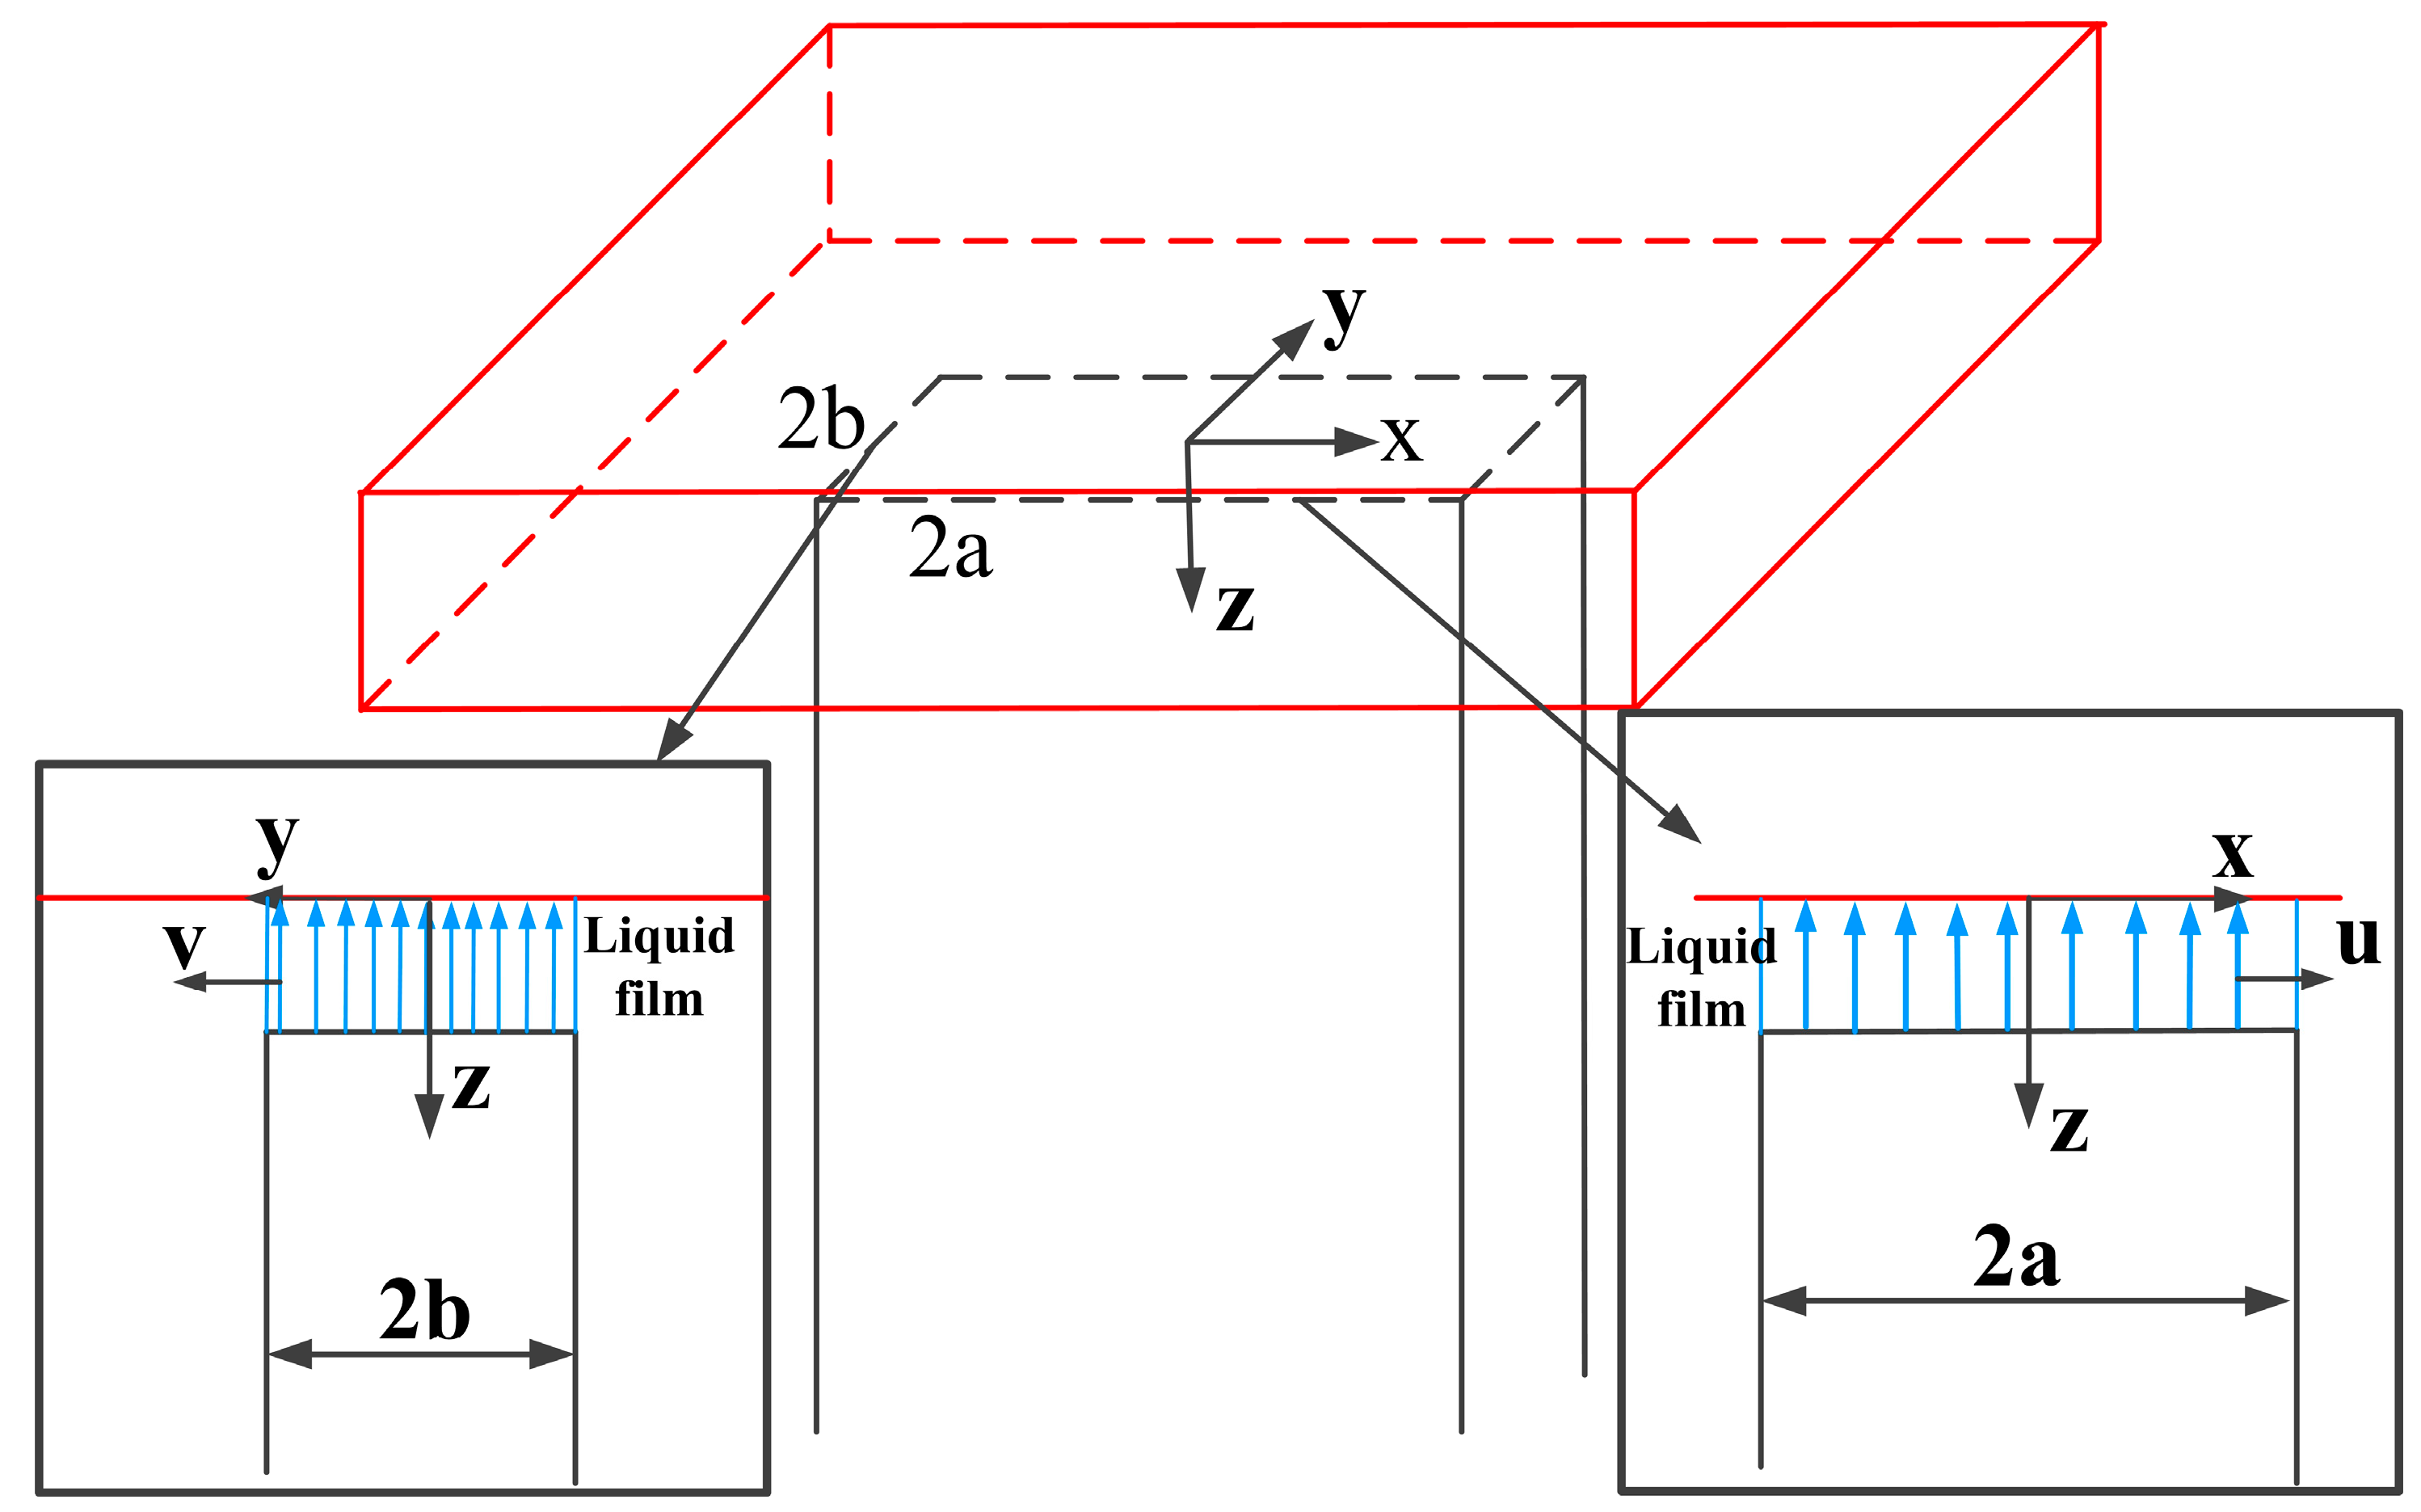
The two-dimensional (2D) model is formulated based on the geometric condition where the material’s width a (in the x direction) is considerably smaller than its length b (in the y direction). Under this assumption, the system can be considered infinite in the y direction, allowing us to neglect flow and gradients along that axis. Consequently, the contact melting problem is simplified to be governed by the equations solved within the x–z plane only.
When
, the condition
holds. According to Equations (7) and (8), this results in
, allowing the neglect of molten liquid flow in the y direction and reducing the governing equations for the liquid film to a two-dimensional flow formulation. Under this condition, Equation (10) simplifies to:
For the above equation, the solution is obtained using the boundary condition P(±a) = 0:
Based on the force balance relationship under quasi-steady-state conditions, the following equation is given:
By combining Equations (29) and (30), the solution can be derived as follows:
By combining Equations (30) and (31), the governing equation for contact melting under the two-dimensional model can be derived as follows:
By comparing Equation (32) with Equation (27), it can be observed that the difference between the two-dimensional and three-dimensional models lies in a correction factor:
This factor is inherently geometry-dependent, indicating that the two-dimensional model neglects liquid flow in the y direction (lateral direction) and assumes all molten liquid flows exclusively along the x direction. Given that the influence of the aspect ratio on the melting front propagation velocity is negligible, and its primary effect manifests in the liquid film thickness, a systematic analysis of the deviation between the liquid film thickness predicted by the two-dimensional model and the three-dimensional benchmark values is conducted here to quantitatively assess the simplification error of the two-dimensional model.
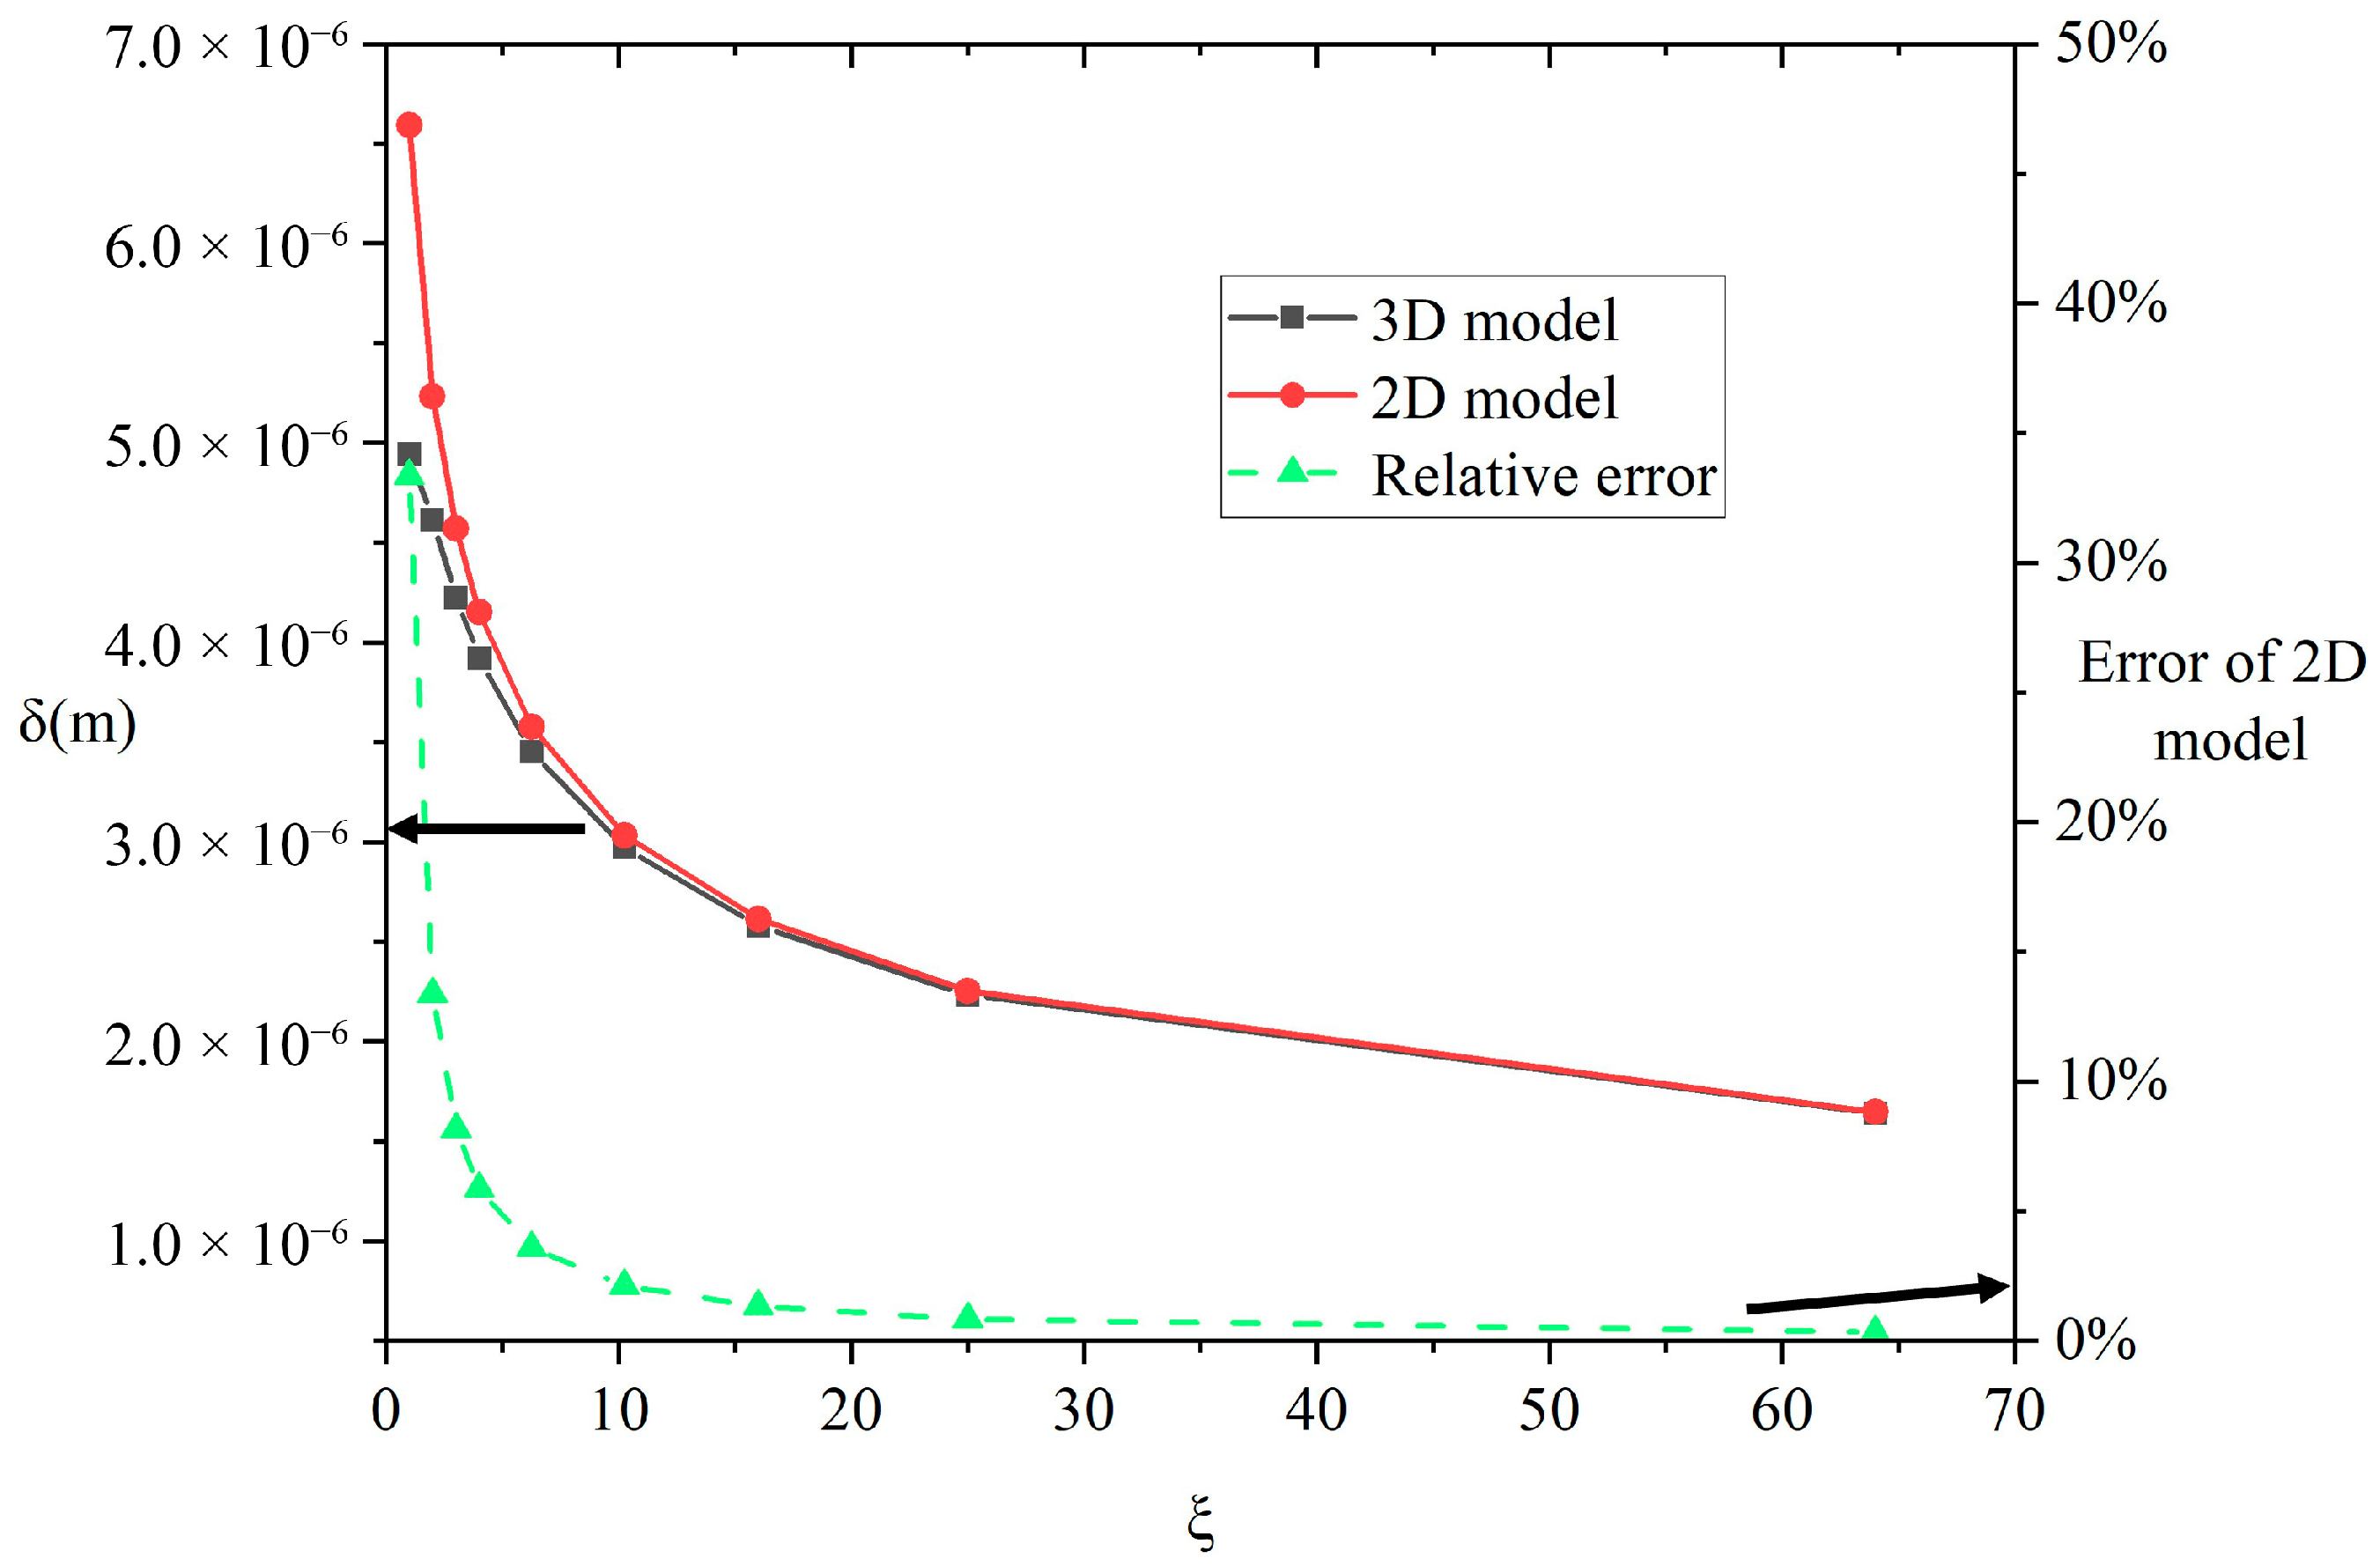
Figure 10 presents the variation of liquid film thickness and its relative error with aspect ratio, calculated by both two-dimensional and three-dimensional contact melting models under the conditions of M
h = 100 kg, q″/q″
max = 4%, and a contact area of 4 cm
2. The left vertical axis represents the liquid film thickness, while the right vertical axis indicates the relative error coefficient. Analysis of
Figure 10 indicates that when the aspect ratio is one, the discrepancy between the liquid film thickness values calculated by the three-dimensional and two-dimensional models is most significant, with an error as high as 33.4%. As the aspect ratio increases, the error decreases rapidly, dropping to 4% at an aspect ratio of six. This significant error trend reveals the critical influence of aspect ratio on the direction of liquid outflow. For square contact surfaces, the two-dimensional model systematically overestimates the liquid film thickness, resulting in a predicted liquid outflow velocity along the short axis (
x-axis) that is higher than the actual value. This implies that in the two-dimensional model, the required temperature of the heat source contact surface to achieve the same melting state is underestimated, ultimately leading to a predicted slower melting progression. It is particularly noteworthy that when the aspect ratio is less than three, the relative error of the two-dimensional model increases significantly. In such cases, a three-dimensional model must be employed for contact melting analysis.
To compare the effects of thermal boundary conditions on contact melting, the following section derives the contact melting equations for a horizontal plate heat source interacting with a three-dimensional plate-shaped phase change material under the Dirichlet boundary condition.
The boundary condition expressed in Equation (23) is modified as follows:
By combining Equations (20), (22), and (34), the expression for the temperature gradient can be derived as follows:
By incorporating the melting energy relationship at the phase-change material surface expressed in Equation (25), the expressions for the velocity U and the liquid film thickness δ under the first-kind boundary condition (Dirichlet boundary condition) can be derived as follows:
Based on Equation (36), the influence of various parameters on the melting process under the Dirichlet boundary condition can be analyzed. This section focuses on the heat source mass as an example to examine its specific effects.
To enable a direct comparison between the Dirichlet boundary condition and Neumann boundary condition, the wall temperature T
w for the Dirichlet boundary condition was determined based on the melting parameters obtained from
Figure 4 for M = 100 kg. The heat conduction within the liquid film is defined by Equation (37):
In Equation (37), q″ represents the heat flux, λ is the thermal conductivity of stainless steel, Tw is the heating wall temperature in K, and Tm is the temperature at the steel contact interface, which remains at the melting point of 1700 K during contact melting. Substituting the heat flux and liquid film thickness from
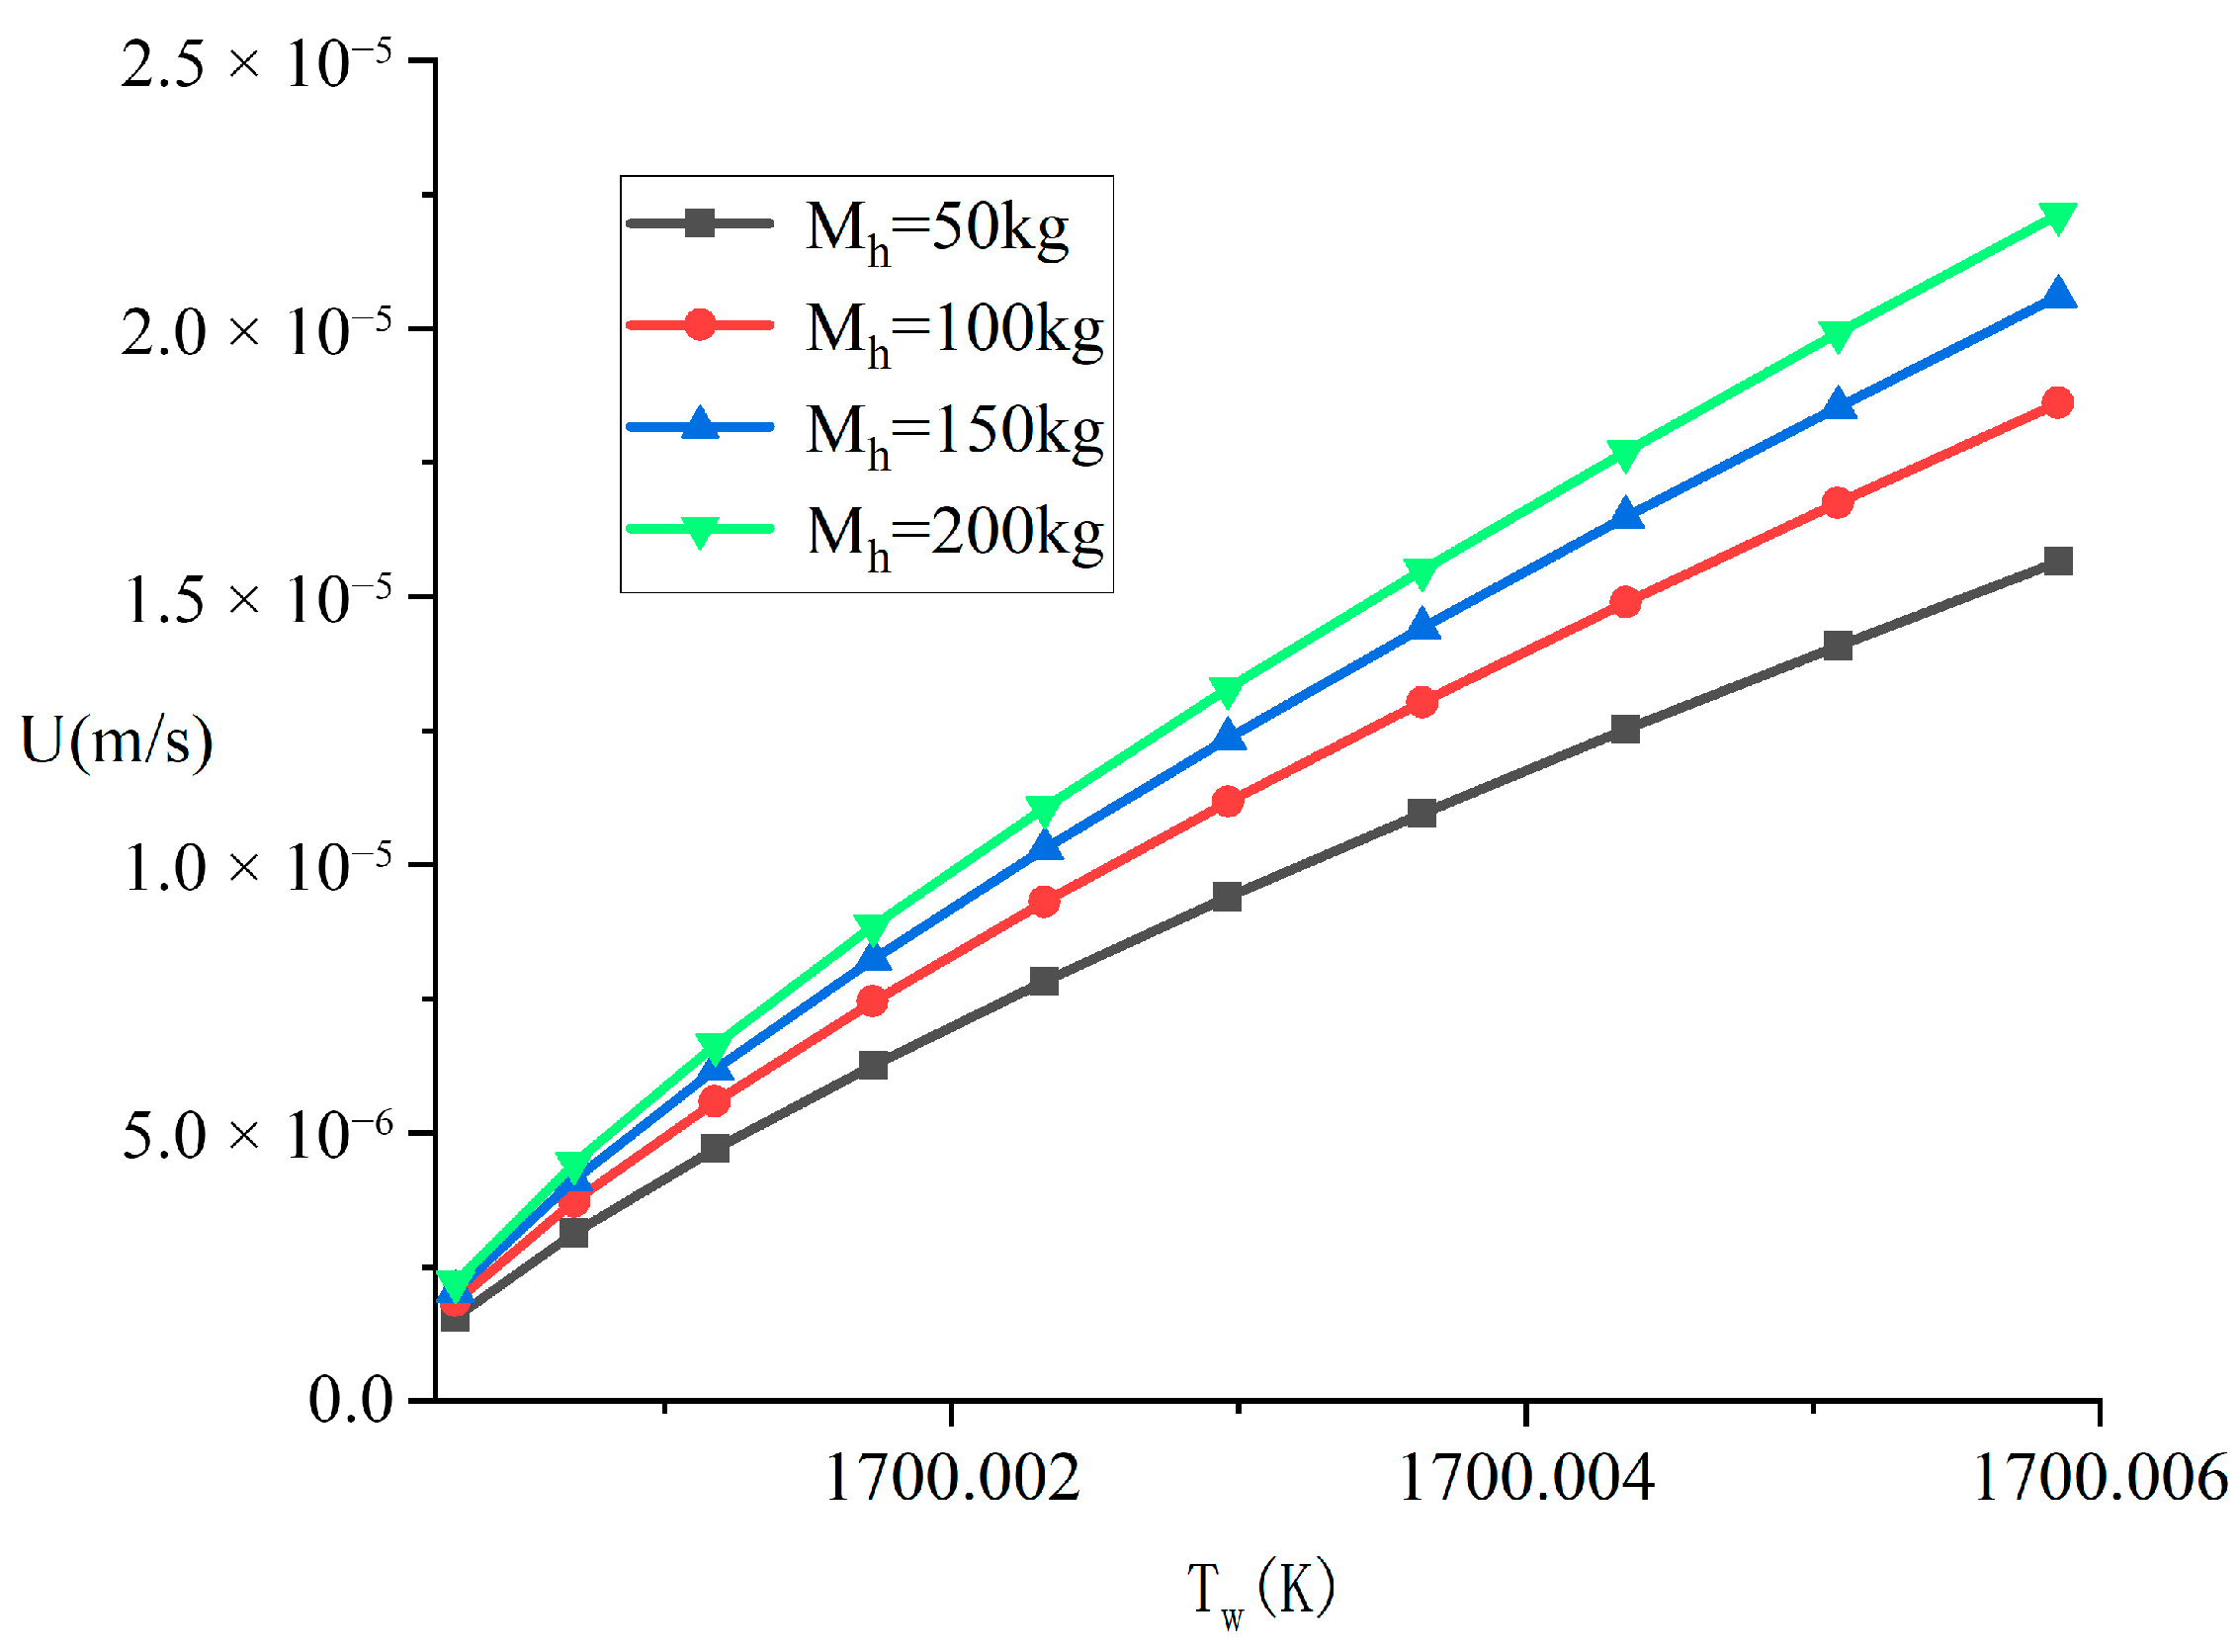
Figure 4 into this equation yields the wall temperature T
w, whose variation range is plotted on the
x-axis of
Figure 11. Consequently, the extremely small value of the film thickness means that even significant variations in heat flux result in only minimal changes in T
w. This explains the narrow temperature range observed in the figure.
Figure 11 illustrates the effect of heat source mass on melting velocity under the Dirichlet boundary condition. Unlike the case with the second-kind boundary condition, an increase in heat source mass enhances the melting velocity. This phenomenon is primarily attributed to the extremely small liquid film thickness, on the order of 10
−6 m. As shown in
Figure 5, an increase in mass leads to a reduction in the film thickness δ. According to Equation (37), a constant wall temperature, Tw, coupled with a decreasing δ, results in a significant increase in the heat flux q″, which consequently enhances the melting velocity U. Owing to the minimal value of δ, even a minor change in T
w is amplified into a substantial variation in q″, thereby inducing a pronounced response in U.
A comparative analysis of the governing equations for the two thermal boundary conditions—Equation (32) for the Neumann and Equation (36) for the Dirichlet—reveals that under the Neumann boundary condition, the melting velocity depends solely on the input heat flux q″. In contrast, under the first-kind boundary condition, the melting velocity is influenced by the heat source gravity and geometric parameters, as the heat flux magnitude under constant temperature conditions depends on the liquid film thickness. This coupling characteristic makes the melting velocity highly sensitive to parameters during numerical solving, easily triggering strong nonlinear effects, numerical oscillations, and convergence difficulties. Additionally, minor fluctuations in the temperature of the heater contact surface are challenging to capture and track dynamically. In summary, the contact melting governing equation under the Neumann boundary condition is more suitable for numerical coupling calculations.
