Article

Bio-Solid Fuel from Wheat Straw via Microwave Torrefaction: Process Optimization and Environmental Assessment

1
School of Resources and Environmental Engineering, Jiangsu University of Technology, Changzhou 213001, China
2
Laboratory and Equipment Management Center, Jiangsu University of Technology, Changzhou 213001, China
3
Jiangsu Jiangnan Water Co., Ltd., Jiangyin 214400, China
*
Author to whom correspondence should be addressed.
These authors contributed equally to this work.
Processes 2025, 13(10), 3302; https://doi.org/10.3390/pr13103302
Submission received: 26 August 2025 / Revised: 4 October 2025 / Accepted: 13 October 2025 / Published: 15 October 2025
(This article belongs to the Special Issue Biofuels Production Processes)

Abstract

There is a need to address the limitations of wheat straw (WS) as a raw biomass fuel, promote its valorisation into a high-quality renewable solid fuel, and enable this fuel to replace fossil fuels in applications such as power plants and industrial boilers. This study focused on optimizing microwave torrefaction parameters to enhance key fuel properties. Optimal conditions were determined via the Box–Behnken design (BBD) within Response Surface Methodology (RSM) as 422.32 W of microwave power, 14.95 min of irradiation time, and a 15 g microwave absorber, resulting in a 69.12% mass yield, an 18.44 MJ/kg higher heating value (HHV) surpassing lignite at 16.76 MJ/kg, and a 25.50% Energy-Mass Co-efficiency Index (EMCI). Fourier transform infrared spectroscopy (FTIR) and thermogravimetric analysis/derivative thermogravimetric analysis (TG/DTG) were conducted to gain insights about chemical composition and thermal stability variations due to torrefaction. LCA showed that electricity produced from 1 ton of torrefied WS reduces CO2 emissions by 259.26 kg CO2eq compared to electricity generated from bituminous coal. From an economic perspective, the usage of torrefied WS for power generation lead to a net profit of CNY 435.19/ton. This scalable technology, by valorising agricultural waste for fuel production, delivers dual environmental and economic benefits, laying the groundwork for industrial deployment.

1. Introduction

An increase in population frequently comes with issues related to resources and the environment. The United Nations forecasts that by 2050, the world’s population will reach 9.7 billion, leading to a steady increase in food requirements. Consequently, the associated agro-industrial waste biomass is projected to escalate, potentially hitting 4 billion tons by 2025 [1]. Presently, agricultural waste disposal methods focus on incineration and landfills; however, these practices result in significant biomass waste and an increased production of furans and dioxins, which are detrimental to the environment. Concurrently, the value of agricultural waste should not be overlooked, as it can generate energy equivalent to 500 tons of crude oil [2]. More importantly, during combustion, agricultural waste emits minimal NOx and SOx [3], rendering it more eco-friendly and cleaner than fossil fuels [4]. Thus, given the non-renewable nature of fossil fuels and the ongoing issue of energy depletion, agricultural waste—a sustainable, renewable, and economical resource—is expected to serve as a clean alternative to fossil fuels.
Wheat is one of the largest grain crops grown globally, and according to the National Bureau of Statistics [5], China’s wheat production was at 137 million tonnes in 2023. Wheat straw (WS) is a by-product generated after harvesting, and for every ton of wheat harvested, about one ton of WS is left in the field. In China, the primary utilization path of WS as a resource is through fertilizer utilization, meaning WS serves as the primary fertilizer for field return, with fuel utilization constituting a minor fraction. While the natural decomposition of WS is generally considered to be carbon-neutral, its negative effects on the mitigation of other greenhouse gases, e.g., methane and nitrous oxide, have been reported by some studies [6,7,8]. It is worth mentioning that WS, as a renewable resource, has an energy value that deserves significant valorisation. The HHV of WS with a moisture content of 15% is about 13.46 MJ/kg, which is lower than the HHV of lignite (16.76 MJ/kg) [9]. Meanwhile, WS, distinguished by its minimal sulphur, ash, and volatile matter, stands out as a prime source of clean energy, and its conversion into a substitute for coal could be a key path in future energy advancements [10].
Biomass can be transformed into energy through two primary approaches: thermochemical and biochemical processes. Thermochemical conversion approaches encompass combustion, hydrothermal liquefaction, torrefaction, and gasification, while biochemical conversion processes include anaerobic digestion and microbial fermentation. Biomass properties play a key role in determining the suitable conversion pathway; for instance, lignocellulosic biomass like WS exhibits high thermal efficiency, rendering thermochemical methods more time-efficient compared to biochemical conversion [11]. In addition, thermochemical technology is the way to achieve a high energy conversion rate of up to 95.5 percent [12]. Among thermochemical methods, torrefaction of biomass to bio-solid fuel is a practical and promising process. Torrefaction, a mild heat treatment process, aims to alter the physicochemical properties of biomass at specific temperatures and times to maximize its quality and energy yield, while simultaneously minimizing elemental ratios (especially O/C and H/C) [13]. Torrefaction enhances the energy density of biomass, removes moisture and low molecular weight organic volatiles, and produces hydrophobic bio-solid fuel with high energy density and grindability. These changes thus make bio-solid fuel convenient for storage and transport, along with combustion in power plants, boilers, and other combustion systems. In recent years, different authors have studied the effects of various operating parameters on the quality of torrefied biomass. For example, studies have been conducted on jute sticks [14], coconut shell [15], sugarcane bagasse [16], WS [17], etc. They observed that high-grade bio-solid fuel can be generated under optimum operational conditions, with its quality matching that of bituminous and anthracite coal [14].
Conventional heating and microwave heating are two common heating technologies employed in thermochemical conversion processes. Traditional heating transfers energy from external sources to the core of the sample through radiation, convection, and conduction, while microwave heating converts electromagnetic energy to heat inside the sample [18]. The merits of microwave heating comprise lower energy usage, high thermal efficiency, easy control, and selective heating. Microwave heating has been emerging as a novel integrated technology in biomass conversion recently. It has been shown that through microwave heating, various biomass feedstocks can be converted into products such as bio-oil, biochar, syngas, and hydrogen, depending on operating parameters, biomass characteristics, etc. [19,20,21,22,23,24]. Microwave heats biomass via dielectric heating, which principally depends on the internal electric field intensity and dielectric properties of materials. Biomass has low susceptibility to microwave irradiation and poor dielectric properties, meaning a higher dose of microwave absorber is required to heat biomass samples via electromagnetic heating [24,25]. The tangent loss angle of WS under the conditions of this study was 0.147, while only materials with a tangent loss angle greater than 0.2 are considered to have excellent microwave absorption capacity [21]. Microwave absorbers encompass silicon carbide (SiC), ferrites, and carbon-based materials, among others. Silicon carbide exhibits restricted microwave absorption capability, though its stability is maintained at elevated temperatures [26]. Meanwhile, traditional magnetic loss materials—including ferrites and other iron-based compounds—demonstrate robust microwave absorption due to their distinct magnetic properties. However, ferric oxide powder is challenging to recycle during microwave torrefaction and can be costly. Carbonaceous materials, such as activated carbon and graphite, exhibit a superior capacity to absorb microwave energy and convert it into thermal energy owing to their higher loss factors [27]. Thereby, incorporating activated carbon as a microwave absorber into dry biomass can enhance heating efficiency.
While a number of reports on biomass torrefaction have used microwave heating [24,28,29], the optimization of this method remains underexplored, especially when considering an advanced torrefaction performance index such as the Energy-Mass Co-efficiency Index (EMCI). Furthermore, research on the optimization of microwave torrefaction is relatively limited, with inadequate exploration of torrefaction process parameters (e.g., torrefaction temperature, irradiation time, and various biomass types). To the best of our knowledge, no study has focused on the effect of different microwave absorber doses on the three torrefaction indices (mass yield, HHV, and EMCI) of WS. To advance this research, this study not only systematically investigates the impact of microwave absorber dose on three core torrefaction indicators: mass yield, HHV, and EMCI, but also elaborates on the characteristics of EMCI for evaluating the storage and transportation of bio-solid fuel, and conducts an in-depth analysis of the response characteristics of these indicators to microwave power, irradiation time, and microwave absorber dose, including the impact of synergistic effects between variables on such characteristics. The in-depth exploration of EMCI and microwave absorber dose distinguishes this study from existing optimization studies, thus complementing research on understanding microwave-specific process-efficiency relationships during WS torrefaction. Over the past several decades, Response Surface Methodology (RSM) has been frequently utilized in optimization studies as an integrative approach combining experimental design, mathematical statistics, and optimization techniques [30]. The advantage of RSM is that it takes into account both the interactions between influencing variables and the effect of combined variables on the response. The use of RSM enables the construction of a continuous variable surface model that assesses process-influencing factors and their interactions, thereby determining the optimal experimental level range and saving human and material resources [31]. In this study, the optimization process was designed and conducted using the Box–Behnken design (BBD) within RSM.
Additionally, to fully understand and assess the potential of WS as a biofuel, the microwave torrefaction process of WS should be evaluated from economic and environmental perspectives. Prior studies lack an integrated perspective combining process optimization with environmental and economic assessments of bio-solid fuel. In this study, a Life Cycle Assessment (LCA) approach was applied to evaluate the environmental sustainability of bio-solid fuel, from its production under optimal conditions to its combustion as a substitute fuel. The main objective of this study was to optimize the torrefaction process parameters for WS using the RSM approach, to enhance its potential as a high-quality fuel, and to analyse its environmental feasibility and economic benefits as an alternative fuel.

2. Materials and Methods

2.1. Raw Materials

WS used in this study was purchased in bulk packages from agricultural suppliers via Taobao.com [32]; the raw material was whole straw harvested by local farmers and produced in Luoyang, Henan Province (112°16′–112°37′ E, 34°32′–34°45′ N). The ultimate analysis and proximate analysis of WS are shown in Table 1.

2.2. Preparation of Bio-Solid Fuel

The naturally dried WS feedstock was dried at a temperature of 105 °C for 12 h to remove residual moisture. The dried WS was ground using a crusher and screened through a 100-mesh screen, and 30.0 g of the raw material was weighed into a quartz ark, with a moisture content of 0.8% after drying. In order to enhance the heating effect of the microwave, 3–15 g of activated carbon as a microwave absorber was added to quartz ark and the mixed material was put into the microwave reactor. The microwave power was set at (300–500 W) and irradiation time (10–30 min). Finally, the treated material was removed, placed in a beaker, and weighed to record the change in mass. The process of bio-solid fuel preparation is shown in Figure 1.

2.3. Optimization Analysis

BBD in RSM optimization methodology is for modelling experimental data. In order to investigate the optimal process parameters for the preparation of bio-solid fuel, three independent variables (microwave power, irradiation time, and microwave absorber addition dose) have been considered by using the RSM-BBD analysis methodology, and each of the variable used three levels. The selection of experimental conditions was based on the RSM model and Design-Expert software version 13.2, which produced a total of 17 experimental runs, in which experimental numbers 1, 4, 6, 12, and 17 were the replicate experimental groups with the same factor levels to test the experimental pure errors. The codes and levels of the independent variables are shown in Table 2.

2.4. Fuel Performance Indicator Analysis

Mass yield, energy yield, energy density, and HHV serve as key metrics for evaluating biomass torrefaction performance. Specifically, mass yield and energy yield represent the total mass and energy proportions between the torrefied product and its raw biomass feedstock, respectively, with their values computed via Equations (1) and (2):
M a s s   y i e l d % = M t o r r e f i e d M r a w × 100 %
E n e r g y   y i e l d % = M t o r r e f i e d M r a w × H H V t o r r e f i e d H H V r a w × 100 %
where Mtorrefied is the mass of the biomass after torrefaction, and Mraw is the mass of the raw material.
HHVs of samples were calculated based on the ultimate analysis data as given in Equation (3) [33]:
H H V = 3.55 × C 2 232 × C 2230 × H + 51.2 × C × H + 131 × N + 20600
In addition, the energy density was determined by Equation (4):
E n e r g y   d e n s i t y = H H V t o r r e f i e d H H V r a w
where HHVtorrefied was the HHV of the biomass after torrefaction; HHVraw was the HHV of the raw material.
To optimize performance, achieving a high energy output from solid fuel with reduced volume is critical for boosting processing efficiency and simplifying transportation. The difference between energy and solid yields is used to calculate EMCI, as shown in Formula (5). A higher EMCI value stands for higher energy yield and lower solid yield.
E M C I = E n e r g y   y i e l d % M a s s   y i e l d   ( % )

2.5. Characterisation Analysis Methods

The characterization results of WS and bio-solid fuel produced under optimal parameters were analysed. Elemental C, H, and N were determined in raw materials and samples using an Elementar Elemental Analyser. Fourier transform infrared spectroscopy spectra of feedstocks and products in the range of 400–4000 cm−1 at room temperature were determined using a Nicolet IS 10 FTIR analyser (Thermo Fisher Scientific, Waltham, MA, USA). A thermogravimetric analyser (Netzsch, Selb, Bavaria, Germany) was used for thermal stability testing of experimental feedstock and bio-solid fuel products.

2.6. Life Cycle Assessment

LCA is a powerful tool for comprehensively evaluating the environmental effect and energy consumption based on all the stages of product’s life and processes, as well as waste treatment, waste management systems, and processes for recycling and valorisation [34,35,36,37]. This study’s LCA was based on the methodologies outlined by Liu et al. [38] and Gong et al. [39] to evaluate the carbon emission impact associated with the microwave torrefaction of WS to solid fuel products.

2.6.1. Goal and Scope

The main goal of this LCA study was to evaluate the pathway of processing WS via microwave torrefaction and to assess the carbon emission impacts of the produced bio-solid fuel as a value-added product, with a comparison to traditional coal fuels. The functional unit of this study was the torrefaction of 1 t of WS to obtain 691.2 kg of bio-solid fuel. The cradle-to-grave analysis encompasses raw material transportation, pre-treatment, torrefaction, and power generation processes. The system boundary of the LCA model for the bio-solid fuel system in this project is shown in Figure 2, which includes the following: (1) biomass feedstock collection and transport; (2) feedstock pre-treatment (including grinding and drying); (3) biomass torrefaction; (4) bio-solid fuel transhipment; and (5) bio-solid fuel combustion for power generation.

2.6.2. Life Cycle Inventory

Table 3 presents the life cycle inventory, listing the primary inputs and outputs across its key stages.
The proposed torrefaction plant is located in Luoyang, Henan Province, China (112°16′–112°37′ E, 34°32′–34°45′ N). The plant is located at the junction of urban and rural areas in Luoyang, Henan Province, which is convenient for transporting various types of agricultural waste.
(i)
Collection and transportation
WS, as a common agricultural industrial waste, is typically collected and centrally processed during farmers’ production processes, so no additional energy input is required during the collection stage. The primary input during transportation is the gasoline fuel consumed by vehicles. A 10-tonne truck consumes 0.226 kg/km, with gasoline emitting 2.7 kg of CO2eq per kilogram. The average transportation distance from the farm to the torrefaction plant and from the torrefaction plant to the power generation facility is 50 km. During the transportation phase, the carbon emissions per tonne of WS are given by the following Equation (6).
GHGt = average transportation distance × CO2 emission per km/truck loading
where GHGt denotes the total greenhouse gas emissions during the transport phase.
(ii)
Pre-treatment stage
Pretreatment costs include biomass drying Hdry and crushing Hgrind, according to Equations (7) and (8):
Hdry   =   M biomass × Δ T × C biomass 1 0.25
Hgrind = Mbiomass × 256.32
where Mbiomass is the total dry weight of biomass (t); Cbiomass is the specific heat capacity of biomass (kJ/kg/°C), and its value is 3.4 kJ/kg/°C; and ΔT is the difference between the initial and final temperatures of drying (°C), which is 80 °C in this paper.
In addition, for the drying and torrefaction heat transfer process of biomass, a heat transfer loss of 25% must be considered. A total of 256.32 MJ/t is the energy required for grinding per unit of biomass [40].
(iii)
Torrefaction
The carbon emissions at this stage originate from the electricity consumed during torrefaction. Under the experimental conditions with 30 g of WS, microwave power of 422.32 W, irradiation time of 14.95 min, and microwave absorber dose of 15 g, the higher HHV of the bio-solid fuel is 18.44 MJ/kg, with a mass yield of 69.12%. The global average efficiency of coal-fired power generation is 37.5%. To generate an energy product with a calorific value of 1 MJ, 0.017 kWh of electrical energy is required [39]. Additionally, 997 kg CO2eq are emitted per 1000 kWh of electricity generated [41].

3. Results and Discussion

3.1. Characterisation of Raw Materials

The physiochemical characteristics of WS are shown in Table 1. The WS samples were well pretreated, with moderate dryness and a moisture content of 6.21%, which does not affect the initial temperature of torrefaction. The volatile matter content (73.84%) is lower than that of pequi seeds (85.82%) [42], resulting in a lower proportion of gases and liquids in the torrefaction products. The ash content (7.2%) is higher than that of jute sticks (2.8%) and pequi seeds (1.2%), indicating a tendency toward corrosion, slagging, and scaling [43]. Fixed carbon, characterized by a relatively slow combustion rate and persistent heat release, can prolong combustion duration and boost combustion stability at higher content. The fixed carbon content (12.75%) of WS is comparable to that of pequi seeds (12.98%) [42].

3.2. Box–Behnken Results and Analyses

3.2.1. BBD Experimental Design and Results

The mass yield (Y1), HHV (Y2), and EMCI (Y3) of bio-solid fuel were used as the response values to design the BBD scheme using Design Expert 13.2 software. Table 4 presents the results of 17 experimental runs, where the mass yield of bio-solid fuel spanned 35.93 to 89.87%, the HHV ranged from 13.45 to 18.27 MJ/kg, and the EMCI varied between 0.018% and 19.997%.

3.2.2. Statistical Analysis

The coefficients of the model equations and their statistical significance are evaluated using Design Expert 13.2 software. The quadratic regression models for mass yield (Y1), HHV (Y2), and EMCI (Y3) based on the coding factors are given by Equations (9)–(11):
Y1 = 66.48 − 7.73A − 16.77B − 1.98C − 0.445AB + 1.59AC + 0.7425BC + 1.65A2 − 4.77B2 + 3.72C2
Y2 = 17.25 + 0.6356A + 1.74B + 0.5159C − 0.3798AB − 0.2636AC − 0.0080BC − 0.3781A2 − 0.7567B2 − 0.4644C2
Y3 = 18.69 + 1.87A + 5.18B + 2.4C − 3.8AB − 1.37AC − 0.8282BC − 1.88A2 − 6.93B2 − 1.49C2
Experimental outcomes from the BBD were evaluated via analysis of variance (ANOVA) and hypothesis testing with p-values and F-values. Here, F-value magnitude indicates model reliability, whereas p-value size signals the model’s significance level: a p-value > 0.05 denotes a lack of significance; a p-value < 0.05 indicates greater significance; and a p-value < 0.0001 signifies that the model is particularly significant.
ANOVA outcomes for mass yield are presented in Table 5. The regression model for mass yield yields an F-value of 45.89, indicating significance, with only a 0.01% likelihood of such a high F-value arising from interference. A p-value < 0.0001 signifies that microwave power and irradiation time are statistically significant for the regression equation. By comparing F-values and p-values across factors, the primary effects of irradiation time and power in this model have p-values < 0.001, meaning they are highly significant for bio-solid fuel production, whereas the absorber addition dose exerts a weaker influence on yield.
From Equation (9), the absolute values of the coefficients of the regression equation of mass yield were A = 7.73, B = 16.77, and C = 1.98, and the effects of B on mass yield are 2.17 times and 8.47 times of A and C, respectively, which implied that B played a more important role in the torrefaction process, and it can be seen that the main effect of the various factors on the mass yield was as follows: microwave power > irradiation time > absorber addition dose.
The ANOVA results of the numerical model for the HHV of bio-solid fuel are shown in Table 6. In the regression model for the HHV of bio-solid fuel, F = 376.47 and p < 0.00001, which indicates that the regression equation for the HHV is highly significant; comparing the F-values and p-values of the factors, the p-values of the primary terms of the model are all <0.0001, which indicates that the effects of the microwave power, the irradiation time, and the amount of the absorber added on the torrefaction results are all highly significant. In addition, the effects of the secondary terms B2 and C2 on the HHV were highly significant, and the effect of A2 on the HHV was shown to be significant. The p = 0.1578 > 0.05 of the dislocation term is not significant, which indicates that the external factors interfere less with the experimental results and the experimental results are predictable.
As can be seen from Equation (10), the absolute values of the coefficients of the HHV regression equation are A = 0.6356, B = 1.74, and C = 0.5159, and the effects of B on HHV are 2.76 times and 3.41 times of A and C, respectively, which indicates that B has a greater influence on the HHV of bio-solid fuel compared with A and C. It can be seen that the main effect of each factor on the HHV is as follows: microwave power > irradiation time > absorber addition dose.
The ANOVA results of the numerical model of EMCI for bio-solid fuel are shown in Table 7. In the regression model of EMCI for bio-solid fuel, F = 49.24 and p < 0.00001, which indicates that the regression equation of EMCI is highly significant; comparing the F and p values of the factors, the p value of the power of this model is less than 0.001, i.e., the microwave power is highly significant on the storage and transport performance of bio-solid fuel, whereas the irradiation time and the absorber addition dose had less effect on the storage and transport performance of bio-solid fuel. In addition, the effect of the quadratic term B2 on the storage and transport performance was highly significant, and the effects of A2 and C2 on the storage and transport performance were shown to be significant. The p = 0.1578 > 0.05 of the misfit term is not significant, which indicates that the external factors interfere less with the experimental results and the experimental results are predictable.
As shown in Equation (11), the absolute values of the coefficients of the EMCI regression equation are A = 1.87, B = 5.18, and C = 2.4, and the effects of B on EMCI of bio-solid fuel are 2.77 times of that of A and 2.16 times of that of C, which indicates that B has a greater influence on the storage and transport performance of bio-solid fuel as compared with that of A and C. From this, it can be seen that the main effect of each factor on the storage and transport performance is as follows: microwave power > absorber addition dose > irradiation time.
Table 8 shows the fitting accuracy of the bio-solid fuel model. The complex correlation coefficient (R2) is an important parameter when discussing the validity of any regression model. A high value of R2 indicates that the regression model fits to the experimental data to a high extent, thereby validating the model’s reliability. A regression model is considered to be suitable if the R2 value is greater than 0.98. In the present work, the R2 value of mass yield, HHV, and EMCI are 0.9833, 0.9979, and 0.9844, respectively. The higher R2 value indicates that the empirical model linked the process parameters smoothly and is predicting the responses accurately. The difference in the corrected (R2adj) and predicted (R2pred) coefficient is less then 0.2 [44], and the larger the value of the two coefficients, the better the interpretation of the model. In this study, the difference between R2adj and R2pred of the three models is 0.1442, 0.0191, and 0.1387, respectively, all <0.15, showing the better reliability of the three models. The coefficient of variation (C.V.) is an indicator of the degree of variation in a model. In this study, the C.V. for each model was less than 10% [45], further indicating that these models have high fitting accuracy and reliability.

3.2.3. Residual Analysis

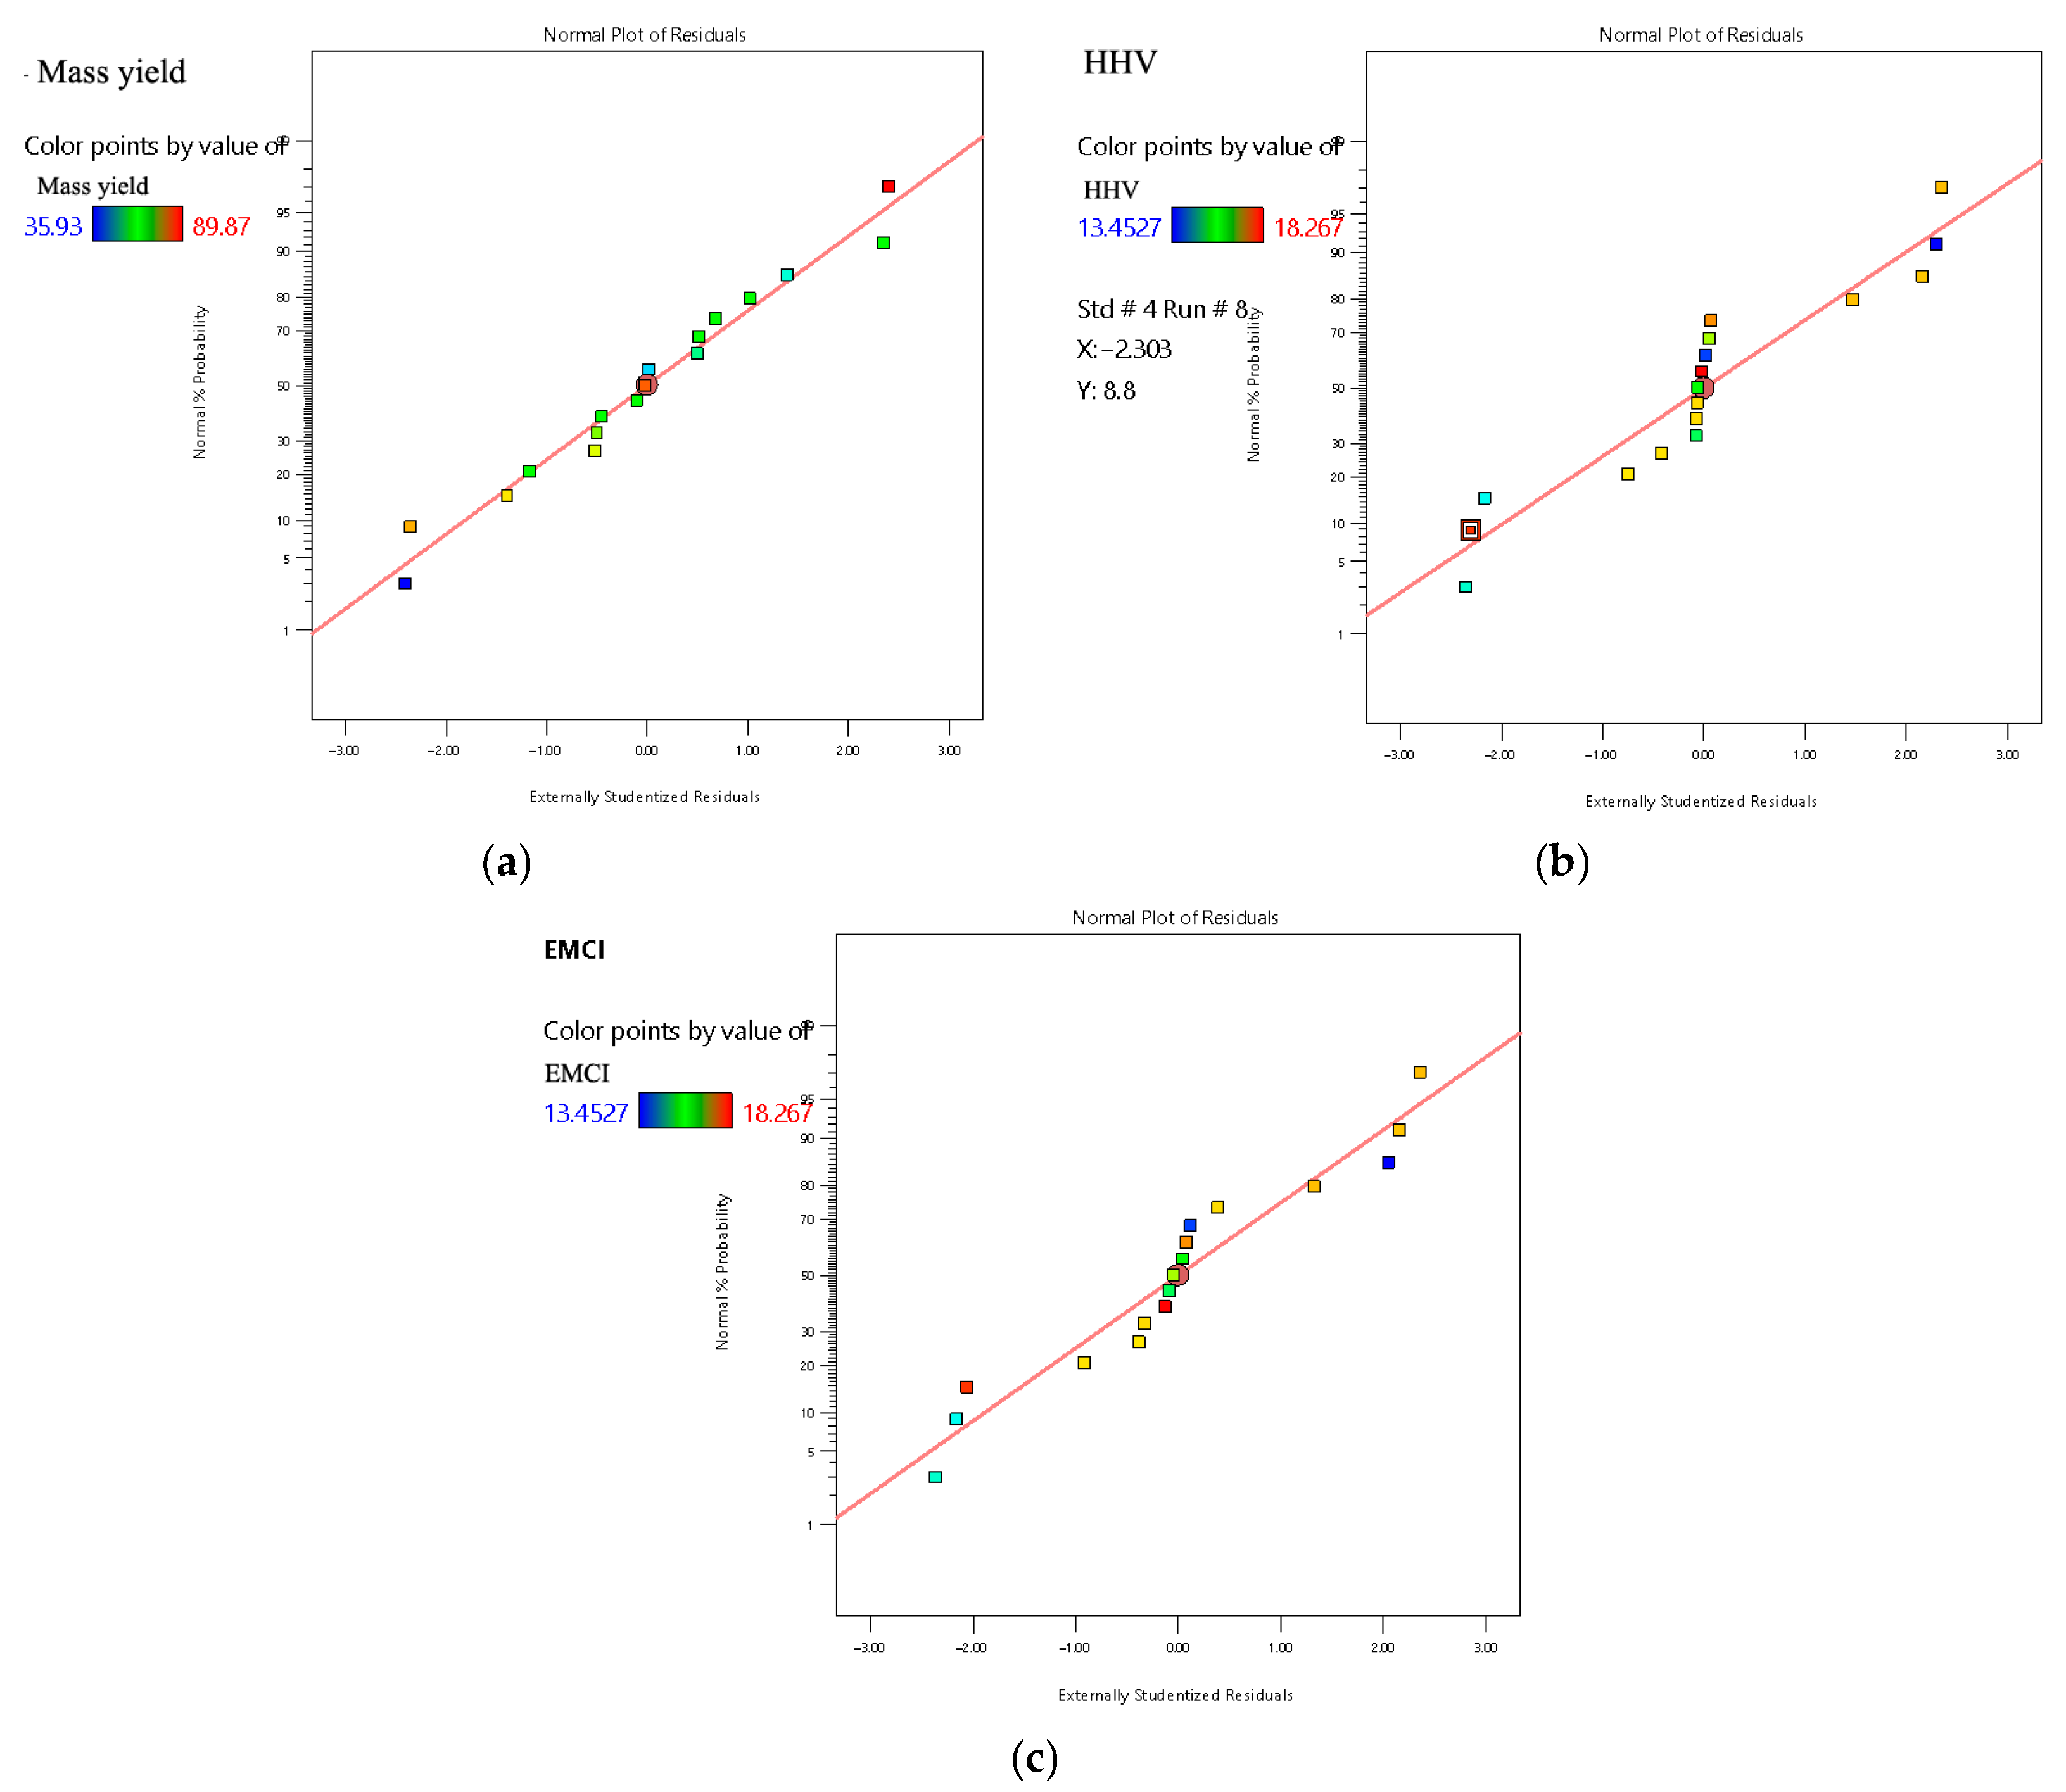
Residual analysis serves to assess model relevance and data reliability. Typically, during model regression analysis, residual values must be evaluated to validate model rationality, with residuals expected to follow a normal distribution when excluding experimental outliers. Residual distributions for mass yield (a), HHV (b), and EMCI (c) are presented in Figure 3.
From Figure 3, it is evident that the standardized residual values of each model contain only a small number of experimental points outside the range of (−2, 2). The distribution of these experimental points is random with irregular features, which confirms the rationality of experimental point selection. Additionally, all experimental points are uniformly distributed along a straight line, with only a few outliers. This indicates that the standardized residuals of each model follow a normal distribution, thereby validating the regression performance of the models.

3.2.4. Optimization Analysis and Model Validation

Figure 4 shows a three-dimensional response surface demonstrating the effect of preparation variables of bio-solid fuel on mass yield. Figure 4a reveals the relationship between irradiation time and microwave power on mass yield, showing that high microwave power and long radiation time are negatively correlated with mass yield. And it was found that in the torrefaction process, microwave power played a more important role than irradiation time for mass yield. Figure 4b demonstrates the relationship between irradiation time and absorber addition dose on bio-solid fuel interaction. Compared with Figure 4a, Figure 4b shows that the interaction between irradiation time and absorber addition dose has less effect on mass yield, and this result is in agreement with Antunes et al. According to his study, the decrease in mass yield is due to the increase in microwave power and the prolongation of the irradiation time, which leads to an increase in dehydration and decomposition of the biomass, and thus a decrease in the mass yield. Figure 4c demonstrates the effect of the interaction of microwave power and absorber addition dose on mass yield, which showed a decreasing trend with the increase in microwave power and absorber addition dose. This finding provides important clues for a deeper understanding of the interaction of variables in the bio-solid fuel preparation process.
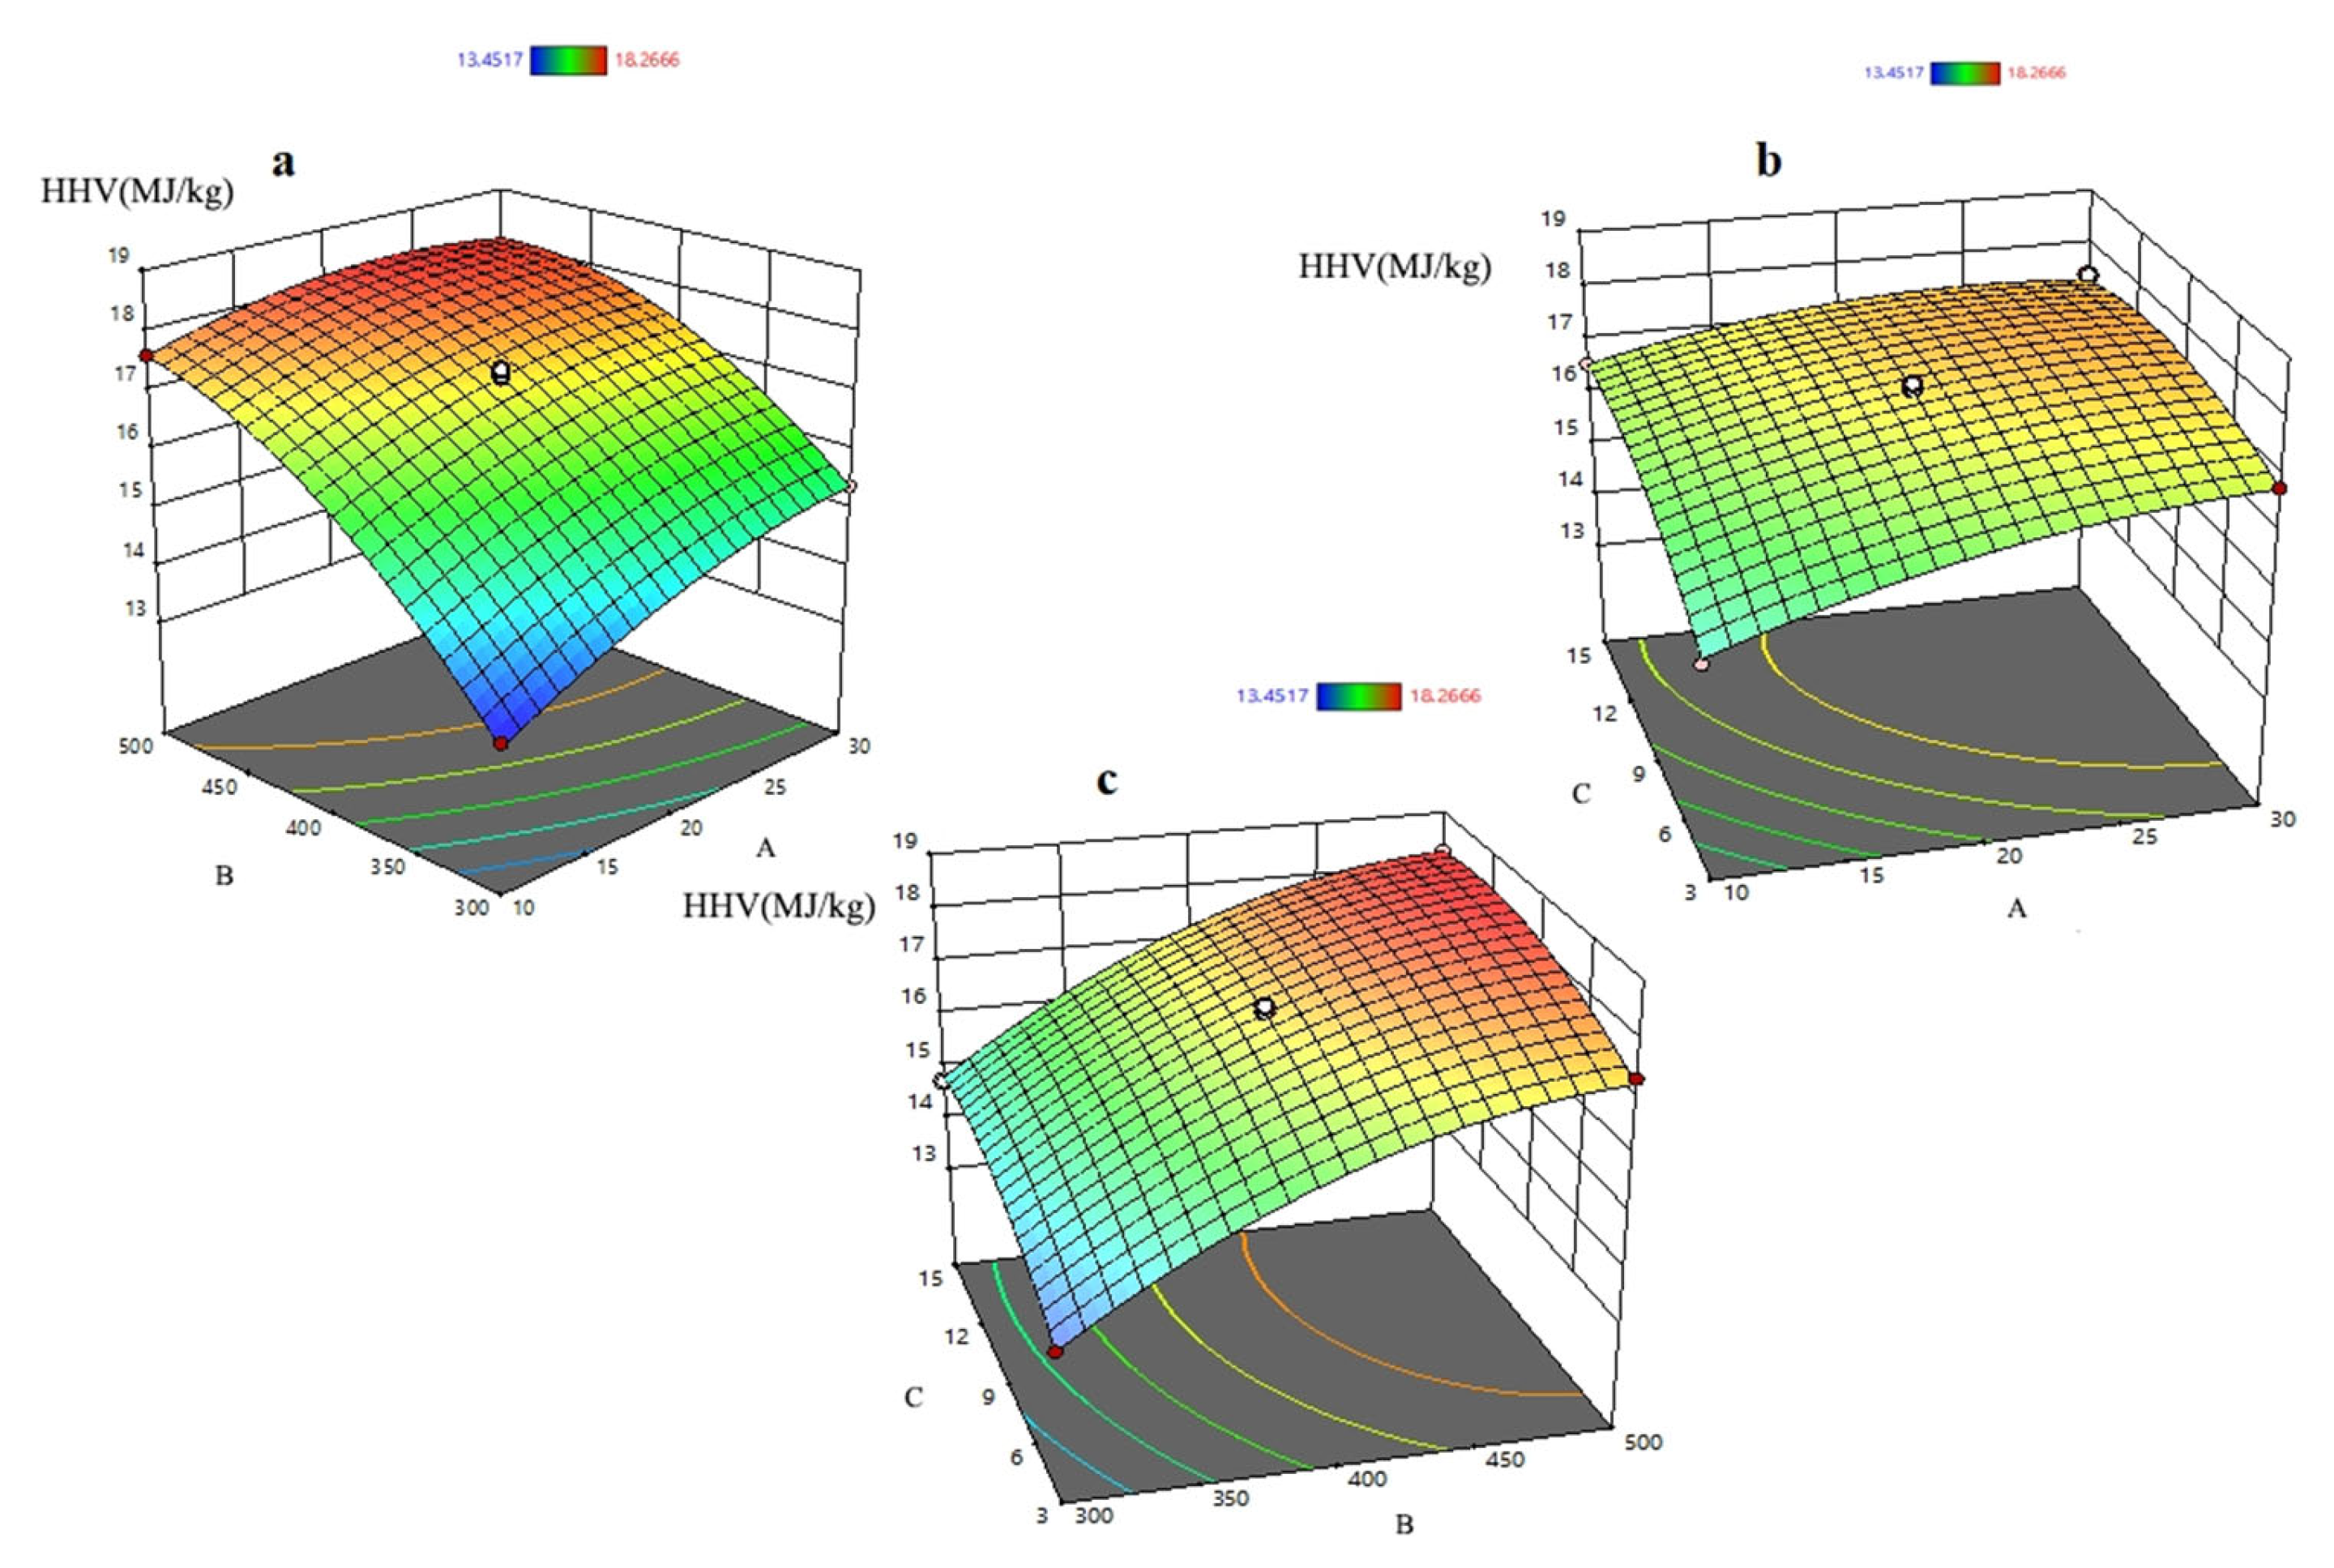
Figure 5 shows the three-dimensional surface response of bio-solid fuel HHV. Figure 5a shows that with the increase in microwave power and irradiation time, the HHV of bio-solid fuel rises gradually, and when the microwave power reaches 500 W and the irradiation time is 30 min, the heating value reaches the maximum value of 18.01 MJ/kg. This is due to the fact that as the microwave power and irradiation time increase, the oxygen removed forms CO2, CO, and H2O in higher amounts, thus increasing the higher heating value. This can be verified by the elemental analysis of products and raw materials under optimal conditions. Another reason for the increased heating value of the biomaterial is the decrease in moisture content and the increase in the C/O ratio due to torrefaction [46]. Figure 5b shows that with the gradual increase in absorber addition dose, the HHV of bio-solid fuel shows a relatively smooth and linear change, which implies that the microwave absorber addition dose has less effect on the HHV of bio-solid fuel. Figure 5c has a similar trend to Figure 5a: Figure 5c shows that the HHV of bio-solid fuel rises with the increase in microwave power and absorber addition dose, and at the highest point of the curved surface, the interaction between the two effects reaches the maximum, and the HHV of the bio-solid fuel reaches 18.27 MJ/kg, which shows the synergistic effect of the microwave power and the amount of absorber added in the process of bio-solid fuel preparation.
Figure 6 shows the three-dimensional surface response of the bio-solid fuel EMCI. As shown in Figure 6a, the general trend of increasing microwave power and irradiation time on EMCI is increasing and then decreasing, and the EMCI reaches the maximum value of 19.9972% when the microwave power reaches 400 W and the irradiation time is 20 min. Figure 6b shows that the EMCI of bio-solid fuel exhibits a smoother linear change with the gradual increase in absorber addition dose, which implies that the microwave absorber addition dose has less effect on the EMCI of bio-solid fuel. Figure 6c has a similar trend of change to Figure 6a: Figure 6c shows that the microwave power has a greater effect on EMCI than the microwave absorber addition dose during the torrefaction process.
In order to further determine the optimal process conditions for the preparation of bio-solid fuel, numerical optimization was carried out using Design Expert 13.2 software, and the optimized process slope shape of bio-solid fuel was obtained as shown in Figure 7. The optimal combinations of process parameters for the preparation of bio-solid fuel were analysed as follows: irradiation time of 14.95 min, power of 422.32 W, and the amount of microwave absorber added of 15 g. Under these conditions, the simulated bio-solid fuel yield was 67.96%, the HHV was 17.40 MJ/kg, and the EMCI was 19.92%, which was higher than the HHV of lignite (16.76 MJ/kg) but lower than that of bituminous coal (24.21 MJ/kg).
The mass yield and HHV along with EMCI of the prepared bio-solid fuel under optimal conditions are summarized in Table 9 with the predicted values of the model. It can be seen that the errors between the mass yield and HHV of the bio-solid fuel and the model’s predicted values are less than 6%, which indicates that the optimization of the BBD experimental model can be used to optimize the parameters of the bio-solid fuel torrefaction process with a high degree of confidence. Meanwhile, as determined by the elemental analyser, the O/C ratio of bio-solid fuel was reduced from 0.83 to 0.083, and the H/C ratio was reduced from 2.02 to 1.261, and the calculated EMCI of 19.89% was higher than the EMCI value of jute stalks of the previous study (17.63%) [13] by 11.4%, and higher than that of the EMCI value of the fuel derived from industrial waste material (11.7%) by 41.18%, and higher than the EMCI value of coconut shells in existing studies (16.66%) [15] by 8.84%.

3.2.5. Comparison with Prior Research

Table 10 compares the performance metrics of the bio-solid fuel produced in this study with those reported in prior research. The optimized bio-solid fuel exhibits a relatively high mass yield, and its HHV is comparable to the optimized results of other studies; combined with the relatively high EMCI value mentioned earlier, it demonstrates excellent fuel performance.

3.3. Characterisation Analysis

3.3.1. FTIR

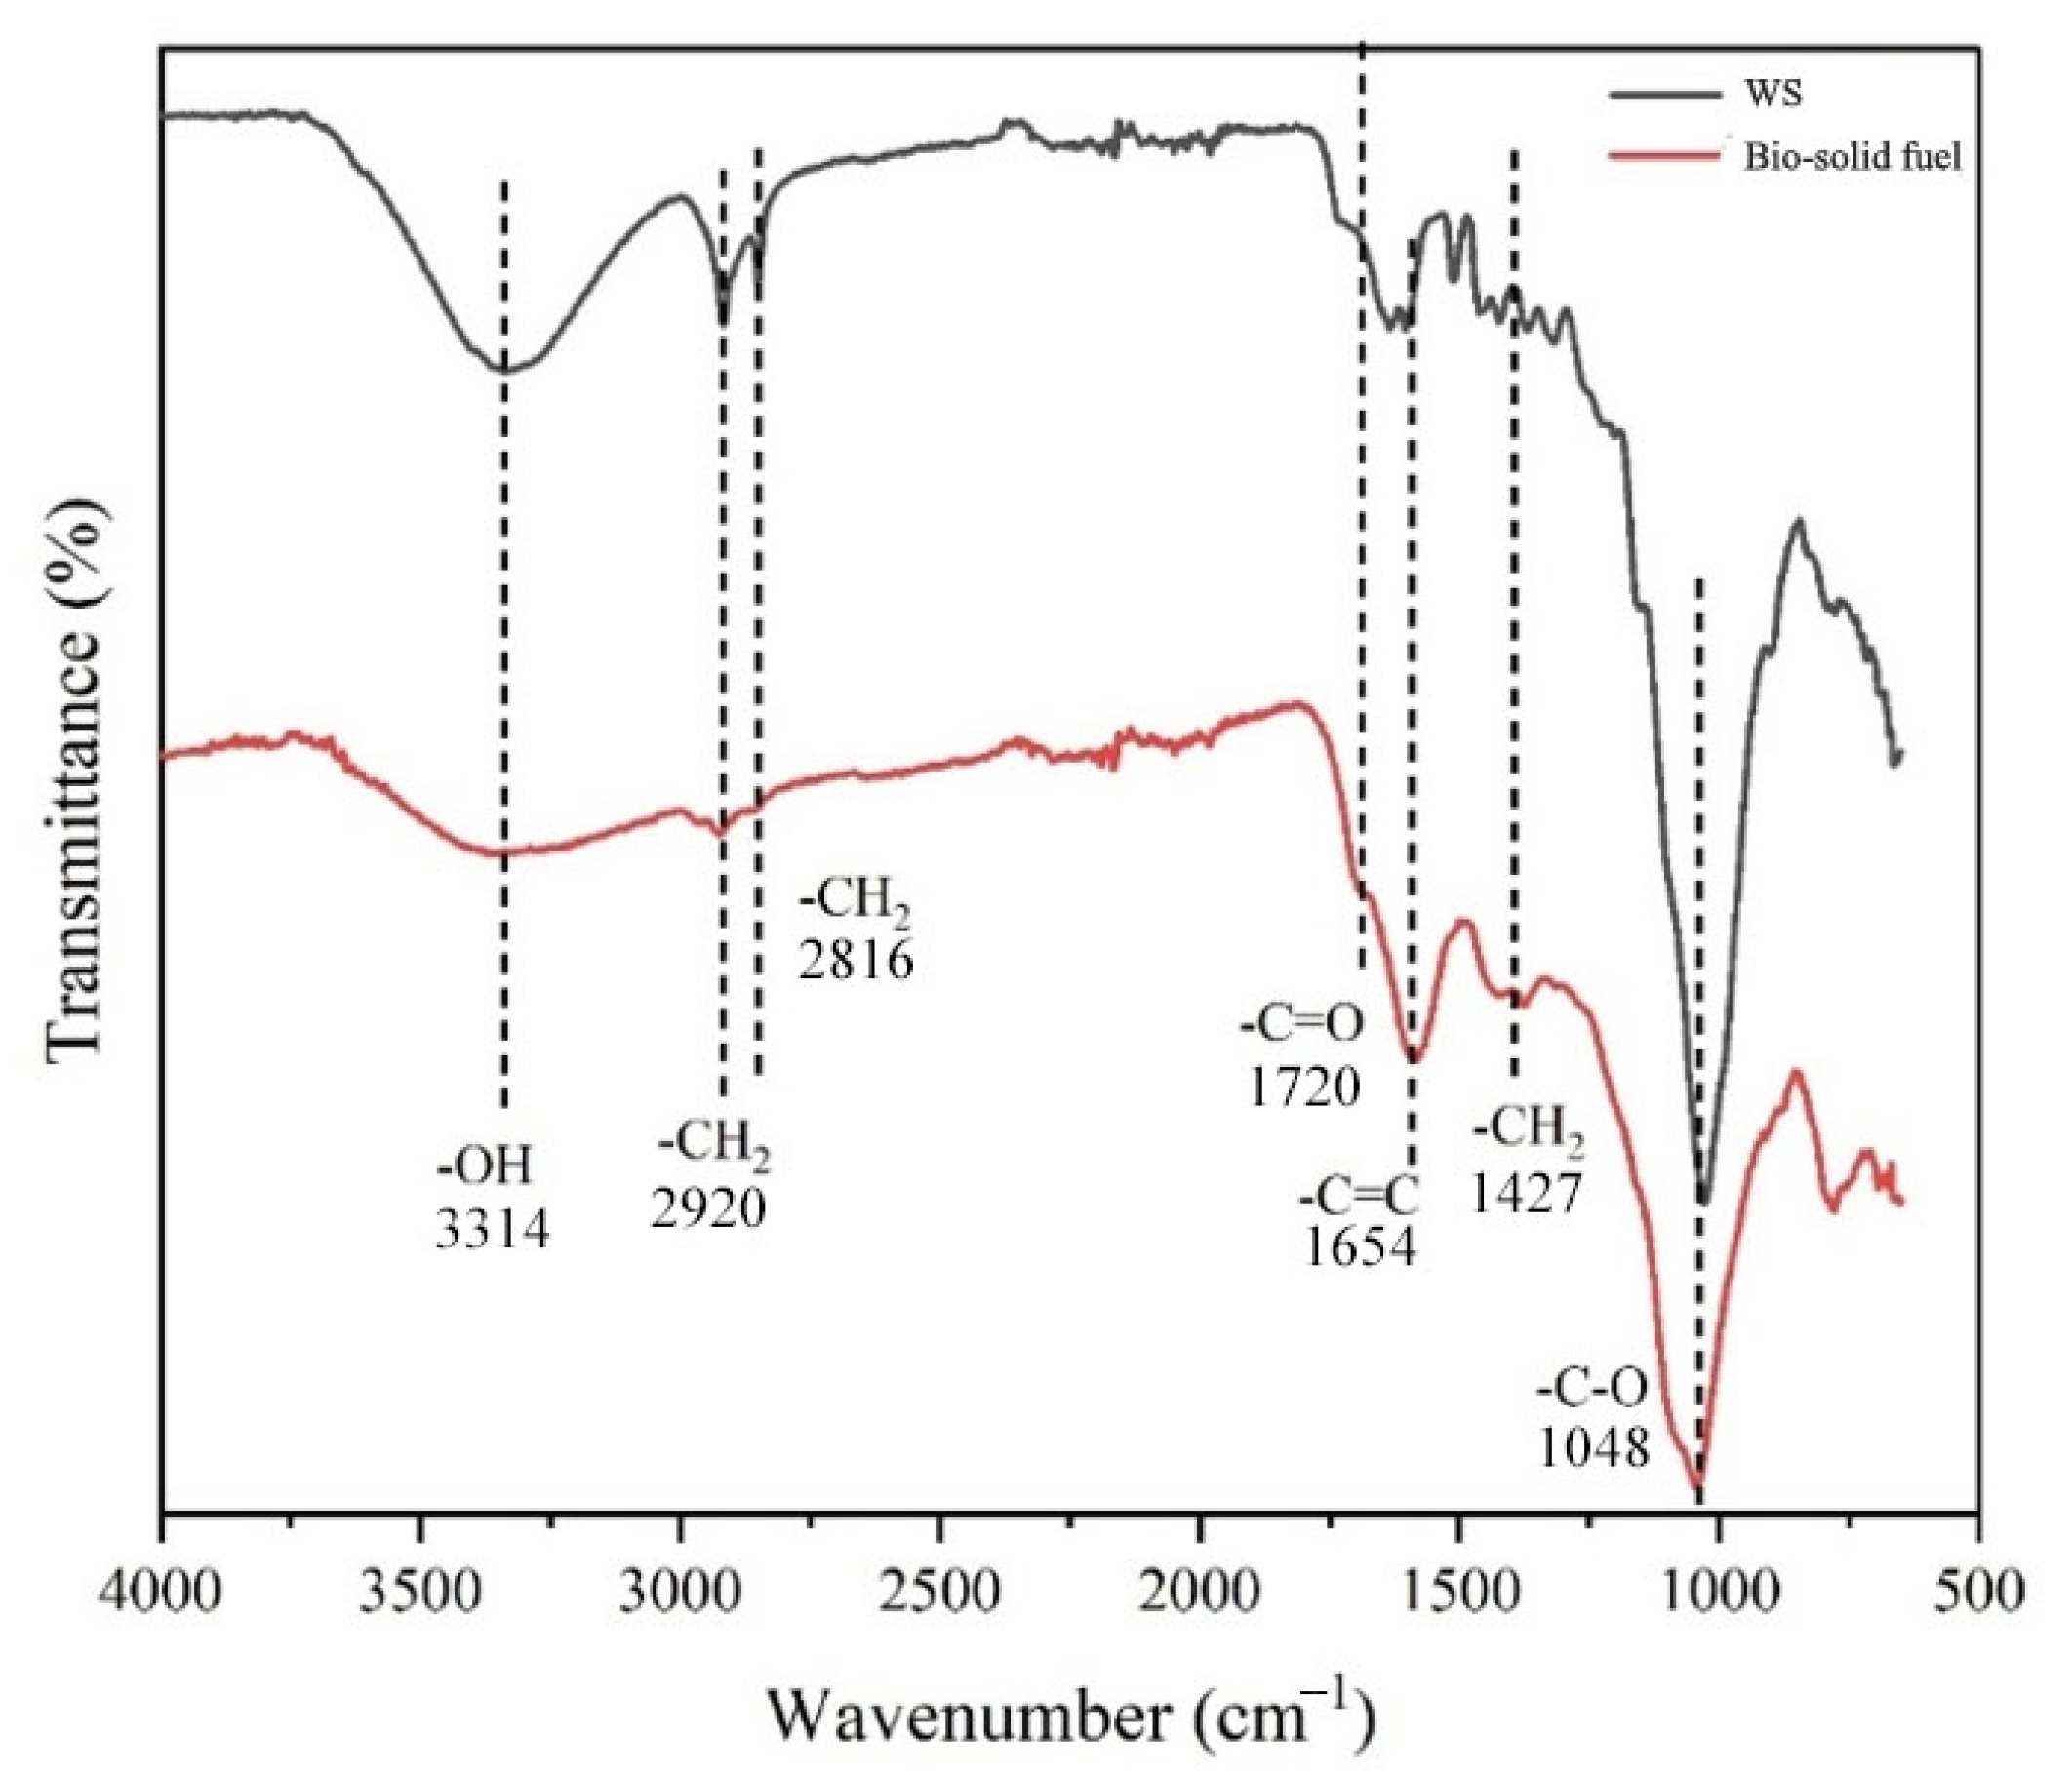
Figure 8 compares the FTIR spectra of bio-solid fuel and WS feedstock produced under optimal parameter conditions. As can be seen in Figure 8, most of the peaks of bio-solid fuel were classified into different wave number ranges, including C-H stretching, C=C stretching, C-H bending, and C-O bending. The broad peaks detected at 3000–3500 cm−1 for WS are attributed to O-H stretching, which indicates the presence of compounds with hydroxyl functional groups in WS. In contrast, the bio-solid fuel spectra have a flat curve in this region, indicating the loss of O-H bonds due to water evaporation during the charring process, suggesting an improvement in the hydrophobicity of the bio-solid fuel [49]. In the 2800–3000 cm−1 interval, the spectral peaks mainly originate from compounds with C-H stretching functional groups. Two sharp C-H stretching diffraction peaks were observed at 2915 cm−1 and 2851 cm−1, which correspond to the asymmetric and symmetric C-H stretching of alkane compounds in WS, respectively, indicating the presence of aldehydes, and the presence of aliphatic aldehydes compounds in the feedstock suggests that bio-solid fuel possesses a good fuel performance. However, the peak intensities of these functional groups are lower in the bio-solid fuel IR spectrum, possibly due to demethylation or conversion of methoxy to carbonaceous substances (e.g., CO and CO2) by breaking the ether bond, resulting in a more aromatic bio-solid fuel. The diffraction peak shown at 1683 cm−1 indicates the presence of carbonyl (-C=O) stretching compounds such as esters, ketones, acids, or anhydrides. This peak is attenuated in the bio-solid fuel spectrum. In addition, a high diffraction peak of -C-O-bending in the WS spectrum was detected at 1042 cm−1 and red-shifted compared to the feedstock, indicating the presence of hydrocarbons, esters, or ethers in large quantities within the WS. The absence of C=O stretching and the reduced intensity of the C-O bending peaks detected in the bio-solid fuel spectra may be due to the elimination of oxygenated compounds during the conversion of WS to bio-solid fuel by torrefaction. Bands in the 1586 cm−1 range are assignable to C=C-stretching compounds, signalling the presence of aromatic species, while bio-solid fuel spectra display stronger peak intensities relative to WS feedstock spectra—indicating a higher aromatic compound concentration in the bio-solid fuel than in the raw material. Therefore, WS is converted to bio-solid fuel with higher aromaticity and higher stability after the carbonisation process. This conversion can occur through a number of chemical reactions, such as dehydrogenation by release of H2 to form unsaturated compounds or dehydration by release of H2O to form olefins and aromatic compounds. A significant decrease in the bio-solid fuel diffraction peaks compared to the feedstock was observed in the 1000–1500 cm−1 region, corresponding to C-O, C-H, and C=C stretching vibrations, which indicates the decomposition of the hemicellulose, cellulose, and lignin components [15].
The FTIR spectra of the resulting bio-solid fuel showed that its oxidised compounds (alcohols, phenols, carboxylic acids, and ethers) were greatly reduced after the charring process, and the resulting bio-solid fuel mainly contained polycyclic structural components with high aromaticity and low oxygen content, and the bio-solid fuel had a better thermal stability, which is conducive to the application of bio-solid fuel to energy.

3.3.2. TG/DTG

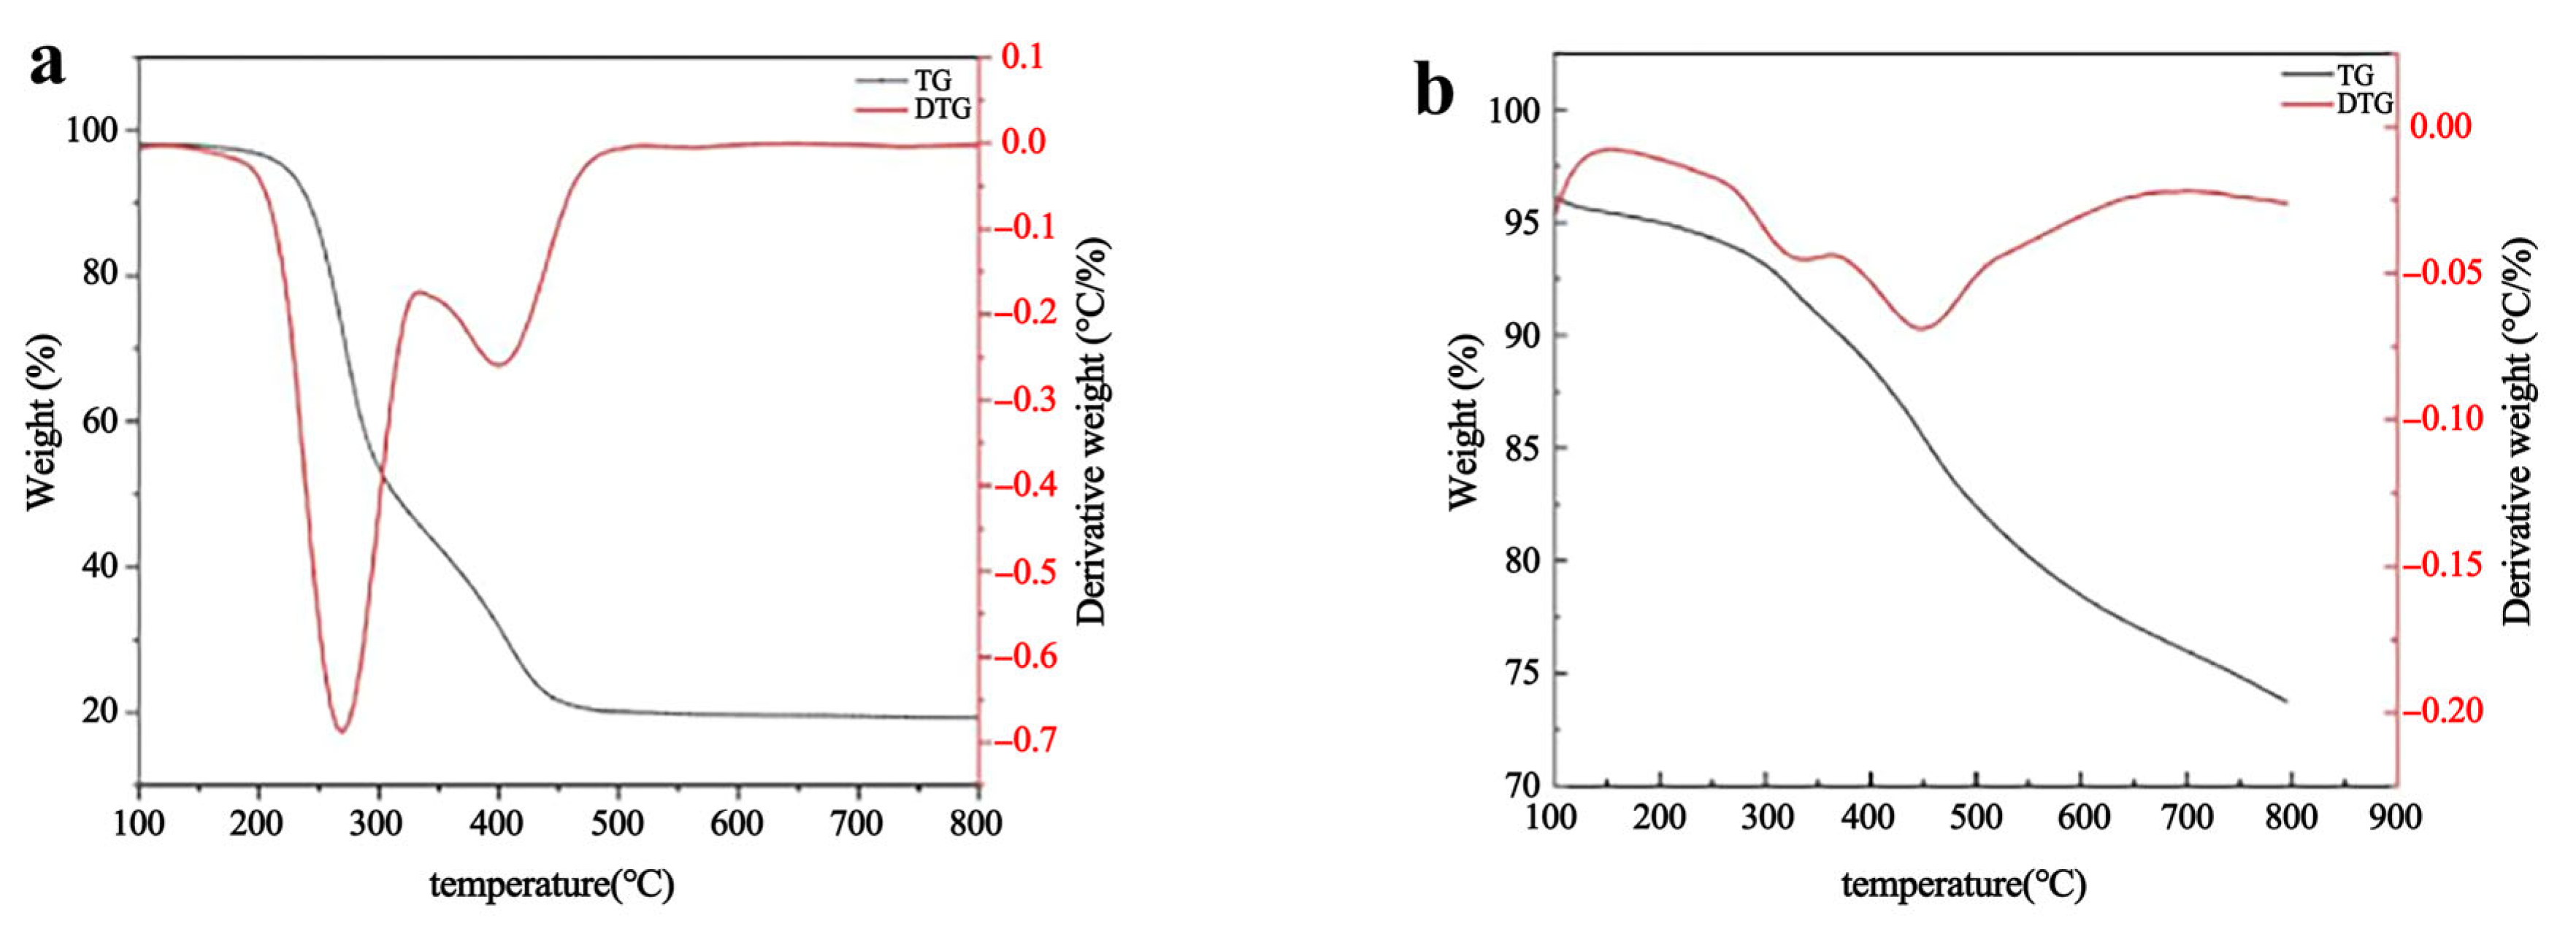
Figure 9 shows the TG and DTG curves of the WS (a) and bio-solid fuel prepared under optimal conditions (b). Thermogravimetric analysis (TG) and derivative thermogravimetric analysis (DTG) of WS were conducted under a nitrogen atmosphere at a heating rate of 10 °C/min, with a temperature range of 25 to 800 °C. This experimental framework is consistent with Chen et al. [50], aiming to characterize its thermal degradation behaviour. The TG curve of WS exhibits three distinct stages: dehydration, active devolatilization, and lignin carbonization, while the DTG curve reveals kinetic information by quantifying the mass loss rate. In the first stage (25–200 °C), a slight 3% mass loss occurs due to the evaporation of physically adsorbed water, analogous to the dehydration stage in microalgal pyrolysis where moisture removal precedes thermochemical reactions [50]. The second stage (200–500 °C) dominates with a 70% weight loss, characterized by a steep TG decline and DTG peaks at approximately 270 °C and 420 °C, consistent with the findings of Dissanayake et al. [51]. This stage is driven by the hierarchical decomposition of hemicellulose and cellulose. The amorphous structure of hemicellulose degrades first, releasing CO2 and organic acids, followed by cellulose decomposition into sugars and furan derivatives, as observed in studies on microalgae and rice straw. The third stage (500–800 °C) involves gradual lignin degradation and carbonization, accompanied by a broad DTG peak at 550 °C which is similar to the mineral residues in unwashed rice straw that affect combustion behaviour [51]. The TG and DTG curves of bio-solid fuel (b) indicate slower thermal degradation rates and a higher onset temperature of decomposition compared to the raw material. The peak thermogravimetric values occur between 300 and 500 °C, and at 500 °C, the mass fraction of the bio-solid fuel is 82%, which is 62% higher than that of WS, reflecting enhanced thermal stability and more controlled combustion behaviour. Enhanced thermal stability from torrefaction renders biomass better suited for uses demanding extended combustion durations and superior fuel quality—a key attribute for industrial applications, facilitating steady energy output, delayed decomposition, and reduced volatility during combustion.

3.4. Carbon Footprint and Economic Benefit Assessment

Microwave torrefaction development is crucial for sustainable benefits associated with energy substitution, CO2 mitigation, and the reduction of agricultural waste. Therefore, it is important to examine how torrefaction impacts carbon emission. This section focuses on quantifying the carbon footprint of microwave torrefaction WS distribution of the study object, identifying the environmental load contributions of high-emission stages, and providing scientific support for low-carbon technological optimization and sustainable development pathways. Economic benefit analysis is also evaluated.

3.4.1. Carbon Emissions Analysis

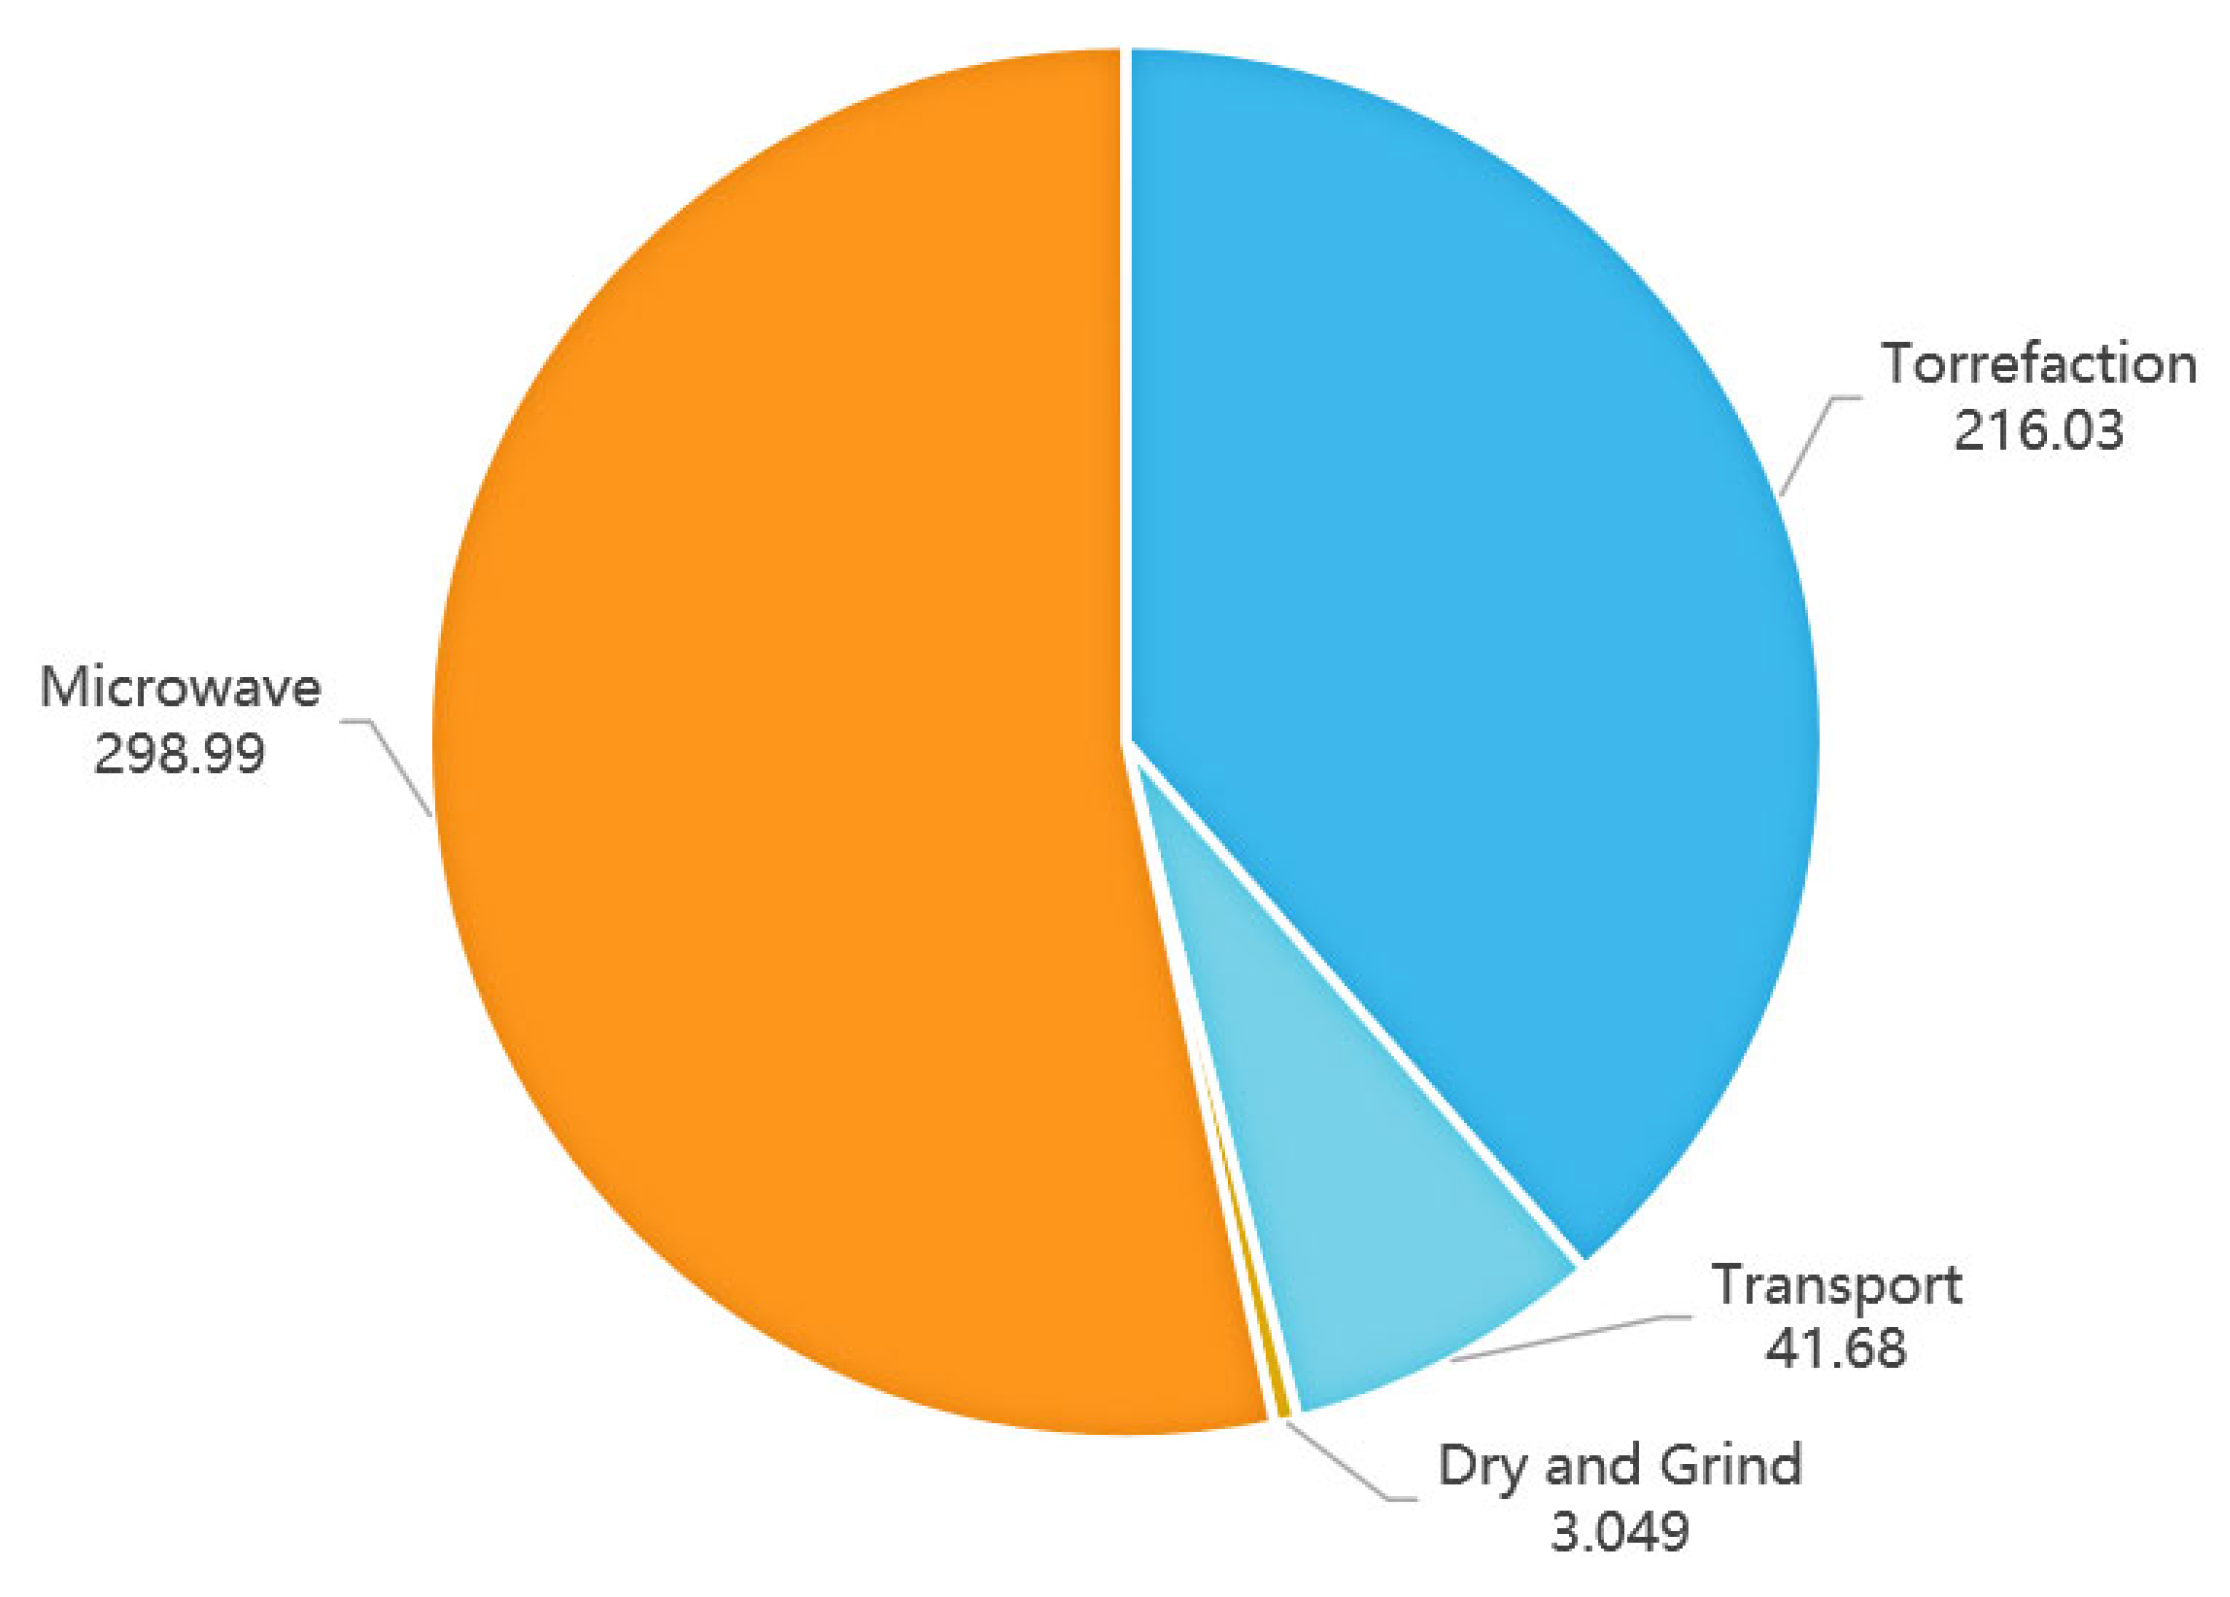
The carbon emissions breakdown of each unit process is illustrated in Figure 10. It is estimated that a total of 559.75 kg CO2eq is emitted per ton of WS processed. Excluding the transport stage, the carbon emissions related to the entire torrefaction process reach 518.07 kg CO2eq/t, accounting for 92.55% of the total carbon emissions. Notably, the generation of microwave dominates with 298.99 kg CO2eq (53.4% of the total), attributable to its intensive electricity consumption. Although transportation (41.68 kg CO2eq, 7.45%) and drying and grinding (3.05 kg CO2eq 0.54%) have relatively lower shares, their emission drivers warrant scrutiny: transportation emissions are sensitive to distance, cargo turnover, and fuel type, while preprocessing stages could leverage energy-efficient equipment.
Comparatively, the prominent microwave emission contrasts with conventional biomass torrefaction LCA results, which is consistent with the findings of Foong et al. [52], highlighting the uniqueness of microwave volumetric heating and the criticality of power decarbonization. For torrefaction, integrating bioenergy self-supply (utilizing process residues for heat) could drastically reduce its carbon footprint.

3.4.2. Carbon Emission Reduction and Economic Benefit Analysis

The economic benefit of this study is based on using 1000 kg WS as a benchmark. The analysis focuses on one scenario: the production of bio-solid fuel from WS at the optimal conditions as shown in Table 9. The analysis excludes costs associated with WS and microwave absorbers: WS, as an agricultural waste, incurs no additional raw material costs, while activated carbon—employed as the microwave absorber—is recyclable, making this cost negligible. The electricity cost is based on the 2022 grid electricity tariff standards in China, where industrial electricity is priced at 0.5 CNY/kW·h. Transportation costs consist of freight and gasoline expenses, with the freight rate set at 0.5 CNY/ton·km, gasoline cost at 6.5 CNY/kg, a truck fuel consumption rate of 0.223 kg/km, and a loading capacity of 10 tons—collectively constituting the transportation expenses for biomass feedstock. Thus, the total cost is estimated to be 878.72 CNY/ton.
Bio-solid fuels obtained via torrefaction of 1000 kg WS produce 1067.63 kW·h of energy along with 1064.43 kg CO2eq emissions. In comparison, a bituminous coal fired power plant produces 1323.69 kg CO2eq; the decreased CO2 emissions are 259.26 kg CO2eq. This result falls within the range of net negative GWP for lignocellulosic biomass reported in Cheng et al.’s study [53], and is 192.64 kg CO2eq higher than the emission reduction value of pigeon pea stalk biochar [54]. Based on China’s carbon trading market, the benchmark price for carbon emissions assessment is 37.76 CNY/ton CO2eq (approximately 0.04 CNY/kg CO2eq) for carbon emission assessment. After comprehensive calculation, taking into account the revenue from power generation, revenue from emission reduction, and total costs, torrefying 1 ton of WS into bio-solid fuel for power generation yields a net profit of CNY 435.19.
Notably, using bio-solid fuel as a complete substitute for bituminous coal in power generation may not be universally advisable, as the distinct combustion characteristics of bio-solid fuel could affect combustion efficiency and equipment performance in power plants.

4. Conclusions

This study evaluates the feasibility of wheat straw (WS) as a source of bio-solid fuel via microwave torrefaction. The statistical analysis via RSM allowed the development of reduced models (quadratic) for predicting key performance indicators, including mass yield, HHV, and EMCI. These models exhibit high statistical significance (p < 0.0001) with regression correlations (R2 > 0.98), underscoring the reliability of the findings in capturing the relationships between process parameters and fuel properties. Notably, ANOVA results further indicated that microwave power was identified as the most critical parameter in the torrefaction process of WS, while irradiation time played a secondary role in mass yield and HHV.
The results indicated that the torrefied bio-solid fuel exhibited a significant enhancement in HHV (an approximate 37% increase), coupled with an EMCI of 25.5%, confirming the potential of WS as a high-quality bio-solid fuel. Furthermore, estimating fossil fuel equivalence and quantifying CO2 emission reductions underscores the substantial environmental merits of torrefied WS: substituting bituminous coal with this bio-solid fuel yields a 38% reduction in CO2 emissions per unit power generation, with a lifecycle CO2 mitigation potential of 259.26 kg CO2eq per tonne of torrefied WS, further validating its feasibility as a sustainable fossil fuel alternative. Future work could focus on its industrial scaling-up and the combined optimization of RSM and artificial neural networks.

Author Contributions

Methodology, L.J.; Software, Y.P.; Validation, Z.L.; Formal analysis, X.C.; Investigation, X.W.; Resources, W.Z.; Data curation, W.L. All authors have read and agreed to the published version of the manuscript.

Funding

The authors acknowledge the support in grants from the education department of the National Natural Science Foundation of China (41907116), Jiangsu Graduate Practice Innovation Program (XSJCX24_89), and Jiangsu Graduate Practice Innovation Program (XSJCX25_109).

Data Availability Statement

The original contributions presented in this study are included in the article. Further inquiries can be directed to the corresponding author(s).

Conflicts of Interest

Author Weiyu Lu was employed by the company Jiangsu Jiangnan Water Co., Ltd. The remaining authors declare that the research was conducted in the absence of any commercial or financial relationships that could be construed as a potential conflict of interest.

References

  1. Mahadevia, D. Debolina Kundu, Remy Sietchiping and Michael Kinyanjui: Developing National Urban Policies: Ways Forward to Green and Smart Cities. Indian J. Labour Econ. 2022, 65, 571–573. [Google Scholar] [CrossRef]
  2. Allende Leiva, S. Microwave-Assisted Pyrolysis for Biomass Recovery and Applications. Ph.D. Thesis, James Cook University, Douglas, Australia, 2023. [Google Scholar]
  3. Ubando, A.; Rivera, D.R.; Chen, W.H.; Culaba, A.B. A comprehensive review of life cycle assessment (LCA) of microalgal and lignocellulosic bioenergy products from thermochemical processes. Bioresour. Technol. 2019, 291, 121837. [Google Scholar] [CrossRef] [PubMed]
  4. International Renewable Energy Agency. Global Energy Transformation: A Roadmap to 2050; International Renewable Energy Agency: Abu Dhabi, United Arab Emirates, 2019. [Google Scholar]
  5. National Bureau of Statistics. Available online: https://www.stats.gov.cn/ (accessed on 10 February 2025).
  6. Ubando, A.T.; Chen, W.H.; Tan, R.R.; Naqvi, S.R. Optimal integration of a biomass-based polygeneration system in an iron production plant for negative carbon emissions. Int. J. Energ. Res. 2020, 44, 9350–9366. [Google Scholar] [CrossRef]
  7. Fan, J.; Ding, W.; Xiang, J.; Qin, S.; Zhang, J.; Ziadi, N. Carbon sequestration in an intensively cultivated sandy loam soil in the North China Plain as affected by compost and inorganic fertilizer application. Geoderma 2014, 230–231, 22–28. [Google Scholar] [CrossRef]
  8. Liu, C.; Lu, M.; Cui, J.; Li, B.; Fang, C. Effects of straw carbon input on carbon dynamics in agricultural soils: A meta-analysis. Glob. Change Biol. 2014, 20, 1366–1381. [Google Scholar] [CrossRef]
  9. Available online: https://std.samr.gov.cn/ (accessed on 10 May 2024).
  10. Sikhom, C.; Attard, T.M.; Winotapun, W.; Supanchaiyamat, N.; Farmer, T.J.; Budarin, V.; Clark, J.H.; Hunt, A.J. Enhanced microwave assisted pyrolysis of waste rice straw through lipid extraction with supercritical carbon dioxide. RSC Adv. 2024, 14, 29–45. [Google Scholar] [CrossRef]
  11. Allende, S.; Brodie, G.; Jacob, M.V. Energy recovery from sugarcane bagasse under varying microwave-assisted pyrolysis conditions. Bioresour. Technol. Rep. 2022, 20, 101283. [Google Scholar] [CrossRef]
  12. Lanjekar, P.R.; Panwar, N.L.; Agrawal, C.; Gupta, T.; Meena, K.K.; Meena, G.L.; Meena, S.S. A review on environmental assessment of thermochemical conversion technologies for energy generation from crop residue. Earth Energy Sci. 2024; in press. [Google Scholar] [CrossRef]
  13. Li, Y.; Tan, Z.; Zhu, Y.; Zhang, W.; Du, Z.; Shao, J.; Jiang, L.; Yang, H.; Chen, H. Effects of P-based additives on agricultural biomass torrefaction and particulate matter emissions from fuel combustion. Renew. Energ. 2022, 190, 66–77. [Google Scholar] [CrossRef]
  14. Jagadale, M.; Gangil, S.; Jadhav, M. Enhancing fuel characteristics of jute sticks (Corchorus Sp.) using fixed bed torrefaction process. Renew. Energ. 2023, 215, 118992. [Google Scholar] [CrossRef]
  15. Manatura, K.; Samsalee, N.; Kaewtrakulchai, N.; Jadsadajerm, S.; Muangklang, E.; Jaruwongwittaya, T.; Huang, C.W. Optimization of torrefaction parameters for coconut shell using Taguchi method: Impact on torrefaction performances, combustion characteristics, and thermal stability. Therm. Sci. Eng. Prog. 2025, 57, 103137. [Google Scholar] [CrossRef]
  16. Manatura, K. Inert torrefaction of sugarcane bagasse to improve its fuel properties. Case Stud. Therm. Eng. 2020, 19, 100623. [Google Scholar] [CrossRef]
  17. Majamo, S.L.; Amibo, T.A. Modeling and optimization of chemical-treated torrefaction of wheat straw to improve energy density by response surface methodology. Biomass Convers. Biorefinery 2024, 14, 21213–21227. [Google Scholar] [CrossRef]
  18. He, Y.; Guo, S.; Li, S.; Yin, S. Green and efficient synthesis of high-purity Y zeolite using natural raw material-kaolin activated by microwave heating. Appl. Phys. A 2022, 128, 1077. [Google Scholar] [CrossRef]
  19. Teng, W.; Yu, Z.; Shen, G.; Ni, H.; Ma, X. Investigation of the characteristics of microwave-assisted co-pyrolysis of biomass and waste plastics based on orthogonal experimental methods: Thermal degradation, kinetics and product distribution. J. Anal. Appl. Pyrolysis 2025, 189, 107083. [Google Scholar] [CrossRef]
  20. Xu, D.; Lin, J.; Ma, R.; Sun, S. Microwave pyrolysis of food waste: Kinetics, bio-oil characteristics, and formation mechanisms of N-containing components based on DFT calculations. Fuel 2025, 384, 133954. [Google Scholar] [CrossRef]
  21. Zhou, R.; Tian, X.; Wang, X.; Zeng, Y.; Ke, L.; Wu, Q.; Liao, R.; Ruan, R.; Fan, L.; Wang, Y. Microwave pyrolysis of Choerospondias axillaris seeds with their derived biochar for comprehensive utilization of the biomass. Chem. Eng. J. 2024, 501, 157727. [Google Scholar] [CrossRef]
  22. Zeng, C.; Jiang, Z.; Zeng, Y.; Zhang, S.; Luque, R.; Yan, K. Microwave-assisted pyrolysis of biomass for efficient H2-rich syngas production promoted by calcium oxide. Chem. Eng. J. 2025, 506, 159905. [Google Scholar] [CrossRef]
  23. Tiwari, M.; Vinu, R. In situ and ex situ catalytic microwave pyrolysis of biomass pellets using Ni/Al2O3 for hydrogen and bio-oil production. J. Anal. Appl. Pyrolysis 2025, 189, 107044. [Google Scholar] [CrossRef]
  24. Chen, X.; Pei, Y.; Wang, X.; Zhou, W.; Jiang, L. Response Surface Methodology—Central Composite Design Optimization Sugarcane Bagasse Activated Carbon under Varying Microwave-Assisted Pyrolysis Conditions. Processes 2024, 12, 497. [Google Scholar] [CrossRef]
  25. Nazari, M.; Aguilar, M.M.; Ghislain, T.; Lavoie, J.M. Microwave-assisted pyrolysis of biomass waste for production of high-quality biochar: Corn stover and hemp stem case studies. Biomass Bioenergy 2024, 187, 107302. [Google Scholar] [CrossRef]
  26. Wang, S.; Li, Q.; Hu, K.; Wang, S.; Kong, X. A facile synthesis of bare biomass derived holey carbon absorbent for microwave absorption. Appl. Surf. Sci. 2020, 544, 148891. [Google Scholar] [CrossRef]
  27. Zhang, Y.; Huang, Y.; Zhang, T.; Chang, H.; Xiao, P.; Chen, H.; Huang, Z.; Chen, Y. Broadband and tunable high-performance microwave absorption of an ultralight and highly compressible graphene foam. Adv. Mater. 2015, 27, 2049–2053. [Google Scholar] [CrossRef] [PubMed]
  28. Qiu, T.; Li, C.; Zhao, W.; Naz, M.Y.; Zhang, Y. Microwave-assisted pyrolysis of biomass: Influence of feedstock and pyrolysis parameters on porous biochar properties. Biomass Bioenergy 2025, 193, 107583. [Google Scholar] [CrossRef]
  29. Petersen, H.I.; Deskur, H.; Rudra, A.; Ørberg, S.B.; Krause-Jensen, D.; Sanei, H. Pyrolysis of macroalgae: Insight into product yields and biochar morphology and stability. Int. J. Coal Geol. 2024, 286, 104498. [Google Scholar] [CrossRef]
  30. Hadi, A.; Ali, A.; Khathi, M.T. Desulfurization of Crude Oil by Laboratory Developed Multipumping Flow Injection Analysis System with Optimization by Response Surface Methodology. J. Ecol. Eng. 2023, 24, 328–339. [Google Scholar] [CrossRef]
  31. Li, H.; Liu, Y.; Guo, S.; Shi, M.; Qin, S.; Zeng, C. Extraction of Ursolic Acid from Apple Peel with Hydrophobic Deep Eutectic Solvents: Comparison Between Response Surface Methodology and Artificial Neural Networks. Foods 2023, 12, 310. [Google Scholar] [CrossRef]
  32. Available online: https://tb.alicdn.com/ (accessed on 6 May 2024).
  33. Friedl, A.; Padouvas, E.; Rotter, H.; Varmuza, K. Prediction of heating values of biomass fuel from elemental composition. Anal. Chim. Acta 2005, 544, 191–198. [Google Scholar] [CrossRef]
  34. Makepa, D.C.; Chihobo, C.H.; Manhongo, T.T.; Musademba, D. Life-cycle assessment of microwave-assisted pyrolysis of pine sawdust as an emerging technology for biodiesel production. Results Eng. 2023, 20, 101480. [Google Scholar] [CrossRef]
  35. Saad, D.M.; Terlouw, T.; Sacchi, R.; Bauer, C. Life Cycle Economic and Environmental Assessment of Producing Synthetic Jet Fuel Using CO2/Biomass Feedstocks. Environ. Sci. Technol. 2024, 58, 17. [Google Scholar] [CrossRef]
  36. Wang, Z.; Huang, W.; Wang, H.; Gao, J.; Zhang, R.; Xu, G.; Wang, Z. Research on the improvement of carbon neutrality by utilizing agricultural waste: Based on a life cycle assessment of biomass briquette fuel heating system. J. Clean. Prod. 2024, 434, 140365. [Google Scholar] [CrossRef]
  37. Zhou, S.; Lin, M.; Zhang, X.; Zhan, L.; Li, R.; Wu, Y. Study of life cycle assessment: Transforming microalgae to biofuel through hydrothermal liquefaction and upgrading in organic or aqueous medium. J. Clean. Prod. 2024, 444, 140942. [Google Scholar] [CrossRef]
  38. Liu, R. Process Chemistry, Mechanisms, and Environmental Benefits for the Pyrolysis of Waste Biomass. Ph.D. Thesis, University of Science and Technology of China, Hefei, China, 2022. [Google Scholar]
  39. Gong, X. Analysis of Economic and Environmental Benefits of Rice Straw Pyrolysis Based on LCA: A Case Study of 11 Cities in Jiangxi Province. Master’s Thesis, Jiangxi University of Finance and Economics, Nanchang, China, 2021. [Google Scholar]
  40. Roberts, K.G.; Gloy, B.A.; Joseph, S.; Scott, N.R.; Lehmann, J. Life Cycle Assessment of Biochar Systems: Estimating the Energetic, Economic, and Climate Change Potential. Environ. Sci. Technol. 2010, 44, 827–833. [Google Scholar] [CrossRef] [PubMed]
  41. Available online: http://www.sgcc.com.cn/ (accessed on 20 January 2025).
  42. Ghesti, G.F.; Silveira, E.A.; Guimarães, M.G.; Evaristo, R.B.W.; Costa, M. Towards a sustainable waste-to-energy pathway to pequi biomass residues: Biochar, syngas, and biodiesel analysis. Waste Manag. 2022, 143, 144–156. [Google Scholar] [CrossRef] [PubMed]
  43. Fang, X.; Jia, L. Experimental study on ash fusion characteristics of biomass. Bioresour. Technol. 2012, 104, 769–774. [Google Scholar] [CrossRef]
  44. Beyan, S.M.; Prabhu, S.V.; Sissay, T.T.; Getahun, A. Sugarcane bagasse based activated carbon preparation and its adsorption efficacy on removal of BOD and COD from textile effluents: RSM based modeling, optimization and kinetic aspects. Bioresour. Technol. Rep. 2021, 14, 100664. [Google Scholar] [CrossRef]
  45. Kumari, M.; Gupta, S.K. Response surface methodological (RSM) approach for optimizing the removal of trihalomethanes (THMs) and its precursor’s by surfactant modified magnetic nanoadsorbents (sMNP)—An endeavor to diminish probable cancer risk. Sci. Rep. 2019, 9, 18339. [Google Scholar] [CrossRef]
  46. Sun, H.; Feng, D.; Sun, S.; Zhao, Y.; Qin, Y. Thermal evolution of gas-liquid-solid products and migration regulation of C/H/O elements during biomass pyrolysis. J. Anal. Appl. Pyrolysis 2021, 156, 105128. [Google Scholar] [CrossRef]
  47. Torres Ramos, R.; Valdez Salas, B.; Montero Alpírez, G.; Coronado Ortega, M.A.; Curiel Álvarez, M.A.; Tzintzun Camacho, O.; Beleño Cabarcas, M.T. Torrefaction under Different Reaction Atmospheres to Improve the Fuel Properties of Wheat Straw. Processes 2023, 11, 1971. [Google Scholar] [CrossRef]
  48. Azócar, L.; Hermosilla, N.; Gay, A.; Rocha, S.; Díaz, J.; Jara, P. Brown pellet production using wheat straw from southern cities in Chile. Fuel 2019, 237, 823–832. [Google Scholar] [CrossRef]
  49. Sarker, T.R.; Azargohar, R.; Dalai, A.K.; Meda, V. Enhancement of fuel and physicochemical properties of canola residues via microwave torrefaction. Energy Rep. 2021, 7, 6338–6353. [Google Scholar] [CrossRef]
  50. Chen, W.; Arpia, A.A.; Chang, J.; Kwon, E.E.; Park, Y.; Culaba, A.B. Catalytic microwave torrefaction of microalga Chlorella vulgaris FSP-E with magnesium oxide optimized via taguchi approach: A thermo-energetic analysis. Chemosphere 2022, 290, 133374. [Google Scholar] [CrossRef] [PubMed]
  51. Dissanayake, C.L.W.; Thushara, D.; Gunarathne, D.S. Optimization of combined washing and torrefaction pretreatment for improving fuel properties and combustion performance of rice straw. Biomass Bioenergy 2025, 199, 107937. [Google Scholar] [CrossRef]
  52. Foong, S.Y.; Chan, Y.H.; Yek, P.N.Y.; Lock, S.S.M.; Chin, B.L.F.; Yiin, C.L.; Lan, C.W.; Lam, S.S. Microwave-assisted pyrolysis in biomass and waste valorisation: Insights into the life-cycle assessment (LCA) and techno-economic analysis (TEA). Chem. Eng. J. 2024, 491, 18. [Google Scholar] [CrossRef]
  53. Cheng, F.; Luo, H.; Colosi, L.M. Slow pyrolysis as a platform for negative emissions technology: An integration of machine learning models, life cycle assessment, and economic analysis. Energ. Convers. Manag. 2020, 223, 113258. [Google Scholar] [CrossRef]
  54. Venkatesh, G.; Gopinath, K.A.; Reddy, K.S.; Reddy, B.S.; Prabhakar, M.; Srinivasarao, C.; Visha Kumari, V.; Singh, V.K. Characterization of Biochar Derived from Crop Residues for Soil Amendment, Carbon Sequestration and Energy Use. Sustainability 2022, 14, 2295. [Google Scholar] [CrossRef]
Figure 1. Bio-solid fuel preparation process.
Processes 13 03302 g001
Figure 2. LCA boundary for biomass torrefaction.
Processes 13 03302 g002
Figure 3. Residual distribution of mass yield (a), HHV (b), and EMCI (c).
Processes 13 03302 g003
Figure 4. Three-dimensional surface response of mass yield with design factors of (a) irradiation time vs. microwave power, (b) irradiation time vs. absorber addition dose, and (c) microwave power vs. absorber addition dose.
Processes 13 03302 g004
Figure 5. Three-dimensional surface response of the HHV of bio-solid fuel with design factors of (a) irradiation time vs. microwave power, (b) irradiation time vs. absorber addition dose, and (c) microwave power vs. absorber addition dose.
Processes 13 03302 g005
Figure 6. Three-dimensional surface response of bio-solid fuel EMCI with design factors of (a) time at irradiation vs. microwave power, (b) irradiation time vs. absorber addition dose, and (c) microwave power vs. absorber addition dose.
Processes 13 03302 g006
Figure 7. Optimized process slope shape for bio-solid fuel.
Processes 13 03302 g007
Figure 8. FTIR of WS and bio-solid fuel prepared under optimal conditions.
Processes 13 03302 g008
Figure 9. TG and DTG curves of WS (a) and bio-solid fuel prepared under optimal conditions (b).
Processes 13 03302 g009
Figure 10. Carbon emissions breakdown of every unit processes.
Processes 13 03302 g010
Table 1. Ultimate analysis and proximate analysis of WS.
Ultimate Analysis (wt/%)Proximate Analysis (wt/%)HHV (MJ/kg)O/CH/C
C43.73 ± 0.2Moisture content6.21 ± 0.113.46 ± 0.120.832.02
H7.36 ± 0.04Ash content7.20 ± 0.2
N0.51 ± 0.05Volatile matter73.84 ± 0.03
O 148.4 ± 0.3Fixed carbon content12.75 ± 0.2
1 O = 100 − C − H − N.
Table 2. Coding and levels of independent variables for bio-solid fuel optimization.
ElementUnitCodeVariable Level
−101
Microwave powerWA300400500
Irradiation timeminB102030
Absorber addition dosegC3915
Table 3. Life cycle inventory.
Process StageInputsUnitOutputsUnit
TransportationGasolineL/kmCO2kgCO2eq
Pre-treatmentElectricitykWhCO2kgCO2eq
TorrefactionElectricity 1kWhBio-solid fuel
CO2
kg
kgCO2eq
Power generationElectricitykWhElectrical energyMJ
CO2kgCO2eq
1 The electrical input of the torrefaction process consists of the energy consumption generated by the microwave generator and the direct energy consumption from the torrefaction process itself.
Table 4. Experimental results of bio-solid fuel.
Run NoABCY1 (%)Y2 (MJ/kg)Y3 (%)
minWg
120400968.1717.2319.124
2205001547.4318.2716.939
310300989.8713.450.0180
420400963.7717.2017.729
5203001577.7314.737.305
620400965.3517.2518.328
7104001575.2716.5417.246
830500935.9318.0112.146
9304001566.1717.3819.291
1020500351.6317.3414.883
1130400365.2316.7916.133
1220400966.2317.1718.265
1310400380.7414.908.608
1430300972.1515.3910.329
1510500955.4717.5917.037
1620300384.9013.771.9360
1720400968.9117.3719.997
Table 5. ANOVA for mass yield.
SourceSum of SquaresdfMean SquareF-Valuep-Value
Model2930.619325.6245.89<0.0001Significant
A-irradiation time477.871477.8767.34<0.0001
B-microwave power2250.8712250.87317.21<0.0001
C-absorber addition dose31.44131.444.430.0733
AB0.828110.82810.11670.7427
AC10.14110.141.430.2708
BC2.2112.210.31080.5946
A211.44111.441.610.2447
B295.86195.8613.510.0079
C258.14158.148.190.0243
Residual49.6777.10
Lack of fit32.26310.752.470.2014Not significant
Table 6. ANOVA for HHV.
SourceSum of SquaresdfMean SquareF-Valuep-Value
Model34.6393.85376.47<0.0001Significant
A-irradiation time3.2313.23316.27<0.0001
B-microwave power24.08124.082356.61<0.0001
C-absorber addition dose2.1312.13208.35<0.0001
AB0.577110.577156.460.0001
AC0.278010.278027.200.0012
BC0.000310.00030.02480.8794
A20.602010.602058.900.0001
B22.4112.41235.89<0.0001
C20.907910.907988.84<0.0001
Residual0.071570.0102
Lack of fit0.049630.01653.000.1578Not significant
Table 7. ANOVA for EMCI.
SourceSum of SquaresdfMean SquareF-Valuep-Value
Model596.74966.3049.24<0.0001Significant
A-irradiation time28.09128.0920.860.0026
B-microwave power214.401214.40159.21<0.0001
C-absorber addition dose46.18146.1834.290.0006
AB57.78157.7842.900.0003
AC7.5117.515.580.0502
BC2.7412.742.040.1965
A214.82114.8211.010.0128
B2202.201202.20150.15<0.0001
C29.3819.386.970.0334
Residual9.4371.35
Lack of fit6.2932.103.000.1578Not significant
Table 8. Fitting accuracy of bio-solid fuel.
ModelR2R2adjR2predC.V. (%)
Mass yield0.98330.96190.81773.990
HHV0.99790.99530.97620.613
EMCI0.98440.96450.82588.380
Table 9. Comparison of experimental and model predicted values of bio-solid fuel performance.
ElementMass Yield (%)HHV (MJ/kg)EMCI (%)
ABCExperimental ValuePredicted ValueExperimental ValuePredicted ValueExperimental ValuePredicted Value
422.3214.9515.0069.1269.7618.4417.4025.5019.89
Error(%)1.165.9822.00
Table 10. Mass yield and HHV under optimal conditions in other literature.
BiomassTorrefaction ConditionsMass Yield (%)HHV (MJ/kg)Ref.
WS422.32 W
14.95 min
15 g
69.1218.44This work
287 °C
20 min
6% O2
60.1518.84[47]
300 °C
30 min
N2
46.7618.58[48]
299.99 °C,
31.89 min
0.75 g/L
0.20 mm
60.1525.05[17]
Disclaimer/Publisher’s Note: The statements, opinions and data contained in all publications are solely those of the individual author(s) and contributor(s) and not of MDPI and/or the editor(s). MDPI and/or the editor(s) disclaim responsibility for any injury to people or property resulting from any ideas, methods, instructions or products referred to in the content.