Abstract
Carbon dioxide (CO2) has been widely applied in gas flooding for reservoir development due to its remarkable oil recovery potential. However, because its viscosity is lower than that of water and most crude oils, severe channeling often occurs during the flooding process, resulting in a significant reduction in the sweep efficiency. To address this issue, foam flooding has attracted considerable attention as an effective method for controlling CO2 mobility. In this study, a compound foam system was developed with alpha-olefin sulfonate (AOS) as the primary foaming agent, alcohol ethoxylate (AEO) and cetyltrimethylammonium bromide (CTAB) as co-surfactants, and partially hydrolyzed polyacrylamide (HPAM) as the stabilizer. The optimal system was screened through evaluations of comprehensive foam index, salt tolerance, oil resistance, and shear resistance. Results indicate that the AOS+AEO formulation exhibits superior foaming ability, salt tolerance, and foam stability compared with the AOS+CTAB system, with the best performance achieved at a mass ratio of 2:1 (AOS:AEO), balancing both adaptability and economic feasibility. A heterogeneous reservoir model was constructed using parallel core flooding to investigate the displacement performance and blocking capability of the system. Nuclear magnetic resonance (NMR) imaging was employed to monitor in situ oil phase migration and clarify the recovery mechanisms. Experimental results show that the compound foam system demonstrates excellent conformance control performance, achieving a blocking efficiency of 84.5% and improving the overall oil recovery by 4.6%. NMR imaging further reveals that the system effectively mobilizes low-permeability zones, with T2 spectrum analysis indicating a 4.5% incremental recovery in low-permeability layers. Moreover, in reservoirs with larger permeability ratio, the system exhibits enhanced blocking efficiency (up to 86.5%), though the incremental recovery is not strictly proportional to the blocking effect. Compared with previous AOS-based CO2 foam studies that primarily relied on pressure drop and effluent analyses, this work introduces NMR imaging and T2 spectrum diagnostics to directly visualize pore-scale fluid redistribution and quantify sweep efficiency within heterogeneous cores. The NMR data provide mechanistic evidence that the enhanced recovery originates from selective foam propagation and the mobilization of residual oil in low-permeability channels, rather than merely from increased flow resistance. This integration of advanced pore-scale imaging with macroscopic displacement analysis represents a mechanistic advancement over conventional CO2 foam evaluations, offering new insights into the conformance control behavior of AOS-based foam systems in heterogeneous reservoirs.
1. Introduction
Carbon dioxide (CO2) has been widely applied in gas flooding for reservoir development due to its broad availability and excellent oil recovery performance [1,2]. Under reservoir temperature and pressure conditions, CO2 can dissolve significantly in crude oil, reducing oil viscosity, causing oil swelling, and thereby improving its mobility. Under certain conditions, CO2 can also achieve miscibility with some crude oil components, leading to efficient displacement [3,4,5,6]. However, the viscosity of CO2 is lower than that of both water and most crude oils, resulting in unfavorable mobility ratios during flooding. This often leads to premature breakthrough and severe channeling, leaving large portions of the reservoir oil uncontacted [7,8].
To mitigate CO2 channeling, extensive research has been conducted over the past decades. Strategies such as the use of CO2 thickeners and water-alternating-gas (WAG) injection have been proposed. Among these, foam flooding has been recognized as a particularly promising technology due to its excellent CO2 mobility control capability, effectively suppressing channeling and improving the sweep efficiency of CO2 flooding [9,10,11].
The concept of foam flooding was first proposed by Bond and Holbrook in 1958, who also filed a patent. Later, Fred conducted extensive laboratory experiments to validate its feasibility [12]. Building on this foundation, Bernard and Holm (1967) introduced the idea of CO2 foam flooding using CO2-soluble surfactants, and carried out pioneering core-flooding experiments to investigate the underlying mechanisms, laying the groundwork for subsequent systematic studies [13]. The primary role of surfactants is to reduce interfacial tension between immiscible phases. Based on ionic characteristics, surfactants are generally categorized as anionic, cationic, or nonionic [14]. Anionic surfactants, such as alpha-olefin sulfonate (AOS), are widely employed in CO2 foam flooding due to their strong foaming and foam-stabilizing capabilities, good thermal stability, and suitability for sandstone reservoirs with medium-to-low salinity. Cationic surfactants, represented by cetyltrimethylammonium bromide (CTAB), generate stable foam films and perform well in carbonate reservoirs, though their high adsorption in sandstone formations often results in large consumption and elevated costs. Nonionic surfactants, such as alcohol ethoxylates (AEO), exhibit outstanding salt and thermal resistance, making them suitable for high-salinity, high-temperature reservoirs. They are commonly blended with anionic surfactants as stabilizers or co-surfactants to improve overall foam stability [15,16,17,18,19,20].
For CO2 foam flooding, foam volume and half-life are critical performance indicators. Madiyar et al. reported that increasing surfactant concentration improves foam volume and half-life, but only up to an optimum concentration, beyond which improvements become marginal [15]. Jawad et al. found that different salt types significantly affect foam performance, with foam half-life decreasing noticeably under high salinity [21]. Ahmed et al. demonstrated that CO2 foam in porous media exhibits shear-thinning rheology, with viscosity dropping sharply as shear rate increases [22]. Furthermore, factors such as injection rate and gas–liquid ratio also strongly influence the effectiveness of foam flooding. In practice, single-surfactant systems face limitations: they often fail to simultaneously ensure foaming ability and stability, and exhibit insufficient resistance to high temperature or salinity. For instance, anionic surfactants may precipitate and lose effectiveness under high-salinity conditions. To overcome these limitations, compound surfactant systems—formulated by blending surfactants of the same or different types—are commonly employed. Through synergistic effects, such systems significantly enhance foam stability under harsh reservoir conditions, while mitigating challenges such as high salinity, strong adsorption, and the presence of crude oil [23,24,25,26,27].
The objective of this work is to develop a CO2-based compound foam system with strong resistance to crude oil, salinity, and shear, and to evaluate its oil recovery performance and conformance control efficiency using parallel-core flooding experiments combined with nuclear magnetic resonance (NMR) analysis. The study demonstrates that a formulation consisting of 0.6 wt% AOS as the primary agent, 0.3 wt% AEO as the co-surfactant, and 0.05 wt% HPAM as the stabilizer exhibits excellent oil, salt, and shear resistance. Moreover, this system provides effective blocking and enhanced oil recovery in heterogeneous reservoirs with permeability ratio, highlighting its promising potential for field applications.
2. Experimental Materials and Devices
The experimental cores were collected from the Huang 219 block, located in the western part of the mid-slope area of northern Shaanxi. The reservoir lithology is dominated by fine sandstone and medium–fine sandstone, with a low content of CO2-sensitive minerals. Parallel-bedded cylindrical core plugs with a diameter of 25.0 mm were drilled using a standard coring bit. The cores were then subjected to Soxhlet extraction for oil removal, followed by drying at 105 °C for 48 h. Under a confining pressure of 10 MPa and a pore pressure of 8 MPa, porosity and permeability were measured using a helium porosimeter and a pulse-decay permeameter, respectively. This paper selected three different kinds of cores, totaling eight cores (three cores from fang67-132 with permeability of 0.212 mD, 0.219 mD, and 0.205 mD, respectively; one core from huang142 with permeability of 0.114 mD; and four cores from huang219 with permeability of 1.131 mD, 1.111 mD, 1.122 mD, and 1.115 mD, respectively), as summarized in Table 1. In the flooding experiment, the group with a permeability ratio of 5 in the pure CO2 flooding experiment used cores with a permeability of 0.212 mD from fang67-132 and 1.131 mD from huang219. The group with a permeability ratio of 5 in the single AOS foam flooding experiment used cores with a permeability of 0.219 mD from fang67-132 and 1.111 mD from huang219. The group with a permeability ratio of 5 in the compound system foam flooding experiment used cores with a permeability of 0.205 mD from fang67-132 and 1.122 mD from huang219. The group with a permeability ratio of 10 in the compound system foam flooding experiment used cores with a permeability of 0.114 mD from huang142 and 1.115 mD from huang219.

Table 1.
Physical property parameters of experimental core samples.
2.1. Experimental Oil
The crude oil used in the experiments was obtained from the target reservoir in the study area. The surface oil properties are as follows: density of 0.8426 g/cm3, viscosity of 5.96 mPa·s, low sulfur and asphaltene content, pour point of 20.5 °C, and initial boiling point of 63.5 °C. The reservoir crude oil exhibits a saturation pressure of 7.03 MPa, viscosity of 2.250 mPa·s, original gas–oil ratio of 80.8 m3/t, formation volume factor of 1.25, density of 0.7677 g/cm3, and associated natural gas relative density of 1.083.
2.2. Formation Water
The formation water in the reservoir has a total salinity of 29,180 mg/L, with a CaCl2-type composition and a pH value of 6.25. The detailed ionic composition of the formation water is presented in Table 2.
Table 2.
Composition of formation water.
In the experiments, synthetic brines with salinities of 30,000 mg/L and 50,000 mg/L were prepared using the reservoir formation water and deionized water.
2.3. Surfactant
In this study, sodium alpha-olefin sulfonate (AOS) powder (produced by Linyi Yongtai Chemical, Linyi, China, Figure 1a) was employed as the primary foaming agent in the compound system. Alcohol ethoxylate-9 (AEO-9, fatty alcohol polyoxyethylene ether (9), Figure 1b) and cetyltrimethylammonium bromide (CTAB, Figure 1c), also supplied by Linyi Yongtai Chemical, Linyi, China, were used as secondary foaming agents. These three surfactants represent anionic, nonionic, and cationic types, respectively. In addition, partially hydrolyzed polyacrylamide (HPAM, produced by Linyi Yongtai Chemical, Linyi, China, Figure 1d) was applied as a foam stabilizer.
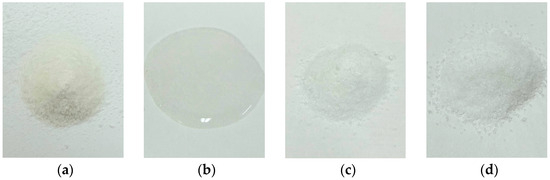
Figure 1.
Surfactant reagent samples, (a) AOS, (b) AEO, (c) CTAB, (d) HPAM.
For the optimization of the primary surfactant concentration and the screening of the compound system, surfactant solutions were prepared using deionized water. In subsequent dual-core flooding experiments; however, surfactant solutions were prepared with heavy water to avoid interference with the oil signal during nuclear magnetic resonance (NMR) measurements.
2.4. Foam Evaluation Apparatus
The high-temperature and high-pressure foam stability tester, as shown in Figure 2, was manufactured by Hai’an Petroleum Scientific Instrument Co., Ltd, Haian, China. (Model SY-PMZZ-2). Its main functions include: (1) real-time microscopic observation of foam quality; (2) measurement of foam quality and density via the sampling device; and (3) evaluation of the performance of different foaming agents. The instrument operates under a maximum working pressure of 30 MPa and a maximum working temperature of 300 °C.
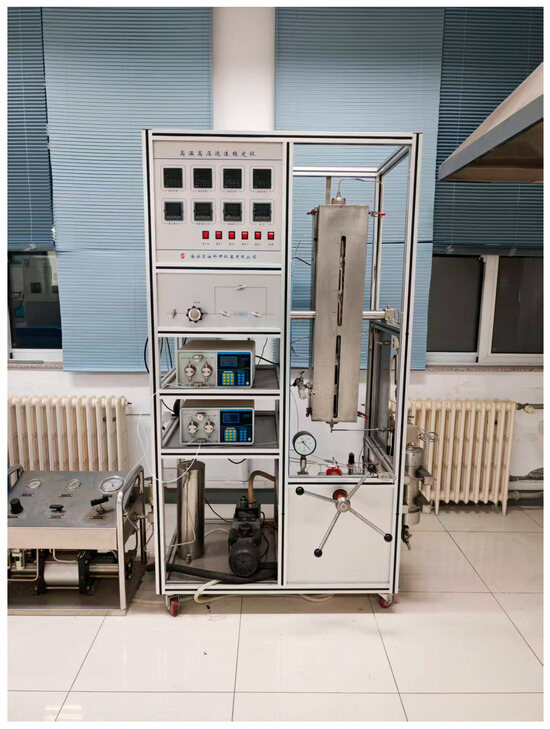
Figure 2.
High-temperature and high-pressure foam stability tester.
As shown in Figure 3, the high-temperature and high-pressure rheometer (Model Fann 50SL), manufactured by Fann Instrument Company (Houston, TX, USA), is primarily used to determine the viscosity, shear stress, and other parameters of drilling fluids under high-temperature and high-pressure conditions at various shear rates. The operating pressure is ≤30 MPa, and the operating temperature is ≤260 °C.
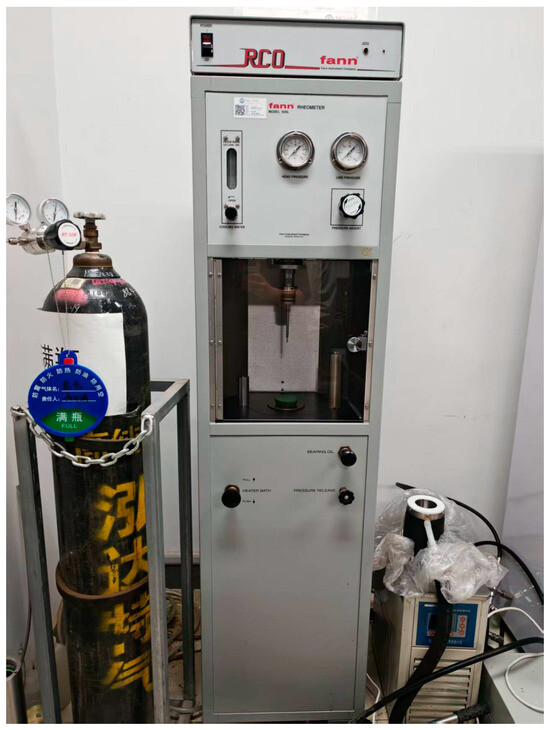
Figure 3.
High-temperature and high-pressure rheometer.
2.5. Parallel-Core Displacement Apparatus
In this study, a parallel-core displacement apparatus, as shown in Figure 4, was employed. The apparatus consists of injection, displacement, and production systems. The injection system utilizes two high-precision plunger pumps to independently control the injection flow rates of CO2 and surfactant solution. The intermediate containers are filled with surfactant solution and CO2, respectively, which are connected through a sand-packed tube foam generator to the parallel-core holders. The displacement system is composed of two core holders, where confining pressure is applied via a hand-operated pump to simulate overburden pressure. In the production system, a back-pressure valve is used to simulate bottomhole pressure, while graduated cylinders and a gas meter are employed for real-time measurement of oil and gas production. Two pressure transducers are installed at both the inlet and outlet of the core holders, and the recorded pressures are subsequently used to calculate foam blocking efficiency.
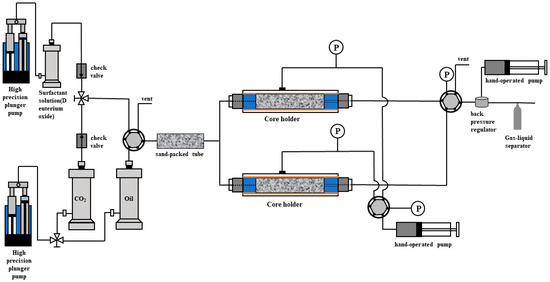
Figure 4.
Parallel-core flooding apparatus.
2.6. Nuclear Magnetic Resonance (NMR) Technology
The experiment employed a medium-sized nuclear magnetic resonance imaging analyzer (MesoMR23-060H-I) manufactured by Niumag Corporation, Suzhou, China. The GR-HSE and CPMG sequences were utilized to obtain the axial 1D frequency encoding and T2 spectra of the cores, respectively. The testing parameters are listed in Table 3.
Table 3.
Key parameters of the nuclear magnetic resonance monitoring instrument.
3. Experimental Methods and Procedural Steps
In this study, a highly efficient CO2-soluble compound foam system was selected based on performance tests of salt tolerance, oil resistance, and shear resistance. The blocking efficiency and oil recovery performance of the system were evaluated using parallel-core flooding experiments and nuclear magnetic resonance (NMR) techniques.
3.1. Calculation Methods
In this study, foam performance is primarily evaluated by calculating the comprehensive foam index. After measuring the initial foaming volume and foam half-life, the following equation is applied for the calculation [28]:
where denotes the foam comprehensive index (mL·min), represents the initial foaming volume (mL), and refers to the foam half-life (min).
The use of a comprehensive foam index is rational because a single foam property (such as initial volume or half-life alone) cannot fully describe the dynamic behavior of foam systems under reservoir-relevant conditions. Foam index effectively captures both the foam generation capacity and its persistence over time, offering a more representative evaluation of the system’s overall stability and mobility control potential. This integrative parameter allows for straightforward comparison between formulations and provides a useful screening criterion for selecting optimal foaming systems for core-flood experiments.
The blocking efficiency during the flooding process with the foam compound system is calculated using the following equation [29]:
Here, R denotes the blocking efficiency, represents the inlet–outlet pressure differential (MPa) prior to foam blocking(MPa), represents the inlet–outlet pressure differential (MPa) after foam blocking.
The accuracy of R is sensitive to baseline pressure stability and transient effects during foam buildup. If baseline drift occurs (e.g., due to pump fluctuations or temperature changes), the value of may deviate, leading to an overestimation or underestimation of R. Therefore, each test should be preceded by at least 30 min of steady-state flow to ensure stable baseline pressure. During the early stages of foam injection, transient pressure spikes can occur as lamellae form and coalesce. Using the average of the stabilized pressure plateau (rather than instantaneous peak values) can minimize this bias. Replicate experiments and consistent core cleaning procedures further improve the reproducibility of R measurements. Thus, the reported blocking efficiency values in this study reflect the steady-state behavior after foam establishment, ensuring comparability across formulations.
In the experiments, the one-dimensional frequency-encoding images display the axial distribution of the NMR signal of the oil phase within the core. By correlating the signal intensity with the corresponding oil volume, the signal profile is converted into the distribution of oil saturation in the core, thereby characterizing the migration of crude oil during the displacement process. The T2 spectrum, on the other hand, represents the distribution of the oil phase across different pore sizes, with the relaxation time T2 related to the pore radius as follows [25]:
In the equation, denotes the relaxation time (ms); is the surface relaxivity (nm/ms); is the pore surface area of the core (cm2); is the pore volume (cm3); is the geometrical shape factor; is the pore radius (cm).
From the above equation, it can be inferred that the relaxation time is proportional to the pore radius of the fluid-bearing pores: short relaxation times correspond to fluids residing in small pores, whereas long relaxation times correspond to fluids in larger pores. Therefore, by analyzing the variations in the dynamic T2 spectra during the displacement process, the pore-scale microscopic migration behavior of the oil phase can be investigated, thereby elucidating the plugging and enhanced oil recovery effects of foam flooding. The method for characterizing core oil recovery using NMR T2 spectra is as follows:
There:
represents the total integrated signal area before flooding; represents the total integrated signal area after flooding.
3.2. Experimental Design and Procedures
The experimental work was divided into three parts: (1) optimization of the concentration of the primary CO2 foaming agent (AOS); (2) optimization of the CO2 blended foaming system; and (3) evaluation of the blocking efficiency and enhanced oil recovery performance of the optimized CO2 blended foaming system. The first two parts focused on assessing foaming performance by calculating the comprehensive foam index from the measured initial foam volume and foam half-life, whereas the third part was conducted through parallel-core flooding tests combined with nuclear magnetic resonance (NMR) techniques.
Table 4.
Optimization experiment on the concentration of the primary CO2 foaming agent (AOS).
Table 5.
Optimization experiment on the CO2 compound foaming system.
Table 6.
Evaluation experiment on the blocking and enhanced oil recovery performance of the CO2 compound foaming system.
The detailed procedures for the CO2 foaming agent primary surfactant (AOS) concentration optimization experiment and the CO2 compound foaming system optimization experiment are as follows (taking the first group in the AOS concentration optimization experiment as an example):
- ①
- Preparation of formation water solution: Prepare the target salinity solution by mixing a measured volume of formation water and deionized water to obtain a solution with a salinity of 30,000 mg/L;
- ②
- Preparation of foaming solution: Dissolve 0.3 wt% AOS powder in the target salinity solution prepared in step 1 to obtain the foaming agent solution, then add 0.05 wt% HPAM as a foam stabilizer, followed by stirring and aging;
- ③
- Pressurization and equilibration: Inject the solution into the reactor, seal it, heat to the target temperature, purge air with CO2, pressurize to the target pressure, and maintain constant temperature for 30 min (for pre-aging, if an oil resistance test is to be conducted, add 40 mL of crude oil before injecting CO2);
- ④
- Foam generation and measurement: Start the high-speed stirrer and run for 30 s; after stopping, immediately record the maximum foam column height and calculate the foam volume based on the reactor diameter;
- ⑤
- Foam stability test: Record the time required for the foam height to decrease to 0.5 of its initial value, and finally calculate the foam composite index using the designated formula.
The detailed procedures for the evaluation and optimization experiment of the blocking and enhanced oil recovery performance of the CO2 compound foaming system are as follows (taking the first group as an example):
- ①
- Core preparation and setup: Place the two saturated cores into the parallel-core holder. After connecting all lines, apply a confining pressure of 10 MPa and set the back pressure to 5 MPa;
- ②
- System saturation with crude oil: Open the valves connecting the intermediate crude oil container to the experimental lines. Pump crude oil at a constant pressure of 5 MPa to fill the system and reach the target pressure. Once the outlet pressure reaches 5 MPa, indicating the system is fully saturated, close the relevant valves;
- ③
- Primary CO2 flooding: Open the valves connecting the CO2 container to the system and inject CO2 at a rate of 0.2 mL/min. Monitor the injection volume after CO2 breakthrough. Stop the flooding after injecting 4 PV, record the inlet–outlet pressure differential, and remove the cores for NMR T2 measurement;
- ④
- Secondary CO2 flooding: After NMR measurement, place the cores back into the holder and repeat the flooding procedure for another 4 PV. After completion, record the inlet–outlet pressure differential and conduct NMR T2 measurement again;
- ⑤
- Data analysis: Calculate the oil recovery using the changes in T2 signal amplitude. Compare the recovery before and after foam injection, and compute the plugging efficiency to evaluate the performance of the CO2-soluble foam system.
3.3. Core Oil Saturation Determination
A correlation between the total signal amplitude from one-dimensional (1D) frequency-encoding images, the cumulative envelope area of the T2 spectrum (i.e., total accumulated signal), and the core oil content was established. The total signal measured by the two sequences was found to be essentially consistent. The procedure is described below using the T2 spectrum as an example:
- (1)
- Measurement of dry core baseline: Measure the mass and NMR baseline signal of the washed and oven-dried core;
- (2)
- Saturation and measurement: After vacuum-saturating the core with crude oil, weigh the core and acquire the T2 spectrum and 1D frequency-encoding image, as shown in Figure 5;
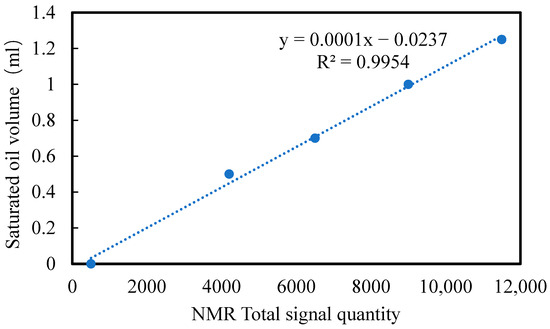 Figure 5. NMR signal–to–core oil content correlation.
 - (3)
- Centrifugation: Centrifuge the core at 2000, 4000, and 8000 rpm for 1 h each. After centrifugation, weigh the core and measure the T2 spectrum again;
- (4)
- Correlation establishment: Calculate the mass difference before and after centrifugation and the corresponding difference in cumulative T2 signal, and establish the conversion relationship between NMR signal amplitude and core oil content.
4. Results and Discussion
4.1. Optimization Results and Analysis of the Primary Agent Concentration
To select a primary foaming agent concentration that is both effective and cost-efficient, five concentrations (0.3%, 0.5%, 0.6%, 0.7%, and 0.8%) were tested. The comprehensive foam index calculated for each concentration was used to construct the bar and line trend plots of foaming performance for AOS at different concentrations, as shown in Figure 6.
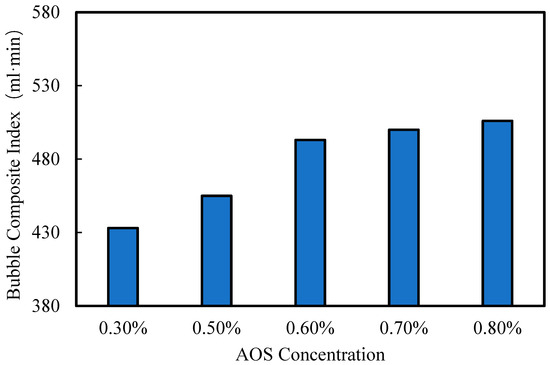
Figure 6.
Foaming performance of AOS at different concentrations.
As shown in the figure, when the primary agent concentration increases from 0.3% to 0.6%, the comprehensive foam index rises rapidly, with the slope of the trend also increasing. At 0.6%, the foam index is 13.9% higher than that at 0.3%, indicating that low concentrations of the primary agent are insufficient to achieve good foaming performance, while an appropriate increase in concentration effectively optimizes the foaming capability. In the range of 0.6% to 0.8%, the increase in the foam index becomes much smaller, and the slope of the trend markedly decreases. Overall, 0.6% represents the inflection point of foaming performance. At 0.8%, the foam index increases by only 2.6% compared with 0.6%. Therefore, to achieve excellent foaming performance while maintaining economic efficiency, the concentration at the performance inflection point (0.6%) is considered optimal. Accordingly, in all subsequent experiments, the primary agent concentration was set at 0.6%.
4.2. Optimization Results and Analysis of the Compound Foaming System
To select an optimal compound foaming system, 0.6 wt% AOS was used as the primary surfactant, with AEO and CTAB as secondary surfactants for formulation. The optimization of the compound system was conducted by varying the type and mass ratio of the secondary surfactants, combined with performance evaluation tests. The comparison of foaming performance for the two compound systems using AEO or CTAB as the secondary surfactant at different mass ratios is shown in Figure 7.
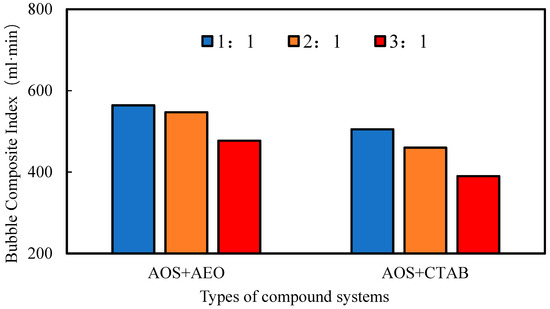
Figure 7.
Comparison of foaming performance for two compound systems at different mass ratios.
As shown in the figure, the AOS+AEO compound system exhibits superior foaming performance compared with the AOS+CTAB system across different surfactant mass ratios. In both systems, the foaming performance decreases as the mass ratio of primary to secondary surfactant increases. For the better-performing AOS+AEO system, although the foaming performance slightly decreases at a 2:1 mass ratio, it still reaches 97% of the performance observed at a 1:1 ratio.
The comparison of salt tolerance for the two compound systems with AEO or CTAB as the secondary surfactant is shown in Figure 8.
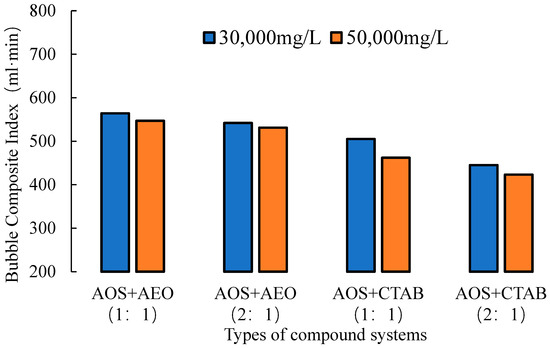
Figure 8.
Comparison of salt tolerance for the two compound systems.
As shown in the figure, the AOS+AEO compound system exhibits superior salt tolerance compared with the AOS+CTAB system across different mass ratios. When the salinity increases from 30,000 mg/L to 50,000 mg/L, the foaming performance of the AOS+AEO system at both mass ratios retains 97% and 98% of the original level, whereas the AOS+CTAB system retains only 91.5% and 95.1%, respectively. This indicates that the foaming performance of the AOS+AEO system is less affected by increasing salinity and demonstrates better salt resistance.
The comparison of oil tolerance and shear resistance for the two compound systems is shown in Figure 9.
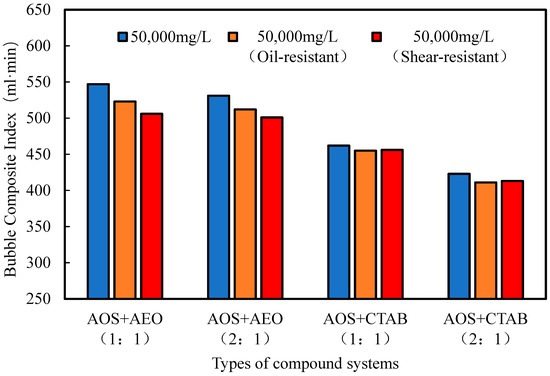
Figure 9.
Comparison of oil tolerance and shear resistance for the two compound systems.
As shown in the figure, the AOS+AEO compound system at a 2:1 mass ratio exhibits excellent oil tolerance and shear resistance. Its foaming performance shows no significant decline after the addition of crude oil and shear treatment. Although slightly lower than that of the 1:1 AOS+AEO system, the difference is minimal. The AOS+CTAB system demonstrates even less reduction in foaming performance under oil addition and shear, indicating better oil tolerance and shear resistance; however, its overall foam index is substantially lower than that of the AOS+AEO system.
Considering all the above experiments, the AOS+AEO system outperforms the AOS+CTAB system in foaming performance across different surfactant mass ratios and exhibits excellent salt tolerance, oil tolerance, and shear resistance. The 2:1 AOS+AEO system provides both superior foaming performance and economic efficiency(industrial-grade prices of approximately 15,000 CNY t−1 for AOS and 25,000 CNY t−1 for AEO, if maintain a constant AOS dosage while reducing the AEO proportion by half decreases, it could make an overall cost reduction of approximately 31%.), and is therefore selected as the optimal system for subsequent experiments.
4.3. Core Flooding Experiments and NMR Measurement Analysis
This part of the experiment employed NMR imaging to provide a direct qualitative assessment of the foaming performance of the compound system, while NMR T2 spectra were used for quantitative evaluation of oil recovery. The blocking performance of the foam system was quantified based on the inlet–outlet pressure differential.
For the first group (permeability ratio = 5, injection rate = 0.2 mL/min), a heterogeneous reservoir was subjected to pure CO2 flooding as the control. The variation in inlet pressure with time is shown in Figure 10. The injected PV count was calculated starting from CO2 breakthrough. After injecting 4 PV of CO2, the system stabilized, followed by an additional 4 PV injection. At this point, the inlet pressure reached 5.24 MPa, and the difference from the outlet back pressure of 5 MPa, MPa, was used to calculate the blocking efficiency for the subsequent CO2 foam flooding experiments.
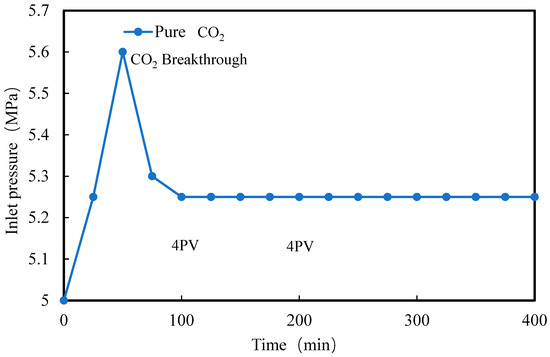
Figure 10.
Inlet pressure versus time curve for the control group.
The NMR images of the two cores in the control group before and after flooding are shown in Figure 11. From the images, it can be observed that after injecting 4 PV of pure CO2, the oil saturation in the low-permeability core decreases only slightly. After an additional 4 PV injections of pure CO2, the oil saturation in the low-permeability core remains nearly unchanged, indicating that a large amount of oil remains in the low-permeability core, and the recovery potential is significant. For the high-permeability core, a substantial amount of oil is produced after the first 4 PV of pure CO2 flooding; however, after a subsequent 4 PV injection, the oil saturation in the high-permeability core shows little further change. This behavior is likely due to the formation of CO2 preferential flow channels in the high-permeability core after breakthrough, causing subsequent CO2 injection to bypass the low-permeability core and the remaining oil in the high-permeability core, thereby limiting further recovery. Qualitatively, the NMR images demonstrate that the development of high-permeability CO2 channels is unfavorable for subsequent oil recovery, highlighting the importance of foam-based blocking.
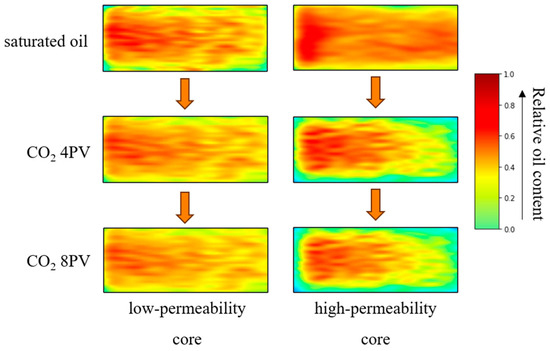
Figure 11.
NMR images of high- and low-permeability cores in the control group after pure CO2 flooding.
The T2 spectra of the two cores in the control group before and after flooding, along with the corresponding recovery calculated from peak areas, are shown in Figure 12 and Figure 16. It can be seen that after pure CO2 flooding, the peak area of the T2 spectrum for the high-permeability core decreases significantly, whereas the low-permeability core shows only a slight decrease. This indicates that most of the oil is produced from the high-permeability core, while oil mobilization in the low-permeability core is minimal. Furthermore, the oil produced from the high-permeability core mainly originates from the larger pores. After 8 PV of pure CO2 flooding, the overall recovery of the two cores is 21.0%, with 33.5% from the high-permeability core and only 7.1% from the low-permeability core. These results quantitatively confirm that the high-permeability core contributes the majority of oil production during pure CO2 flooding, while the low-permeability core retains substantial recovery potential.
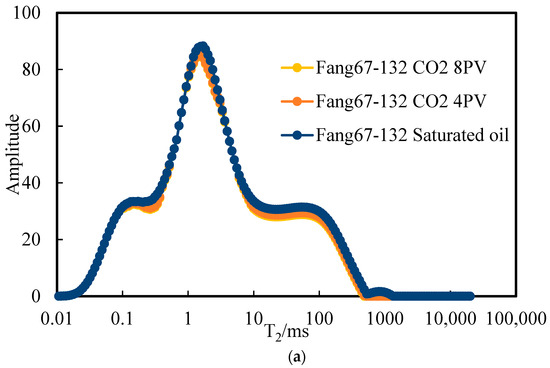
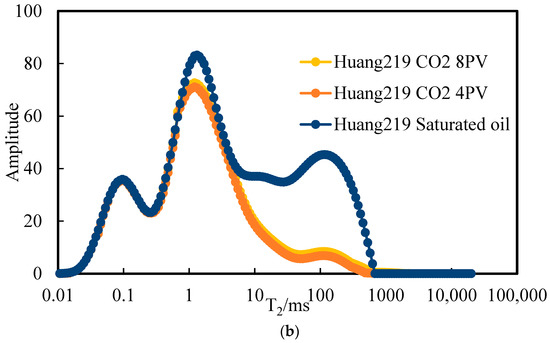
Figure 12.
T2 spectra of low-permeability core (a) and high-permeability core (b) in the control group after pure CO2 flooding.
To visually demonstrate the performance improvement of the subsequent compound system compared to the single system surfactant, we conducted a parallel core flooding experiment with the single AOS (0.6%wt). The gas–liquid ratio of the surfactant solution to CO2 was 2:1, the injection rate was 0.2 mL/min, and the permeability ratio was 5. The curve of the inlet pressure varying with time is shown in Figure 13. It can be seen that the foam flooding of the AOS single system can effectively block the high-permeability layer. Through calculation, the blocking rate reaches 79.1%.
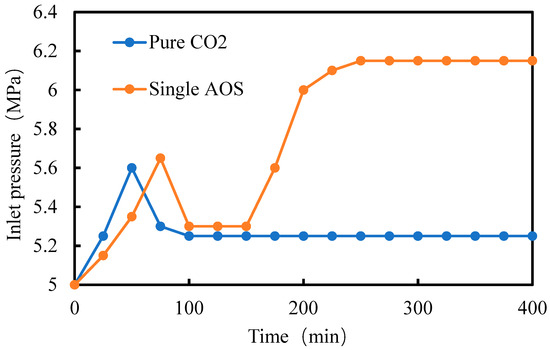
Figure 13.
Inlet pressure versus time curves for foam flooding and the control group.
The nuclear magnetic resonance images of the AOS single system foam flooding before and after are shown in Figure 14. It can be seen from the figure that after 4PV pure CO2 flooding, the oil saturation of the low-permeability core remains basically unchanged. After the AOS single system foam flooding for 4PV, the oil utilization in the low-permeability core was enhanced, and the oil saturation decreased. Qualitative analysis indicates that the AOS single system foam flooding effectively blocks high-permeability channels and improves crude oil utilization of low-permeability cores.
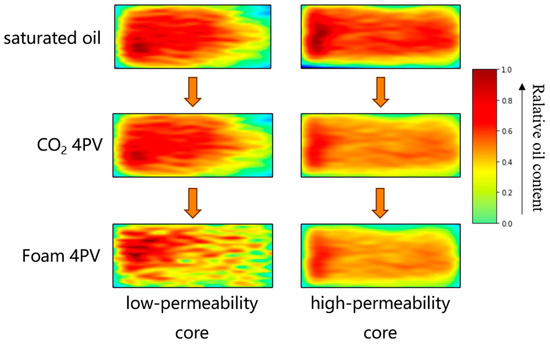
Figure 14.
NMR images of high- and low-permeability cores before and after foam flooding.
The T2 spectra of the cores before and after the AOS single system foam flooding, as well as the recovery rates calculated by peak area, are compared, as shown in Figure 15 and Figure 16. It can be seen that the peak areas of both low-permeability and high-permeability cores after foam flooding are significantly lower than those after pure CO2 flooding, indicating that crude oil has been effectively further utilized during the AOS single system foam flooding process. The extracted oil mainly comes from larger pores. The total recovery rate of the two cores after foam flooding was 22.9%, which was 1.9% higher than that of pure CO2 flooding. Foam flooding enhanced the recovery rate of low-permeability cores by 1.6% compared to CO2 flooding and further increased the crude oil utilization of high-permeability cores by 2.7%.
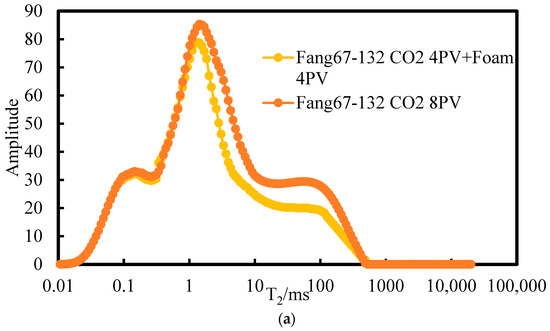
Figure 15.
Comparison of T2 spectra for low-permeability core (a) and high-permeability core (b) between single AOS foam flooding and the control group.
Figure 16.
Comparison of oil recovery between foam flooding and the control group.
The comparative experiment between AOS+AEO foam flooding and pure CO2 flooding was conducted with the compound system at an AOS–AEO mass ratio of 2:1. The gas–liquid ratio of the system to CO2 was set at 2:1, the injection rate was 0.2 mL/min, and the permeability ratio between the high- and low-permeability cores was 5. The inlet pressure versus time curves are shown in Figure 17. It can be seen that foam flooding with the AOS+AEO system effectively blocks the high-permeability layer, achieving a blocking rate of 84.5% through calculation. This is superior to the 79.1% blocking rate of the single-system AOS. This indicates that the system significantly reduces CO2 channeling through high-permeability zones, allowing the displacing fluid to sweep a larger portion of the core and thereby providing the potential to further enhance oil recovery.
Figure 17.
Inlet pressure versus time curves for compound foam flooding and the control group.
The NMR images before and after foam flooding with the AOS+AEO system are shown in Figure 18. From the images, it can be observed that after 4 PV of pure CO2 flooding, the oil saturation in the low-permeability core remains nearly unchanged. However, after 4 PV of foam flooding with the compound system, oil mobilization in the low-permeability core is significantly enhanced, with a noticeable decrease in oil saturation. The high-permeability core remains the primary contributor to oil production. Compared with the control group, not only does it produce a large amount of oil after the initial 4 PV of pure CO2 flooding, but additional oil is also mobilized during the subsequent foam flooding. Qualitatively, the NMR images demonstrate that the compound foam system effectively blocks high-permeability channels, improves oil mobilization in the low-permeability core, and further enhances recovery from the remaining oil in the high-permeability core, indicating that this system is effective for improving overall oil recovery.
Figure 18.
NMR images of high- and low-permeability cores before and after foam flooding.
The T2 spectra of the cores before and after foam flooding, along with the corresponding recovery calculated from peak areas, are compared in Figure 19 and Figure 20. It can be seen that the peak areas for both the low- and high-permeability cores after foam flooding are noticeably lower than those after pure CO2 flooding, indicating that oil is effectively further mobilized during foam flooding. The produced oil mainly originates from the larger pores. The overall recovery of the two cores after foam flooding is 25.6%, representing an increase of 4.6% compared to pure CO2 flooding. Compound foam flooding significantly improves oil recovery in the low-permeability core, with a 4.5% increase over CO2 flooding, and further enhances oil mobilization in the high-permeability core, with a 4.6% increase. All these performances are superior to those of a single system AOS. These quantitative results demonstrate that the compound foam system effectively improves recovery in low-permeability zones while further mobilizing oil in high-permeability zones, highlighting its practical significance for optimizing recovery in heterogeneous reservoirs.
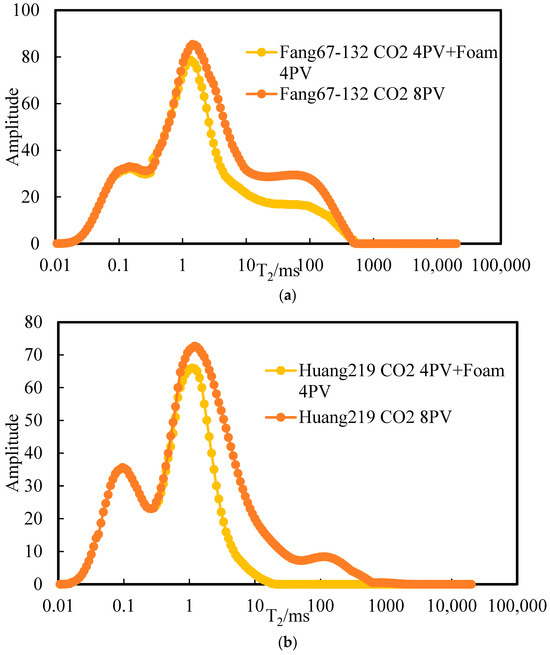
Figure 19.
Comparison of T2 spectra for low-permeability core (a) and high-permeability core (b) between compound foam flooding and the control group.
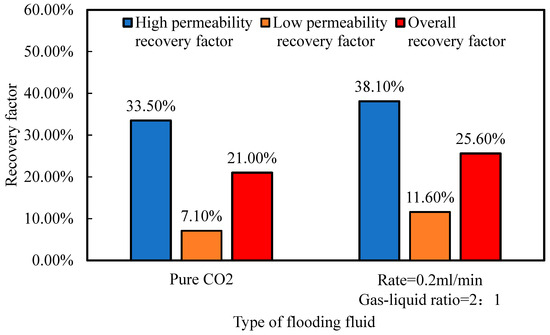
Figure 20.
Comparison of oil recovery between compound foam flooding and the control group.
To investigate the blocking and recovery performance of the AOS+AEO compound system in heterogeneous reservoirs with different permeability contrasts, cores with a permeability ratio of 10 were selected and compared with the previously tested cores with a permeability ratio of 5. In both experiments, the high-permeability cores had identical permeability, while only the low-permeability cores differed; all other experimental parameters were kept constant. The injection pressure versus time curves and the corresponding blocking rate comparisons for this set of experiments are shown in Figure 21a,b. It can be observed that the AOS+AEO compound system achieves even better blocking performance in cores with a permeability ratio of 10, with a blocking rate reaching 86.5%, which is 2% higher than that of the cores with a permeability ratio of 5.
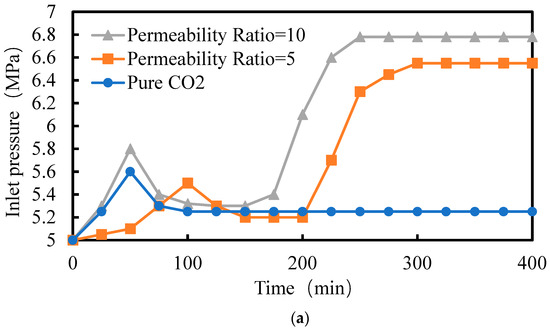
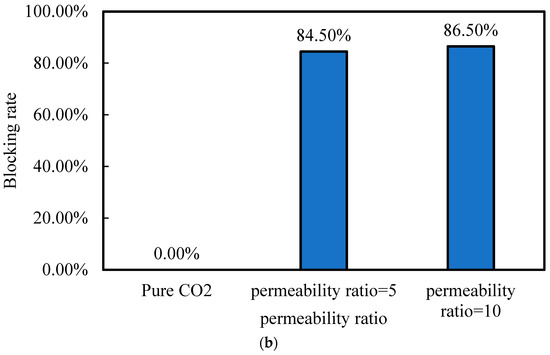
Figure 21.
Injection pressure versus time curves (a) and blocking rate comparison (b) for cores with different permeability ratios and the control group.
Figure 22 shows the NMR images of cores with a permeability ratio of 10 before and after foam flooding. It can be observed that the oil saturation changes in both the low- and high-permeability cores are similar to those in the control group. The AOS+AEO compound foam system has only a minor effect on oil recovery for this permeability-contrast core, with the low-permeability core still exhibiting poor oil mobilization.
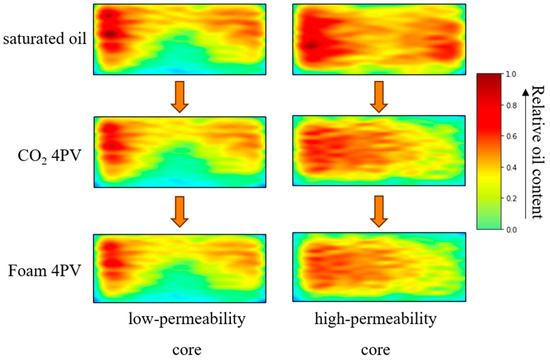
Figure 22.
NMR images of high- and low-permeability cores with a permeability ratio of 10.
Figure 23 and Figure 24 present the T2 spectra before and after foam flooding, along with the corresponding oil recovery calculated from the peak areas for cores with different permeability contrasts. It can be observed that for the experiment with a permeability ratio of 10, the overall recovery was only 22.5%, 3.1% lower than that for the permeability ratio of 5. The oil recovery of the low-permeability core decreased by 6.4%, approximately half of that observed in the low-permeability core of the permeability ratio 5 experiment, while the high-permeability core recovery decreased by 1.6% to 36.5%. This may be attributed to the fact that, although a higher permeability ratio effectively increases the blocking efficiency, the extremely low permeability of the low-permeability layer still limits oil mobilization during displacement, resulting in a persistently low recovery. Therefore, while the foam system can achieve effective blocking in reservoirs with a large permeability ratio, its incremental effect on oil recovery is limited.
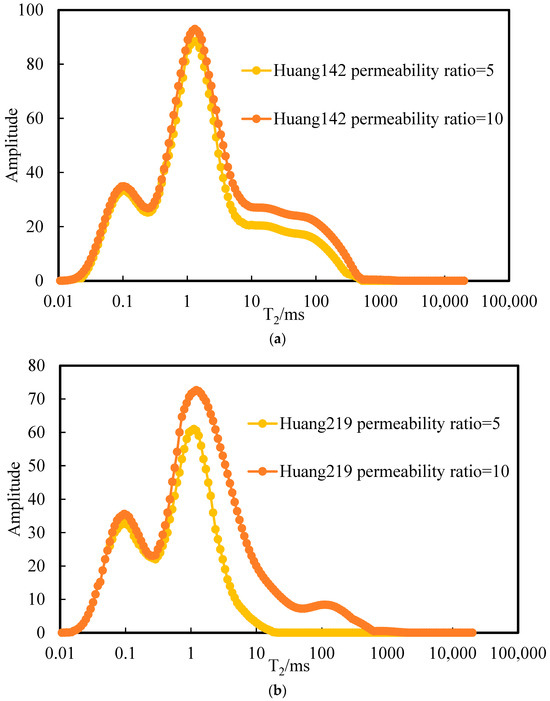
Figure 23.
Comparison of T2 spectra for low-permeability (a) and high-permeability (b) cores under foam flooding with different permeability ratios.
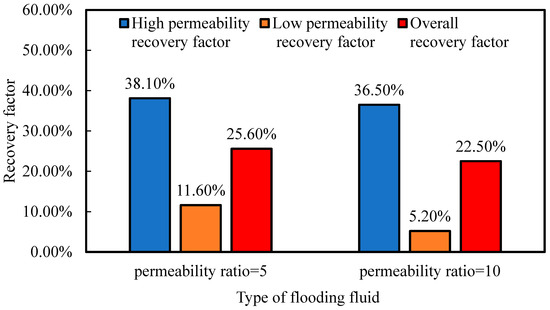
Figure 24.
Comparison of oil recovery for foam flooding under different permeability ratios.
5. Conclusions
- (1)
- An optimized CO2-foam system comprising 0.6 wt% AOS (primary foaming agent), 0.3 wt% AEO (auxiliary agent), and 0.05 wt% HPAM (stabilizer) was developed, exhibiting excellent foaming performance, stability (thermal, salt, shear), and cost-effectiveness.
- (2)
- Core-flooding experiments coupled with NMR analysis demonstrated that this AOS+AEO foam system can effectively block high-permeability channels in heterogeneous reservoirs, and its effect is superior to that of the AOS single system.
- (3)
- The compound foam system significantly increased the overall oil recovery versus pure CO2 flooding, particularly in low-permeability zones, whose effect is better than that of the AOS single system as well.
- (4)
- Permeability ratio has a dual impact on foam-based blocking experiments. With increasing contrast, the foam’s blocking efficiency improves, but oil mobilization in low-permeability layers becomes more challenging, leading to a decline in overall recovery. This highlights the inherent trade-off between blocking performance and oil recovery under different degrees of reservoir heterogeneity.
- (5)
- HPAM may undergo partial hydrolysis or chain scission at elevated temperatures (>90 °C), leading to viscosity loss and reduced foam stability over prolonged injection periods. To mitigate this, future work will focus on screening temperature-resistant copolymers and optimizing formulation pH and salinity to improve polymer stability.
Author Contributions
Conceptualization, J.J.; Methodology, J.J. and X.W.; Validation, W.F.; Resources, C.Y.; Data curation, D.L.; Writing—review and editing, X.W. All authors have read and agreed to the published version of the manuscript.
Funding
This study was supported by PetroChina’s major scientific and technological project “Research and demonstration of key technologies for large-scale carbon dioxide capture, flooding and storage in the whole industrial chain”, subject 3 “Study on CCUS geological fine description for oil displacement and key technologies in reservoir engineering” (2021ZZ01-03).
Data Availability Statement
The original contributions presented in this study are included in the article. Further inquiries can be directed to the corresponding author.
Conflicts of Interest
Authors Junhong Jia, Wei Fan, Chengwei Yang and Danchen Li were employed by Exploration and Development Research Institute of Petrochina Changqing Oilfield Company. The remaining authors declare that the research was conducted in the absence of any commercial or financial relationships that could be construed as a potential conflict of interest.
References
- Hamed, F.; Zoveidavianpoor, M.; Jalilavi, M. The Incorporation of Silica Nanoparticle and Alpha Olefin Sulphonate in Aqueous CO2-Foam: Investigation of Foaming Behavior and Syner gistic Effect. Pet. Sci. Technol. 2014, 32, 2549–2558. [Google Scholar] [CrossRef]
- Chen, Y.; Elhag, A.S.; Poon, B.M.; Cui, L.; Ma, K.; Liao, S.Y.; Omar, A.; Worthen, A.J.; Hirasaki, G.J.; Nguyen, Q.P.; et al. Ethoxylated Cationic Surfactants for CO2 EOR in High Temperature, High Salinity Reservoirs. In Proceedings of the SPE Improved Oil Recovery Symposium, Tulsa, OK, USA, 14–18 April 2012; p. SPE 154222. [Google Scholar] [CrossRef]
- Worthen, A.J.; Bagaria, H.G.; Chen, Y.; Bryant, S.L.; Huh, C.; Johnston, K.P. Nanoparticle stabilized carbon dioxide-in-water foams with fine texture. J. Colloid Interface Sci. 2013, 391, 142–151. [Google Scholar] [CrossRef]
- Aryana, C.B.S.A.; Liu, S. North cross devonian unit—A mature continuous CO2 flood beyond 200% HCPV injection. In Proceedings of the SPE Annual Technical Conference and Exhibition SPE, Amsterdam, The Netherlands, 27–29 October 2014; p. SPE-170653-MS. [Google Scholar]
- Schramm, L.L.; Mannhardt, K. The effect of wettability on foam sensitivity to crude oil in porous media. J. Pet. Sci. Eng. 1996, 15, 101–113. [Google Scholar] [CrossRef]
- Talebian, S.H.; Masoudi, R.; Tan, I.M.; Zitha, P.L.J. Foam assisted CO2-EOR: A review of concept, challenges, and future prospects. J. Pet. Sci. Eng. 2014, 120, 202–215. [Google Scholar] [CrossRef]
- Worthen, A.J.; Johnston, K.P.; Amir, T.; Archawin, A.; Ljung, K.; Chun, H.; Bryant, S.; DiCarlo, D. Multi-scale evaluation of nanoparticle-stabilized CO2-in-water foams: From the benchtop to the field. In Proceedings of the SPE Annual Technical Conference and Exhibition, Huston, TX, USA, 28–30 September 2015; p. SPE-175065-MS. [Google Scholar]
- Aryana, S.A.; Kovscek, A.R. Experiments and analysis of drainage displacement processes relevant to carbon dioxide injection. Phys. Rev. E 2012, 86, 066310. [Google Scholar] [CrossRef]
- Enick, R.M.; Olsen, D.; Ammer, J.; Schuller, W. Mobility and Conformance Control for CO2 EOR via Thickeners, Foams, and Gels—A Literature Review of 40 Years of Research and Pilot Tests. In Proceedings of the SPE Improved Oil Recovery Symposium, Tulsa, OK, USA, 14–18 April 2012. [Google Scholar]
- Ren, G.; Nguyen, Q.P. Understanding aqueous foam with novel CO2-soluble surfactants for controlling CO2 vertical sweep in sandstone reservoirs. Pet. Sci. 2017, 14, 330–361. [Google Scholar] [CrossRef]
- Ahmed, S.; Elraies, K.A.; Tan, I.M.; Mumtaz, M. A review on CO2 foam for mobility control: Enhanced oil recovery. In Proceedings of the ICIPEG 2016: The International Conference on Integrated Petroleum Engineering and Geosciences, Singapore, 15–17 August 2016; Springer: Singapore, 2017; pp. 205–215. [Google Scholar]
- Wang, C.; Li, H.Z. Foam Stability of Solvent/Surfactant/Heavy-Oil System under Reservior Conditions. In Proceedings of the SPE International Heavy Oil Conference and Exhibition, Mangaf, Kuwait, 8–10 December 2014; p. SPE-172888-MS. [Google Scholar]
- Xing, D.; Wei, B.; McLendon, W.J.; Enick, R.M.; McNulty, S.; Trickett, K.; Mohamed, A.; Cummings, S.; Eastoe, J.; Rogers, S.; et al. CO2-Soluble, Nonionic, Water-Soluble Surfactants That Stabilize CO2-in-Brine Foams. SPE J. 2012, 17, 1172–1185. [Google Scholar] [CrossRef]
- Jiang, Z.; Zhu, S.; Wu, J.; Ye, J. Study on foaming and foam stability of different types of surfactants in saturated calcium carbonate solution. J. Phys. Conf. Ser. IOP Publ. 2025, 3008, 012043. [Google Scholar] [CrossRef]
- Koyanbayev, M.; Hazlett, R.D.; Wang, L.; Hashmet, M.R. An experimental investigation of surfactant-stabilized CO2 foam flooding in carbonate cores in reservoir conditions. Energies 2024, 17, 3353. [Google Scholar] [CrossRef]
- Emami, H.; Ayatizadeh Tanha, A.; Khaksar Manshad, A.; Mohammadi, A.H. Experimental investigation of foam flooding using anionic and nonionic surfactants: A screening scenario to assess the effects of salinity and ph on foam stability and foam height. ACS Omega 2022, 7, 14832–14847. [Google Scholar] [CrossRef]
- Qiang, X.F.; Zhang, L.; Zheng, B.; Hou, Q.Q.; Yan, K. Study on the influence of KCl on the evolution of foam of an anionic surfactant. China Surfactant Deterg. Cosmet. 2023, 53, 733–741. [Google Scholar]
- Jiang, N.; Yu, X.; Sheng, Y.; Zong, R.; Li, C.; Lu, S. Role of salts in performance of foam stabilized with sodium dodecyl sulfate. Chem. Eng. Sci. 2020, 216, 115474. [Google Scholar] [CrossRef]
- Yang, W.H.; Yang, X.Z. Molecular dynamics study of the influence of calcium ions on foam stability. J. Phys. Chem. B 2010, 114, 10066–10074. [Google Scholar] [CrossRef]
- Zhang, L.; Wang, H.T.; Zheng, B.; Du, H.; Salonen, A. Surfactant Crystals as Stimulable Foam Stabilizers: Tuning Stability with Counterions. J. Surfactants Deterg. 2019, 22, 1237–1245. [Google Scholar] [CrossRef]
- Al-Darweesh, J.; Aljawad, M.S.; Kamal, M.S.; Mahmoud, M.; Al-Yousef, Z.; Al-Shehri, D. Water chemistry role in the stability of CO2 foam for carbon sequestration in water aquifers. Gas Sci. Eng. 2023, 118, 205090. [Google Scholar] [CrossRef]
- Bashir, A.; Haddad, A.S.; Rafati, R. An experimental investigation of dynamic viscosity of foam at different temperatures. Chem. Eng. Sci. 2022, 248, 117262. [Google Scholar] [CrossRef]
- Memon, M.K.; Shuker, M.T.; Elraies, K.A. Study of blended surfactants to generate stable foam in presence of crude oil for gas mobility control. J. Pet. Explor. Prod. Technol. 2017, 7, 77–85. [Google Scholar] [CrossRef]
- Bertoncello, A.; Wallace, J.; Blyton, C.; Honarpour, M.M.; Kabir, C.S. Imbibition and water blockage in unconventional reservoirs: Well-management implications during flowback and early production. SPE Reserv. Eval. Eng. 2014, 17, 497–506. [Google Scholar] [CrossRef]
- Tripathi, R.; Alcorn, Z.P.; Graue, A.; Kulkarni, S.D. Combination of non-ionic and cationic surfactants in generating stable CO2 foam for enhanced oil recovery and carbon storage. Adv. Geo-Energy Res. 2024, 13, 42–55. [Google Scholar] [CrossRef]
- Wang, L.; Zhu, L.; Xue, Y.; Cao, X.; Liu, G. Multiphysics modeling of thermal–fluid–solid interactions in coalbed methane reservoirs: Simulations and optimization strategies. Phys. Fluids 2025, 37, 076649. [Google Scholar] [CrossRef]
- Wang, L.; Zhu, L.; Cao, Z.; Liu, J.; Xue, Y.; Wang, P.; Cao, X.; Liu, Y. Thermo-mechanical degradation and fracture evolution in low-permeability coal subjected to cyclic heating–cryogenic cooling. Phys. Fluids 2025, 37, 086617. [Google Scholar] [CrossRef]
- Wu, W.; Pan, J.; Guo, M. Mechanisms of oil displacement by ASP-foam and its influencing factors. Pet. Sci. 2010, 7, 100–105. [Google Scholar] [CrossRef][Green Version]
- Farajzadeh, R.; Andrianov, A.; Zitha, P.L.J. Investigation of immiscible and miscible foam for enhancing oil recovery. Ind. Eng. Chem. Res. 2010, 49, 1910–1919. [Google Scholar] [CrossRef]


Disclaimer/Publisher’s Note: The statements, opinions and data contained in all publications are solely those of the individual author(s) and contributor(s) and not of MDPI and/or the editor(s). MDPI and/or the editor(s) disclaim responsibility for any injury to people or property resulting from any ideas, methods, instructions or products referred to in the content. |
© 2025 by the authors. Licensee MDPI, Basel, Switzerland. This article is an open access article distributed under the terms and conditions of the Creative Commons Attribution (CC BY) license (https://creativecommons.org/licenses/by/4.0/).