Abstract
Francis turbines operating in sediment-laden flows experience efficiency loss and reduced service life due to abrasive wear. To enhance wear resistance, this study optimized the turbine at Mupo Hydropower Station in Sichuan Province. Using the Plackett–Burman design, three runner parameters were identified as most influential: blade number, inlet setting angle, and outlet setting angle. A central composite design based on response surface methodology was then applied to these factors. Multiple regression models linking the parameters to turbine head, efficiency, and wear rate were established, revealing a trade-off between hydraulic performance and wear resistance. Multi-objective optimization, a method that simultaneously addresses and balances multiple competing goals, was performed to minimize wear rate while maintaining the original head. The optimal parameter combination was obtained as follows: blade number Z3 = 17, inlet setting angle = 65°, and outlet setting angle = 22°. Numerical results demonstrate a 32.3% reduction in runner wear under these parameters, with the head requirement satisfied, confirming a significant improvement in overall turbine performance.
1. Introduction
Francis turbines are widely used in numerous hydropower stations due to their advantages such as high energy conversion efficiency and a wide applicable head range. However, when operating in sediment-laden rivers, sediment particles entering the interior of the turbine unit cause severe damage to the turbine. This damage will change the internal flow pattern of the runner and reduce the efficiency of the turbine, which not only weakens the economic benefits of the hydropower station, but also poses a major challenge to the operation and maintenance of the power station [1].
In terms of turbine abrasion, Qian Zhongdong et al. [2] used CFD numerical simulation to calculate the flow field and particle movement trajectories inside the runner, and compared the results with the abraded hydraulic turbine runner. The results showed that severe abrasion occurred near the outlet of the suction side of the runner blades, which was consistent with the actual abrasion location of the on-site turbine. The wear mechanism of the runner is revealed, and the vortex between the blades at the runner outlet is the main reason for the serious wear of the blades. GAUTAM et al. [3] analyzed the causes of sediment abrasion in low-specific-speed Francis turbines and found that the leakage flow in the guide vane clearance is the main cause of abrasion at the runner blade inlet, which is also related to the shape and size of particles. Tian Changan et al. [4] revealed the distribution law of sediment on the runner blade surface through numerical simulation: sediment is mainly distributed on the suction side of the blade at the blade inlet, while at the blade outlet, it is mainly distributed on the pressure side of the blade. Peng et al. [5] used the Finnie model to predict the abrasion of internal flow components of turbines under different operating conditions. Through the analysis of the abrasion status of the turbine’s internal flow components, it was found that with the increase of head, the maximum abrasion value of the runner blades also increases. Liu Xiaobing [6] conducted research on the motion characteristics of solid particles in a sparse particle turbulent flow field. Through numerical solution of particle motion equations, he established a series of models applicable to turbulent solid–liquid two-phase flow. These models were applied to hydraulic turbines via CFD techniques and compared with experimental results. The outcomes showed a high degree of consistency. Liao Jiaojiao et al. [7] employed the control variable method to investigate the effects of different sediment particle sizes and volume fractions on the internal flow field and abrasion in Francis turbines. It was found that as sediment particle size increases, sediment aggregation occurs, thereby intensifying abrasion.
In recent years, optimization methods based on statistics and artificial intelligence have achieved success in the field of advanced manufacturing and energy engineering. For example, Oğuzhan DER et al. [8] have determined the optimal combination of experimental parameters under the conditions of minimizing surface roughness, kerf width, and maximizing material removal rate by combining DEA with the cocoso method based on swara for the laser-cutting polyethylene process. Xingfei Ren et al. [9] used an artificial neural network and particle swarm optimization algorithm to carry out high-precision modeling and parameter optimization of the laser-cutting process, showing the powerful ability of data-driven methods in dealing with complex nonlinear problems. These studies provide an important paradigm for the optimization of complex engineering systems. In contrast, this study is faced with the complex solid–liquid two-phase flow and wear problems in the turbine, whose physical background and manufacturing process are completely different. Krishna et al. [10] proposed a new runner blade design method that modifies the flow outlet angle and setting angle of runner blades to alter the blade profile. This method minimizes erosion while maintaining efficiency, thereby extending the service life of runner blades. Binaya et al. [11] investigated the performance of Francis turbines under different numbers of runner blades using CFD numerical techniques. The results showed that when the number of runner blades is 13, the turbine achieves the highest efficiency; however, compared with the runner with 17 blades, it exhibits greater blade load and higher sediment erosion. BS Thapa et al. [12] found that the shape of runner blades has a significant impact on the flow velocity distribution, thereby exerting a notable influence on sediment erosion of the runner. They further optimized the blade profile, which reduced sediment abrasion. Currently, multi-objective optimization methods are increasingly applied in optimization design. The basic logic of multi-objective optimization is to explore the optimal solution within the value range of design variables on the basis of satisfying predefined constraints, ultimately achieving the optimal overall performance of the designed object [13]. R.D. Aponte [14] employed experimental design, artificial neural networks, genetic algorithms, and computational fluid dynamics to conduct multi-objective and multi-point optimization for the redesign of the geometric shape. This approach significantly reduced the abrasion rate while maintaining the efficiency close to the original value.
In recent years, many scholars have carried out in-depth optimization of the channel geometry of hydraulic machinery through statistics and intelligent optimization algorithms, which revealed the constraint relationship between impeller parameters, and explored the optimal parameter combination aimed at improving the comprehensive performance, opening up a new way for the optimal design of hydraulic machinery [15,16,17]. The optimization methods can be divided into two categories: one is the surrogate model method based on mathematical statistics, such as response surface method, orthogonal analysis method, and Plackett–Burman design; the other is an intelligent optimization algorithm based on population, such as genetic algorithm, particle swarm optimization algorithm, etc. [18,19,20]. In statistical methods, the combination of the Plackett–Burman design and response surface methodology has become an efficient multi-objective optimization strategy [21,22]. The Plackett–Burman design can efficiently and reliably screen out a few key parameters that have the most significant impact on performance goals with the least number of tests, thus reducing the complexity of subsequent optimization. Subsequently, the response surface method can use reasonable experimental design to build multiple regression models between these key parameters and response values. The model can not only clearly show the interaction between parameters, but also quickly locate the optimal parameter combination through mathematical methods.
Unlike most existing studies that focus on the description of abrasion phenomena and analysis of mechanisms, the innovation of this paper lies in proposing a proactive anti-abrasion design method based on multi-parameter collaborative optimization. Based on the above theory, this paper adopts the response surface methodology combined with CFD technology, aiming to break through the limitations of single-factor analysis and systematically reveal the coupling influence mechanism of the interaction between key geometric parameters of the runner on hydraulic performance and abrasion characteristics. By establishing a high-precision multiple regression model and conducting multi-objective optimization, this study not only aims to obtain the parameter combination with optimal comprehensive performance, but also strives to provide new theoretical insights and directly applicable engineering solutions for the robust design of Francis turbines in sediment-laden flow.
2. Model and Numerical Method
2.1. Research Object and Parameters
This study takes the HL (F713)-LJ-140 hydraulic turbine used in the Mupo Hydropower Station (Aba Prefecture, Sichuan Province, China) as the research object. The main parameters of the turbine are as follows: the rated head is 118 m, the rated speed is 500 r/min, and the rated output is 15,540 Kw. The computational domain of the turbine model consists of the volute, fixed guide vanes, movable guide vanes, runner, and draft tube. The geometric model is established by using three-dimensional modeling software Creo 5.0., and the computational domain is shown in Figure 1. The parameters of the main flow-passing components are presented in Table 1.
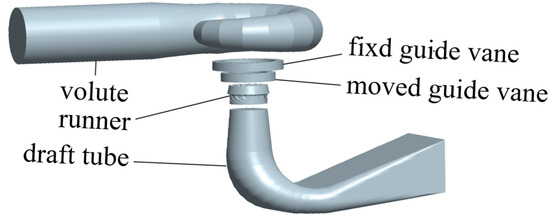
Figure 1.
Computational Domain.

Table 1.
Main parameters.
2.2. Mesh and Numerical Method
Considering the advantages of Fluent Meshing 2022 R2 in handling mesh generation for large-scale complex structures, this software was used to generate polyhedral meshes for the turbine fluid domain. The mesh parameters are specified as follows: the mesh angle is greater than 18 degrees, the aspect ratio is less than 20, and the cell quality is 0.26.
Taking head and efficiency as evaluation criteria, mesh independence verification was conducted on five groups of meshes with different quantities under the operating conditions of turbine flow rate 15.76 m3/s and rotational speed 500 r/min. The calculation results are presented in Table 2. When the number of mesh elements exceeds 14.36 million, the relative errors of both head and efficiency are controlled within 1%. By comprehensively balancing the requirements of calculation accuracy and the consumption of computing resources, the number of mesh elements for the computational domain was finally determined to be 14.36 million, and the final mesh is shown in Figure 2.

Table 2.
Mesh independence verification.
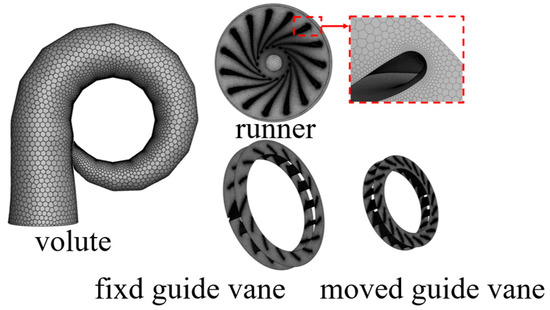
Figure 2.
Mesh generation of computational domain.
The commercial software Fluent was used to perform numerical simulations of the solid–liquid two-phase flow inside the turbine based on the CFD-DPM coupled model. The realizable k-ε model was adopted to close the Navier–Stokes equations. Compared with the standard k-ε model, its advantage is higher prediction accuracy for swirling flows, flows with strong adverse pressure gradients, and flows with highly curved streamlines, thereby providing a more reliable flow-field background for particle trajectory and wear calculations. Considering the curvature effect of the fluid in the rotating or bending channel, curvature correction is added in the simulation process. The computational domain boundary conditions were set as follows: The inlet was assigned a velocity inlet boundary condition to ensure that the particle and liquid phases had the same initial velocity, simulating the scenario where sediment particles enter the flow passage synchronously with the water flow. The outlet was set as a pressure outlet, and an escape boundary condition for the particle phase was applied at both the inlet and outlet. The fluid domain wall of the runner was defined as a rotating wall, with its rotational speed such that it remained relatively stationary with respect to the adjacent fluid domain. A no-slip boundary condition was used in the near wall region. Considering the sediment inflow conditions, the particles are relatively small and have low inertia; when they collide with the wall, they tend to rebound, so the surface boundary condition for each flow-passing component was set to reflect. The SIMPLE algorithm was used for the coupling of velocity and pressure. The Fubian River, where the Mupo Hydropower Station is located, is a secondary tributary of the Dadu River in the Yangtze River system. The river sediment is mainly derived from weathering and fragmentation of rocks, with mineral composition dominated by quartz and feldspar and a particle density of approximately 2650 kg/m3. Based on the multi-year average sediment concentration of 0.272 kg/m3 and the particle size range of 0.07–0.15 mm measured at the Shuangjiangkou Reservoir dam site, particle diameters of 0.05 mm, 0.10 mm, and 0.15 mm were selected for the numerical simulations.
3. Test Design
3.1. Variable Screening
The geometric parameters of the hydraulic turbine were taken as the research factors for the Plackett–Burman experimental design, with different levels set for each factor. The turbine head and efficiency were used as the indicators for ranking the factors with significant influences. The Plackett–Burman design enables significant factor screening with a number of experiments slightly greater than the number of factors to be investigated. To ensure the validity of statistical analysis, dummy factors need to be introduced into the design. Among them, dummy factors are not real physical parameters; their level settings must be consistent with the level range of real factors. They are mainly used to estimate random errors during the experiment and provide a statistical benchmark for the subsequent significance test of the effects of each real factor. If the effect of a real factor is significantly stronger than the error level represented by the dummy factors, it can be determined that the factor has a statistically significant impact on the response indicators.
Minitab 16 was used for experimental design and analysis, with dummy factors X1, X2, X3, X4, and X5 set as error references. Based on the experimental design in Table 3, the calculation results obtained are presented in Table 4.

Table 3.
The Plackett–Burman design matrix with dummy variables for screening significant factors.

Table 4.
Plackett–Burman test design results (head, efficiency, and wear rate).
As shown in Table 5, when evaluating the head index, the three most significant influencing factors are the number of blades, outlet setting angle, and wrap angle, with corresponding weights (W) of 34.8%, 27.2%, and 19.3%, respectively. When evaluating the efficiency index, the three most significant influencing factors are the number of blades, inlet setting angle, and outlet diameter, with corresponding weights of 39.6%, 24.7%, and 16.8%, respectively. When considering the wear rate index, the three most significant influencing factors are the outlet angle and the inlet angle, and their corresponding weights are 69.7%, 15.6%, and 5.8%, respectively.

Table 5.
Significance analysis of influencing factors on turbine performance.
From the perspective of comprehensive performance impact, the number of blades ranks first among the significant factors for both head and efficiency performance indicators, with weights as high as 34.8% and 39.6%, respectively, indicating that it exerts an overall and decisive influence on the hydraulic performance of the turbine. Meanwhile, it also exhibits a certain degree of significance in the abrasion rate indicator. The inlet setting angle and outlet setting angle are the most prominent parameters affecting the efficiency and abrasion rate models, respectively. The inlet setting angle accounts for 24.7% of the weight in the efficiency regression, reflecting its important role in controlling the flow matching at the runner inlet and hydraulic losses. In contrast, the outlet setting angle shows a significantly high weight of 69.7% in the abrasion rate model, far exceeding other parameters. Therefore, the number of blades, inlet setting angle, and outlet setting angle were selected as the design variables for subsequent response surface analysis and multi-objective optimization.
3.2. Response Surface Design
Based on Section 3.1, three significant factors affecting the comprehensive performance of the turbine are obtained: the number of blades, the inlet setting angle, and the outlet setting angle. The central composite design method is used to carry out the experimental design for each factor, as shown in Table 6.

Table 6.
Central composite design factor level code.
According to the experimental design scheme presented in Table 6, a total of 20 numerical calculation-based experiments were conducted, encompassing eight factorial points, six axial points, and six center points. The calculation results are summarized in Table 7.

Table 7.
Turbine runner test results.
3.3. Test Results
Through central composite design (CCD) experiments and response surface analysis (RSA), quadratic regression models for the head, efficiency, and wear rate of the hydraulic turbine with respect to the number of blades, inlet setting angle, and outlet setting angle were established:
Head regression equation:
Efficiency regression equation:
Wear rate regression equation:
To ensure the accuracy of the fitted multiple regression equations, a significance test was performed for each equation. In this study, the coefficient of multiple determination R2 and adjusted coefficient of multiple determination Radj2 from the correlation coefficient method were used as evaluation indicators; the closer their values are to 1, the better the fitting effect of the regression model. As shown in the regression analysis results in Table 8, the R2 values for the head, efficiency, and wear rate of the hydraulic turbine are all greater than 0.986, and the Radj2 values are all greater than 0.974. This indicates that the models exhibit excellent fitting performance and high prediction accuracy. Additionally, the Prob (P) > F values are all less than 0.01, demonstrating that the regression models are highly significant. In conclusion, the response surface models established in this study can effectively predict the performance indicators of the hydraulic turbine, and the regression equations can be applied to subsequent performance analysis and parameter optimization work.

Table 8.
Significance analysis results of regression equation.
4. Results and Analysis
4.1. Comprehensive Performance of Water Turbine
The performance curves of the hydraulic turbine under different particle densities are illustrated in Figure 3, where the operating point with a particle size of 0 represents the clear water condition without sediment particles. It can be observed that the head and efficiency of the hydraulic turbine decrease under all operating conditions, and the decrease in head and efficiency becomes more significant as the sediment particle size increases. When the particle size is 0.15 mm, the head decreases by 10.35% and the efficiency decreases by 4.72%.
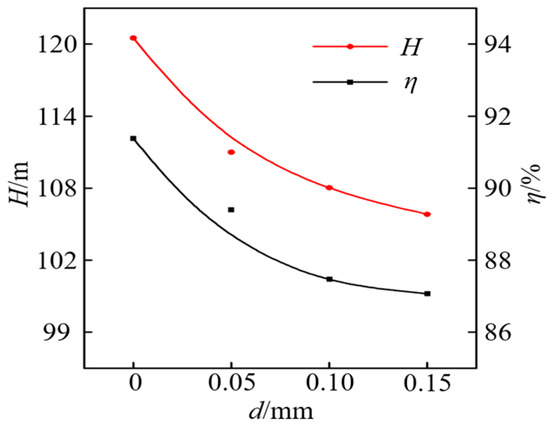
Figure 3.
Turbine performance curve under different particle density.
Figure 4 shows that under the working condition of particle density ρ s = 7500 kg/m3, the wear occurs mainly in the area near the upper crown of the pressure surface, there is almost no wear on the lower ring side, and only slight wear on the suction surface near the lower ring. This distribution can be explained by the coupling effect of particle motion and flow field. The CFD results show that the high-speed flow is mainly concentrated in the upper crown area, which may be the main reason for the particles being trapped there and causing high-frequency impact wear of the pressure surface. The flow velocity in the lower ring region is relatively low, and the particles are difficult to migrate to this region under the constraint of centrifugal force and flow channel, resulting in the reduction of impact wear.
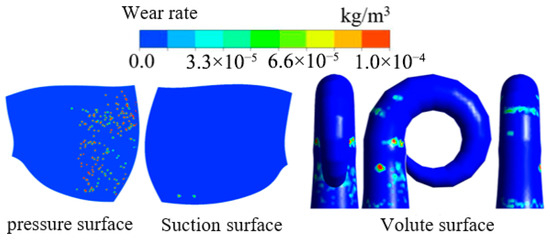
Figure 4.
Cloud chart of wear distribution under particle size of 0.15 mm.
4.2. Interaction Between Runner Parameters
Select the influence function at the level of control variable 0, and the interaction between the corresponding turbine runner parameters is shown in Figure 5, Figure 6 and Figure 7. The selected parameters are turbine runner blade Z, inlet setting angle β 1, and outlet setting angle β 1, respectively. It can be seen from Figure 5a that with the increase of the number of blades and the inlet setting angle, the water head of the turbine increases first and then decreases. The combination of these two factors has a greater impact on the water head at low water levels, because low-level parameters lead to poor flow stability and low energy conversion efficiency in the runner, and small changes in parameters are amplified into violent fluctuations in the water head. It can be seen from Figure 5b that the decrease of the number of turbine blades and the increase of the outlet setting angle will increase the water head of the turbine. The increase of the outlet setting angle will increase the water head by changing the speed direction of the flow outlet, and the decrease of the number of blades will broaden the channel and reduce the flow loss. This confirms the balance logic of the turbine runner parameter design; that is, the higher the number of blades, the more stable it is, and the smaller the outlet setting angle is, the safer it is. It is necessary to find the optimal parameter combination. It can be seen from Figure 5c that compared with the combination of the number of blades and the inlet setting angle, and the combination of the number of blades and the outlet setting angle, the combination of the inlet and outlet setting angle has less impact on the water head. It can be considered that the number of blades is a significant factor determining the stability of the flow field, and its change can fundamentally change the control effect of sensitive factors on the water head of the turbine. The inlet/outlet setting angle is only a fine-tuning variable of energy conversion, and the effects of the two are easy to offset each other.

Figure 5.
Influence of interaction between runner parameters on turbine head.

Figure 6.
Influence of interaction between runner parameters on turbine efficiency.
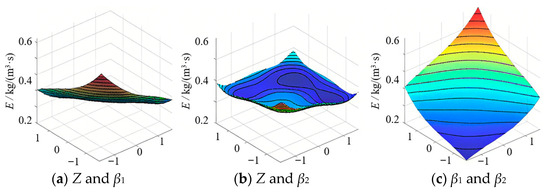
Figure 7.
Effect of interaction between runner parameters on runner wear.
As can be seen from Figure 6a, a low level of the number of blades and inlet setting angle significantly reduces the efficiency of the hydraulic turbine, whereas the combination of these factors has little impact on the turbine efficiency when they are at a high level. The reason for this phenomenon is that, at the low level, the synergistic effect of the two factors causes flow impact, flow separation, and other issues in the flow channel, leading to an increase in energy dissipation. In contrast, at the high level, the flow field is more stable, and the negative effects of parameter changes are suppressed. As illustrated in Figure 6b, when the number of blades is at a low level, the hydraulic turbine efficiency first increases and then decreases with the increase in the outlet setting angle. In the initial stage of increasing the outlet setting angle, the distribution of water flow outlet kinetic energy can be optimized and energy loss can be reduced. However, after exceeding the critical value, the insufficient number of blades results in weak flow channel constraints, and the disordered water flow leads to a decrease in efficiency. This indicates that the number of blades and the outlet setting angle need to be matched at a balanced level. It can be observed from Figure 6c that, compared with the combinations of “number of blades & inlet setting angle” and “number of blades & outlet setting angle”, the variation law of the efficiency affected by the combination of inlet and outlet setting angles is gentler, while the efficiency decreases significantly at the low level. This suggests that the synergistic effect of the inlet setting angle and outlet setting angle at the low level leads to an increase in inlet impact loss and outlet residual kinetic energy. However, at the medium and high levels, these two factors can only serve as auxiliary factors for the energy regulation of the hydraulic turbine.
It can be seen from Figure 7 that the combination of a low-level blade number and inlet setting angle will increase the wear rate of the runner; on the contrary, a low-level inlet setting angle and outlet setting angle will reduce the wear rate of the runner, while the synergistic effect of blade number and outlet setting angle has little effect on the wear performance of the turbine. The analysis of the flow field structure shows that when the number of blades is at a low level, the restriction ability of the runner to the flow is weakened, and the flow field shows a stronger vortex structure and reflux area, which usually means that the stability of the flow field is reduced, and it is easy to induce vortex and reflux. At this time, if the inlet setting angle is also at a low level, it will further aggravate the front impact and flow separation of the inlet water flow on the blade head, resulting in serious cavitation erosion and wear on the blade inlet edge and pressure surface. When the inlet and outlet installation angles are at a low level, the flow of water in the whole runner is relatively smooth, the inlet impact is weakened, and the angle between the outlet velocity direction and the blade bone line is small, which avoids the wear and cavitation caused by water diffusion in the outlet area, so the overall wear rate of the runner is reduced. As the combination of the number of blades and the outlet setting angle has no significant effect on wear, it may be that the change of the outlet setting angle has more impact on the kinetic energy distribution and swirl intensity at the outlet of the water flow. Although the channel constraint is weak when the number of blades is insufficient, the adjustment of the outlet angle is not enough to significantly change the developed flow pattern structure, so it has no systematic impact on the wear behavior of the runner wall.
In conclusion, the interaction among the number of runner blades, inlet setting angle, and outlet setting angle of the hydraulic turbine exerts a significant impact on the turbine performance. The number of blades is the dominant factor determining flow field stability and energy conversion efficiency, and its variation remarkably alters the regulatory effects of other parameters on the head and efficiency. In contrast, the inlet and outlet setting angles mainly act as fine-tuning variables for energy conversion: their synergistic effect leads to a significant decline in performance at the low level, while their impact is relatively moderate at the medium and high levels.
4.3. Optimization of Turbine Wear Performance
Taking the runner wear amount as the main evaluation index, the head was simultaneously set as the constraint condition. Under this constraint, the regression equations of wear amount and efficiency were solved simultaneously. On the premise that the hydraulic turbine head is not lower than the original efficiency, the factor values that minimize the wear amount were obtained, with the specific parameter values being number of blades Z3 = 17, inlet setting angle = 65°, and outlet setting angle = 22°.
Figure 8 presents a comparison of the runner blade wear conditions before and after the optimization of runner parameters, under the conditions of a particle density ρs = 2650 kg/m3 and a particle size of 0.15 mm. After optimization, the wear degree of the hydraulic turbine runner blades is significantly reduced, and the number of wear areas on the runner pressure surface is notably decreased. Furthermore, the wear areas gradually converge toward the side of the upper crown on the pressure surface. This phenomenon can be attributed to the increased number of blades, which enhances the runner’s ability to constrain the water flow and suppresses the eddies, flow separation, and backflows that are prone to occur when the number of blades is low. Consequently, the overall flow field becomes more stable.
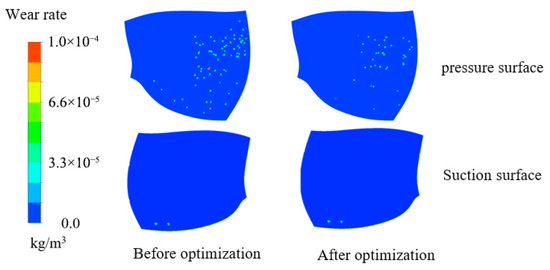
Figure 8.
Comparison of runner wear before and after optimization.
Figure 9 shows the comparison of the wear amount of the whole turbine/runner before and after optimization under the particle density ρ s = 2650 kg/m3 and the particle size of 0.15 mm. It can be seen that the wear in the optimized runner is reduced by 32.3%. Although the inlet setting angle is reduced, the increase of the number of blades Z significantly enhances the stability of the flow field, improves the flow conditions, and reduces the impact and wear of particles on the blade wall.
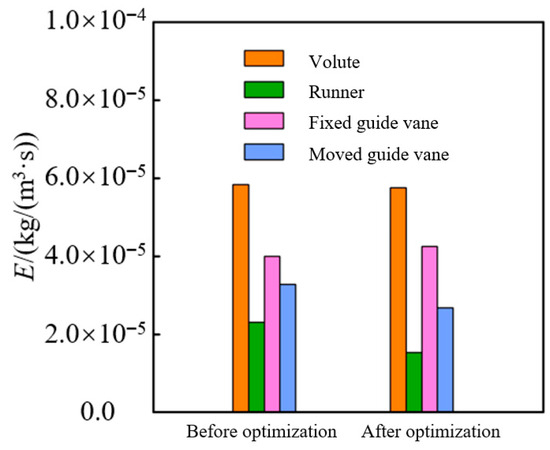
Figure 9.
Comparison of wear amount before and after optimization.
5. Conclusions
(1) By combining the Plackett–Burman design method with game theory, the three most significant parameters affecting the hydraulic performance and wear performance of the hydraulic turbine were identified; namely, the number of runner blades, inlet setting angle, and outlet setting angle.
(2) The interaction between runner parameters exerts a significant impact on the comprehensive performance of the hydraulic turbine, with considerable differences in the interaction effects among various factors. A larger number of blades can significantly improve the flow field stability, while the inlet and outlet setting angles mainly function as fine-tuning variables for energy distribution. Studies have shown that there exists a certain restrictive relationship between the optimization of the hydraulic turbine’s hydraulic performance and the minimization of wear amount. To achieve the optimization goal of minimizing the hydraulic turbine’s wear amount, the optimal parameters lie in the central region of the design space.
(3) Considering the interaction between the hydraulic turbine runner parameters, the optimal parameter combination ensuring hydraulic performance not lower than that of the original model was obtained by solving the multiple regression equations, specifically number of blades Z3 = 17, inlet setting angle = 65°, and outlet setting angle = 22°. After optimization, the wear resistance of the hydraulic turbine is significantly improved. Under the common operating conditions of a particle size of 0.15 mm and a particle density ρs = 2650 kg/m3, the overall wear amount of the hydraulic turbine is reduced by 28.5%, among which the wear amount of the runner is reduced by 32.3%. At the same time, the optimized runner achieves a head of 120.5 m and an efficiency of 89.8% under these conditions. This indicates that the optimization not only achieved the primary goal of wear reduction but also slightly improved the hydraulic performance.
(4) The core function of this optimization scheme lies in achieving a better balance between flow field stability and energy conversion efficiency through the collaborative design of multiple parameters, thereby providing a clear direction for anti-abrasion technical transformation of hydropower stations on sediment-laden rivers. In terms of operation and maintenance, it can significantly extend the overhaul cycle and reduce maintenance costs while ensuring water head. In terms of manufacturing and transformation, the optimal parameters fall within the scope of conventional design. For existing units, the transformation can be implemented merely by replacing the runner, featuring high feasibility. Future research will focus on experimental verification, robust optimization, and life cycle economic analysis.
Author Contributions
Conceptualization, Y.X. and S.W. (Sheng Wang); methodology, S.W. (Sheng Wang); software, Y.X.; validation, Y.X., S.W. (Senxiong Wang), and B.Y.; formal analysis, L.R.; investigation, X.L.; resources, S.W. (Sheng Wang); data curation, D.C.; writing—original draft preparation, Y.X.; writing—review and editing, Y.X. and G.S.; visualization, S.W. (Senxiong Wang); supervision, Y.X.; project administration, Y.X. and G.S.; funding acquisition, Y.X. All authors have read and agreed to the published version of the manuscript.
Funding
This research received no external funding.
Data Availability Statement
The data that support the findings of this study are available from the corresponding author upon reasonable request.
Acknowledgments
The author thanks all the staff for their contributions to this article.
Conflicts of Interest
The authors declare no conflicts of interest. Authors Yulin Xue and Sheng Wang were employed by Power China Hydropower Development Group Co., Ltd. (Affiliation 1). Authors Bingquan Yang, Liangjun Ren, Xin Liu, Senxiong Wei, and Daojin Cai were employed by Aba Hydropower Development Co., Ltd. (Affiliation 2). Author Guangtai Shi (Affiliation 3) declares no affiliation with any company. The remaining authors (explicitly referring to those not affiliated with companies, i.e., Guangtai Shi) declare that the research was conducted in the absence of any commercial or financial relationships that could be construed as a potential conflict of interest.
References
- Chen, G.; Wang, X. Global hydropower development trend and China’s role in context of carbon neutrality. J. Hydroelectr. Eng. 2024, 43, 1–11. [Google Scholar] [CrossRef]
- Qian, Z.; Zhao, Z.; Guo, Z.; Thapa, B.S.; Thapa, B. Erosion wear on runner of francis turbine in jhimruk hydroelectric center. J. Fluids Eng. 2020, 142, 111402. [Google Scholar] [CrossRef]
- Gautam, S.; Neopane, H.P.; Acharya, N.; Chitrakar, S.; Thapa, B.S.; Zhu, B. Sediment erosion in low specific speed francis turbines: A case study on effects and causes. Wear 2020, 442–443, 203055. [Google Scholar] [CrossRef]
- Tian, C.; Yuan, S.; Wang, J.; Liu, X. Numerical simulation of internal flow in turbine runner of hydropower station in sediment-laden river. Water Resour. Power 2020, 38, 160–163. [Google Scholar]
- Peng, G.; Wang, Z.; Xiao, Y.; Luo, Y. Abrasion predictions for francis turbines based on liquid-solid two-phase fluid simulations. Eng. Fail. Anal. 2013, 33, 327–335. [Google Scholar]
- Liu, X. Study on turbulent solid-liquid two-phase flow and erosion in hydraulic turbomachinery. Chin. J. Hydrodyn. 1996, 11, 606–609. [Google Scholar]
- Liao, J.; Lai, X.; Zhang, X. Effects of sediment diameter and concentration on internal flow field in runner of Francis turbine. J. Hydroelectr. Eng. 2017, 36, 75–81. [Google Scholar]
- Basar, G.; Der, O. Multi-objective optimization of process parameters for laser cutting polyethylene using fuzzy AHP-based MCDM methods. Proc. Inst. Mech. Eng. Part E: J. Process Mech. Eng. 2025, 239, 2295–2309. [Google Scholar] [CrossRef]
- Ren, X.; Fan, J.; Pan, R.; Sun, K. Modeling and process parameter optimization of laser cutting based on artificial neural network and intelligent optimization algorithm. Int. J. Adv. Manuf. Technol. 2023, 127, 4321–4335. [Google Scholar] [CrossRef]
- Khanal, K.; Neopane, H.P.; Rai, S.; Thapa, B. A methodology for designing Francis runner blade to find minimum sediment erosion using CFD. Renew. Energy 2015, 87, 307–316. [Google Scholar]
- Baidar, B.; Chitrakar, S.; Koirala, R.; Thapa, B. Selection of optimal number of Francis runner blades for a sediment laden micro hydropower plant in Nepal. Int. J. Fluid Mach. Syst. 2015, 8, 294–303. [Google Scholar] [CrossRef]
- Thapa, B.S.; Thapa, B.; Eltvik, M.; Gjosater, K.; Dahlhaug, O.G. Optimizing runner blade profile of Francis turbine to minimize sediment erosion. IOP Conf. Ser. Earth Environ. Sci. 2012, 15, 032052. [Google Scholar] [CrossRef]
- Wang, X.P. Study on Genetic Algorithm and Its Application in Aerodynamic Optimization Design. Doctoral Dissertation, Northwestern Polytechnical University, Xi’an, China, 2005. [Google Scholar]
- Aponte, R.; Teran, L.; Grande, J.; Lain, S. Minimizing erosive wear through a CFD multi-objective optimization methodology for different operating points of a Francis turbine. Renew. Energy 2020, 145, 2217–2232. [Google Scholar] [CrossRef]
- Manjunath, K.; Singh, R.; Yadav, D.D. Non-Dimensional Parametric Optimisation of Hydraulic Performance of Centrifugal Pump using Response Surface Analysis. Prog. Comput. Fluid Dyn. 2025, 25, 1–15. [Google Scholar]
- Gan, X.; Pei, J.; Wang, W.; Yuan, S.; Tang, Y. Multi-component optimization of a vertical inline pump based on multi-objective PSO and artificial neural network. J. Mech. Sci. Technol. 2020, 34, 4883–4896. [Google Scholar] [CrossRef]
- Wang, W.; Osman, M.K.; Pei, J.; Gan, X.; Yin, T. Artificial neural networks approach for a multi-objective cavitation optimization design in a double-suction centrifugal pump. Processes 2019, 7, 246. [Google Scholar] [CrossRef]
- Romelin, C.; Zahedi; Nusantara, B.C. Comparative Analysis of Response Surface Methodology (RSM) and Taguchi Method: Optimization Hydraulic Ram Pump Performance. Oper. Res. Forum 2024, 5, 59. [Google Scholar] [CrossRef]
- Salins, S.S.; Kumar, S.; Reddy, S.V.K. Parametric study and optimisation of operating parameters of a centrifugal humidifier using response surface methodology. Cogent Eng. 2024, 11, 2381274. [Google Scholar] [CrossRef]
- Han, X.; Kang, Y.; Sheng, J.; Hu, Y.; Zhao, W. Centrifugal pump impeller and volute shape optimization via combined NUMECA, genetic algorithm, and back propagation neural network. Struct. Multidiscip. Optim. 2020, 61, 381–409. [Google Scholar] [CrossRef]
- Cui, B.; Chen, H.; Zhu, Z.; Sun, L.; Sun, L. Optimization of low-temperature multi-stage submersible pump based on blade load. Phys. Fluids 2024, 36, 051906. [Google Scholar] [CrossRef]
- Modroiu, A.; Marzullo, L.; Orlandini, S.; Gotti, R.; Hancu, G.; Furlanetto, S. Analytical quality by design-based development of a capillary electrophoresis method for Omeprazole impurity profiling. J. Pharm. Biomed. Anal. 2024, 250, 116295. [Google Scholar] [CrossRef] [PubMed]
Disclaimer/Publisher’s Note: The statements, opinions and data contained in all publications are solely those of the individual author(s) and contributor(s) and not of MDPI and/or the editor(s). MDPI and/or the editor(s) disclaim responsibility for any injury to people or property resulting from any ideas, methods, instructions or products referred to in the content. |
© 2025 by the authors. Licensee MDPI, Basel, Switzerland. This article is an open access article distributed under the terms and conditions of the Creative Commons Attribution (CC BY) license (https://creativecommons.org/licenses/by/4.0/).