Abstract
To address the collaborative optimization challenge in multi-microgrid systems with significant renewable energy integration, this study presents a dual-layer optimization model incorporating power-hydrogen coupling. Firstly, a hydrogen energy system coupling framework including photovoltaics, storage batteries, and electrolysis hydrogen production/fuel cells was constructed at the architecture level to realize the flexible conversion of multiple energy forms. From a modeling perspective, the upper-layer optimization aims to minimize lifecycle costs by determining the optimal sizing of distributed PV systems, battery storage, hydrogen tanks, fuel cells, and electrolyzers within the microgrid. At the lower level, a distributed optimization framework facilitates energy sharing (both electrical and hydrogen-based) across microgrids. This operational layer maximizes yearly system revenue while considering all energy transactions—both inter-microgrid and grid-to-microgrid exchanges. The resulting operational boundaries feed into the upper-layer capacity optimization, with the optimal equipment configuration emerging from the iterative convergence of both layers. Finally, the actual microgrid in a certain area is taken as an example to verify the effectiveness of the proposed method.
1. Introduction
With the continual expansion of the world economy, problems of finite energy supplies and environmental damage have become prominent international concerns necessitating immediate shifts in energy paradigms. Compared to traditional fossil fuel-based power generation, distributed generation technologies—primarily reliant on wind and photovoltaic energy—are noted for their high efficiency and environmental friendliness [1,2], and have therefore been widely adopted. In response to the challenges associated with the grid integration of distributed energy resources, the concept of microgrids has been proposed by researchers [3,4].
An effective and rational capacity allocation for each component within a microgrid constitutes a fundamental aspect of the planning and design phase. This approach is crucial for maintaining system reliability and security, while simultaneously reducing capital expenditures and optimizing operational efficiency. In recent years, extensive research efforts have been devoted to the capacity sizing of microgrids. For instance, Reference [5] proposes a microgrid capacity configuration method based on sensitivity analysis, considering the relationship between the sensitivity of wind/solar/diesel/storage and the total cost of the microgrid, to obtain the optimal configuration scheme for capacity optimization. Reference [6] accounts for the heterogeneous characteristics of distributed energy resources (DERs), energy storage mechanisms, and load dynamics, and proposes a hybrid energy storage-configuration framework tailored to mitigating load fluctuations, particularly the peak-to-valley disparity. Reference [7] integrates energy storage units into existing distributed photovoltaic systems to form a grid-connected PV-storage microgrid. A demand response model is introduced to optimize the energy storage configuration, where a hybrid integer programming approach combined with an enhanced particle swarm algorithm is employed to solve the demand-side management process. The study further evaluates the impact of demand response on microgrid economic performance and storage capacity planning. Reference [8] investigates demand-side management strategies for shiftable loads (e.g., seawater desalination) under power supply reliability constraints. A chaotic free search algorithm is adopted to solve the optimal distributed generation capacity configuration problem in microgrids, with analysis on load-shifting strategy effects. It formulates a comprehensive capacity optimization model that combines wind, solar, diesel, and energy storage units with desalination loads, balancing both economic viability and environmental sustainability. The feasibility and performance of the proposed model are substantiated through simulation validation.
From the preceding analysis, it is evident that most current studies on microgrid capacity optimization concentrate on the coordinated deployment of renewable energy sources—such as wind and photovoltaic systems—alongside diesel generators and conventional battery storage technologies. In contrast, the exploration of hydrogen-based energy storage within microgrid frameworks remains relatively underdeveloped. Nonetheless, hydrogen stands out due to its environmentally friendly nature, high energy conversion efficiency, and superior energy density. Integrating hydrogen with traditional electric energy systems facilitates enhanced energy cascade utilization and boosts overall energy efficiency. As such, investigating hybrid energy storage microgrid capacity planning that incorporates electric–hydrogen synergy is of considerable research value. Reference [9] proposed a wind/solar/storage grid-connected microgrid structure of hydrogen-containing energy storage and a battery hybrid energy storage system, overcoming the shortcomings of the high cost and short life of the traditional single energy storage system of storage batteries. Based on the hybrid energy storage system of hydrogen energy storage microgrid proposed in Reference [9], and based on the rapid estimation method, the different response times of electricity and hydrogen energy storage systems in hydrogen energy storage systems are considered, and the capacity of the microgrid system is optimized according to the weather and load conditions. Reference [10], based on a fast estimation method, considers the different response times of the electrical and hydrogen storage systems in a microgrid with hydrogen energy storage, and optimizes the capacity configuration of the microgrid system according to actual weather and load conditions. Reference [11] optimizes island microgrids containing hydrogen energy storage based on carbon emissions and maximum capacity. Reference [12] proposed a new island microgrid energy management method based on electricity–hydrogen coupling, which minimizes the use cost of energy storage equipment by controlling the working state of each energy storage system and maintains the energy storage state of the energy storage system at a reasonable level, so as to achieve stable system operation. Reference [13], in view of the high energy transportation cost and serious pollution emissions from fossil fuel units on remote islands, established a dual-layer capacity planning model for reversible solid oxide batteries with electric heating and hydrogen coupling isolated island microgrids based on different working conditions. Considering the uncertainty of source and load, the stochastic scenario is generated, and the capacity planning decision of the island microgrid equipment is combined with the typical daily operation scheduling, and the whale optimization algorithm and CPLEX solver are used to solve the two-layer model, which proves that the power–hydrogen coupling programming model of the island microgrid can effectively improve the economy and flexibility of the operation of the island microgrid.
In recent years, extensive research has been carried out both domestically and internationally on the coordinated optimization of distribution systems and microgrids. Scholars have studied the method of distribution microgrid collaboration from the perspective of transactions, that is, the distribution grid guides the power demand of microgrids through electricity prices [14,15]. Some scholars have also proposed a collaborative optimization scheduling method for distribution microgrids based on flexible operating domains from a domain perspective [16]. Reference [17] considers the connection of microgrids through dedicated interconnection lines and proposes a flexible grouping-based coordinated scheduling method for microgrids. Some scholars have further studied the impact of peer-to-peer (P2P) transactions between multiple microgrids on micro collaboration based on micro collaboration [18,19]. However, the above studies are all based on fixed topology structures and do not consider the impact of network reconstruction. The distribution network can optimize power flow distribution through network reconstruction, further improving operational efficiency [20]. Due to the external costs brought by P2P transactions between multiple microgrids to the distribution network, microgrids need to pay network fees to the distribution network [21]. However, network reconstruction will affect the electrical distance between microgrids, which in turn affects the network fees for P2P transactions. Reference [22] did not include network fees in the revenue of the distribution network and used Dijkstra’s algorithm to calculate the shortest electrical distance after topology changes. Reference [23] proposes a cross-network fee accounting mechanism suitable for dynamic topology, which integrates the cross-network fee mechanism into the distribution network optimization model. In addition, the above research only considers the guiding effect of network reconstruction on P2P transactions, ignoring the role of electricity prices. Most existing electric–hydrogen coupling models only consider the hybrid energy storage operation architecture of electric–hydrogen coupling systems, without considering the operation and maintenance balance of hydrogen energy and constructing a trading model between hydrogen energy and the outside world.
To overcome these limitations, this study develops a coordinated planning framework for electricity–hydrogen integrated multi-microgrid systems. First, the operational characteristics of hydrogen energy storage systems are analyzed, and the coordinated operating mechanism between hydrogen storage and distributed power generation is elaborated. Furthermore, by considering the interactive operation between electric and hydrogen energy systems across multiple microgrids, an optimal configuration model for wind–solar-based multi-microgrids incorporating electricity–hydrogen coupling is established. This model is then compared with traditional microgrid capacity optimization scenarios to analyze and evaluate the operational modes and economic performance of the microgrids.
2. Microgrid Architecture with Electric–Hydrogen Coupling
2.1. Mathematical Modeling of Electro-Hydrogen Coupling System in Microgrid
The proposed hybrid system model (electrolyzer/storage tank/fuel cell) represents essential infrastructure for realizing bidirectional electricity–hydrogen energy conversion. Due to the stable operation of alkaline electrolytic cells under high voltage, high current density, low voltage, and the lower unit hydrogen production cost of alkaline electrolytic cells compared to proton exchange membrane electrolytic cells, alkaline electrolytic cells were selected in this article [14]. The electric–hydrogen coupling unit has the same energy storage function as the battery, that is, under sufficient wind and photovoltaic resources, when the battery has no excess capacity to store excess new energy output power, the alkaline electrolysis cell can convert excess electrical energy from the system into hydrogen gas. The generated hydrogen is subsequently stored within a dedicated hydrogen storage tank. During renewable energy shortfalls where wind and photovoltaic output cannot satisfy load demands, the stored hydrogen is electrochemically converted back to electricity through fuel cells to guarantee uninterrupted power delivery.
- (1)
- Component models of the hydrogen energy storage system
The alkaline electrolyzer, which facilitates the electrochemical decomposition of water into hydrogen and oxygen using electrical energy, serves as a key component in the power-to-gas conversion process. Its electrical power consumption—or equivalently, its output power in terms of hydrogen production—can be quantitatively described by the following expression:
Let PELE denote the electrical power input to the electrolyzer, HELE represent the equivalent hydrogen power output, and αELE indicate the conversion efficiency of the electrolysis process.
This study employs a proton exchange membrane fuel cell (PEMFC) model for hydrogen-to-power conversion. During periods of renewable energy deficit, the PEMFC utilizes stored hydrogen from the tank to electrochemically generate electricity, thereby compensating for the shortfall in load supply. The output power of the PEMFC is given by:
Let PFC represent the fuel cell’s electrical power output, HFC (kW equivalent) denote the hydrogen consumption rate, and βFC express the system’s electrochemical conversion efficiency.
The hydrogen storage tank functions as a buffer system, storing hydrogen gas produced via alkaline water electrolysis and supplying it to hydrogen fuel cells when needed, thereby enhancing the operational flexibility and reliability of the microgrid. The dynamic behavior of the hydrogen storage process can be described through the following mathematical model:
where EHS.t is the hydrogen storage capacity of the hydrogen storage tank at time t; zeta is the hydrogen charging and discharging efficiency of the hydrogen storage tank; Δt is the time step; Hch.t represents the hydrogen charging power at time t; and the variable Hdis.t quantifies the instantaneous hydrogen-to-power conversion capacity during discharge operations.
- (2)
- Control strategy for the electric–hydrogen coupling operation
The system preferentially channels renewable energy overproduction into battery charging when instantaneous supply outstrips demand. If the hydrogen storage tank has available capacity and its internal pressure conditions permit, the remaining excess energy is utilized to produce hydrogen via an alkaline electrolyzer, which is then stored for later use. Conversely, during periods when the renewable energy generation falls short of the load requirements, the battery system discharges to bridge the initial power gap. If the battery output remains insufficient, hydrogen stored in the tank is subsequently supplied to hydrogen fuel cells to generate electricity and compensate for the residual power deficit. This coordinated dispatch strategy ensures efficient energy utilization and enhances the overall stability of the microgrid.
As formulated in Formula (4), the electrolyzer’s hydrogen output bifurcates into storage allocation and external commercialization, while the fuel cell’s hydrogen input derives from both inventory withdrawal and external procurement. The hydrogen power balance constraint can be obtained by subtracting Formula (4) from the top and bottom.
The permissible operating range for hydrogen power flows satisfies the following:
where Hint is the maximum value that the hydrogen charging and discharging power can reach, and there is a linear relationship between Hint and the hydrogen storage tank capacity, as shown in Formula (7). Uht.t is the hydrogen charging and discharging state variable at time t and is a Boolean variable.
2.2. Microgrid System with Electric–Hydrogen Coupling and Its Collaborative Optimization Architecture
2.2.1. Structure Topology of Microgrid System with Electric–Hydrogen Coupling
As shown in Figure 1, the multi-microgrid system constructed in this paper considers the interactive operation mode of electric energy and hydrogen energy between multiple microgrids according to the microgrid electro-hydrogen coupling operation architecture, and constructs a multi-microgrid photovoltaic storage optimal configuration model with electricity–hydrogen coupling. Through the energy complementary operation mode of the multi-microgrid system, the multi-energy interaction is realized to meet the load demand between different microgrids.

Figure 1.
Microgrid system with electric–hydrogen coupling and its co-optimal architecture topology.
As illustrated in Figure 1, the proposed multi-microgrid collaborative optimization framework transcends the operational constraints of individual microgrid systems by establishing a bidirectional energy exchange network encompassing both electricity and hydrogen. This is achieved through an integrated electricity–hydrogen coupling mechanism, enabling multi-energy coordination across interconnected microgrids. The model fully exploits the inherent flexibility of the microgrid operation, thereby enhancing the overall responsiveness and adaptability of the system. Notably, it significantly strengthens the multi-microgrid system’s capability for dynamic energy scheduling, mutual support, and complementary energy utilization.
2.2.2. Mathematical Modeling of Collaborative Optimization for Microgrid System with Electric–Hydrogen Coupling
Define Pij.t to represent the electric power purchased by microgrid j from microgrid i during period t, Hij.t to represent the hydrogen power purchased by microgrid i from microgrid j during period t. The power balance constraint governing microgrid i’s participation in the multi-microgrid coalition can be mathematically represented as:
where the instantaneous grid power procurement for microgrid i is defined as Pbuy.i.t, Psell,i.t denotes the power export from microgrid ii to the main grid at time t. The hydrogen commercialization rate of microgrid i represents its power-equivalent hydrogen exports Hbuy.i.t, and Hsell.i.t represents the hydrogen power sold to the outside by microgrid i per unit time. Let PPV,i.t denote the time-dependent photovoltaic power generation in microgrid i. The predicted power demand for microgrid ii, estimated via historical load profiling, is expressed as Pl.i.t.
The constraint of electric interaction power between the microgrid and distribution network is represented as:
Let Pgrid.max denote the maximum permissible power transfer capacity of the grid interconnection, let Ugrid.t ∈ {0,1} denote the binary state variable indicating whether microgrid i is engaged in the power exchange (purchase/sale) with the distribution network at time t.
The constraints on hydrogen–power interactions between the microgrid and distribution network are represented as:
Let Hgrid.max denote the maximum allowable hydrogen injection capacity of the transmission infrastructure, Uhto.t is the state variable of hydrogen purchase and sale power between the ith microgrid and the distribution network during t period, and is a Boolean variable.
The constraint conditions of electric power and hydrogen power interactions between the microgrids are represented as:
3. Establishment of a Multi-Microgrid PV-Storage Two-Layer Optimal Configuration Model Coupled with Electricity and Hydrogen
3.1. Double-Layer Optimal Configuration Model of Wind–Solar-Storage for Multi-Microgrid with Electricity–Hydrogen Coupling
As illustrated in Figure 2, this paper proposes a two-level optimization model. The upper level focuses on capacity configuration, aiming to minimize the total investment and operational costs of the microgrid. It optimizes the capacity allocation of electrolyzers, hydrogen fuel cells, photovoltaic modules, battery storage systems, and hydrogen storage tanks. The lower level is the operational layer, which seeks to maximize the daily operational revenue of the microgrid. Based on the optimal equipment capacities determined by the upper level, it performs daily operation simulations to derive the optimal operational strategy. The maximum daily return calculated by the lower level is fed back to the upper level as a lower-bound constraint. The upper level then adjusts the configuration scheme based on the feedback, and the process iterates until convergence is achieved, ultimately resulting in the optimal capacity configuration and operation strategy.
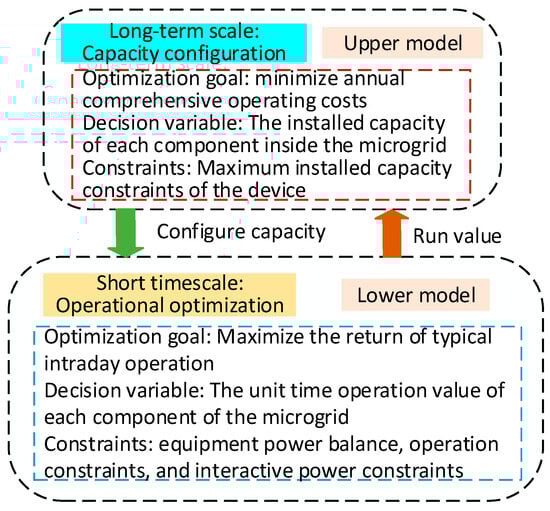
Figure 2.
Double-layer model within a microgrid.
3.2. An Optimal Configuration Model of Wind, Solar, and Reservoir in a Multi-Microgrid with Electric–Hydrogen Coupling
The two-level optimization framework proposed in this study comprises an upper-level capacity planning layer, which is primarily responsible for the optimal sizing of critical components within the microgrid. The decision variables in this layer encompass the installed capacity of photovoltaic arrays, the rated power of electrolyzers and hydrogen fuel cells, and the storage capacities of both hydrogen tanks and battery systems. The overarching objective is to minimize the total life-cycle cost of the microgrid system, incorporating both the initial capital expenditures and recurring operation and maintenance (O&M) costs. This layer ensures system reliability while achieving an economically optimal configuration of energy assets.
3.2.1. Upper-Level Objective Function
Cint.i is annualized capital expenditure for microgrid i, Com.i is recurring operational expenditures for microgrid i.
- (1)
- Cost of investment
- (2)
- The expression for the operating cost Cope.i is:
Ω1 represents the set of seasons, Tn represents the number of typical days in season n. Let Com.i denote the total operational expenditure of microgrid i, encompassing generation, maintenance, and transaction costs, let Cgrid.i denote the net cost of electricity transactions (purchases minus sales) between microgrid i and the main grid. Cgrid.ht.i represents the cost of purchasing and selling hydrogen for the ith microgrid.
where com.w is the operation and maintenance cost coefficient of w elements, Pom.w.i represents the operating power of the ith microgrid with elements, and λ is the maintenance proportionality coefficient. ΔPdu.cut.i.t is the amount of industrial load reduction, and adu and bdu are the compensation coefficients of industrial load reduction. Pdu.i.t is the original industrial load, Pdu.dr.i.t is the industrial load after participating in the load demand response, and Pdu.i.t is the industrial load.
3.2.2. Upper-Level Constraint Condition
Affected by site and economic factors, the constraint conditions of each piece of equipment shall meet the following formula:
Ebat.max.i, PPV.max.i, PELE.max.i, PFC.max.i, EHS.max.i, and PWT.max.i represent the maximum values of electrochemical energy storage, photovoltaic, electrolytic cell, hydrogen storage tank, and wind turbine of the ith microgrid after lower model calculation. Emax.bat, Pmax.PV, Pmax.WT, Pmax.ELE, Pmax.FC, and Emax.HS represent the maximum values of installed capacity of electrochemical energy storage, photovoltaic, wind turbine, electrolytic cell, and hydrogen storage tank, respectively.
3.3. An Optimal Configuration Model of Wind, Solar, and Reservoir Layers in a Multi-Microgrid with Electric–Hydrogen Coupling
In the two-layer optimization framework, the lower operation layer aims to maximize the daily operating revenue of the microgrid. Based on the optimal equipment capacity optimized by the upper configuration layer, the layer calculates the optimal operation strategy and determines the typical daily operation scenario to maximize revenue. Subsequently, the key parameters of the optimal scenario (such as the maximum return value) will be fed back to the upper-level model as constraints, and the overall system optimization will be achieved through a two-way iterative calculation.
The microgrid’s operating income is largely generated through the optimized internal consumption of green energy, facilitated by the synergistic combination of PV generation and hydrogen storage technology. Additional revenue is generated through electricity market transactions, including the sale of surplus electricity to the grid and participation in energy trading markets. Electrolyzers are employed to produce and store hydrogen, which can be sold profitably during periods of high hydrogen energy demand.
3.3.1. Lower-Level Objective Function
3.3.2. Lower-Level Constraint Condition
Lower constraints in the power balance constraints and energy interaction constraints were mentioned in the previous chapter, the following is the lower decision variable upper and lower limit constraints and battery power constraints.
- (1)
- Battery restraint
The reserve Ebat.i.t of the storage battery of the ith microgrid at time t is related to the charging power Pch.i.t at time t and the discharging power Pdis.i.t at time t, and can be expressed as:
where η is the charge/discharge rate of the battery, Δt is the time step, and Xloss represents the power loss rate.
Charge and discharge constraints for stored energy can be expressed as:
The variables Pdis.i.t and Pch.i.t represent the discharging and charging power of the energy storage system during time period t. Equation (23) shows the relationship between the maximum charging and discharging power of the battery and the capacity of the battery. The parameter Pbat.max.i defines the maximum allowable charging and discharging power for the energy storage system. μ is the fixed scaling coefficient of the upper limit of the stored power and the capacity. Ubat.i.t is the state variable of the stored charge and discharge power and is a Boolean variable.
The state of charge, SOC.t, of the battery at time t can be expressed by the reserve and battery capacity Ebat.int.i as:
- (2)
- Decision variable upper and lower bound constraints
The hydrogen storage tank’s maximum and minimum capacity limits are defined by Eht.max.i and Eht.min.i, respectively, where Eht.max.i = 0.8Eht.int.i, Eht.min.i = 0.2Eht.int.i [8], PPV_i.t and PWT_i are the output prediction data of the ith microgrid photovoltaic cell, SOCmin and SOCmax define the permissible operating range for the battery’s charge level.
3.4. Solution of Optimal Configuration Model for the Wind–Solar-Storage Double-Layer of a Multi-Microgrid with Electricity–Hydrogen Coupling
3.4.1. Run Constraint Linearization
Equations (6), (10), (11) and (23) all have non-convex non-linearization constraints, which need to be converted into linear constraints. Equations (10) and (11)’s constraints are transformed to:
where , , and represent the state variables of electrical energy interaction and hydrogen energy interaction, respectively, and M represents a maximum. Formulas (6) and (23) can be linearized as Formulas (28) and (29).
where M is a maximum, (t), (t), (t), and (t) are linear variables of the microgrid, and Uht(t) and Ubat(t) represent the state variables of hydrogen charging and discharging.
3.4.2. Two-Layer Model Solving Process
According to the content of Section 3.4.1, the non-convex and non-linear parts of the double-layer model are changed to linearization constraints, and the two-layer model is solved by using Yalmip and CPLEX solvers in MATLAB2022b. The solution process is divided into the following five steps. The specific flowchart is shown in Figure 3.
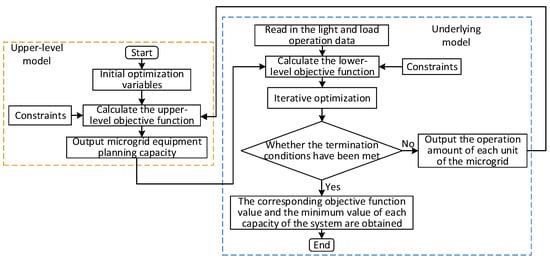
Figure 3.
Flowchart of the two-layer model calculation in the microgrid.
Step 1: The capacity of the microgrid equipment is initialized and assigned:
where Ppv.real.i, PWT.int.i, PELE.real.i, PFC.real.i, Ebat.real.i, and Eht.real.i represent the initial predicted values of PV, wind turbine, electrolyzer, hydrogen fuel cell, battery, and hydrogen storage tank, respectively.
Step 2: In the configuration layer, the capacity of photovoltaics, batteries, electrolyzers, hydrogen storage tanks, and fuel cells is determined with the goal of minimizing the internal cost of the microgrid, and the results of capacity determination are transported to the operation layer as the upper limit of operation.
Step 3: The capacity value calculated by the input configuration layer is used as the operating layer constraints and the predicted value of photovoltaic output load demand, and the typical daily operation of the microgrid is simulated with the goal of maximizing the income of the microgrid, and the results of each device operation are returned to the configuration layer.
Step 4: The maximum operating value of each device in the input operation layer is used as the lower limit of the capacity constraint of the configuration layer, and the configuration layer performs the device capacity again with the goal of lowest total cost of the microgrid, and returns the new capacity value to the operation layer to complete the first iteration.
Step 5: Repeat Step 2, Step 3, and Step 4 for multiple iterations. Each optimization target of the configuration layer is recorded as Ps(k), and each optimization target of the operation layer is Px(k)·|Ps(k) − Ps(k + 1)| < ε, |Px(k)Px(k + 1)| < σ, where σ and ε represent convergence thresholds of the configuration layer and operation layer. At this time, the solution result is the final capacity configuration result.
4. The Example Analysis
To assess the performance of the proposed approach, a practical distribution network located in the Shandong Province is selected as the case study. Within this network, three microgrids—each integrated with hydrogen energy storage systems—are interconnected with the main distribution system. The corresponding system topology is depicted in Figure 4, and the detailed system parameters are listed in Table 1. The simulation is conducted using the established microgrid capacity configuration model, with regional load demand and solar irradiance data serving as input parameters. The simulation time step, Δt, is set to 1 h.
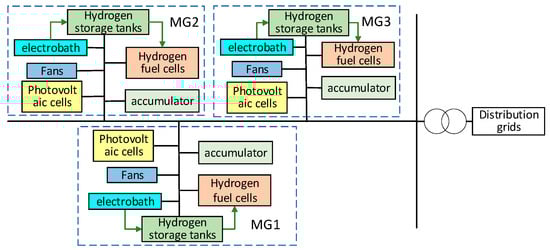
Figure 4.
Topology of three microgrid networks with electric–hydrogen coupling.

Table 1.
Parameter Settings.
Five distinct operational scenarios are examined in this study:
Scenario 1 involves the optimal capacity allocation for a single microgrid incorporating photovoltaic (PV), wind, and battery storage systems.
Scenario 2 investigates the optimal configuration of multiple microgrids based on conventional microturbine generation.
Scenario 3 extends Scenario 2 by introducing energy interaction and coordination among the multiple microgrids utilizing microturbines.
Scenario 4 replaces the traditional gas turbines in Scenario 2 with an optimized hydrogen-integrated configuration, comprising wind, solar, and storage elements within a single microgrid.
Scenario 5 further enhances Scenario 4 by implementing a coordinated operation across all microgrids, thereby establishing a two-layer optimization model for a hydrogen-enabled multi-microgrid system.
Among them, the peak electricity price period is 9:00–11:00 and 19:00–23:00, the electricity price is 1.35 CNY/kWh, the trough electricity price period is 24:00–8:00 and 12:00–18:00, and the electricity price is 0.48 CNY/kWh and 0.9 CNY/kWh, respectively.
4.1. The Configuration and Operation Results of the Microgrids
According to the optimization configuration method mentioned in this article, the final configuration scheme and operating results of the microgrid are obtained, as shown in Table 2 and Table 3.
Table 2.
Scenario 5 microgrid configuration results.
Table 3.
Comparison of microgrid operation results in five scenarios.
Analysis shows that in scenario 1, the revenue is the lowest compared to the other scenarios. In scenario 2, the cost and revenue increase significantly after the installation of gas turbines. In scenario 3, the cost decreases and the revenue increases significantly after the addition of multi-microgrid energy interactions compared to scenario 2. In scenario 4, the cost significantly decreases and the revenue slightly increases after the gas turbine is replaced with a hydrogen energy storage system. From this, it can be seen that hydrogen energy storage does not need to consider the fuel costs generated by burning fossil fuels compared to micro gas turbines, greatly reducing the annual operating costs of microgrids. Moreover, hydrogen energy storage can increase the annual operating revenue of microgrids through external transactions. Scenario 5 adds the interaction of electricity and hydrogen energy between multiple microgrids and sub microgrids on the basis of scenario 4, resulting in increased operating revenue and reduced costs for microgrids. By comparison, it can be concluded that the multi-microgrid hydrogen energy storage optimization interaction system considered in scenario 5 has better performance than traditional microgrid optimization configuration for reasonable configuration and stable operation of microgrids.
4.2. Typical Daily Simulation Scenarios for Microgrids
- (1)
- Microgrid power operation scenarios
Take the typical daily operation scenario of microgrid 1 in spring as an example, and analyze the photovoltaic output, wind turbine output, electrolytic cell, fuel cell, battery, and load output of the electric–hydrogen coupling system at different time periods. Figure 5 shows the typical daily operation scenario of multiple microgrids with electricity-hydrogen coupling, taking Microgrid 1 in Scenario 5 during a typical spring day as an example.

Figure 5.
Scenario 5 of microgrid 1: typical daily power operation scenario in spring.
Analysis shows that the proposed optimization configuration model for microgrids with electricity–hydrogen coupling can effectively allocate power. During the period of 11:00–14:00 when there is sufficient sunlight, the photovoltaic system has more protection and control power. The output of hydrogen fuel cells decreases significantly during the period from 10:00 to 13:00, while the output of electrolyzers reaches its peak during the same period. This indicates that during daytime hours, when solar irradiance is sufficient, photovoltaic generation exceeds the load demand, and the surplus electricity is utilized for hydrogen production via electrolyzers. Taking advantage of the long-term storage capability of hydrogen storage tanks, the generated hydrogen is stored and later used for combustion and power generation during periods of electricity shortage, thereby increasing the internal revenue of the microgrid. In the evening, when photovoltaic output is insufficient to meet the load demand, the system relies on hydrogen stored in the tanks, hydrogen produced by electrolyzers during this period, and hydrogen procured from external sources. These are converted to electricity via hydrogen fuel cells to satisfy demand. Consequently, the complementary characteristics of battery energy storage systems and hydrogen energy storage systems significantly reduce solar energy curtailment, enhance energy utilization efficiency, and improve the stability of the microgrid system.
According to the analysis of Figure 6 and Figure 7, it can be seen that during the period of sufficient light from 10:00 to 14:00, the power of the electrolytic cell remains the highest, and the remaining hydrogen power is used to sell to the outside world. The hydrogen power burned by the fuel cell is the lowest. During the period of no light from 18:00 to 24:00, the storage capacity of hydrogen storage tanks and energy storage batteries is greatly reduced, while the amount of hydrogen and electricity purchased through interaction with the outside world increases significantly, and the operating power of hydrogen fuel cells reaches its peak. However, from 24:00 the day before to 3:00 on the current day, the energy stored in hydrogen storage tanks and batteries increases again, resulting in a decrease in the amount of hydrogen purchased and an increase in the amount of electricity sold. From this, it can be seen that sufficient electricity and hydrogen energy are generated during the daytime when there is sufficient sunlight. The excess electricity and hydrogen energy are stored in batteries and hydrogen storage tanks for preservation and released during the non-light stage. At the same time, electricity and hydrogen energy are purchased from the outside to meet the load demand of different periods, and stored in batteries and hydrogen storage tanks for release during the remaining non-light stage at night to meet the load demand of different periods, and to reduce the purchased power from the outside and improve the economy of microgrids.
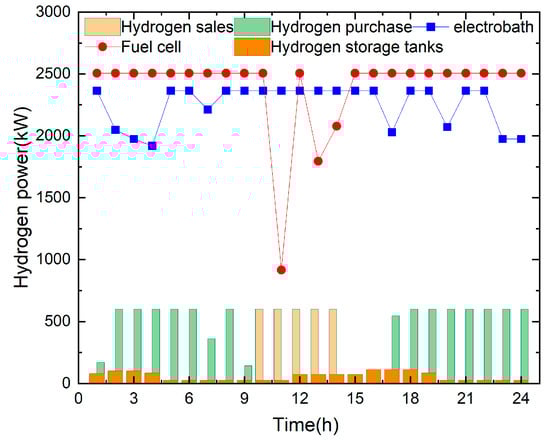
Figure 6.
Typical daily hydrogen power operation scenario of microgrid 1 in spring in scenario 5.
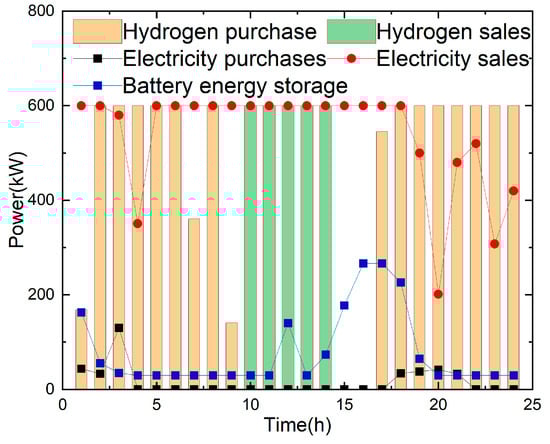
Figure 7.
Typical daily power and hydrogen energy interaction and battery storage in the spring of microgrid 1 in scenario 5.
By comparing Figure 8, Figure 9 and Figure 10 with Figure 6 and Figure 7, it is evident that in scenario 4, the absence of control interactions among microgrids leads to a significant increase in the required capacities of batteries and hydrogen storage tanks. The purchase of electricity and hydrogen from the distribution network rise substantially, while sales and photovoltaic output decline. In contrast, scenario 5 introduces coordinated operation among multiple microgrids based on scenario 4, enabling internal load balancing while considering the demands of other microgrids. This coordination reduces external energy exchanges and enhances the system-wide equilibrium within the multi-microgrid framework.
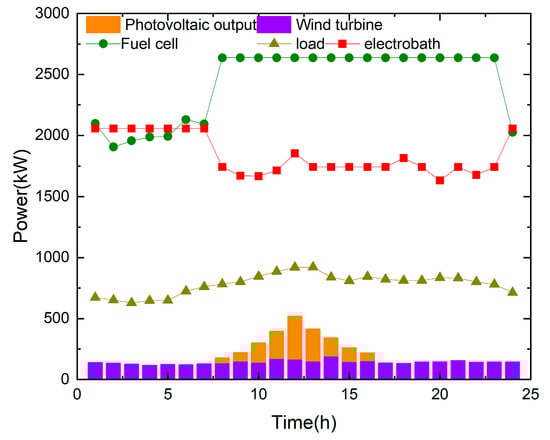
Figure 8.
Typical daily operation scenario of microgrid 1 in spring in scenario 4.
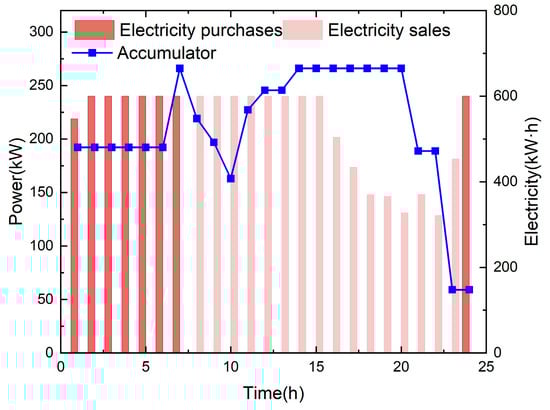
Figure 9.
Scenario 4 of microgrid 1 in spring, typical day power interactive operation scenario.
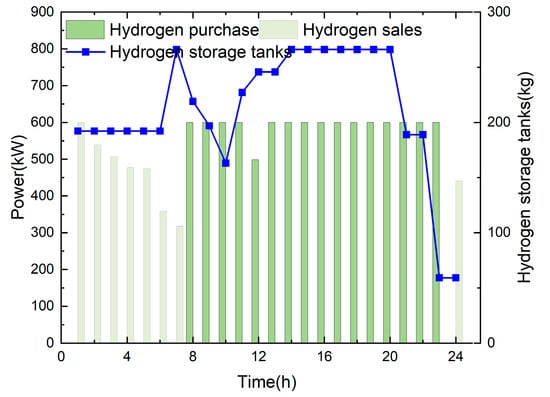
Figure 10.
Typical daily hydrogen power interaction operation scenario of microgrid 1 in spring in scenario 4.
- (2)
- Analysis of Daily Operation Results of Interactive Power between the Microgrid and Distribution Network
Figure 11 demonstrates that scenario 1 reveals insufficient battery capacity to satisfy system load requirements across multiple intervals. Particularly during peak hours (05:00–08:00 and 17:00–19:00), the microgrid requires significant external power procurement to maintain operational demand; in scenario 2, micro gas turbines are considered based on scenario 1, and sustainable power generation during nighttime greatly reduces the power purchased from the distribution network; and in scenario 3, power interaction between multiple microgrids is considered, and power scheduling between multiple microgrids is added under the output of micro gas turbines. This makes power scheduling in the power system more flexible, and further supplements the shortfall power in different time periods. Thus, minimizing the distribution network’s power draw per interval; in scenario 4, the micro gas turbine is replaced with a hydrogen energy storage system, which can store hydrogen gas produced during the day in hydrogen storage tanks for use at night. Simulation results indicate a substantial decrease in the microgrid’s grid power procurement. In scenario 5, energy interaction between multiple microgrids was added on the basis of scenario 4. When endogenous production and storage capacity prove insufficient, the microgrid compensates for energy deficits via coordinated power transactions with neighboring microgrid networks. Consequently, distribution network power procurement demonstrates further reduction relative to scenario 4. From this, it can be seen that the coupling between hydrogen energy storage systems and power systems can greatly improve energy utilization efficiency, while also enhancing the stability of multi-period power system output. The energy interaction between multiple microgrids can enhance the flexibility of microgrids and the stability of the power supply at different times.
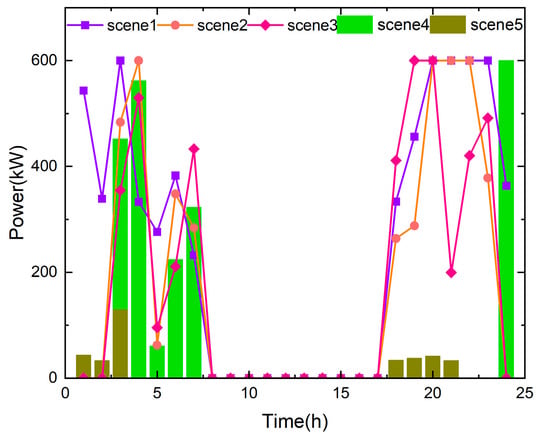
Figure 11.
Typical daily total purchased power operation scenario of multi-microgrid hydrogen energy distribution network.
As shown in Figure 12, there are five typical daily operating scenarios where microgrids sell electricity to the distribution network. Analysis shows that during the period of sufficient sunlight from 8:00 to 18:00, the microgrid sells a higher amount of electricity to the distribution network in four scenarios. At night, the sales of electricity to the distribution network in the other three scenarios are much lower than those in scenarios 4 and 5. Scenarios 4 and 5 sell electricity to the distribution network in all 24 time periods, and the overall revenue of the microgrid also increases significantly. Compared to scenario 2, scenario 3 considers an interactive system, and analysis shows that the total sales power of the system is lower than scenario 2, while the number of time periods during which the system sells electricity to the distribution network is higher than scenario 2. From this, it can be seen that the multi-microgrid interaction system can flexibly adjust energy according to the needs of the microgrid, effectively allocate it, and enhance the stability and reliability of the system. Hydrogen energy storage systems can significantly enhance the stability and flexibility of microgrids, as well as solve the problem of energy imbalance in the time domain of power systems.
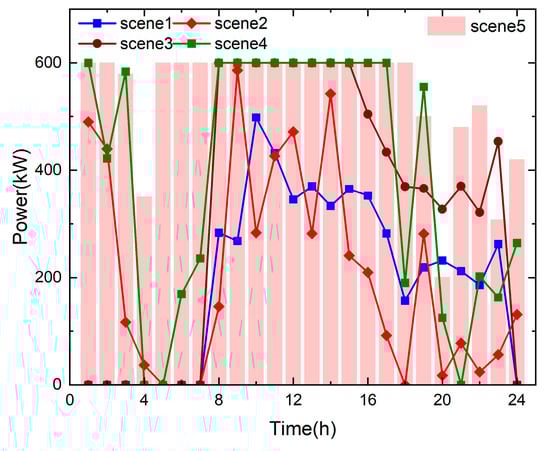
Figure 12.
Typical daily total sales power operation scenario of multi-microgrid hydrogen energy distribution network.
Table 4 shows the overall operating costs of microgrids in five scenarios. Table 5 shows the capacity configuration of microgrid 1 in scenarios 1, 2, 3, and 4. Comparing Table 1 and Table 4, it can be seen that in scenario 1, the photovoltaic power generation device cannot supply power to the microgrid normally due to insufficient light during the nighttime to meet the load demand. Therefore, a larger battery capacity needs to be configured to supply power to the microgrid during the nighttime. At the same time, the microgrid needs to purchase a large amount of electricity from the distribution network. Comparing scenario 1 and scenario 4, it can be seen that the operating cost of scenario 1 is much higher than that of scenario 4, and the operating revenue is much lower than that of scenario 4. From this, it can be concluded that using an electric–hydrogen coupling device is more economical and flexible than traditional power system devices. Comparing scenario 1, scenario 2, and scenario 4, it can be seen that although micro gas turbines can meet the load demand of microgrids in low light conditions at night, they require a large amount of fuel, which greatly increases the operating cost of the microgrids. The investment cost of hydrogen energy storage systems is relatively high, but their system consumes renewable resources, and the operating cost is much lower than scenario 2. From this, it can be concluded that hydrogen energy storage systems are more environmentally friendly and economical than traditional gas turbine systems. Comparing scenario 4 and scenario 5, it can be seen that the operating cost of scenario 5 is lower than that of scenario 4. Scenario 5 achieves collaborative operation among multiple microgrids through the buying and selling of electricity and hydrogen energy among multiple microgrids when there is a shortage of electricity in a single microgrid. It can be seen that the coordinated operation of multiple microgrids can further improve the economy of microgrids.
Table 4.
Comparison of operating costs of all scenarios.
Table 5.
Comparison of capacity configurations of microgrids 1 in scenarios 1, 2, 3, and 4.
5. Conclusions
The new energy distributed generation of microgrids can not only improve energy utilization efficiency and reduce waste light, but also enhance the flexibility and power supply reliability of microgrid systems. As a backup power source for microgrids, gas turbines greatly improve the reliability of microgrid power supply. This article replaces the micro gas turbine in the traditional microgrid optimization configuration model with a hydrogen energy storage system, establishes an electric–hydrogen coupled microgrid wind–solar–energy-storage optimization configuration model, and considers the interaction between multi-microgrid electricity and hydrogen energy to improve the interactivity, flexibility, and power supply stability of microgrid energy. Hydrogen energy, as a renewable energy source, is generated by electrolyzing water. During the combustion process in fuel cells, water is mainly produced, and its emissions are almost free of greenhouse gases and pollutants. Compared to using natural gas as fuel for gas turbines, it can reduce fuel costs while ensuring environmental cleanliness.
The specific conclusions drawn from multiple iterations of the model in four different scenarios are as follows:
- (1)
- The attenuation coefficient of hydrogen storage tanks is much smaller than that of energy storage batteries. The conversion of electrical energy into hydrogen energy through electrolytic cells and storage in hydrogen storage tanks can reduce the pressure caused by overall peak loads at different times, thereby significantly reducing the cost of electricity procurement.
- (2)
- The optimization configuration method of microgrids with electric–hydrogen coupling has a higher investment cost compared to traditional microgrid optimization configuration methods. However, due to the regenerative and continuous nature of hydrogen energy storage, the production of electrolyzed water does not rely on fossil fuels, greatly reducing environmental pollution and operating costs of microgrids.
- (3)
- The multi-microgrid interaction system can optimize the energy exchange between each microgrid, reduce resource waste, and improve the overall energy efficiency of the system; the integration of hydrogen energy interaction further improves the flexibility of microgrids, and multi-microgrid systems can be flexibly adjusted according to demand, greatly reducing the amount of electricity purchased by multi-microgrid systems from the distribution network and increasing the revenue of microgrids.
Author Contributions
D.Y.: Responsible for program compilation and writing—original draft. G.P.: Responsible for writing—review and editing. J.Z.: Responsible for methodology and project administration. J.H.: Responsible for obtaining the experimental data. Y.Z.: Responsible for resources and formal analysis. C.X.: Responsible for resources, formal analysis sources, and formal analysis. All authors have read and agreed to the published version of the manuscript.
Funding
State Grid Shandong Electric Power Company Science and Technology Project “Re-study on Integrated Source-Grid-Load-Storage for Zero-Carbon Highway Service Areas” (202401).
Data Availability Statement
The original contributions presented in this study are included in the article. Further inquiries can be directed to the corresponding author.
Conflicts of Interest
Author Dong Yang was employed by Zhejiang CICO Carbon Neutral Environment Technology Co., Ltd. Authors Gangying Pan and Jianhua Zhang were employed by Hangzhou Shuneng Zhilian Energy Technology Co., Ltd. Author Jun He was employed by Hangzhou Yineng Electric Power Technology Co., Ltd. The remaining authors declare that the research was conducted in the absence of any commercial or financial relationships that could be construed as a potential conflict of interest.
References
- Yan, N.; Pan, X.; Zhang, M.; Ma, S.; Li, W.; Zhang, B. Research on intra-day dispatch of multi-connected microgrids based on hybrid energy storage. Trans. China Eledtrotec. Soc. 2018, 33, 577–585. [Google Scholar]
- Wu, Q.; Sun, X.; Wang, Y.; Xu, D.; Li, X. A distributed control strategy for soc balancing of distributed energy storage systems in microgrid. Trans. China Eledtrotec. Soc. 2018, 33, 1247–1256. [Google Scholar]
- Yang, J.; Zhang, J.; Gui, X. Capacity optimization of hybrid energy storage system in grid-connected wind and PV power generation system. Power Syst. Technol. 2013, 37, 1209–1216. [Google Scholar] [CrossRef]
- Nan, B.; Dong, S.; Tang, K.; Zhu, M.; Zhang, X.; Chen, W. Energy storage optimization for optical microgrids considering demand response and source load uncertainty. Power Grid Technol. 2023, 47, 1340–1352. [Google Scholar]
- Xianshan, L.; Jing, F.; Shishu, G. Optimal configuration of grid-connected microgrid capacity based on sensitivity analysis. Power Syst. Prot. Control 2018, 46, 8–17. [Google Scholar]
- Ma, Y. Optimized allocation of hybrid energy storage capacity for microgrid considering electric vehicle dispatching. Power Syst. Prot. Control 2017, 45, 98–107. [Google Scholar]
- Liu, Y.; Wang, F.; Tan, Y. Multi-objective capacity optimization configuration and emission reduction benefit analysis of grid-connected microgrids. J. Electr. Power Syst. Autom. 2017, 29, 70–75. [Google Scholar]
- Zhang, J.; Yu, L.; Liu, N.; Xiao, R. Capacity configuration optimization for island microgrid with wind/photovoltaic/diesel/storage and sea water desalination load. Trans. China Eledtrotec. Soc. 2014, 29, 102–112. [Google Scholar]
- Li, Y.; Guo, X.; Dong, H.; Gao, Z. Wind/light/ChuWei grid hybrid energy storage system capacity optimization configuration. J. Electr. Power Syst. Its Autom. 2020, 32, 123–128. [Google Scholar] [CrossRef]
- Nguyen, T.H.T.; Nakayama, T.; Ishida, M. Optimal capacity design of battery and hydrogen system for the DC grid with photovoltaic power generation based on the rapid estimation of grid dependency. Int. J. Electr. Power Energy Syst. 2017, 89, 27–39. [Google Scholar] [CrossRef]
- Aki, H.; Sugimoto, I.; Sugai, T.; Toda, M.; Kobayashi, M.; Ishida, M. Optimal operation of a photovoltaic generation-powered hydrogen production system at a hydrogen refueling station. Int. J. Hydrogen Energy 2018, 43, 14892–14904. [Google Scholar] [CrossRef]
- Huang, Y.; Zhu, Z.; Wen, B.; Guo, L. Capacity planning of electrothermal hydrogen coupled island microgrid based on reversible solid oxide battery. Power Grid Technol. 2025, 1–17. [Google Scholar] [CrossRef]
- Chen, X.; Li, Q.; Pu, Y.; Yang, Y.; Li, Y.; Chen, W. Research on Adaptive Power Distribution Control Method for Island Electric-Hydrogen Hybrid Energy Storage Multi-microgrid Based on Equivalent Hydrogen Consumption Characteristics. Power Grid Technol. 2023, 47, 896–908. [Google Scholar] [CrossRef]
- Huang, Z.; Zhang, Y.; Zheng, F.; Lin, J.; An, X.; Shi, H. Day-ahead and real-time energy management for active distribution network based on coordinated optimization of different stakeholders. Power Syst. Technol. 2021, 45, 2299–2308. [Google Scholar]
- Kumar, A.; Kiran, D.; Padhy, N.P. Pricing strategy for local power-sharing between distribution network and microgrid operators. Int. J. Electr. Power Energy Syst. 2024, 157, 109820. [Google Scholar] [CrossRef]
- Wei, Z.; Liu, P.; Chen, S.; Zhao, J.; Zheng, S.; Zhang, X. Cooperative optimal scheduling method of distribution network and microgrids based on flexible operation region. Electr. Power Autom. Equip. 2024, 44, 213–220. [Google Scholar]
- Liu, Y.; Yao, L.; Zhao, B.; Xu, J.; Liao, S.; Pang, X. Low-carbon economic dispatch of distribution network-microgrid clusters considering flexible clustering. Autom. Electr. Power Syst. 2024, 48, 59–68. [Google Scholar]
- Li, X.; Ji, H.; Zhang, R.; Jiang, T.; Chen, H.; Ning, R. Distributed optimal scheduling of urban distribution system considering response characteristics of multi-type microgrids. Autom. Electr. Power Syst. 2022, 46, 74–82. [Google Scholar]
- Chen, C.; Miao, S.; Yao, F.; Wang, Y.; Wang, J.; Wei, W. Hierarchical cooperative dispatching strategy of multi-microgrid and distribution networks based on multi-agent algorithm. Autom. Electr. Power Syst. 2023, 47, 57–65. [Google Scholar]
- Chen, L.; Zhu, Z.; Wang, K.; Guo, B.; Xi, M. Optimal operation of distribution networks and multiple integrated energy microgrids based on mixed game theory. Power Syst. Technol. 2023, 47, 2229–2243. [Google Scholar]
- Wang, Y.F.; Huang, Z.H.; Shahidehpour, M.; Lai, L.L.; Wang, Z.; Zhu, Q. Reconfigurable distribution network for managing transactive energy in a multi-microgrid system. IEEE Trans. Smart Grid 2020, 11, 1286–1295. [Google Scholar] [CrossRef]
- Li, J.K.; Ge, S.Y.; Liu, H.; Wang, C.; Li, H.; Wang, L. Domestic P2P energy market design considering network reconfiguration and usage fees: Bi-level nonlinear programming and exact clearing algorithm. Appl. Energy 2024, 368, 123039. [Google Scholar] [CrossRef]
- Zhan, B.; Feng, C.; Lin, Z.; Shao, X.; Wen, F. Peer-to-peer transaction model for prosumers considering franchise of distribution company. Electr. Power Autom. Equip. 2023, 43, 158–166. [Google Scholar]
Disclaimer/Publisher’s Note: The statements, opinions and data contained in all publications are solely those of the individual author(s) and contributor(s) and not of MDPI and/or the editor(s). MDPI and/or the editor(s) disclaim responsibility for any injury to people or property resulting from any ideas, methods, instructions or products referred to in the content. |
© 2025 by the authors. Licensee MDPI, Basel, Switzerland. This article is an open access article distributed under the terms and conditions of the Creative Commons Attribution (CC BY) license (https://creativecommons.org/licenses/by/4.0/).