Article

Process Simulation of Humidity and Airflow Effects on Arc Discharge Characteristics in Pantograph–Catenary Systems

1
School of Electrical Engineering, Liaoning University of Technology, Jinzhou 121001, China
2
College of Marine Electrical Engineering, Dalian Maritime University, Dalian 116026, China
3
School of Information Engineering, Ordos Institute of Technology, Ordos 017000, China
*
Author to whom correspondence should be addressed.
Processes 2025, 13(10), 3242; https://doi.org/10.3390/pr13103242
Submission received: 15 September 2025 / Revised: 9 October 2025 / Accepted: 10 October 2025 / Published: 11 October 2025
(This article belongs to the Section Process Control and Monitoring)

Abstract

The electrical arcs generated by high-speed dynamic separation between pantograph and catenary systems pose a significant threat to the operational safety of high-speed railways. Environmental factors, particularly relative humidity and airflow, critically influence arc characteristics. This study establishes a two-dimensional pantograph–catenary arc model based on magnetohydrodynamic theory, validated through a self-developed experimental platform. Research findings demonstrate that as relative humidity increases from 25% to 100%, the core arc temperature decreases from 10,500 K to 9000 K due to enhanced heat dissipation in humid air and electron capture by water molecules; the peak arc voltage rises from 37.25 V to 48.17 V resulting from accelerated deionization processes under high humidity conditions; the average arc energy in polar regions increases from 2.5 × 10⁻⁴ J/m3 to 3.5 × 10⁻⁴ J/m3, exhibiting a saddle-shaped distribution; and the maximum arc pressure declines from 5.3 Pa to 3.7 Pa. Under airflow conditions of 10–30 m/s, synergistic effects between airflow and humidity further modify arc behavior. The most pronounced temperature fluctuations and most frequent arc root migration occur at 100% humidity with 30 m/s airflow, while the shortest travel distance and longest persistence are observed at 25% humidity with 10 m/s airflow, as airflow accelerates heat dissipation and promotes arc root alternation. Experimental measurements of arc radiation intensity and temperature distribution show excellent agreement with simulation results, verifying the model’s reliability. This study quantitatively elucidates the influence patterns of humidity and airflow on arc characteristics, providing a theoretical foundation for enhancing pantograph–catenary system reliability.

1. Introduction

With the continuous increase in the operating speeds of urban rail trains in China, incidents of pantograph–catenary contact loss have correspondingly risen. This loss of contact often results in electric arcs, leading to accelerated wear and deterioration of the pantograph–catenary interfaces and a decline in current collection quality [1]. In severe cases, such arcs may even cause the contact wire to break. According to statistics, arc-induced faults in pantograph–catenary systems have become the primary factor affecting the reliability of train power supply, posing a significant obstacle to railway development.
Given China’s vast territory and the significant climatic differences between its northern and southern regions, the environment in the southern areas is generally more humid. As a result, the arc initiation threshold and arc intensity in pantograph–catenary systems vary considerably, which can seriously impact the safety and stability of train operations. Therefore, research on the dynamic characteristics of pantograph–catenary arcs under different operational conditions, particularly in northern and southern urban rail transit, is essential.
In recent years, scholars from both domestic and international research communities have conducted extensive investigations into arc characteristics and their influencing environmental factors. The resultant achievements have not only established a crucial foundation for deepening the understanding of pantograph–catenary arcs but also provided substantial theoretical support for the present work. These research efforts can be systematically categorized into four primary directions:
Firstly, in the study of atmospheric pressure effects on electric arcs, Wu et al. developed a finite element model of pantograph–catenary arcs applicable to high-altitude environments based on magnetohydrodynamic (MHD) theory. They analyzed the variation patterns of arc temperature and voltage under low-pressure conditions and revealed the physical mechanism behind arc temperature oscillations [2]. Meanwhile, they established a multi-field-coupled stress model to investigate the arc drift characteristics under the combined influence of atmospheric pressure and airflow, elucidating the intrinsic driving forces of arc drift in low-pressure environments [3]. Similarly, Yu constructed a simulation model of pantograph–catenary arcs using MHD theory and quantitatively analyzed the effects of different atmospheric pressures on arc voltage, temperature, and current density [4]. Additionally, the team developed a two-dimensional pantograph–catenary arc model using COMSOL software to study the influence of atmospheric pressure variations on arc morphology, temperature distribution, voltage fluctuation frequency, and arc root motion characteristics [5]. Moreover, Kamenetskikh employed the catalytic probe method to investigate changes in the composition of arc plasma under low-pressure conditions [6], providing experimental evidence for understanding the relationship between atmospheric pressure and arc plasma properties.
Secondly, in the field of research on the influence of airflow on electric arcs, Xu systematically investigated the stability variations in pantograph–catenary arcs under strong airflow disturbances using comparative analysis methods [7]. Sun incorporated a fluid viscous dissipation term into the model and developed a two-dimensional MHD simulation model of pantograph–catenary arcs in crosswind environments using COMSOL software, providing an in-depth analysis of the evolution patterns and physical mechanisms of arc characteristics under crosswind effects [8]. Yang established an MHD model of pantograph–catenary arcs, focusing on the temporal evolution characteristics of arc temperature, voltage, and arc root velocity under varying crosswind conditions and input currents. Through multiple linear regression analysis, the sensitivity of pantograph–catenary arcs to factors such as airflow, atmospheric pressure, and current was quantified [9], offering a reference for quantitative research on the influence of airflow on pantograph–catenary arcs.
Meanwhile, the influence of humidity on other arc-related fields has also garnered significant attention. In the field of welding arcs, Gou et al. found that humidity significantly affects the porosity, microstructure, and fatigue strength of A7N01S-T5 aluminum alloy welded joints used in high-speed trains [10]. Ardika et al. investigated the impact of atmospheric humidity on pore defects in the arc welding zone of aluminum metal [11]. In the domain of DC series arcs, Seeley et al. analyzed the influence of relative humidity on the generation and detection of DC series arcs [12], while Liu et al. studied the discharge characteristics of series fault arcs under environmental humidity [13]. In the field of transmission line discharge, Fouad et al., Aissou et al., and Chen et al., respectively, explored the effects of humidity on the current–voltage characteristics and discharge mode transitions on different DC corona discharge systems [14,15,16]. These studies demonstrate that humidity, through mechanisms such as electron attachment and enhanced heat dissipation, alters arc behavior and is a pivotal environmental factor influencing arc characteristics.
Finally, in the optimization of multi-physical field coupling models for pantograph–catenary arcs and parameter validation, researchers have conducted a series of explorations focused on improving model accuracy and analyzing key parameters. Regarding model construction, addressing the inadequacy of traditional MHD models in accounting for practical environmental factors, Kai et al. proposed a pantograph–catenary arc model that considered convective heat transfer in air. By incorporating a convective heat transfer term into the thermal balance equation, the deviation between simulated values of the arc core temperature and measurements obtained using a spectrometer was significantly reduced [17]. Hao et al., based on the flow characteristics of arc plasma, improved the force calculation and energy dissipation terms in the MHD model, markedly enhancing the accuracy of arc morphology evolution simulations [18]. In parameter influence studies, Zhu et al., through COMSOL simulations, found that as the pantograph–catenary gap continuously decreases, the arc column radius increases. The maximum temperature on the contact wire surface decreased from 1872 K to 956 K, while the maximum temperature on the pantograph strip surface dropped from 5400 K to 3590 K. Furthermore, the temperature gradient significantly flattened as the gap increased [19]. Cong et al. enhanced the original multi-physical field coupling model by incorporating elements such as electromagnetic force, thermal buoyancy, wind load force, and air drag force, developing an arc chain model based on multi-field coupled dynamics. The results demonstrated that the proposed arc model can effectively account for the influence of wind [20].
However, existing research still exhibits significant limitations and gaps, which hinder their ability to meet the practical demands of pantograph–catenary systems for arc characteristic studies. Firstly, there is insufficient research on the coupling of multiple environmental factors. Current studies predominantly focus on the individual effects of single environmental factors, such as low pressure [2,3,4,5] or crosswind [8,9], without considering the coupled scenarios where “humidity + airflow” coexist simultaneously during actual train operation. For instance, Yang [9] only analyzed the impact of crosswind on arc dynamics without introducing humidity variables, thus failing to explain the pantograph–catenary arc characteristics in humid and windy regions such as Southern China. Secondly, a notable research gap exists regarding the influence of humidity on pantograph–catenary arcs. Although humidity has been proven to play a significant role in arc research in fields such as welding and transmission lines [10,11,12,13,14,15,16], and multi-physical field models can already accurately capture the effects of factors like convection [17,18], no existing literature specifically addresses the impact of humidity on pantograph–catenary arcs. This gap prevents a clear understanding of how humidity alters the discharge characteristics and dynamic behavior of pantograph–catenary arcs.
Addressing these aforementioned limitations and research gaps, this paper develops a two-dimensional humidity-dependent finite element model based on magnetohydrodynamics (MHD) theory. The model couples electromagnetic, thermal, and fluid flow fields to elucidate how humidity influences arc discharge characteristics, including temperature, voltage, energy, and pressure. Furthermore, by incorporating airflow as an additional variable, this study analyzes the motion patterns and stability evolution of the arc under coupled humidity–airflow effects. Validation of temperature, voltage, and arc morphology was performed using a self-developed humidity-controlled arc experimental platform across a relative humidity gradient ranging from 25% to 100%. This research aims to provide theoretical and experimental support for developing arc suppression strategies and optimizing pantograph–catenary system design in diverse climatic regions.

2. Research Methodology and MHD Simulation Framework

2.1. Parameter Configuration and Research Framework

The magnetohydrodynamic coupling model in this study was solved using the commercial finite element software COMSOL (Version 6.1, software published in Sweden.)Multiphysics. Computations were performed with a transient solver based on fully coupled multiphysics, utilizing the MUMPS direct solver to enhance computational efficiency. Key numerical configurations were specified as follows: temporal discretization employed the second-order backward difference formula (BDF2); convergence criteria included a relative residual threshold of 1 × 10⁻⁶ and an absolute residual limit below 1 × 10⁻⁸ for all physical field equations, with a relative tolerance of 0.01. For solver configuration, the memory allocation for MUMPS was set to 64 GB, and an 8-core multithreaded parallel computing approach was implemented to accelerate matrix factorization, thereby reducing solution time for large-scale coupled equations.
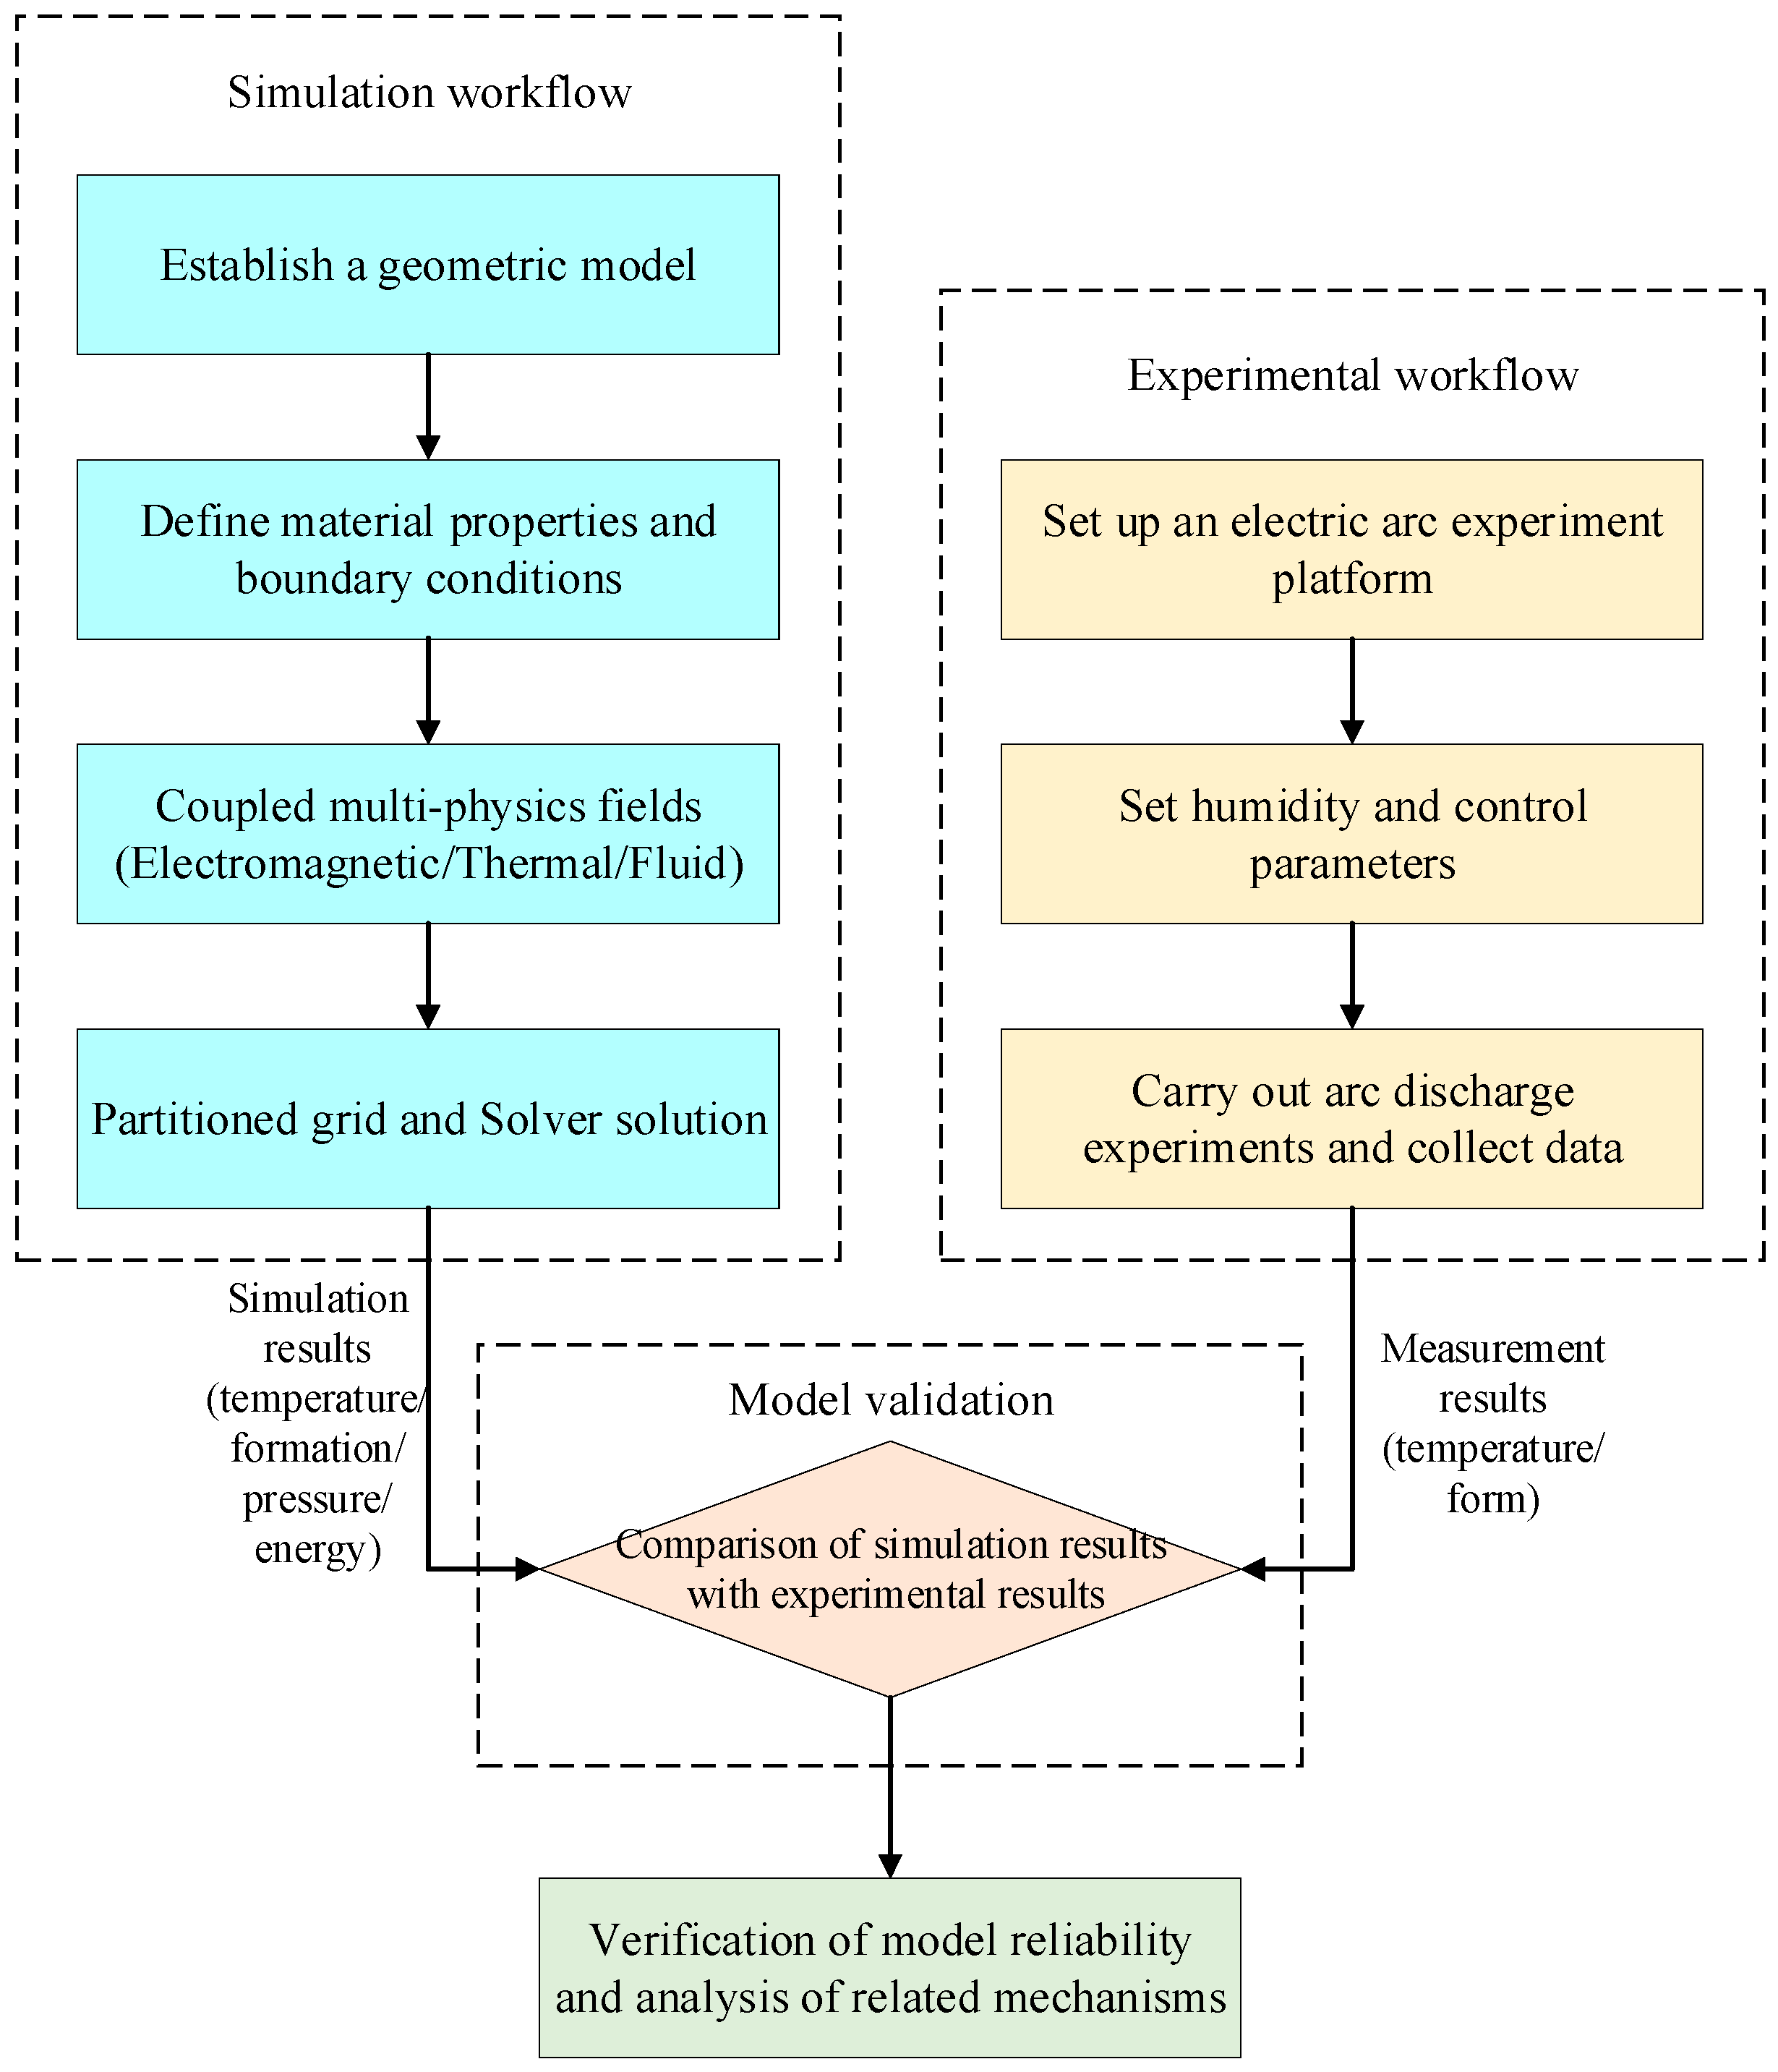
Meanwhile, to provide a transparent and systematic overview of the research process undertaken in this study, this section delineates the integrated methodology employed, which synergistically combines numerical simulation and experimental validation. The overarching research framework is visually summarized in Figure 1, which outlines the primary workflows and their interconnections.

2.2. Establishment of a Two-Dimensional Arc Simulation Model and Material Parameters

The pantograph–catenary offline arc model was established based on magnetohydrodynamics (MHD) theory using COMSOL Multiphysics, involving four coupled physical fields: electric field, magnetic field, heat transfer in fluids, and laminar flow. The geometric structure of the model is illustrated in Figure 2. The overall dimensions of the two-dimensional model framework are 80 mm × 25 mm, with the pantograph collector strip measuring 80 mm × 5 mm. The pantograph collector strip was modeled using copper-impregnated carbon material, while the contact wire was modeled using pure copper with a diameter of 13 mm. Given the lateral airflow acting on the train during operation, boundary AF was defined as the air inlet, while boundaries AB and BC were designated as open boundaries.
Relevant physical properties of electrode materials, including electrical conductivity, specific heat capacity, and density, are presented in Table 1. The parameters in the table are all derived from authoritative reference studies and material databases that have been published and can represent the actual components of the pantograph–rail system [21,22]. In addition, the relative humidity of the air domain is configured in the “Moist Air” node under the “Heat Transfer in Fluids” physics interface; for the parameters of relative permittivity and relative permeability in the air, both are set to 1 in this paper.

2.3. Preliminary Assumptions for Arc Simulation

Due to the inherently nonlinear and transient nature of the arc plasma discharge process—which involves strong coupling among electromagnetic, thermal, and fluid fields—it is challenging to analytically resolve the complete physical mechanisms and dynamic behavior of the arc. Therefore, in order to ensure the feasibility of numerical simulation while maintaining the credibility of the model, several reasonable assumptions have been introduced. The specific assumptions are as follows:
(1)
At the initial stage of the simulation, it is assumed that a self-sustained, steady-state arc discharge channel has already been established within the air domain between the pantograph contact strip and the contact wire;
(2)
In the simulation, the arc is assumed to satisfy the condition of local thermodynamic equilibrium (LTE);
(3)
In the pantograph–catenary system, the flow behavior of the arc plasma is assumed to be laminar;
(4)
Under the current and geometric scales of this model, the reaction of the arc’s self-induced magnetic field on the global current distribution is neglected, i.e., the global coupling of the magnetic field is not considered; however, the local Lorentz force generated thereby is fully retained in the momentum conservation equation to characterize the electromagnetic pinch effect;
(5)
The phase transition of the contact line and the pantograph slide plate and its production are not considered. Raw copper vapor, carbon vapor and other components.

2.4. Mathematical Model of the Arc

This model is based on the theoretical framework of magnetohydrodynamics (MHD) and establishes a complete set of governing equations by coupling the Navier–Stokes equations (which describe the transport of mass, momentum, and energy) with Maxwell’s equations (which characterize the behavior of electromagnetic fields). Within this framework, the self-induced magnetic field is calculated via Ampère’s law and utilized to solve the Lorentz force term; however, according to the aforementioned Assumption 4, the complete two-way global coupling between the magnetic field and the flow field is not considered in the model.
  • Electromagnetic field equations:
(1) According to Maxwell’s equations, the governing equation for the electric potential is given by
( σ g r a d φ ) = 0
(2) The governing equation for the arc current density is given by
J = g r a d φ
(3) The governing equation for the self-induced magnetic field generated by the arc current is given by
( g r a d ( A b + A r ) ) = μ 0 J
B = × ( A b + A r )
where φ denotes the electric potential; J represents the current density vector; is the vector operator ( × and denote the curl and divergence operators, respectively); σ is the electrical conductivity; A refers to the electromagnetic vector potential; A b is the component of the electromagnetic vector potential perpendicular to the electric field lines; A r is the component of the electromagnetic vector potential parallel to the electric field lines; and μ 0 denotes the relative permeability.
2.
Governing equations of fluid dynamics:
The fluid dynamics equations consist of three components: the continuity equation (mass conservation), the energy conservation equation, and the momentum conservation equation. The governing equations are given as follows:
(1) Continuity equation:
ρ t + ( ρ v ) = 0
where ρ denotes the density of the arc plasma, t corresponds to time, and v represents the velocity vector of the arc-induced flow field.
(2) Energy conservation equation:
( ρ h ) t + ( ρ h v ) = d i v ( λ C p g r a d h ) + Q φ + J 2 σ Q r a d
where h denotes the enthalpy; λ is the thermal conductivity; C p represents the specific heat capacity at constant pressure; Q φ denotes the viscous dissipation term of the fluid; J 2 / σ is the Joule heating generated by the current passing through the arc plasma, which is the primary cause of the temperature rise in the arc column [23]; and Q r a d represents the radiative energy loss from the arc plasma to the surroundings.
(3) In the momentum conservation equation, the velocity field of the arc plasma is solved using the Navier–Stokes governing equations (Equation (7)).
( ρ v i ) t + d i v ( ρ v v i ) = d i v ( η g r a d v i ) p x i + ( J × B ) i
where v i denotes the velocity component in the i = ( r , z ) direction; η is the dynamic viscosity of air; p represents the pressure; J is the current density; and B denotes the magnetic flux density.

2.5. Boundary Condition Settings for Arc Simulation

1. In the multiphysics-coupled arc plasma model, the global thermodynamic boundary conditions for the temperature field are defined as follows:
(1) Temperature settings for the air domain and the AB, BC, and AF boundaries:
T | Ω a i r Γ A B Γ B C Γ A F = T a m b
where T a m b = 298.15 K.
(2) Temperature boundary settings for the catenary wire segment GH and the pantograph contact strip edge ED in the catenary–pantograph system:
T | Γ G H Γ E D = T a m b
Due to the extremely high temperature of the arc, natural convective heat transfer is applied to the remaining boundaries as the thermal boundary condition, which satisfies the temperature boundary constraint equation:
q n = h ( T T 0 )
where h = 10 [ W / ( m 2 K ) ] is the convective heat transfer coefficient; T is the temperature of the air domain; and n is the normal vector to the surface of the contact strip.
2. In the magnetohydrodynamic (MHD) model of the arc plasma, the open-domain flow boundaries AB, BC, and AF are defined according to the following parameters:
P | Ω a i r Γ A B Γ B C Γ A F = P a m b
where P a m b = 101.325 kPa (one standard atmosphere).
3. In the multiphysics-coupled numerical model of arc discharge, the catenary wire is defined as the current inlet, and thus the current source is applied at boundary GH. The pantograph contact strip serves as the current outlet, and accordingly, boundary DE is set as the grounding condition. The specific parameters are listed in Table 2.

2.6. Grid Parameter Configuration and Analysis of the Independence of Grids and Time Steps

To ensure the simulation model in this paper meets well-posed conditions, two core factors—solution accuracy and computational efficiency—must be considered simultaneously. For the geometric structure of the pantograph–catenary arc, an optimized meshing strategy was designed and applied: the computational domain uses unstructured triangular meshes, while the arc region and the area near the electrodes undergo intensive local refinement. As shown in Figure 3, this meticulously designed mesh layout effectively improves the accuracy of numerical calculations while keeping the computational time within a reasonable range.
To evaluate the influence of mesh density on the solution, three meshes with systematic variations were constructed in this study: a coarse mesh (13,173 elements), an optimized mesh (33,295 elements), and a fine mesh (78,647 elements). The optimized mesh was extremely refined in the arc core region and near the electrode edges to resolve the extremely steep physical gradients in these areas. Simulations were conducted on these three meshes under the baseline operating conditions (25% relative humidity, no crosswind), and key physical quantities at the steady-state moment (t = 2 ms) were extracted for comparison, with the results presented in Table 3.
It can be concluded from the results that the variations in key parameters of the optimized mesh are all less than 0.5%. This indicates that the solution of the medium mesh has entered the asymptotic convergence range and has basically achieved mesh independence. Given that the optimized mesh achieves the optimal balance between computational accuracy and resource consumption, it is ultimately adopted in this study for all parametric investigations.
Meanwhile, to evaluate the temporal discretization error, this study compared the transient simulation results under three different time steps (0.5 ms, 0.1 ms, 0.05 ms) using the optimized mesh. Monitoring the transient evolution of the arc peak temperature shows that the difference between the results obtained with the 0.1 ms and 0.05 ms time steps is negligible (time-averaged error < 0.5%). Therefore, a time step of 0.1 ms was selected in this study for all transient calculations.

3. Simulation Results and Experimental Validation

3.1. Simulation of Arc Morphology and Temperature Characteristics Under Different Humidity Conditions

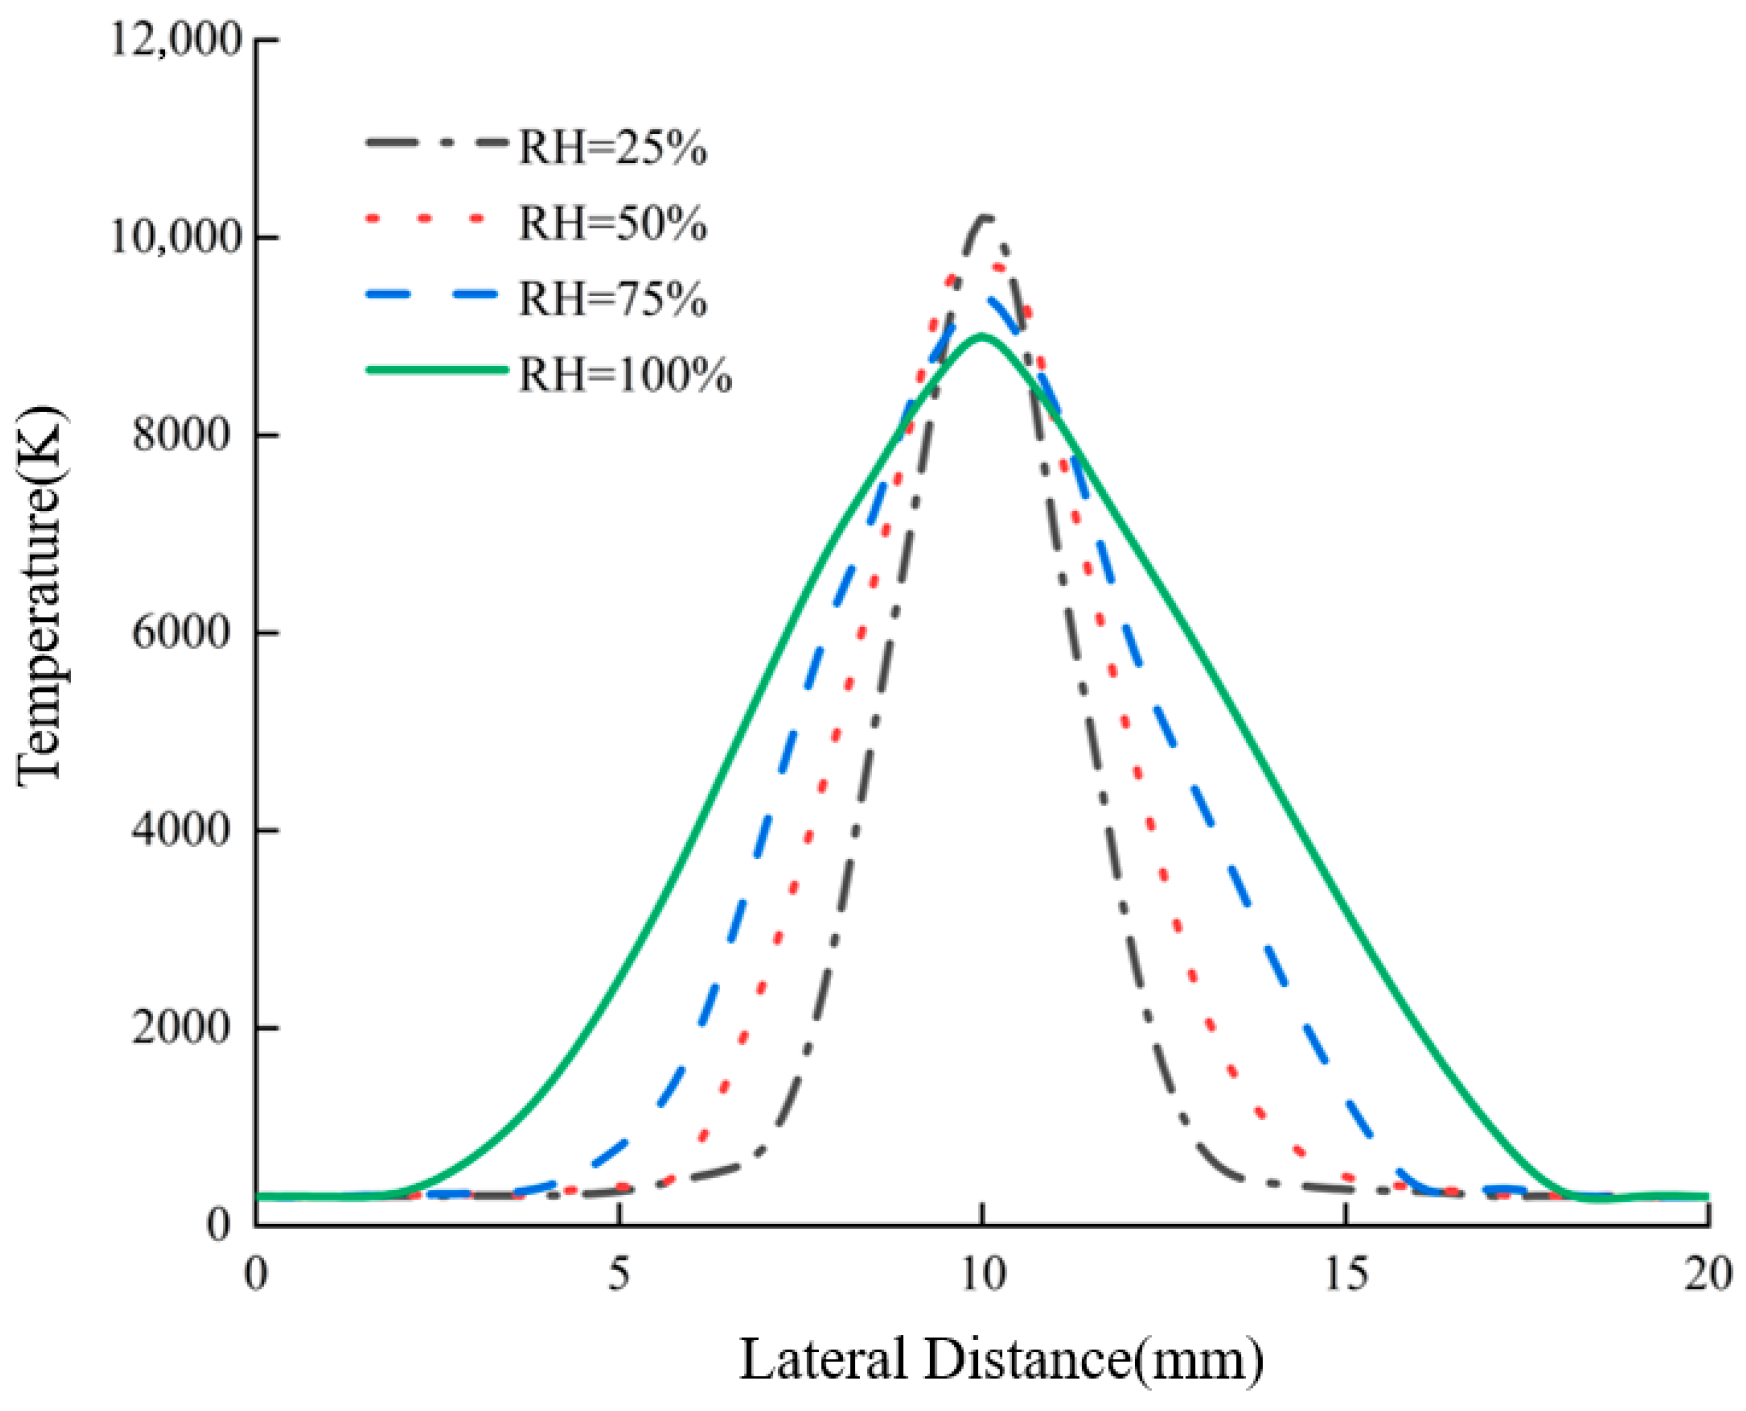
Since the pantograph–catenary system in urban rail transit typically operates with direct current, the arc movement time in this study is set from 0 to 2 ms, with a current of 20 A. To investigate the dynamic characteristics of the pantograph–catenary arc under different humidity conditions, the environmental humidity is set to 25%, 50%, 75%, and 100%, and arc simulations are conducted. The simulation time is 2 ms, with a time step of 0.1 ms, and the offline distance is set to 4.5 mm. The temperature distribution of the arc and its morphological characteristics over time under different humidity levels are shown in Figure 4. Figure 5 illustrates the arc temperature distribution along the transverse distance.
As shown in Figure 4, at 2 ms, with the humidity increasing from 25% to 100%, the high-temperature region of the arc expands outward in an elliptical shape at a consistent rate, and the arc column diameter increases continuously. The underlying physical mechanism of this phenomenon lies in the change in the effective ionization coefficient of the gas. The breakdown of dry air mainly depends on the ionization of nitrogen and oxygen molecules. However, the introduction of water vapor molecules efficiently captures free electrons through processes such as three-body attachment (e + H2O → H2O) [24], forming negative ions. The mobility of negative ions is much lower than that of electrons, which essentially reduces the number of effective electrons available for avalanche ionization. In order to maintain a conducting current of 20 A, when the electron density decreases, the arc inevitably needs to expand its conductive cross-sectional area, resulting in the expansion of the arc column diameter and the increase in volume. In addition, the attachment process consumes high-energy electrons, weakens the self-induced magnetic field and Lorentz force generated by the current, and further promotes the diffusion of charged particles to the outer edge of the arc column.
As shown in Figure 5, at the 2 ms time mark, the temperature between the arc columns gradually decreases with increasing humidity. At a relative humidity of 25%, the temperature between the arc columns reaches as high as 10,500 K, while at 100% relative humidity, the temperature between the arc columns drops to 9000 K. This is because higher environmental humidity leads to more intense heat conduction, resulting in increased heat dissipation from the arc gap. Consequently, the heat dissipation rate of the arc at higher humidity is faster compared to that at lower humidity.

3.2. Experimental Validation of Arc Model Simulation Results

To verify the simulation results, an experimental platform based on simulation for pantograph–contact wire arc discharge was constructed. This platform mainly consists of a DC power supply, an anode (made of pure copper), a cathode (made of an impregnated material containing copper and carbon), a humidity control device, a stepper motor, and various sensor components. To achieve precise control of relative humidity, the platform uses an air humidifier to atomize water vapor, which is then introduced into a sealed box made of acrylic. The water vapor then escapes through ventilation holes to achieve a humidity balance, meeting the requirements for humidity regulation in the experiment. The internal diagram and schematic of the physical platform are shown in Figure 6a,b. To achieve precise control of relative humidity, the platform uses an air humidifier to atomize water vapor and then introduces it into a sealed chamber made of acrylic. The chamber has air outlet holes to regulate relative humidity.
In this experiment, a high-speed camera was used to record the arc discharge, and a high-precision electric displacement platform was employed to control the distance between the copper anode and the copper-based carbon composite cathode to 4.5 mm, with a current set to 20 A. The experiment was conducted under environmental relative humidities of 25%, 50%, 75%, and 100%, with the results shown in Figure 7.
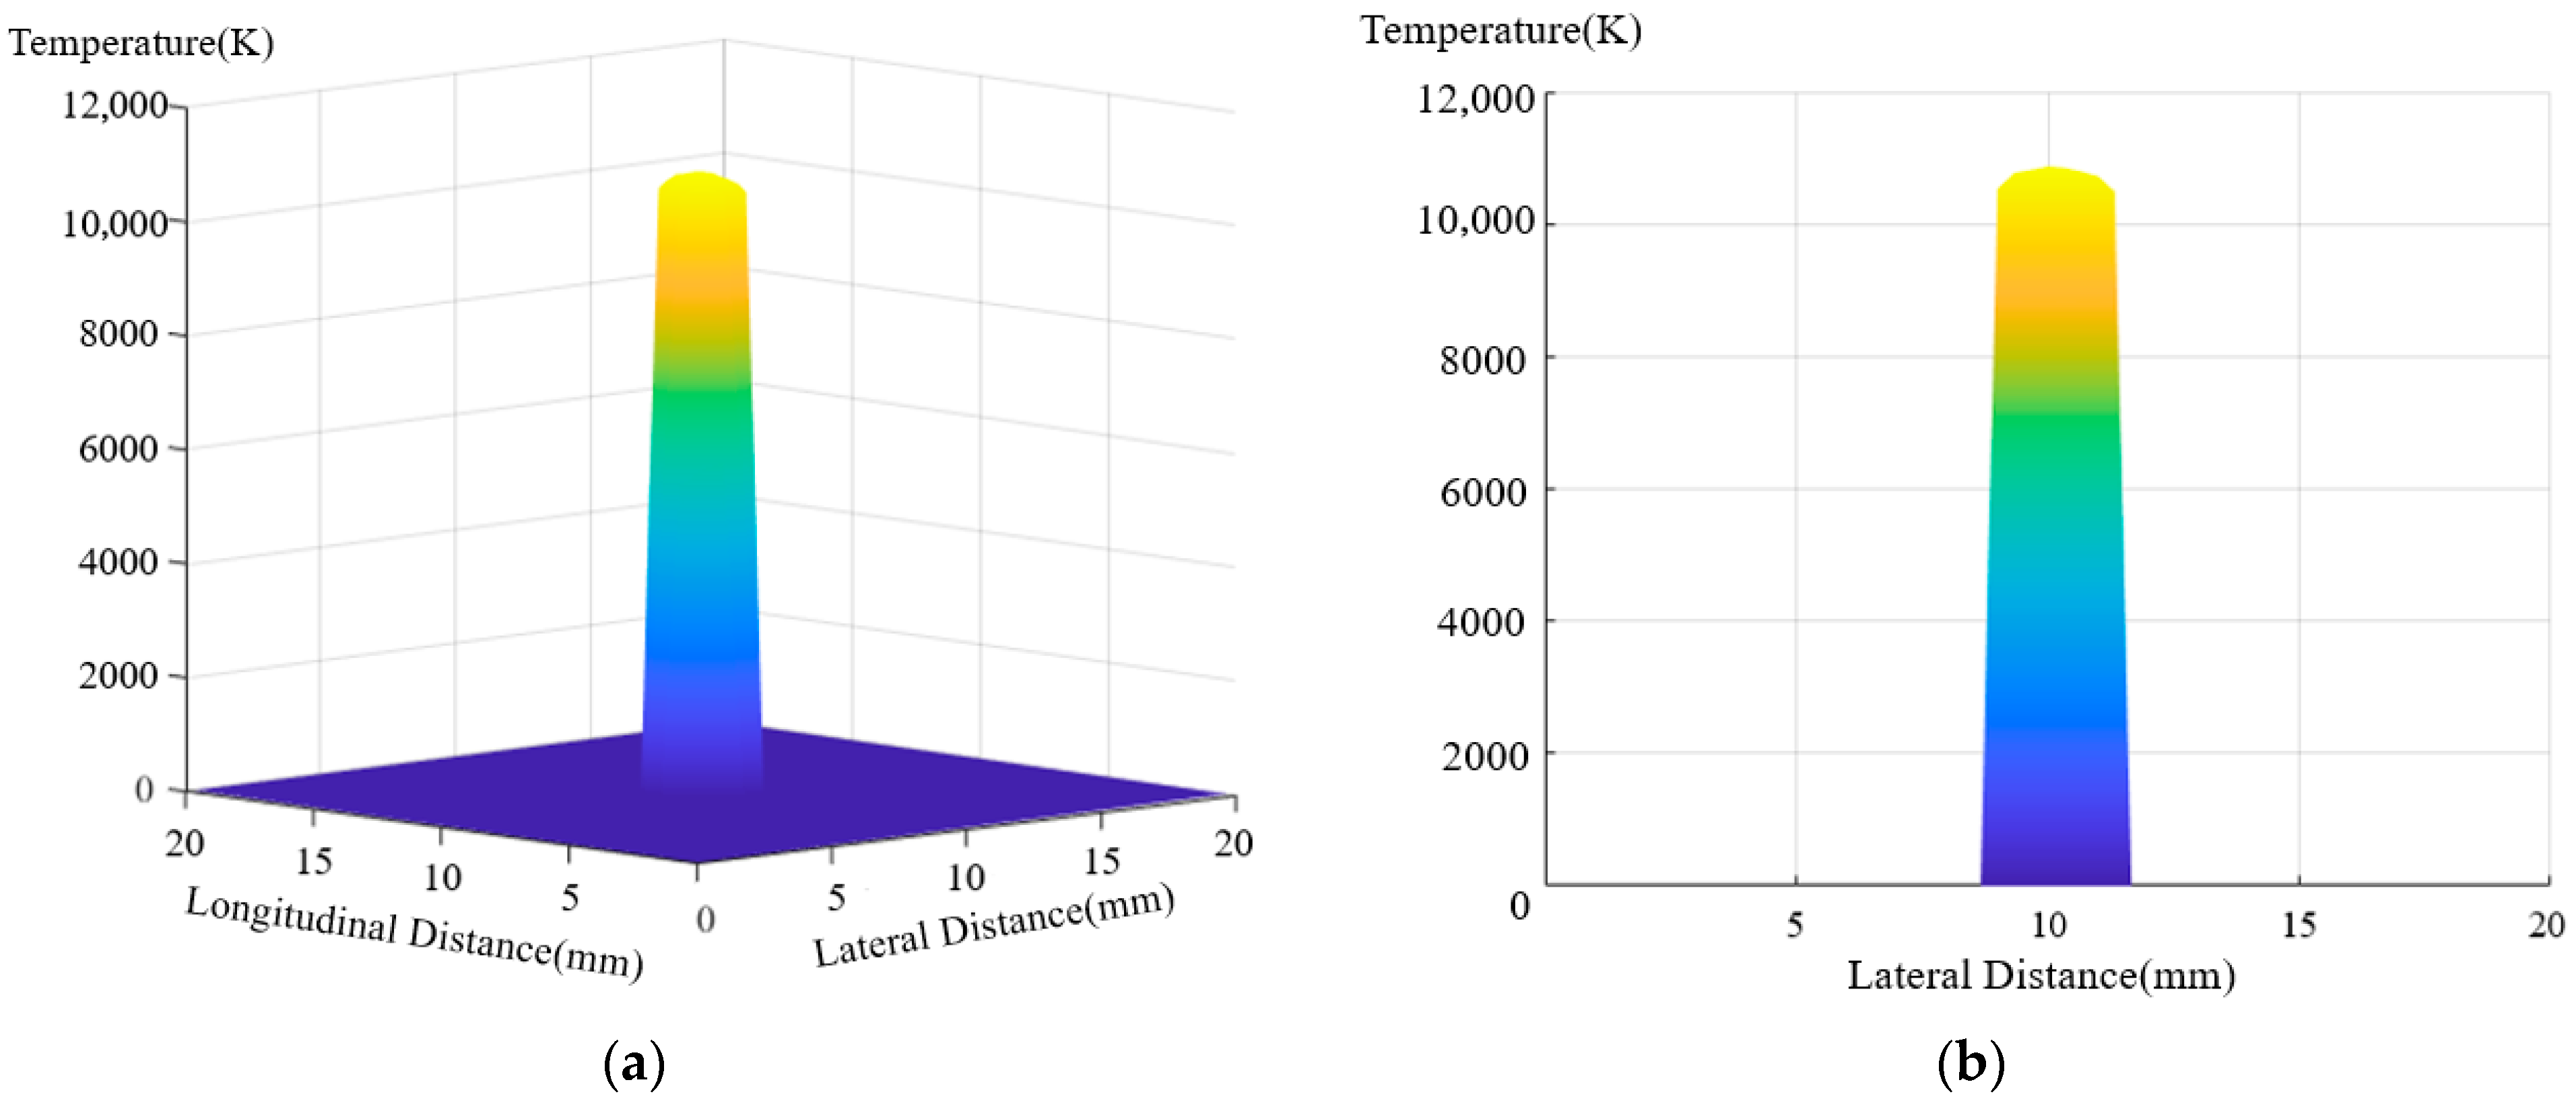
Experimental observations revealed a significant attenuation in the arc plasma radiation intensity as the relative humidity increased (RH = 25% → 100%). This indicates that the arc temperature decreases with increasing humidity, and the arc morphology shows an expanding trend. The image at RH = 25% was imported into a program written in Matlab (Version R2023B) for measuring the arc temperature [25], generating a 3D arc temperature cloud, as shown in Figure 8a. Additionally, by projecting the 3D temperature cloud onto the YOZ plane, the arc’s distribution along the transverse distance was obtained, as shown in Figure 8b.
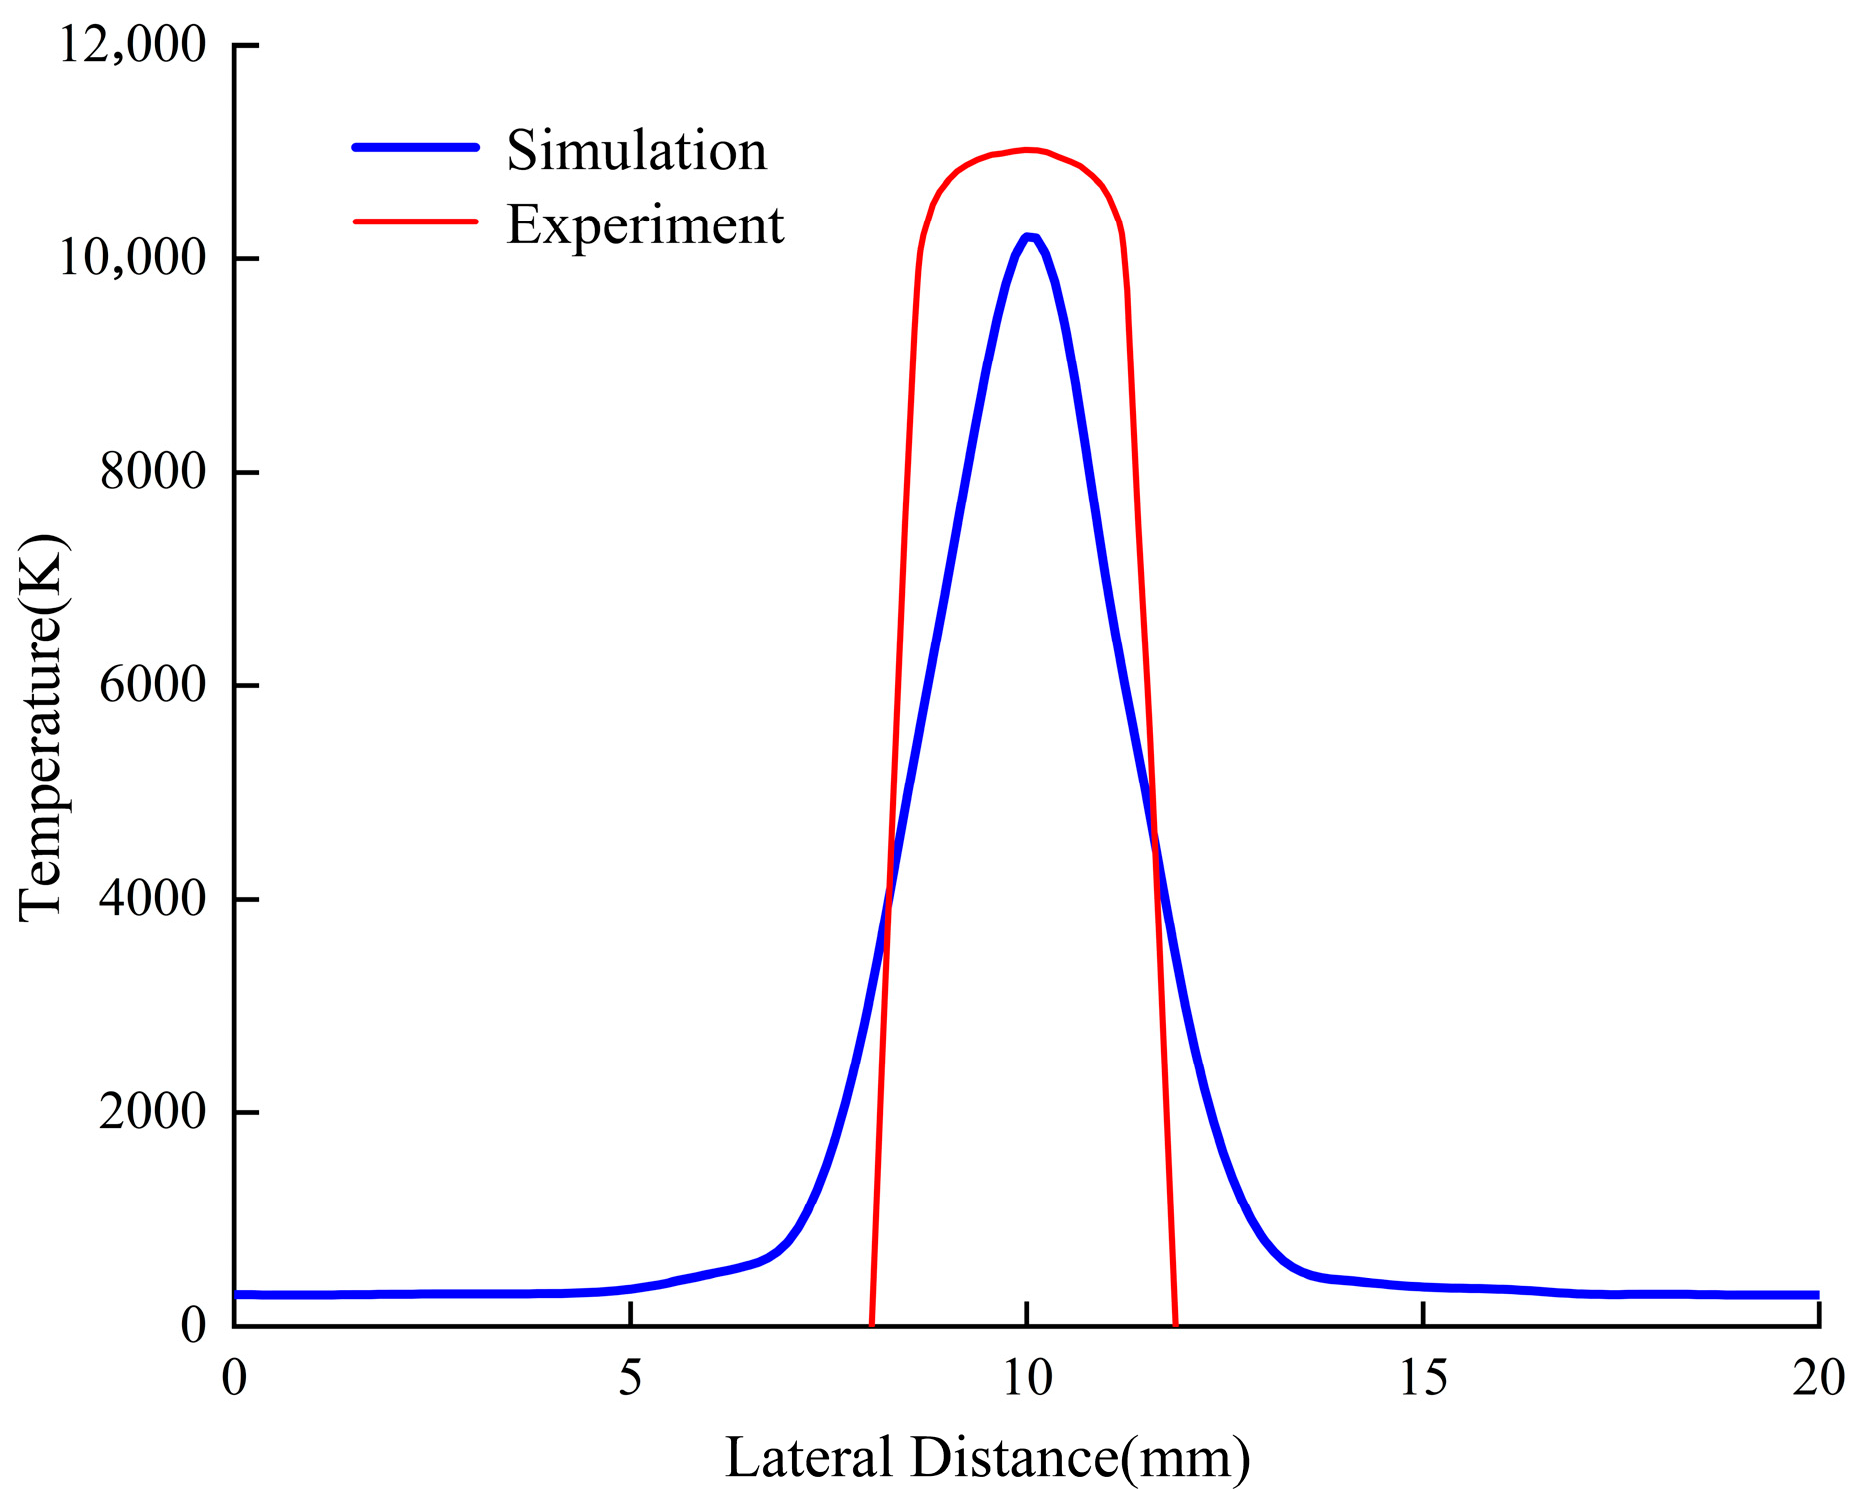
Next, the measurement was repeated three times under a relative humidity of 25%. The average of the measurement values was taken to obtain the final measurement result (as shown by the red line). The distribution of arc temperature along the lateral distance measured in the experiment was compared with the arc temperature obtained from the simulation results. The comparison results are shown in Figure 9.
Figure 9 presents a comparative analysis of the simulated and experimentally measured arc temperature distributions along the lateral distance. To quantitatively evaluate the agreement between the simulated and experimental temperature profiles, an error analysis was conducted. The results indicate a root mean square error (RMSE) of 531.3 K between the two datasets. Relative to the arc core temperature exceeding 10,000 K, this corresponds to a relative error of only 4.93%, which is below the 5% threshold. Furthermore, the residual plot, as shown in Figure 10, demonstrates that the residuals are randomly and uniformly distributed around the zero line. This pattern suggests that the discrepancies are predominantly attributable to random error rather than systematic bias. Given the inherent challenges associated with image-based temperature measurement techniques, particularly concerning camera calibration and assumptions regarding plasma emissivity, such random errors are anticipated. In summary, the limited magnitude and random nature of the errors confirm that the established MHD model effectively replicates the core physical characteristics and temperature distribution trends of the actual electric arc.
The core methodology of this study is a “multiphysics-coupled model based on magnetohydrodynamics (MHD) + a humidity-synchronized experimental platform.” The model incorporates a newly developed “humidity–airflow coupling module” and a “dynamic environmental parameter interface,” enabling the simulation of realistic operating conditions, including relative humidity levels of 25–100% (control accuracy ±2%), a constant current of 20 A, and an inter-electrode gap of 4.5 mm. Experimentally, a humidity-controlled sealed chamber equipped with an atomizing humidification and ventilation balance system was constructed. This setup, combined with a high-speed camera (frame rate: 1000 fps) and a MATLAB-based temperature extraction program (validated with residual and root-mean-square errors below 5%), was used for parameter measurement and simulation validation.
Key methodological distinctions from existing literature are as follows: Compared to Xu [2], which employed a single-factor MHD model limited to low atmospheric pressure (50–101 kPa) without humidity or airflow control modules, this study extends the capability to multidimensional regulation of “pressure–humidity–airflow,” addressing a gap in multi-factor coupling simulation. In contrast to Yang [9], which utilized a single-factor MHD model focusing solely on crosswind effects (10–30 m/s) without humidity integration, our approach couples “humidity–airflow synergistic equations,” incorporates a humidity control system (accuracy ±2%), improves airflow directional control (reducing error from ±5° to ±2°), and supplements arc root migration frequency measurements (resolution: 0.1 Hz). Differing from Yu [4], which relied on a static simulation of single offline gap variations (2–8 mm) without dynamic control, this study introduces a dynamic interface and establishes a dual-factor synchronized measurement system, enhancing the temporal resolution of parameter measurement from 1 ms to 0.1 ms.
Furthermore, under single-factor baseline conditions (e.g., 25% humidity, no airflow), the measurement deviations between the proposed model and the aforementioned established methods remain below 3%, further substantiating the rationality and robustness of the multi-factor coupling methodology.

4. Simulation Analysis of Arc Discharge Characteristics Under Different Humidity Conditions

4.1. Analysis of Pantograph–Catenary Arc Potential Characteristics Under Different Humidity Conditions

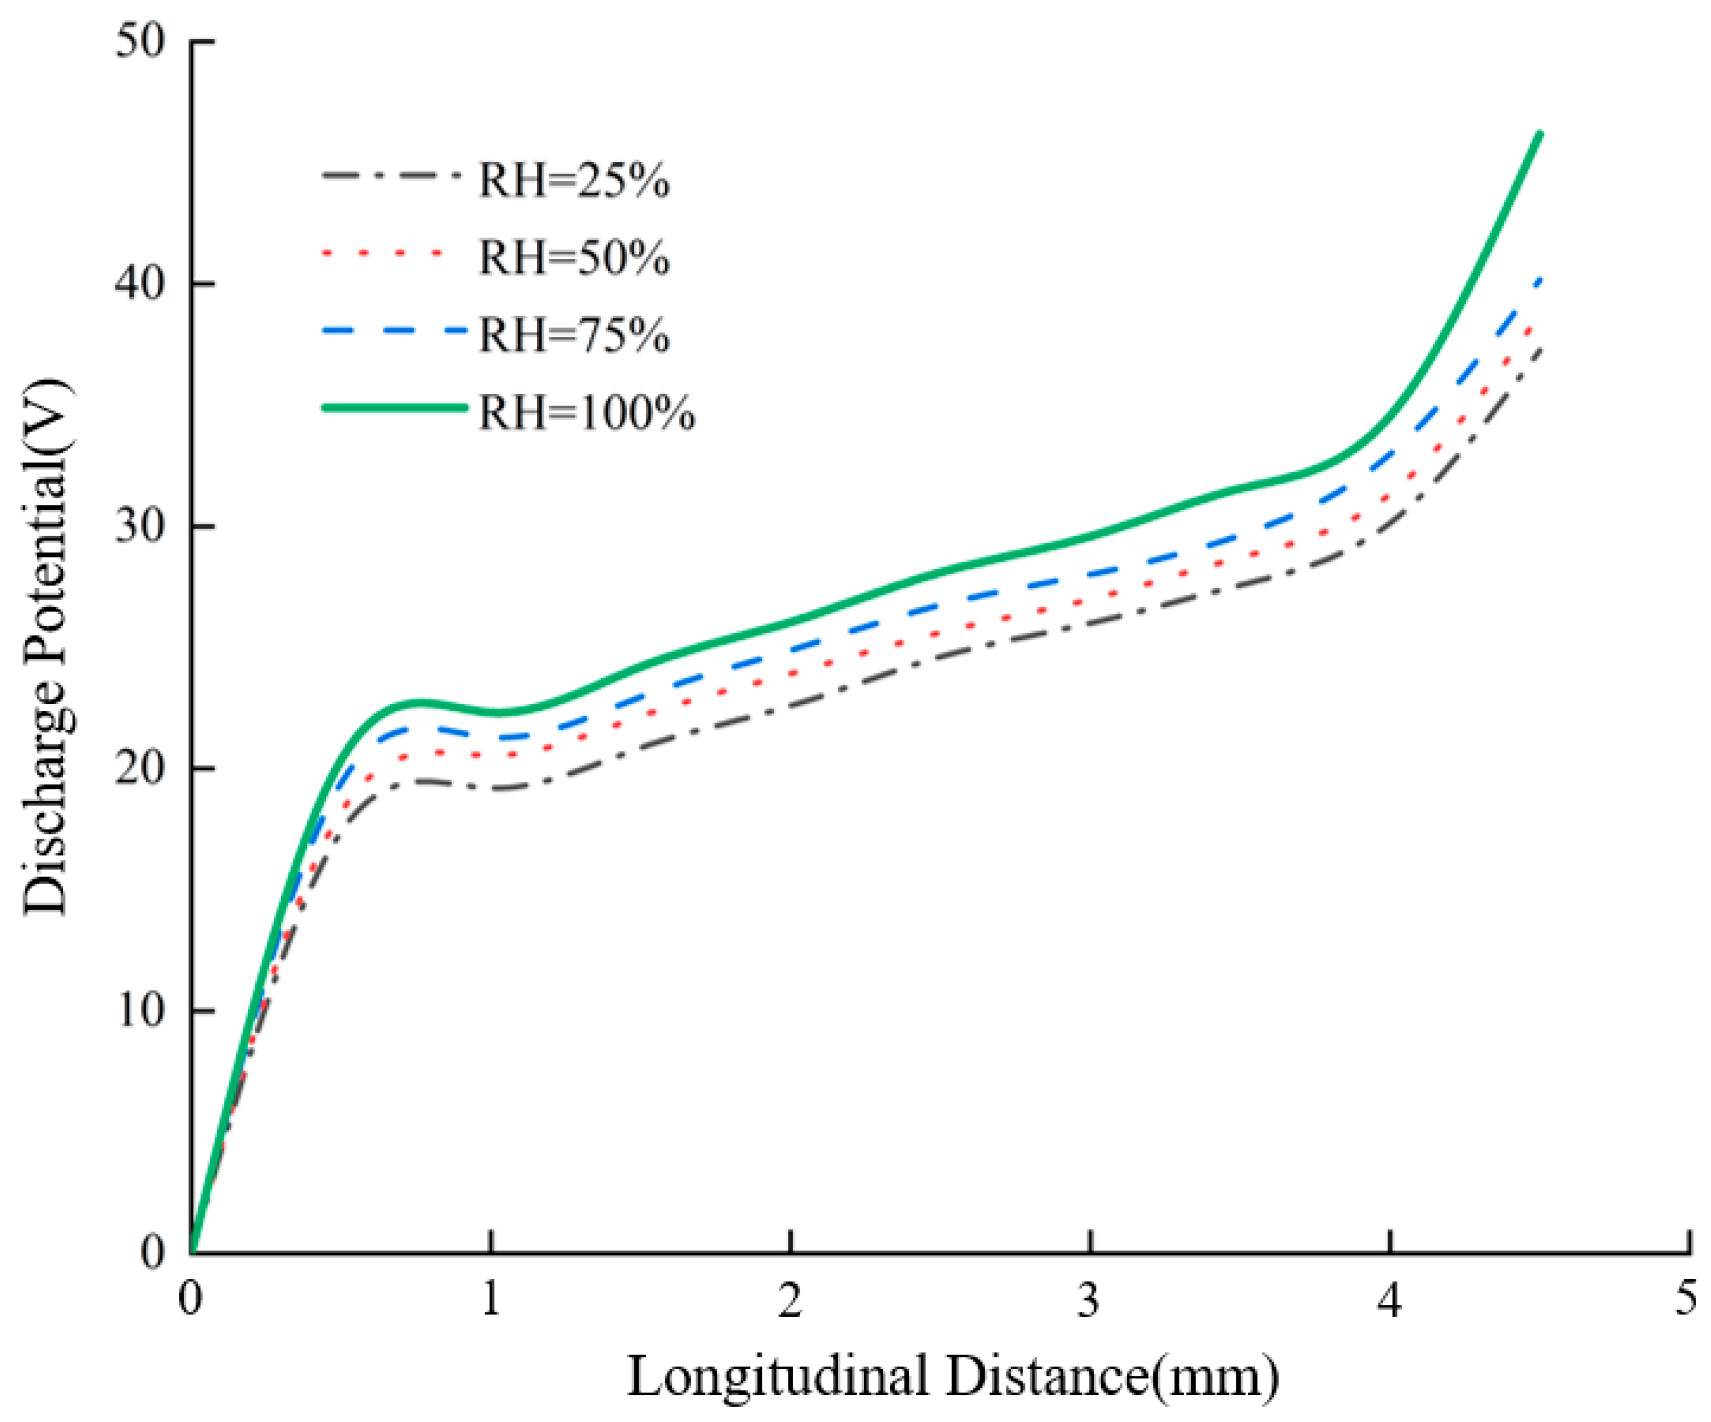
To analyze the effect of different humidity levels on the pantograph–catenary arc discharge potential, the relative humidity is set to 25%, 50%, 75%, and 100%. The arc discharge potential distribution under these four environmental relative humidity conditions is simulated, and the corresponding pantograph–catenary arc discharge potential characteristics are plotted in COMSOL, as shown in Figure 11.
Observation reveals a sudden potential surge in the polar regions of the pantograph–catenary arc, with the arc potential gradually increasing along the longitudinal direction. This phenomenon originates from the air discharge characteristics: in the arc’s polar regions, the attachment coefficient significantly exceeds the ionization coefficient, allowing water molecules to dominate electron adsorption during the discharge process. Free electrons require a greater potential difference to overcome this adsorption effect, leading to a substantial potential increase in the polar regions [26]. Experimental data demonstrate that at relative humidity levels of 25%, 50%, 75%, and 100%, the maximum arc voltages measure 37.25 V, 39.22 V, 41.28 V, and 48.17 V, respectively, exhibiting a progressively increasing trend with humidity.
From the perspective of macroscopic breakdown characteristics, this phenomenon aligns with the mechanism elucidated by Paschen’s Law. Although this study maintains fixed gas pressure (p) and gap distance (d), increased humidity equivalently enhances the dielectric strength of the gas medium. Water vapor intensifies the attachment effect, making it more difficult for the gap to undergo breakdown and sustain a conductive channel. To maintain the same current in a plasma channel with degraded conductivity, a higher axial electric field strength is required, directly manifesting as an elevation in arc voltage.
Furthermore, increased humidity promotes arc heat dissipation and accelerates the deionization process by enhancing air thermal conductivity. To sustain arc discharge, the power supply must provide a higher voltage, further elevating the arc voltage [27]. Consequently, the discharge potential increases with rising humidity.

4.2. Analysis of Pantograph–Catenary Arc Energy Characteristics Under Different Humidity Conditions

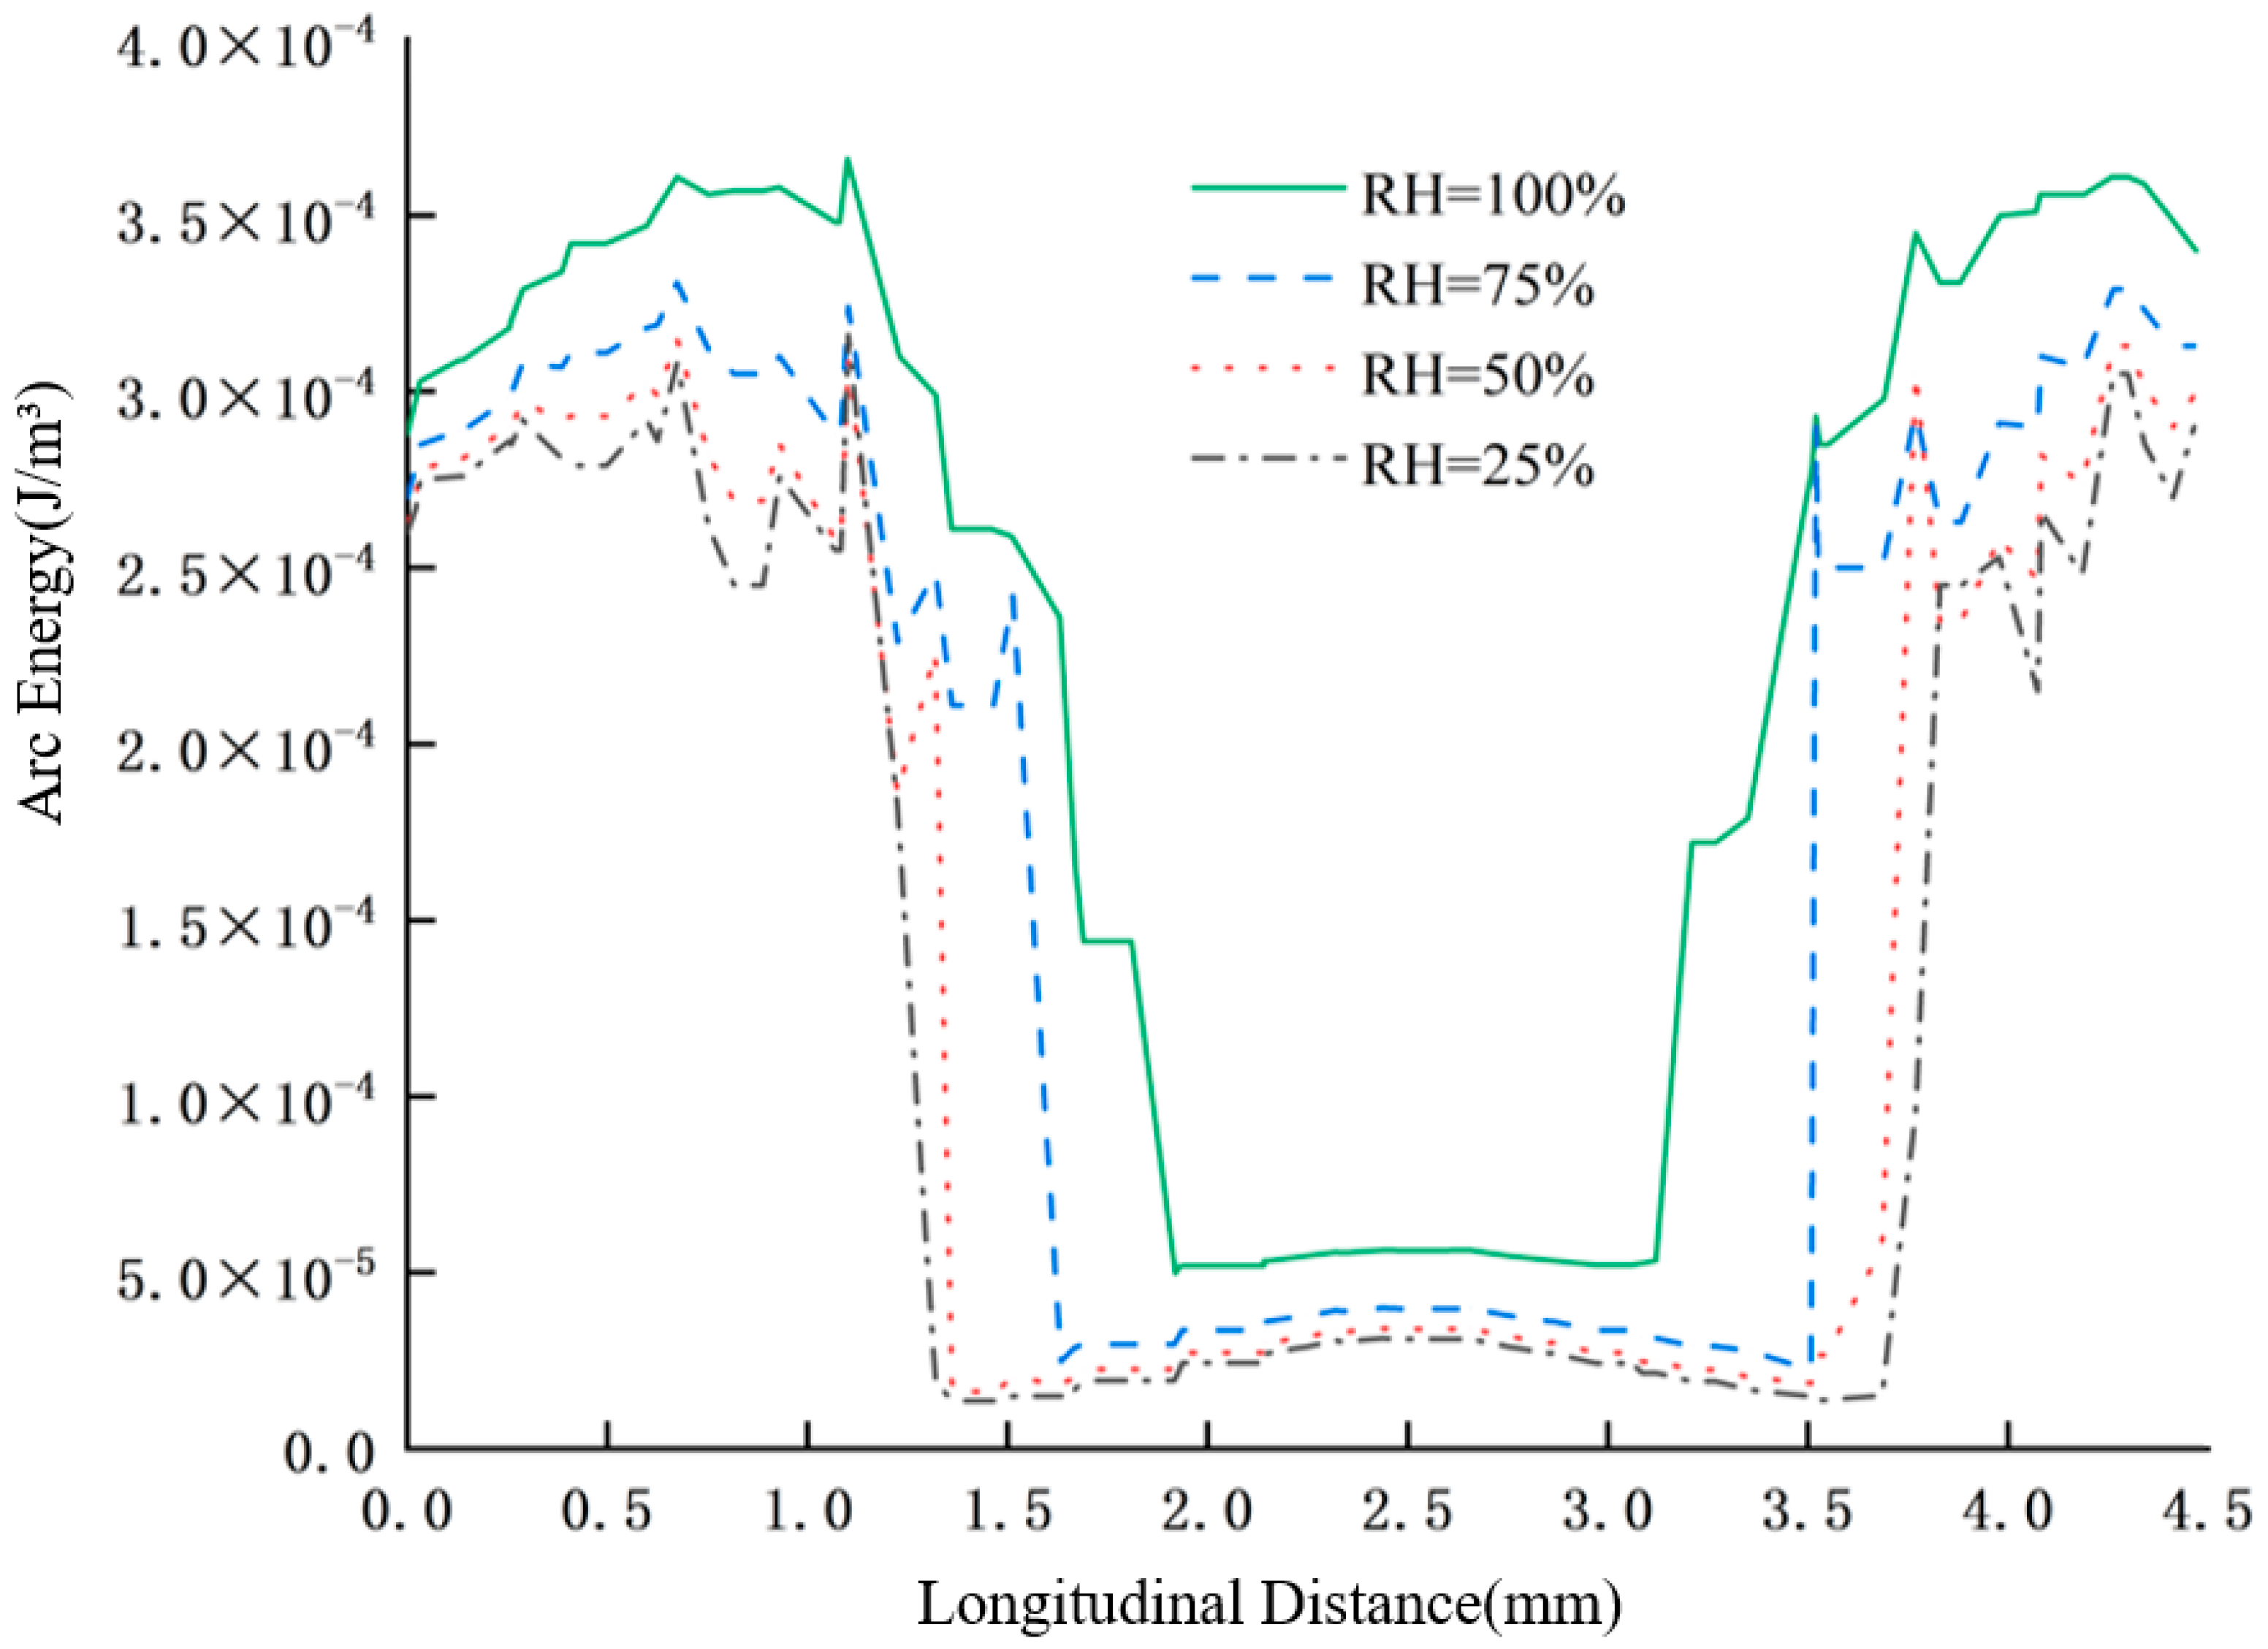
Arc energy is a significant factor contributing to the electrical wear of the pantograph contact strip in the pantograph–catenary system, and the extent of erosion is closely related to the magnitude of the arc energy [28]. Excessive arc energy promotes the erosion of the contact strip by the arc. The arc energy primarily consists of the thermal energy transferred through arc heat dissipation and the kinetic energy generated by the motion of positive ions and electrons in the arc column region. To analyze the effect of different humidity levels on arc energy, simulations were conducted with environmental relative humidities set to 25%, 50%, 75%, and 100%. The longitudinal distribution of the arc energy was extracted, and the resulting distribution is shown in Figure 12.
As shown in Figure 12, with the increase in relative humidity, the average arc energy in the cathode and anode regions is 2.5 × 10⁻⁴ J/m3, 2.8 × 10⁻⁴ J/m3, 3.1 × 10⁻⁴ J/m3, and 3.5 × 10⁻⁴ J/m3, respectively, while the arc energy in the arc column region is approximately 0.35 × 10⁻⁴ J/m3, 0.4 × 10⁻⁴ J/m3, 0.6 × 10⁻⁴ J/m3, and 0.8 × 10⁻⁴ J/m3. It can be concluded that as the relative humidity increases, the arc energy shows an increasing trend [29], with the arc energy in the polar regions being significantly greater than that in the arc column region, resulting in a saddle-shaped distribution.
This is because, on one hand, the heat generation characteristics of the arc energy in the polar regions of the arc follow Equation (12). Combined with Figure 11, it can be observed that as the humidity increases, the arc discharge potential also increases, leading to a corresponding increase in the arc energy.
W k = 0 t a ( U k U w ) i d t
where U k denotes the anode potential and U w represents the cathode potential.
On the other hand, as the humidity increases, the thermal conductivity of air also increases, resulting in a higher heat energy output from the arc to the surroundings under high humidity conditions compared to low humidity conditions. Therefore, with increasing humidity, the arc energy shows an upward trend. Additionally, as the humidity increases, the thickness of the water molecule layer adhered to the surfaces of the conductor and contact strip also increases, leading to the formation of a water film. The adhered water molecules cause deformation of the surface electric field between the anode and cathode, thereby enhancing the surface electric field [30]. Under higher electric field strength, the ability to conduct electrons improves, and electrons gain more energy from the electric field. As a result, the energy generated in the polar regions of the arc significantly exceeds the kinetic energy produced by particle collisions in the arc column, ultimately leading to a saddle-shaped distribution of arc energy.

4.3. Analysis of Pantograph–Catenary Arc Pressure Characteristics Under Different Humidity Conditions

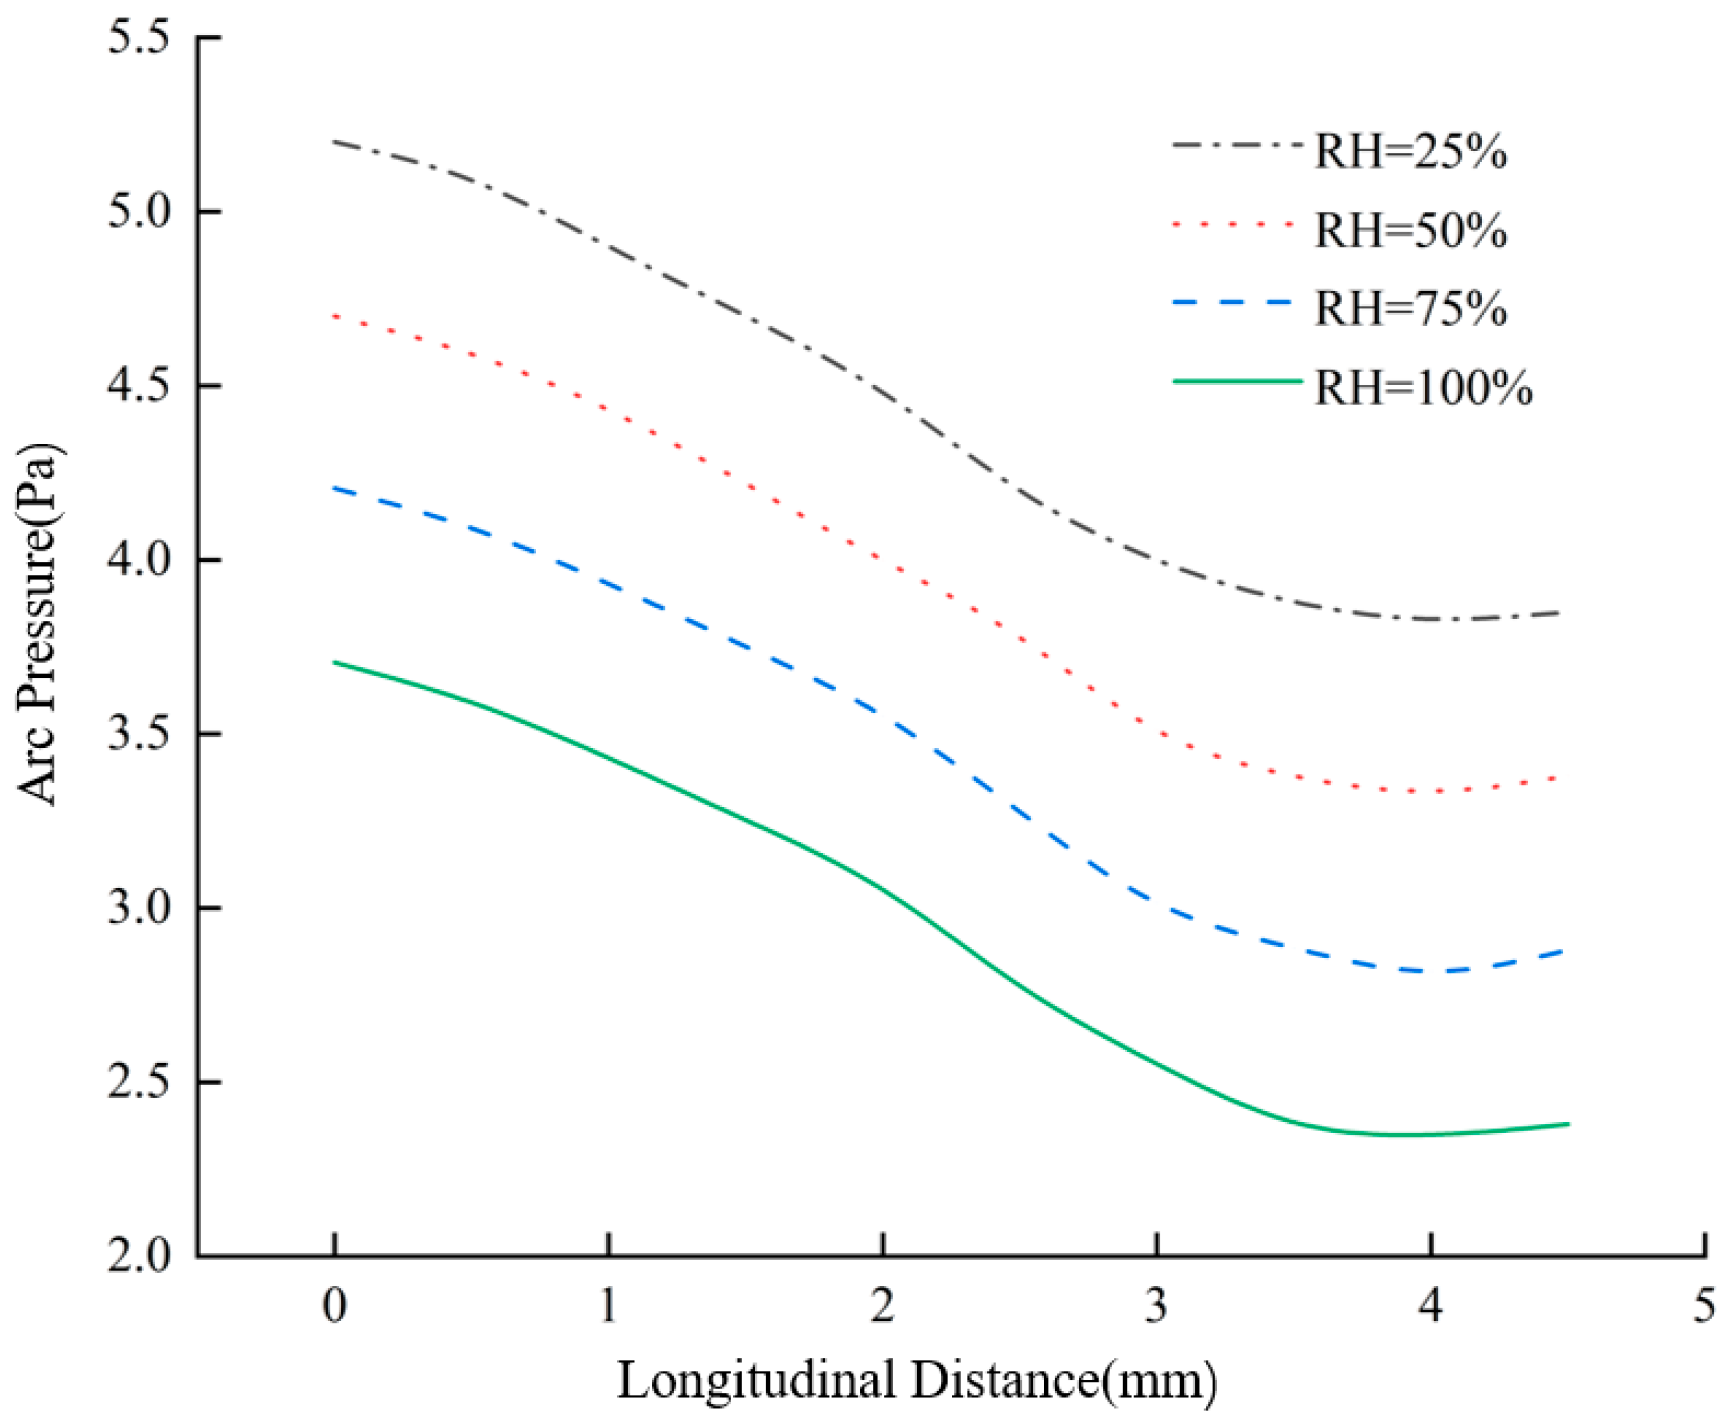
Arc pressure is also an important characteristic of arc discharge behavior. It includes the force generated by the high-speed movement of plasma gas due to the arc thrust, as well as the electromagnetic force, and is closely related to the polarity of the electrodes. To analyze the effect of humidity on arc pressure, simulations were conducted for the pantograph–catenary system under relative humidities of 25%, 50%, 75%, and 100%. The arc pressure distribution for these four cases is shown in Figure 13.
As shown in the figure, when the longitudinal distance remains constant, the arc pressure decreases significantly with increasing humidity. At a relative humidity of 25%, the maximum arc pressure is 5.3 Pa, while at 100% relative humidity, the maximum pressure drops to 3.7 Pa. Moreover, the arc pressure in the cathode region is notably higher than in the anode region. This difference is attributed to the effects of positive and negative ion flows on the electrodes: the anode is subjected to electron flow, whereas the cathode experiences the impact of positive ion flow. Since the mass of positive ions is much greater than that of electrons, and the cathode voltage drop is higher than that of the anode, the cathode undergoes the highest arc pressure. Additionally, as humidity increases, water molecules in the environment capture electrons to form negative ions, which suppress the arc discharge process. This results in a reduction in arc current density and weakens the magnetic field generated by the current in the arc region, diminishing the electromagnetic contraction effect. Consequently, the electromagnetic force becomes weaker, leading to a decrease in arc pressure. Therefore, as humidity increases, both the arc pressure and the erosion of the electrodes by the arc are reduced. Based on these two factors, the arc pressure follows the distribution pattern shown in Figure 13.

5. Motion Characteristics of the Pantograph–Catenary Arc Under the Combined Effects of Humidity and Crosswind

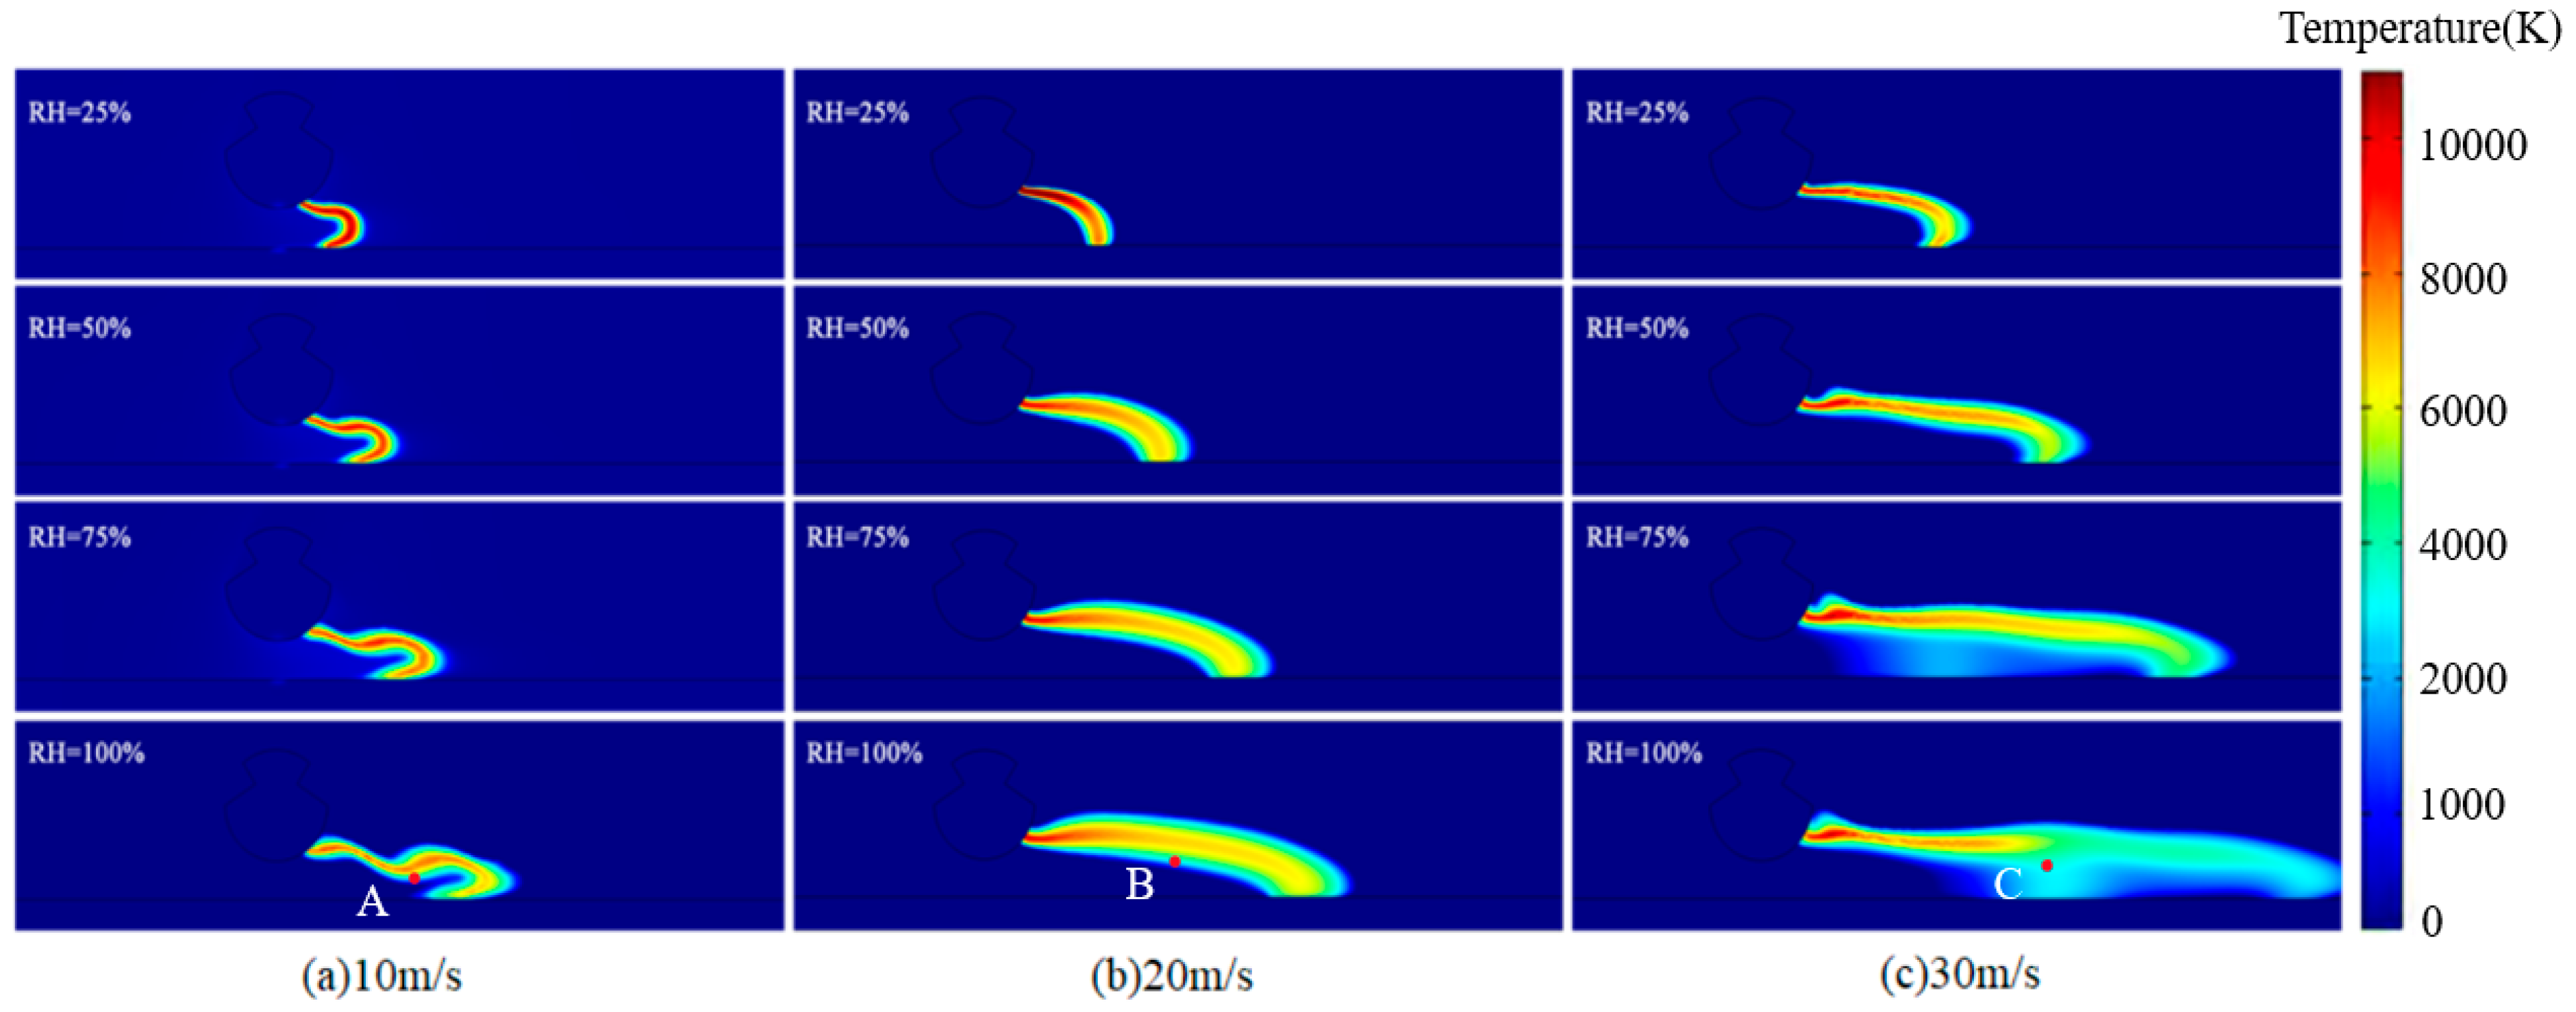
In the study of pantograph–catenary arcs, airflow is one of the key factors influencing the motion characteristics of the arc. The intensity of airflow can have different effects on the arc. During train operation, the train frequently encounters crosswinds, which, as a form of airflow, also have a significant impact on the pantograph–catenary arc. Since the crosswind encountered by the train typically ranges between 10 m/s and 30 m/s, simulations were conducted to analyze the motion characteristics of the pantograph–catenary arc under crosswind levels of 10 m/s, 20 m/s, and 30 m/s, as well as relative humidities of 25%, 50%, 75%, and 100%. The arc burning time was set to 5 ms, and the simulation results are shown in Figure 14.
As shown in Figure 14, with decreasing humidity, the arc’s travel distance becomes shorter. This phenomenon occurs because the reduced density of water molecules in the air diminishes the ionization process caused by molecular collisions, thereby weakening the arc’s motion. Therefore, at lower humidity, the arc not only remains stagnant in the pantograph–catenary system for a longer duration but also stretches at a slower rate, resulting in a consistently shorter arc length that is more difficult to extinguish. Consequently, under low-humidity conditions, the pantograph–catenary arc causes more severe erosion to the electrodes in the pantograph–catenary system.
To investigate the effects of humidity and airflow on the pantograph–catenary arc, temperature measurements were taken at three designated points—A, B, and C, as illustrated in Figure 15. The results demonstrate that with increasing crosswind intensity, the overall arc temperature decreases while oscillations become more pronounced. Under conditions of 100% relative humidity and a crosswind velocity of 30 m/s, the arc exhibits the maximum amplitude of oscillation.
These oscillatory phenomena originate from arc instability induced by intensified crosswinds and the formation of new arc roots. The mechanism involves coupled interference of airflow and humidity with the ionization process: transverse airflow not only reduces arc temperature through convective cooling but, more critically, continuously disperses the ionization core at the arc front, compelling repeated “re-breakdown” of the arc in the airflow downstream. This process is closely related to the effective ionization coefficient of the gas—the breakdown condition is jointly determined by the ionization coefficient (α) and attachment coefficient (η), where in humid environments, water molecules significantly increase η and reduce α through strong attachment effects [31].
Under the coupled effects of airflow and humidity, the airflow induces frequent breakdowns, while the high-humidity environment requires increased electric field strength for each breakdown. This synergistic effect intensifies both arc root migration and temperature fluctuations. The observed arc instability fundamentally results from the combined action of physical disturbance by airflow and ionization suppression by humidity, thereby leading to progressive deterioration of arc stability and higher extinction probability with increasing flow velocity.

6. Conclusions and Prospect

6.1. Conclusions

(1) As humidity increases, the peak temperature of the pantograph–catenary arc decreases, while both its volume and diameter expand. Specifically, as the relative humidity rises from 25% to 100%, the maximum temperature drops from 10,500 K to 9000 K, with the temperature in the arc core remaining significantly higher than in other regions. Concurrently, the maximum arc discharge potential increases from 37.25 V to 48.17 V, with the voltage drop per unit distance near the electrodes being notably higher than in the arc column. The arc energy also increases with rising humidity; when the relative humidity increases from 25% to 100%, the maximum arc energy increases from 2.5 × 10⁻⁴ J/m3 to 3.5 × 10⁻⁴ J/m3, with the energy in the polar regions being much higher than in the arc core. This results in a saddle-shaped energy distribution.
(2) As the relative humidity increases, the pantograph–catenary arc pressure decreases. Notably, the pressure experienced by the cathode is significantly higher than that experienced by the anode, leading to more severe damage to the cathode.
(3) Crosswind has a considerable impact on arc stability. When crosswind intensity is high, the overall temperature of the arc decreases, and the alternation between new and old arc roots becomes more frequent. This disruption results in a significant reduction in arc stability, weakening the arc’s self-sustaining ability and making it more prone to extinction.

6.2. Research Limitations and Future Prospects

The simulation model for pantograph–catenary arc discharge under humidity and airflow conditions established in this study is a preliminary exploration, which has not yet incorporated key factors such as electrode material ablation and deposition, the luminous characteristics of arc discharge paths, dynamic fluctuations in ambient temperature and humidity, and the lack of camera calibration. These limitations may compromise the accurate prediction of long-term electrode wear and the evolutionary process of arc plasma composition, as well as the stable measurement of arc temperature. To enhance the accuracy and applicability of the model, subsequent research will be conducted along the following avenues:
(1)
Develop a more comprehensive arc model that integrates metal erosion mechanisms, diverse aerodynamic patterns, and complete chemical kinetics;
(2)
Employ spectroscopic diagnostic techniques to investigate the effects of environmental factors on arc radiative characteristics and plasma microscale processes, and clarify the intrinsic correlation between arc morphological instability and radiative behavior;
(3)
Perform camera calibration and accurate plasma emissivity modeling to reduce systematic errors in experimental measurements.
It is important to emphasize that despite the aforementioned limitations, the model proposed in this paper introduces a novel methodology for elucidating the fundamental mechanisms by which humidity and airflow influence pantograph–catenary arc behavior, thereby laying down a crucial foundation for the development of more sophisticated models in subsequent research.
All fundamental data employed in the simulation model of this study have been procured from traceable, authoritative sources, including internationally recognized databases such as LXCat, rigorously peer-reviewed classical literature, and standard reference texts within the plasma physics community, thereby ensuring the reliability and scientific validity of the model’s input parameters.
Author Contributions

Conceptualization, Y.D.; methodology, Y.D.; software, Y.D.; validation, T.G.; investigation, T.G.; writing—original draft preparation, H.G.; writing—review and editing, Y.D.; visualization, H.Z.; supervision, H.G.; project administration, H.W.; experimental guidance, H.W. All authors have read and agreed to the published version of the manuscript.

Funding

This work was supported by the Basic Research Project for Higher Education Institutions of the Liaoning Provincial Education Department. (No. LJ212510154012, No. LJ212410154056).

Data Availability Statement

The original contributions presented in this study are included in the article. Further inquiries can be directed to the corresponding author.

Acknowledgments

The suggestions from the relevant editors and reviewers have improved the quality of this paper, and we would like to express our sincere gratitude to them. Meanwhile, we would like to express our sincere gratitude to Hebin Wang for his project support.

Conflicts of Interest

The authors declare no conflicts of interest.

References

  1. Mariscotti, A. The electrical behaviour of railway pantograph arcs. Energies 2023, 16, 1465. [Google Scholar] [CrossRef]
  2. Xu, Z.; Gao, G.; Qian, P.; Wei, W.; Xiao, S. Drift characteristics and the multi-field coupling stress mechanism of the pantograph-catunder low air pressure. Chin. Phys. B 2023, 32, 045202. [Google Scholar] [CrossRef]
  3. Zhu, G.; Wu, G.; Han, W.; Gao, G.; Liu, X. Simulation and Analysis of Pantograph-catenary Arc Steady-state Characteristics during Static Lifting and Lowering of High-speed Railway Pantograph. J. China Railw. Soc. 2016, 2, 42–47. [Google Scholar] [CrossRef]
  4. Yu, X.; Wang, Z.; Song, M.; Song, L.; Yang, J.; Su, Y. Simulation study on arc temperature of urban rail DC pantograph-catenary and arc ablation of contact line. Machines 2024, 12, 514. [Google Scholar] [CrossRef]
  5. Yu, X.; Song, L.; Su, Y.; Yang, J.; Lu, X.; Wei, C.; Cheng, Y. Electrical Characteristics of the Pantograph-Catenary Arc in Urban Rail Transit Under Different Air Pressure Conditions. Sustainability 2025, 17, 6285. [Google Scholar] [CrossRef]
  6. Kamenetskikh, A.; Gavrilov, N.; Krivoshapko, S.; Tretnikov, P. Application of the catalytic probe method for measuring the concentration of oxygen atoms in Ar/O2 plasma of a low-pressure arc. Plasma Sources Sci. Technol. 2021, 30, 015004. [Google Scholar] [CrossRef]
  7. Xu, Z.; Gao, G.; Wei, W.; Yang, Z.; Xie, W.; Dong, K. Characteristics of pantograph-catenary arc under low air pressure and strong airflow. High Volt. 2021, 7, 12180. [Google Scholar] [CrossRef]
  8. Sun, C.; Lu, C.; Mu, T.; Zhang, Z.; Yang, Z. Research on dynamic characteristics of pantograph arc under cross wind. Electr. Drive Locomot. 2022, 63, 151–156. [Google Scholar]
  9. Yang, Z.; Xu, P.; Wei, W.; Gao, G.; Zhou, N.; Wu, G. Influence of the crosswind on the pantograph arcing dynamics. IEEE Trans. Plasma Sci. 2020, 48, 2822–2830. [Google Scholar] [CrossRef]
  10. Gou, G.; Zhang, M.; Chen, H.; Chen, J.; Li, P.; Yang, Y.P. Effect of humidity on porosity, microstructure, and fatigue strength of A7N01S-T5 aluminum alloy welded joints in high-speed trains. Mater. Des. 2015, 85, 309–317. [Google Scholar] [CrossRef]
  11. Ardika, R.D.; Triyono, T.; Muhayat, N.; Triyono, T. A review porosity in aluminum welding. Procedia Struct. Integr. 2021, 33, 171–180. [Google Scholar] [CrossRef]
  12. Seeley, D.; Sumner, M.; Thomas, D.W.; Greedy, S. The effects of relative humidity on DC series arc generation and detection. In Proceedings of the 2023 IEEE Energy Conversion Congress and Exposition, Nashville, TN, USA, 29 October–2 November 2023; pp. 5700–5707. [Google Scholar]
  13. Liu, Y.; Zheng, J.; Li, L.; Li, Y.; Li, X. Analysis of Series-Type Fault Arc Characteristics under Environmental Humidity Influence. Proc. CSU-EPSA 2019, 31, 7–12. [Google Scholar]
  14. Fouad, L.; Elhazek, S. Effect of humidity on positive corona discharge in a three electrode system. J. Electrost. 1995, 35, 21–30. [Google Scholar] [CrossRef]
  15. Aissou, M.; Ait Said, H.; Nouri, H.; Zebboudj, Y. Effect of relative humidity on current–voltage characteristics of monopolar DC wire-to-plane system. J. Electrost. 2015, 76, 108–114. [Google Scholar] [CrossRef]
  16. Chen, S.; Li, K.; Wang, F.; Sun, Q.; Zhong, L. Effect of humidity and air pressure on the discharge modes transition characteristics of negative DC corona. IET Sci. Meas. Technol. 2019, 13, 1212–1218. [Google Scholar] [CrossRef]
  17. Xiang, K.; Chen, J.; Xun, J. Simulation Research on Pantograph-Electric Arc Considering Air Convection Heat Transfer. J. Guangxi Univ. (Nat. Sci. Ed.) 2023, 48, 1134–1146. [Google Scholar]
  18. Hao, J.; Gao, G.; Wu, G. Dynamic analysis of pantograph-catenary arc during the pantograph lowering process. In Proceedings of the 2016 IEEE International Conference on High Voltage Engineering and Application (ICHVE), Chengdu, China, 19–22 September 2016; pp. 1–4. [Google Scholar]
  19. Zhu, G.; Wu, G.; Gao, G.; Gu, Z. Magnetic Fluid Dynamics Simulation Study of Static Bow-Elevation Arcs in High-Speed Trains. High Volt. Technol. 2016, 42, 642–649. [Google Scholar]
  20. Cong, H.; Li, Q.; Xing, J. Simulation model of secondary arc for long-distance transmission lines with multi-field coupling dynamics. Int. J. Appl. Electromagn. Mech. 2015, 48, 423–436. [Google Scholar] [CrossRef]
  21. Holm, R. Electric Contacts: Theory and Application, 4th ed.; Springer: Berlin, Germany, 1967. [Google Scholar]
  22. Davis, J.R. Copper and Copper Alloys; ASM International: Almere, The Netherlands, 2001. [Google Scholar]
  23. Villarreal-Medina, R.; Murphy, A.B.; Méndez, P.F.; Ramírez-Argáez, M.A. Heat transfer mechanisms in arcs of various gases at atmospheric pressure. Plasma Chem. Plasma Process. 2023, 43, 787–803. [Google Scholar] [CrossRef]
  24. Prasad, A.N.; Craggs, J.D. Measurement of ionization and attachment coefficients in humid air in uniform fields and the mechanism of breakdown. Proc. Phys. Soc. 1960, 76, 223. [Google Scholar] [CrossRef]
  25. Cui, X.; Zhou, X.; Zhang, Y.; Zhai, G.; Peng, X. Measurement of static arc temperature distribution based on colorful photographing and spectroscopy analysis. Trans. China Electrotech. Soc. 2017, 32, 128–135. [Google Scholar]
  26. Zheng, X.; Zhang, R.; Huang, H. Theoretical modeling of relative humidity on contact electrification of sand particles. Sci. Rep. 2014, 4, 4399. [Google Scholar] [CrossRef] [PubMed]
  27. Marcinauskas, L.; Kavaliauskas, Ž.; Jonynaitė, K.; Uscila, R.; Aikas, M.; Keršulis, S.; Strakšys, A.; Stirkė, A.; Stankevič, V. The influence of voltage on gliding arc discharge characteristics, the composition of air plasma, and the properties of BG-11 medium. Appl. Sci. 2024, 14, 2135. [Google Scholar] [CrossRef]
  28. Hu, Y.; Huang, P.; Cheng, C.; Zhang, M.; Ma, R. Influence of arc discharge on the temperature and wear behaviors of the contact strip in pantograph-rigid catenary systems under AC conditions. Wear 2024, 546–547, 205368. [Google Scholar] [CrossRef]
  29. Bruggeman, P.J.; Iza, F.; Brandenburg, R. Foundations of atmospheric pressure non-equilibrium plasmas. Plasma Sources Sci. Technol. 2017, 26, 123002. [Google Scholar] [CrossRef]
  30. Huzayyin, A.; Chang, J.H.; Lian, K.; Dawson, F. Interaction of water molecule with Au(111) and Au(110) surfaces under the influence of an external electric field. J. Phys. Chem. C 2014, 118, 3459–3470. [Google Scholar] [CrossRef]
  31. Xu, M. Research on the Influence of Air Humidity on DC Corona Discharge. Ph.D. Thesis, Shandong University, Jinan, China, 2014. [Google Scholar]
Figure 1. Overall research flowchart.
Processes 13 03242 g001
Figure 2. Arc two-dimensional model.
Processes 13 03242 g002
Figure 3. Grid refinement diagram of the pantograph–catenary arc simulation model.
Processes 13 03242 g003
Figure 4. Arc temperature distribution under different humidity.
Processes 13 03242 g004
Figure 5. Arc temperature profile.
Processes 13 03242 g005
Figure 6. Physical and schematic diagrams of the arc test platform: (a) internal view of the physical object; (b) schematic diagram.
Processes 13 03242 g006
Figure 7. Arc morphology at different relative humidity levels.
Processes 13 03242 g007
Figure 8. Matlab temperature extraction plot: (a) 3D arc temperature distribution cloud; (b) arc transverse distance distribution diagram.
Processes 13 03242 g008
Figure 9. Comparison between simulated arc temperature and experimental temperature.
Processes 13 03242 g009
Figure 10. Residual plot of simulation values versus measured values.
Processes 13 03242 g010
Figure 11. Discharge potential distribution diagram.
Processes 13 03242 g011
Figure 12. Arc energy profile.
Processes 13 03242 g012
Figure 13. Arc pressure profile.
Processes 13 03242 g013
Figure 14. Characteristics of arc motion development under different cross-wind velocity and relative humidity.
Processes 13 03242 g014
Figure 15. The temperature change curve of the arc with time at three points A, B and C.
Processes 13 03242 g015
Table 1. The physical parameters of the contact wire and the sliding plate material.
Parameter NameContact WireContact Strip
Specific heat capacity/(J/(kg·K))386376
Thermal conductivity/(W/(m·K))38480
Density/(Kg/m3)90208100
Electrical conductivity/(S/m)4.166 × 1072.85 × 106
Table 2. Simulation environment boundary condition setting.
BoundaryCurrent FieldMagnetic FieldHeat Transfer FieldLaminar Flow Field
AB n j = 0 n A = 0 298.15 K101.325 kPa
BC n j = 0 n A = 0 298.15 K101.325 kPa
CD 0 n A = 0 h ( T T 0 ) /
DE 0 n A = 0 h ( T T 0 ) /
EF 0 n A = 0 h ( T T 0 ) /
FA n j = 0 n A = 0 298.15 K101.325 kPa
GH I ///
Table 3. Grid independence analysis results.
Mesh SchemeNumber of MeshesPeak
Temperature
Relative ErrorArc
Voltage
Relative Error
Coarse Mesh13,17310,340 K1.8%36.65 V2.1%
Optimized Mesh33,29510,500 K0.3%37.25 V0.5%
Fine Mesh78,64710,530 KReference37.45 VReference
Disclaimer/Publisher’s Note: The statements, opinions and data contained in all publications are solely those of the individual author(s) and contributor(s) and not of MDPI and/or the editor(s). MDPI and/or the editor(s) disclaim responsibility for any injury to people or property resulting from any ideas, methods, instructions or products referred to in the content.