Article

Heat Extraction Performance Evaluation of Horizontal Wells in Hydrothermal Reservoirs and Multivariate Sensitivity Analysis Based on the XGBoost-SHAP Algorithm

1
School of Petroleum Engineering, Hebei Petroleum University of Technology, Chengde 067000, China
2
College of Construction Engineering, Jilin University, Changchun 130026, China
*
Author to whom correspondence should be addressed.
Processes 2025, 13(10), 3237; https://doi.org/10.3390/pr13103237
Submission received: 4 September 2025 / Revised: 30 September 2025 / Accepted: 9 October 2025 / Published: 11 October 2025
(This article belongs to the Section Process Control and Monitoring)

Abstract

The present study investigated the heat extraction behavior of the horizontal well closed-loop geothermal systems under multi-factor influences. Particularly, the numerical model was established based on the geological condition of the geothermal field in Xiong’an New Area, and the XGBoost-SHAP (eXtreme Gradient Boosting and SHapley Additive exPlanations) algorithm was employed for multivariable analysis. The results indicated that the produced water temperature and thermal power of a 3000 m-long horizontal well were 2.61 and 4.23 times higher than those of the vertical well, respectively, demonstrating tantalizing heat extraction potential. The horizontal section length (SHAP values of 8.13 and 165.18) was the primary factor influencing production temperature and thermal power, followed by the injection rate (SHAP values of 1.96 and 64.35), while injection temperature (SHAP values of 1.27 and 21.42), geothermal gradient (SHAP values of 0.95 and 19.97), and rock heat conductivity (SHAP values of 0.334 and 17.054) had relatively limited effects. The optimal horizontal section length was 2375 m. Under this condition, the produced water temperature can be maintained higher than 40 °C, thereby meeting the heating demand. These findings provide important insights and guidance for the application of horizontal wells in hydrothermal reservoirs.

1. Introduction

Currently, the sustained rapid development of the global economy has widened the gap between energy consumption and supply [1]. Traditional fossil fuels are inevitably depleting, exacerbating the energy crisis [2,3,4]. Additionally, the problems they cause, such as climate change and environmental pollution, are becoming increasingly severe [5]. As a clean, renewable energy source, geothermal energy is generally considered to serve an important part in reshaping the energy structure and improving the ecological environment [6,7,8]. Against this backdrop, geothermal development has become a global hot topic.
Medium-to-deep hydrothermal geothermal resources are typically buried at depths of 200–3000 m and are contained in porous or fractured media in the form of hot water. It is currently the primary geothermal energy being developed and utilized worldwide [9,10,11]. However, the fundamental development mode, i.e., direct extraction of geothermal water, is getting restricted because it would lead to a bunch of issues like reservoir pressure depletion, groundwater level decline, ground subsidence, as well as wastewater pollution. Given this, re-injection of tailwater into reservoirs is gaining increasing attention [12,13,14]. However, practical applications have demonstrated that, due to limitations imposed by reservoir properties, particularly in low-permeability reservoirs, as well as the effects of suspended solids, bubbles, chemical precipitation, and microorganisms, severe plugging issues arise, leading to technical challenges such as high re-injection difficulty and low efficiency [15,16,17]. Additionally, the extra arrangement of injection wells will increase investment costs while also complicating management, which severely limits the large-scale implementation of re-injection technology.
Recently, underground coaxial heat exchange or medium-deep buried pipe technology has received extensive attention [18,19,20]. By circulating the heat exchange medium within the wellbore in a closed-loop manner, geothermal energy can be extracted without extracting groundwater, thereby avoiding the challenges associated with re-injecting. This is similar to the heat pump technology. It utilizes the stable temperature characteristics of underground soil or water bodies, exchanging heat with the ground source through buried pipes [21]. In this context, a down-hole closed-loop geothermal exchanger was proposed for medium-to-deep hydrothermal resources [22]. This novel geothermal system uses drilling technology to reach the target reservoir, injecting low-temperature fluid into the annulus formed by the casing and tubing, and then returning it through the central tubing to achieve a closed-loop heat extraction process.
Due to its ease of implementation and environmental friendliness, extensive research has been conducted on medium-to-deep closed-loop geothermal systems. Horne found that reducing the inner tube radius and increasing the annular space radius can improve heat power by solving transient heat transfer equations using explicit finite differences [22]. Morita et al. point out that insulated tubing can improve heat recovery efficiency greatly [23]. Later, they conducted field tests at the HGP-A well in Hawaii, verifying the accuracy of the heat transfer model [24]. Zanchini et al. found that the presence of cement was detrimental to heat transfer [25]. Zhang et al. evaluated the effect of working fluid type on heat extraction and pointed out that supercritical CO2 was highly promising due to its high heat transfer efficiency [26]. Recent research has focused on investigating the impacts of geo-engineering parameters such as formation temperature and wellbore size on heat extraction efficiency [27,28]. A common understanding is that the efficiency of closed-loop heat extraction still lags greatly behind that of direct extraction of underground hot water [29,30]. The primary cause is that the limited heat exchange area between the working fluid and the reservoir, coupled with severe thermal breakthrough [28]. As a result, enhancing the heat extraction capacity has become an urgent issue.
Horizontal wells are considered a potential technical solution as they can significantly increase the heat exchange area between the wellbore and the reservoir [31]. The simulation results obtained by Gu et al. indicated that the water temperature rise rate in the horizontal section was approximately 2.4 times that of the vertical section [32]. Hou et al. and Wang et al. also confirm that the horizontal well can alleviate thermal breakthrough [33,34]. Furthermore, optimizing heat generation capacity has been demonstrated to be crucial for the design of geothermal systems. Liao et al. investigated the influence of reservoir heterogeneity by integrating numerical and data-driven models [35]. Liu et al. developed an adaptive Kriging-based method for optimizing the two-horizontal-well geothermal system with multi-parallel fractures [36]. The above-mentioned studies provide valuable insights into geothermal resource development. However, research on horizontal well closed-loop heat extraction behavior still has the following limitations: First, the vast majority of studies focused on hot dry rock, with significantly insufficient understanding of heat extraction behavior in low-enthalpy geothermal resources such as medium-to-deep hydrothermal reservoirs; Second, the heat extraction behavior under the synergistic influence of multiple geo-engineering parameters remains unclear, which is not conducive to the application and promotion of this promising novel system.
This study aims to evaluate the heat extraction potential of horizontal well closed-loop systems in hydrothermal reservoirs, comprehensively considering multiple geo-engineering factors. The paper was organized as follows: In Section 2, the numerical model of the horizontal well closed-loop system was established, taking the Xiong’an New Area geothermal field as the geological background; in Section 3, the heat extraction behavior under various operation conditions was analyzed to clarify the influence mechanisms; in Section 4, the primary controlling factors of heat extraction capacity under the multifactor interaction are identified using machine learning algorithms, and an optimized plan was obtained. These findings could provide peculiar perspectives and considerations for the application of horizontal well closed-loop heat extraction systems.

2. Modeling

2.1. Conceptual Model

Figure 1 illustrates the schematic diagram of the horizontal well closed-loop geothermal system in hydrothermal reservoirs. One horizontal section is drilled after the vertical section reaches the target geothermal reservoir. Under the drive of the circulation pump, the circulating medium (water in this study) is injected into the wellbore through the annular space formed by the casing and the insulated inner tube from the surface. After absorbing heat, it returns to the surface through the insulated inner tube. Bottom-hole is sealed with a packer or cement to isolate the circulating medium from the formation, achieving “heat extraction without groundwater extraction.”

2.2. Mathematical Model

The heat extraction process of non-isothermal geothermal systems can be characterized using the following fundamental equations for mass and energy conservation [37,38].
d d t V n M K d V n   = Γ n F K · n d Γ n + V n q K d V n ,
where Vn is the controlled subdomain volume; t is time; Γn is the closed subdomain surface area; n is a normal vector on surface element dΓn, pointing inward to Vn; M represents mass or energy per volume, with K labeling the mass components and an extra heat “component” if the analysis is nonisothermal; F represents mass or heat flux; and q denotes sinks and sources.
The mass accumulation term MK is described as,
M K = Φ β = A ρ β S β X β κ ,
where Φ is porosity, dimensionless; S β is β-phase saturation, dimensionless; ρ β is β-phase density, kg/m3; X β κ is the mass fraction of component κ (water) in β-phase, dimensionless; and A represents the aqueous phase.
The energy accumulation term MK+1 consists of the matrix energy and the energies of all phases, and is given by,
M K + 1 = 1 Φ ρ R C R T + Φ β = A ρ β S β U β ,
where ρ R is the rock density, kg/m3; C R is the rock specific heat J/(kg·K); T is temperature, K; and Uβ is the β-phase internal energy, J.
The mass flux FK is caused by water flow, and is described as,
F K = β = A F β κ ,
F A κ = k k r A ρ A X A κ μ A P A   ρ A g ,
where k is reservoir permeability, m2; k r A is the aqueous phase relative permeability, dimensionless; μ A is aqueous-phase viscosity, Pa·s; P A is aqueous-phase pressure, Pa; g is the gravitational acceleration vector, m/s2.
The k r A is expressed as,
k r A = S A * 1 / 2 1 1 S A * 1 / λ λ 2 ,
S A * =   S A S i r A / 1   S i r A ,
where λ is the pore structure index, dimensionless; S A is aqueous-phase saturation, dimensionless; S i r A represents the bound water saturation, dimensionless.
The heat flux FK+1 accounts for conduction, advection, and radiative heat transfer, and is given by [37],
F K + 1 = f σ σ T 4 1 Φ K R + Φ β   =   G , A S β K β T + β = G , A h β F β ,
where f σ is the radiation coefficient, dimensionless; σ is the Stefan-Boltzmann constant, 5.6687 × 10⁻⁸ J/(m2·K4); K R is the rock heat conductivity, W/(m·K); K β is β-phase heat conductivity, W/(m·K); and h β is β-phase specific enthalpy, J/kg.
The mass source term and mass sink term qK correspond to the fluid injection and extraction rate, and can be expressed as [37],
q K = β = A X β κ q β ,
where q β is the productivity of the β-phase, kg/(m3·s).
The heat sources and sinks term qK+1 include direct heat inputs or outputs and energy changes caused by fluid injection and extraction, and can be expressed as [37],
q K + 1 = q d   + β = A h β q β ,
where qd refers to direct heat input or discharge, J/(m3·s).

2.3. Numerical Code

TOUGH2 is a numerical simulation code specifically designed for simulating multi-component multiphase flow and heat transfer processes in underground [37]. It employs the integral finite difference method for spatial discretization, utilizing implicit time differencing and Newton-Raphson iteration to solve. Here, the EOS1 module was employed to simulate the water-heat coupling process, which has been proven to effectively characterize the non-isothermal flow behavior of pure groundwater [34,39].

2.4. Initial and Boundary Conditions

In this study, a three-dimensional numerical model of a horizontal well closed-loop heat extraction system was built based on the geoengineering conditions of the geothermal field in China’s Xiong’an New Area. The target zone is the sandstone hydrothermal reservoir with a depth of 1800 m and a temperature of 57 °C [26]. The model size was set to 100 m (X) × 3500 m (Y) × 2000 m (Z), and the horizontal section was drilled along the Y direction.
The current simulation focuses on the heat extraction of the horizontal section, and thus, the wellbore structure was simplified, without considering cement rings, casings, etc. Furthermore, since the heat exchange medium in closed-loop geothermal systems flows along the wellbore, there is no fluid exchange between the wellbore and reservoir. Consequently, fluid loss and casing permeability can be neglected. In insulated tubing, there is almost no heat loss during the fluid return process, so the injected water can be regarded as extracted when it reaches the end of the horizontal well. Pipe flow should be described using the N-S Equation. However, embedding the N-S Equation in Tough 2 is not conducive to solving and model convergence. As a result, the equivalent Darcy flow method is widely used in similar simulations, with permeability, porosity, and capillary pressure are 1 × 10⁻⁷ m2, 1, and 0 MPa, respectively. This setting has been demonstrated to be effective with errors lower than 5% [34,37,40].
The average surface temperature and geothermal gradient in this region during winter are 9 °C and 0.027 °C/m [26]. Additionally, there was no flow at the model boundaries. Initialize the temperature and pressure of the model based on the hydrostatic pressure gradient and geothermal gradient, as presented in Figure 2. The formation temperature and formation pressure increase approximately linearly, increasing from the surface temperature and atmospheric pressure to 63 °C and 19.6 MPa, respectively.
Assume the initial water temperature in the wellbore was equal to that of the adjacent formation. Considering the heating cycle in northern China, the simulation period was set to 120 days. The specific model parameters used are detailed in Table 1.

2.5. Simulation Scheme

To comprehensively investigate the heat extraction behavior, the impacts of five factors, including horizontal section length Lh, injected water temperature Ti, water injection rate Mi, geothermal gradient TG, and rock heat conductivity λR, were considered, as shown in Table 2.

2.6. Mesh Sensitivity Analysis and Model Validation

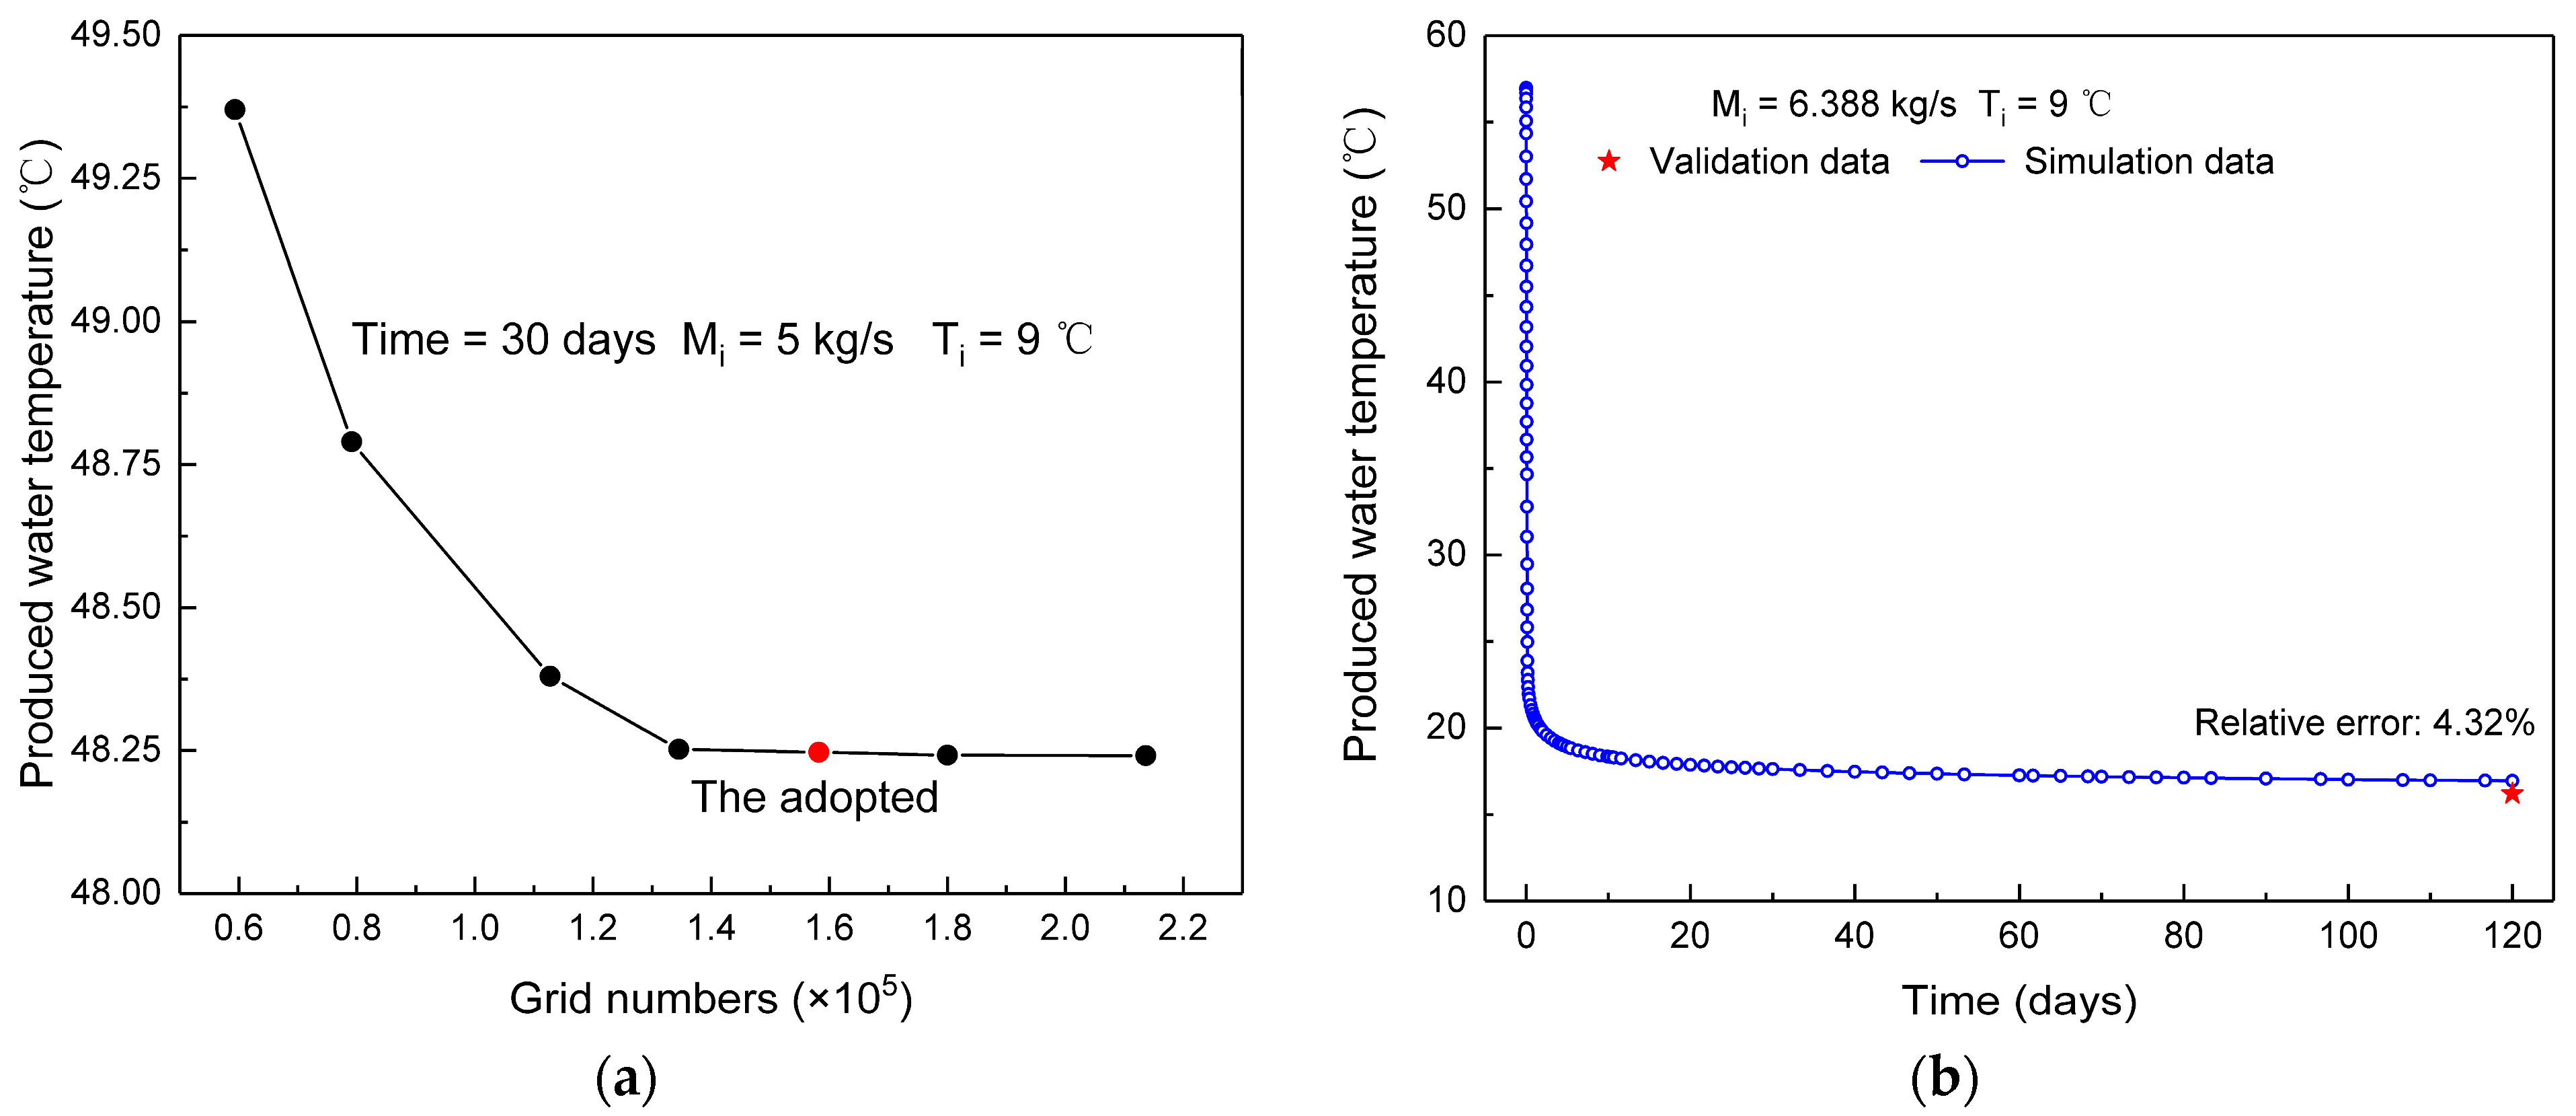
To accurately simulate the evolution of the temperature field around the wellbore, the grid size was refined from the model boundary to the wellbore. As can be seen from Figure 3a, the produced water temperature stabilized when the grid was encrypted to 134,504. Ultimately, the model was divided into 23, 91, and 86 grids in X, Y, and Z-directions, respectively, totaling 179,998 grids. Model validation was conducted using the vertical well closed-loop geothermal system, as shown in Figure 3b. Since the influence of low thermal conductivity cement on heat transfer was not considered, our simulation result was slightly higher than that in Ref. [41]. However, the relative error is less than 5%, demonstrating the reliability of our simulation.

3. Results

The following equation is employed to calculate the thermal power under various operating conditions,
Qp = Mi·Cw·(Tp − Ti),
where Qp is the thermal power, kW; Cw is the specific heat capacity of water, 4.2 kJ/(kg·°C); and Tp is the temperature of produced water, °C.

3.1. The Effect of Horizontal Section Length

3.1.1. Temperature Field Evolution

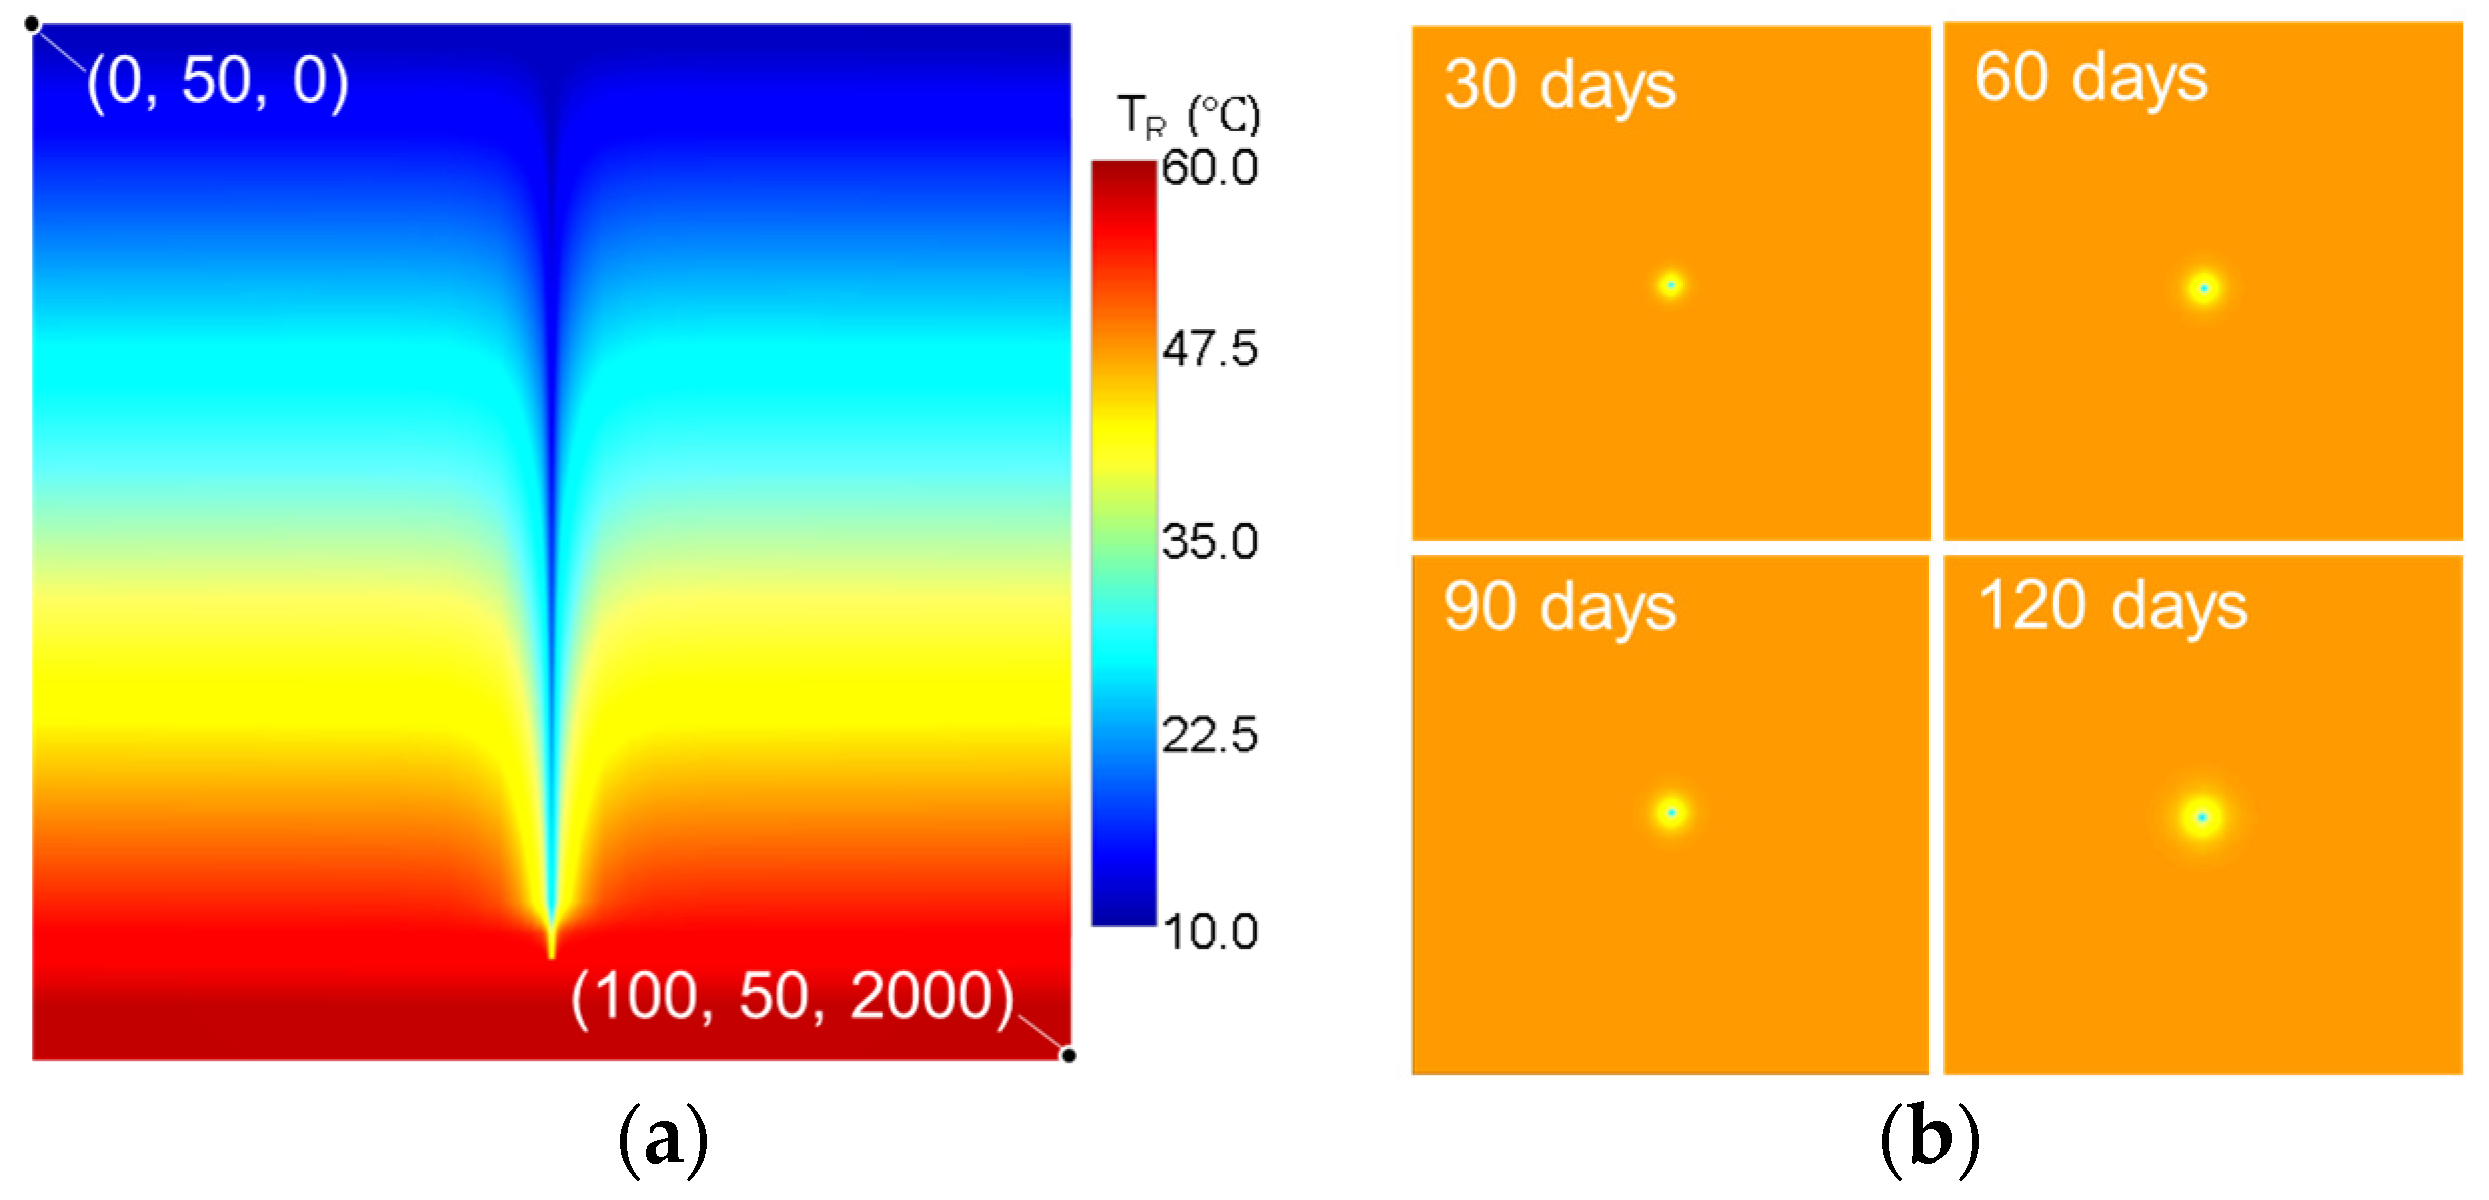
Figure 4 shows the evolution of the temperature field of the vertical well geothermal system. The temperature of the injected water gradually increases as it flows downward. Also, a temperature drop funnel formed around the wellbore. Furthermore, this funnel gradually widens, with the vertical wellbore at its center. The temperature drop radius increased from 8.9 to 15.5 m when the production time was increased from 30 to 120 days, and the formation temperature 3 m away from the well decreased from 47.23 to 43.74 °C. Overall, the temperature drop zone was limited to within 20 m and cannot reach model boundaries, ensuring the accuracy of subsequent simulations.
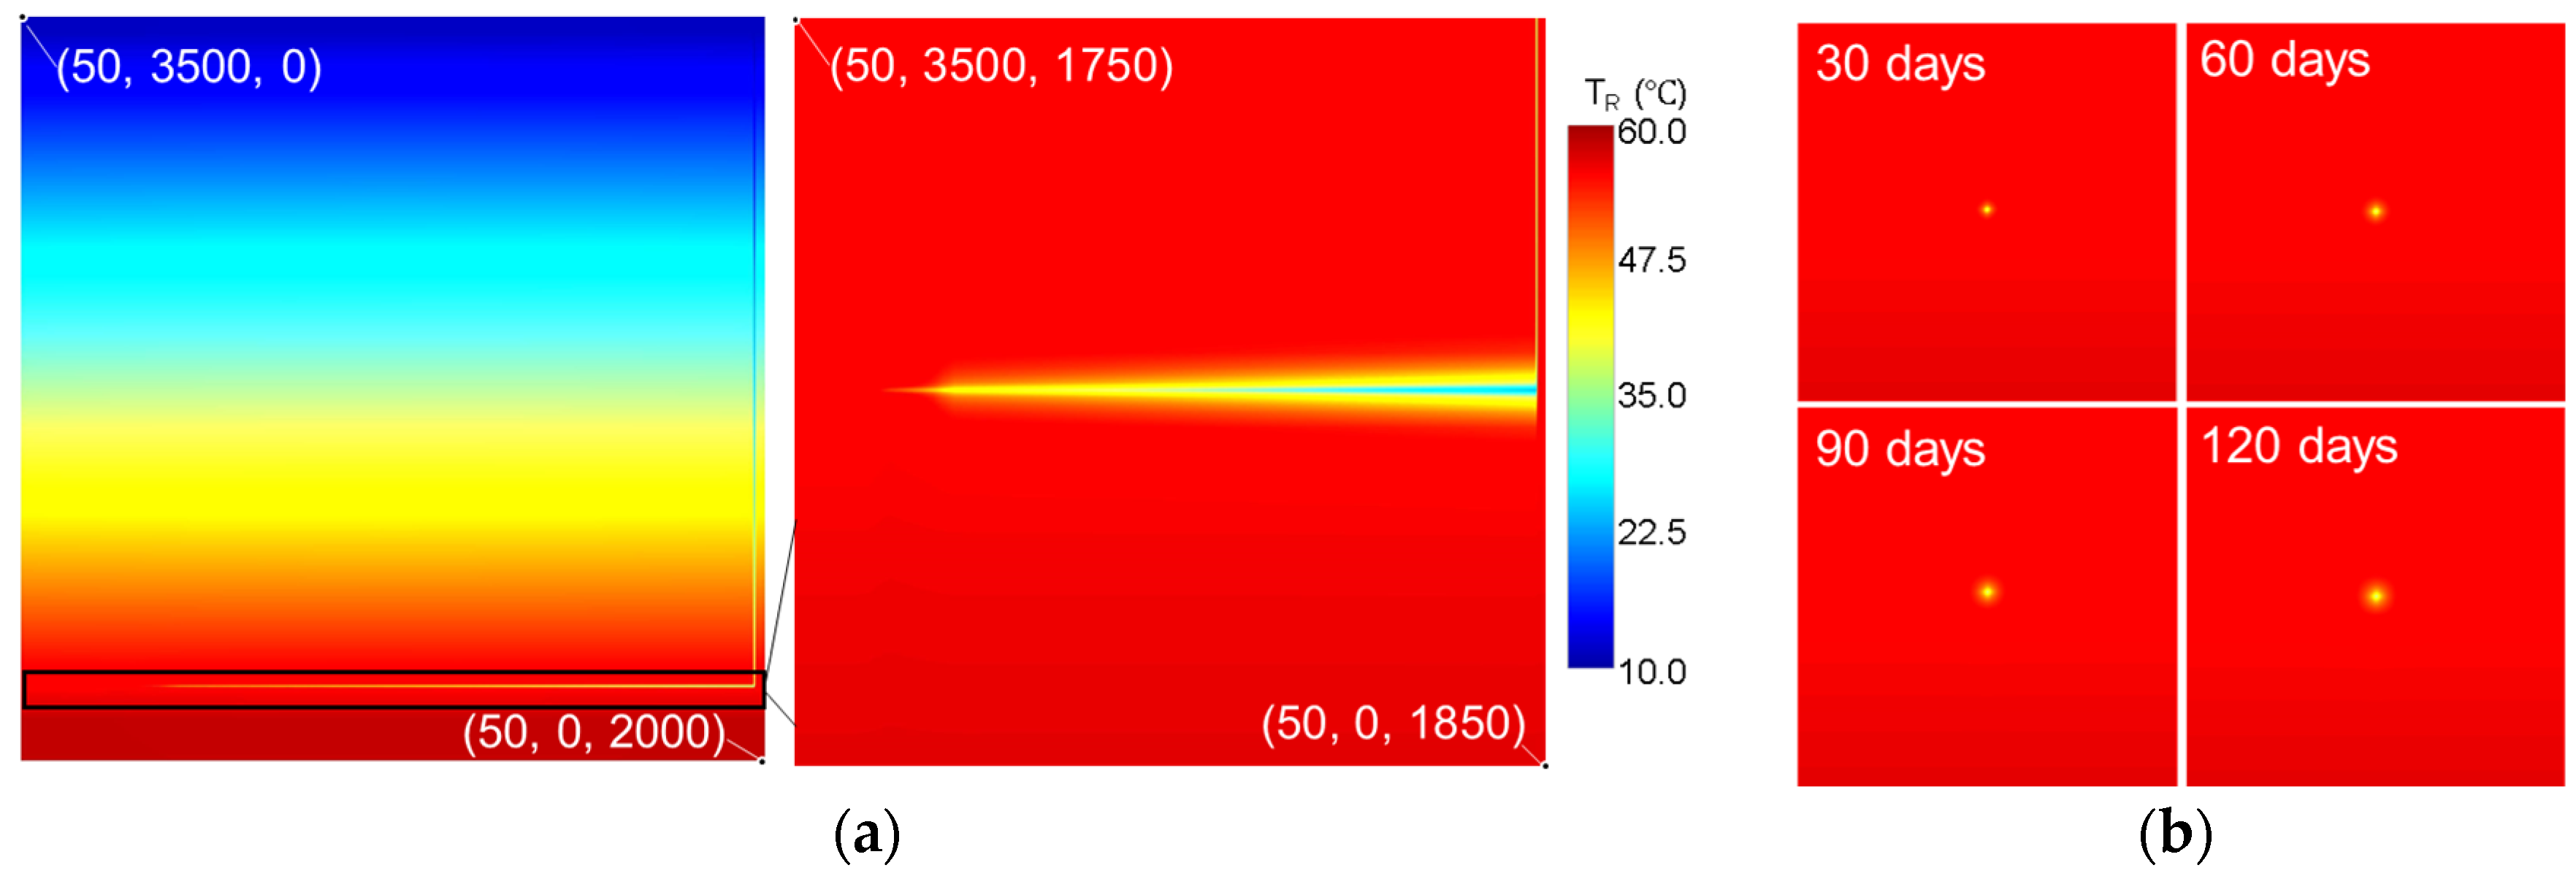
Figure 5 presents the evolution of the temperature field of the horizontal well geothermal system. As cold water is injected from the foot of the horizontal section toward the toe, the temperature of the injected water increases greatly, proving the validity of the horizontal section. Furthermore, as heat exchange efficiency decreases, the temperature decrease zone around the horizontal section gradually shrinks from the heel to the toe. Affected by the geothermal gradient, the temperature distribution around the horizontal section is no longer symmetrical. The temperature drop radius increased from approximately 4.8 to approximately 20 m from 30 to 120 days, and the formation temperature 5 m below the wellbore decreased from 57.02 to 55.45 °C. The above analysis proves that the heat extraction efficiency of the horizontal section is promising due to the increased heat exchange area and heat exchange time.

3.1.2. Heat Extraction Performance

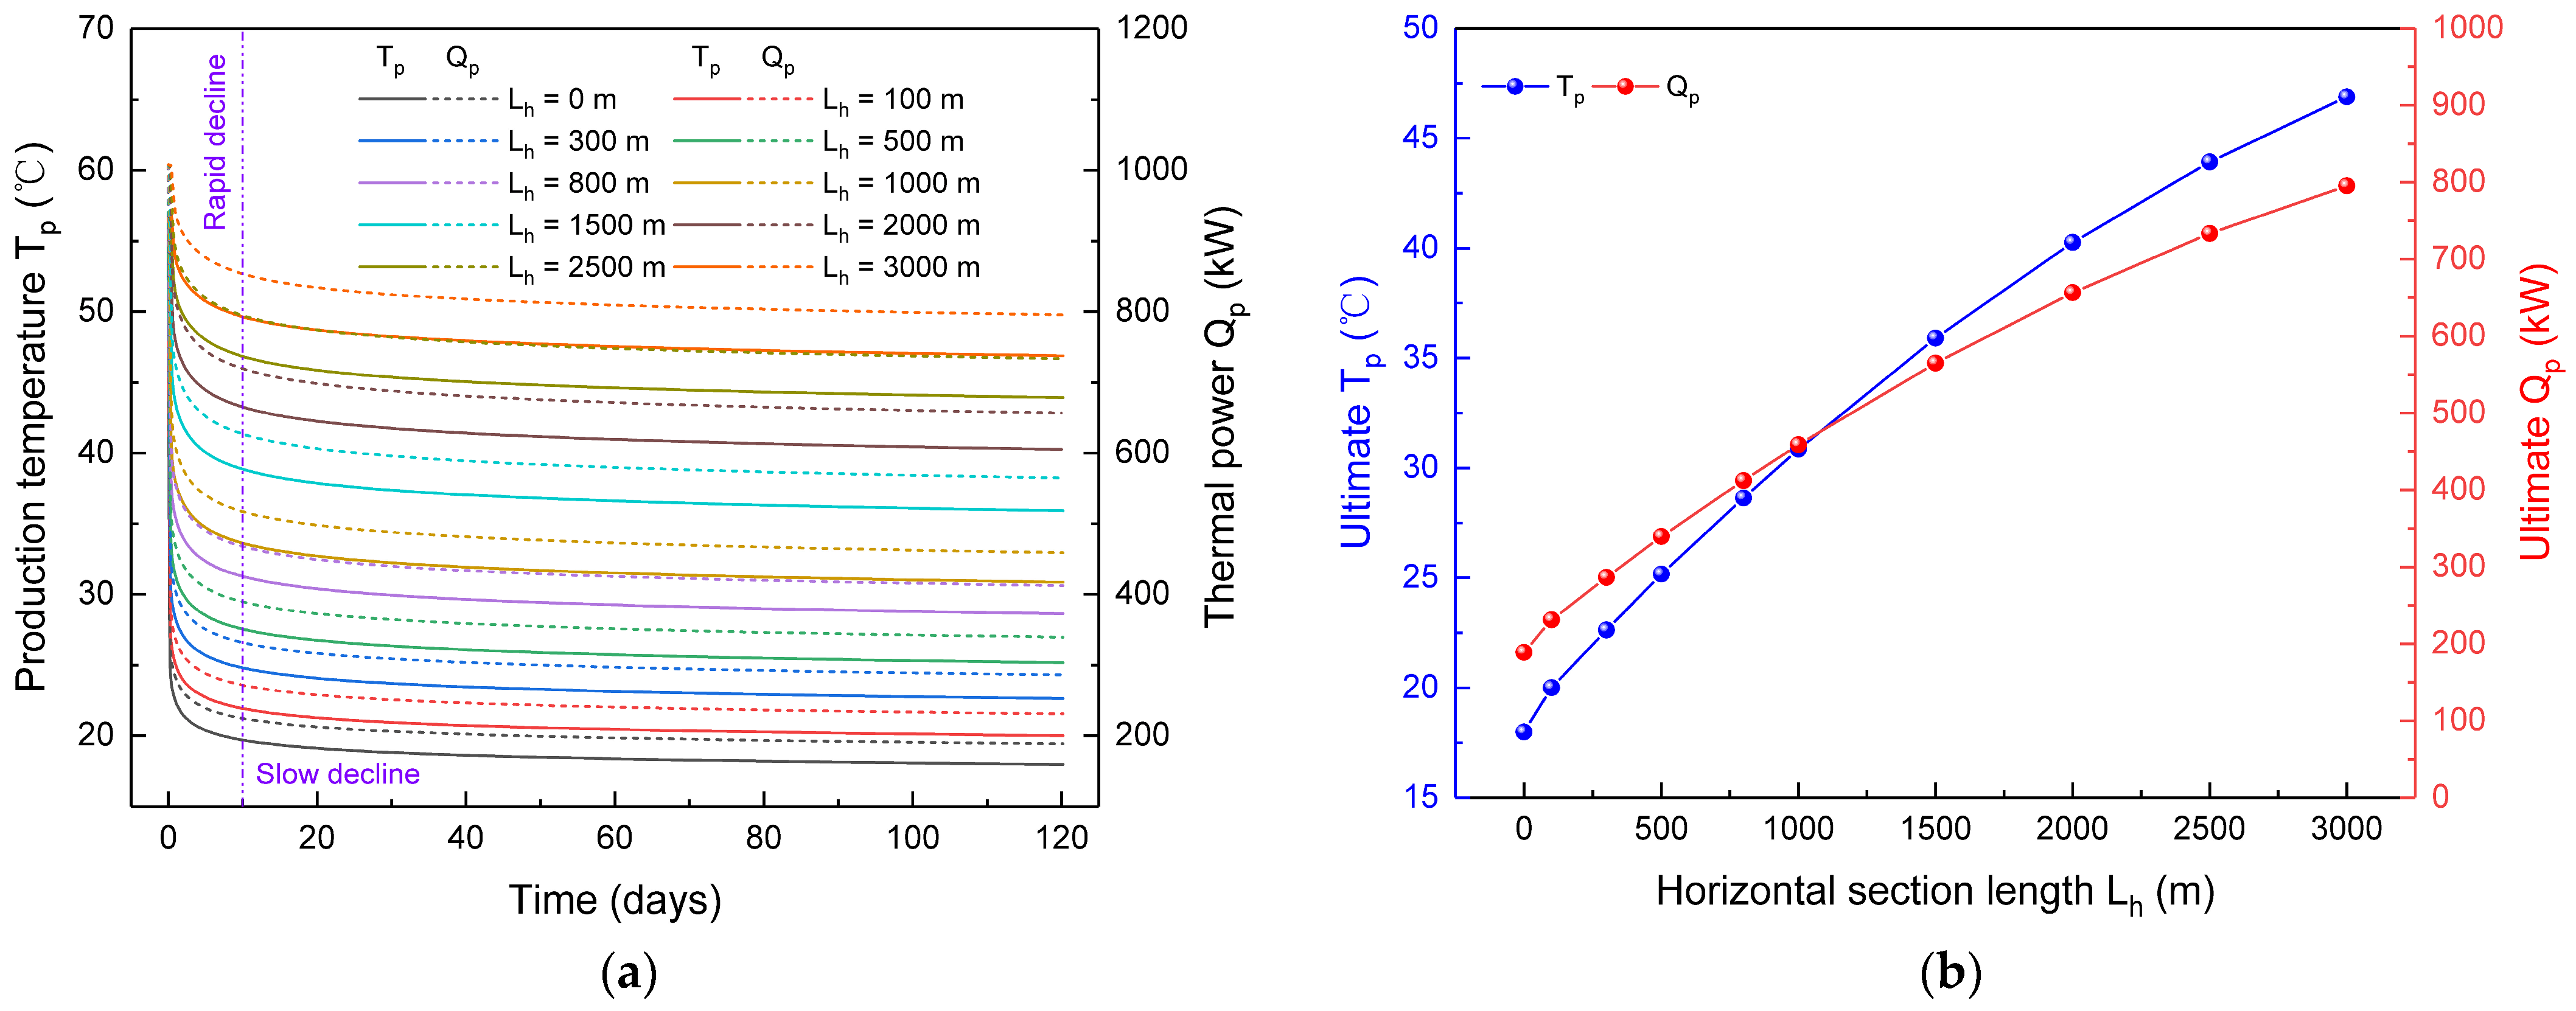
Figure 6 shows the TP and Qp for various Lh values. Since it was assumed that the initial water temperature in the wellbore was consistent with the formation temperature, the initial Tp and Qp were 57 °C and 1008 kW. Subsequently, with the injection of cold water, Tp and Qp showed an overall downward trend, and the decreasing rate gradually slowed down. This resulted in the evolution of Tp and Qp being divided into two stages: an initial sharp decrease, followed by (after about 10 days) a slow decrease. The mechanism is that the heat exchange between the injected water and the formation eventually reaches an approximately “stable” state. When Lh is 0 m (representing the use of the traditional vertical well heat extraction system), the Tp and Qp at 120 days are 17.98 °C and 188 kW. As Lh increases from 500 to 3000 m, the ultimate Tp increases from 25.17 to 46.87 °C, and the ultimate Qp increases from 339 to 795 kW, which are 1.39–2.60 and 1.79–4.21 times higher than those of the vertical well system, respectively. This indicates that increasing Lh dramatically improves heat extraction efficiency. Additionally, both the increased rates of ultimate Tp and Qp gradually decrease with the increase of Lh. Therefore, the preferred Lh should be determined by comprehensively considering drilling costs and heat extraction capacity in further field applications. In our subsequent simulations, Lh was set to 0, 1000, 1500, 2000, and 3000 m, respectively, to thoroughly examine the heat extraction potential of various geo-engineering factors.

3.2. The Influence of Injection Rate

Figure 7 shows the Tp and Qp for various Mi values. As can be seen, Tp decreases as Mi increases, while Qp presents an opposite trend. Specifically, when Mi increased from 1 to 10 kg/s, the ultimate TP at Lh of 1500 m decreased from 25.34 to 35.67 °C, and the ultimate Qp increased from 185 to 929 kW. This indicates that increasing Mi can significantly improve heat extraction efficiency, but simultaneously decreases Tp. Given that insufficient Tp is unfavorable for real-world applications (such as building heating), there should exist an upper limit value for Mi. Furthermore, the increase rate of Qp gradually decreases with increasing Mi, while Tp increases approximately linearly. When Lh increased from 0 to 3000 m, the ultimate Tp at Mi values of 1, 2, 3, 4, 5, and 10 kg/s increased by 75%, 122%, 144%, 154%, 160%, and 169%, respectively, and the ultimate Qp increased by 104%, 194%, 251%, 291%, 321%, and 402%, respectively. This demonstrates that increasing Lh effectively suppresses the reduction in Tp caused by the increase in Mi, thereby further improving heat extraction efficiency. Consequently, compared to vertical well systems, the upper limit value of Mi in horizontal well systems is significantly improved.

3.3. The Influence of Injection Water Temperature

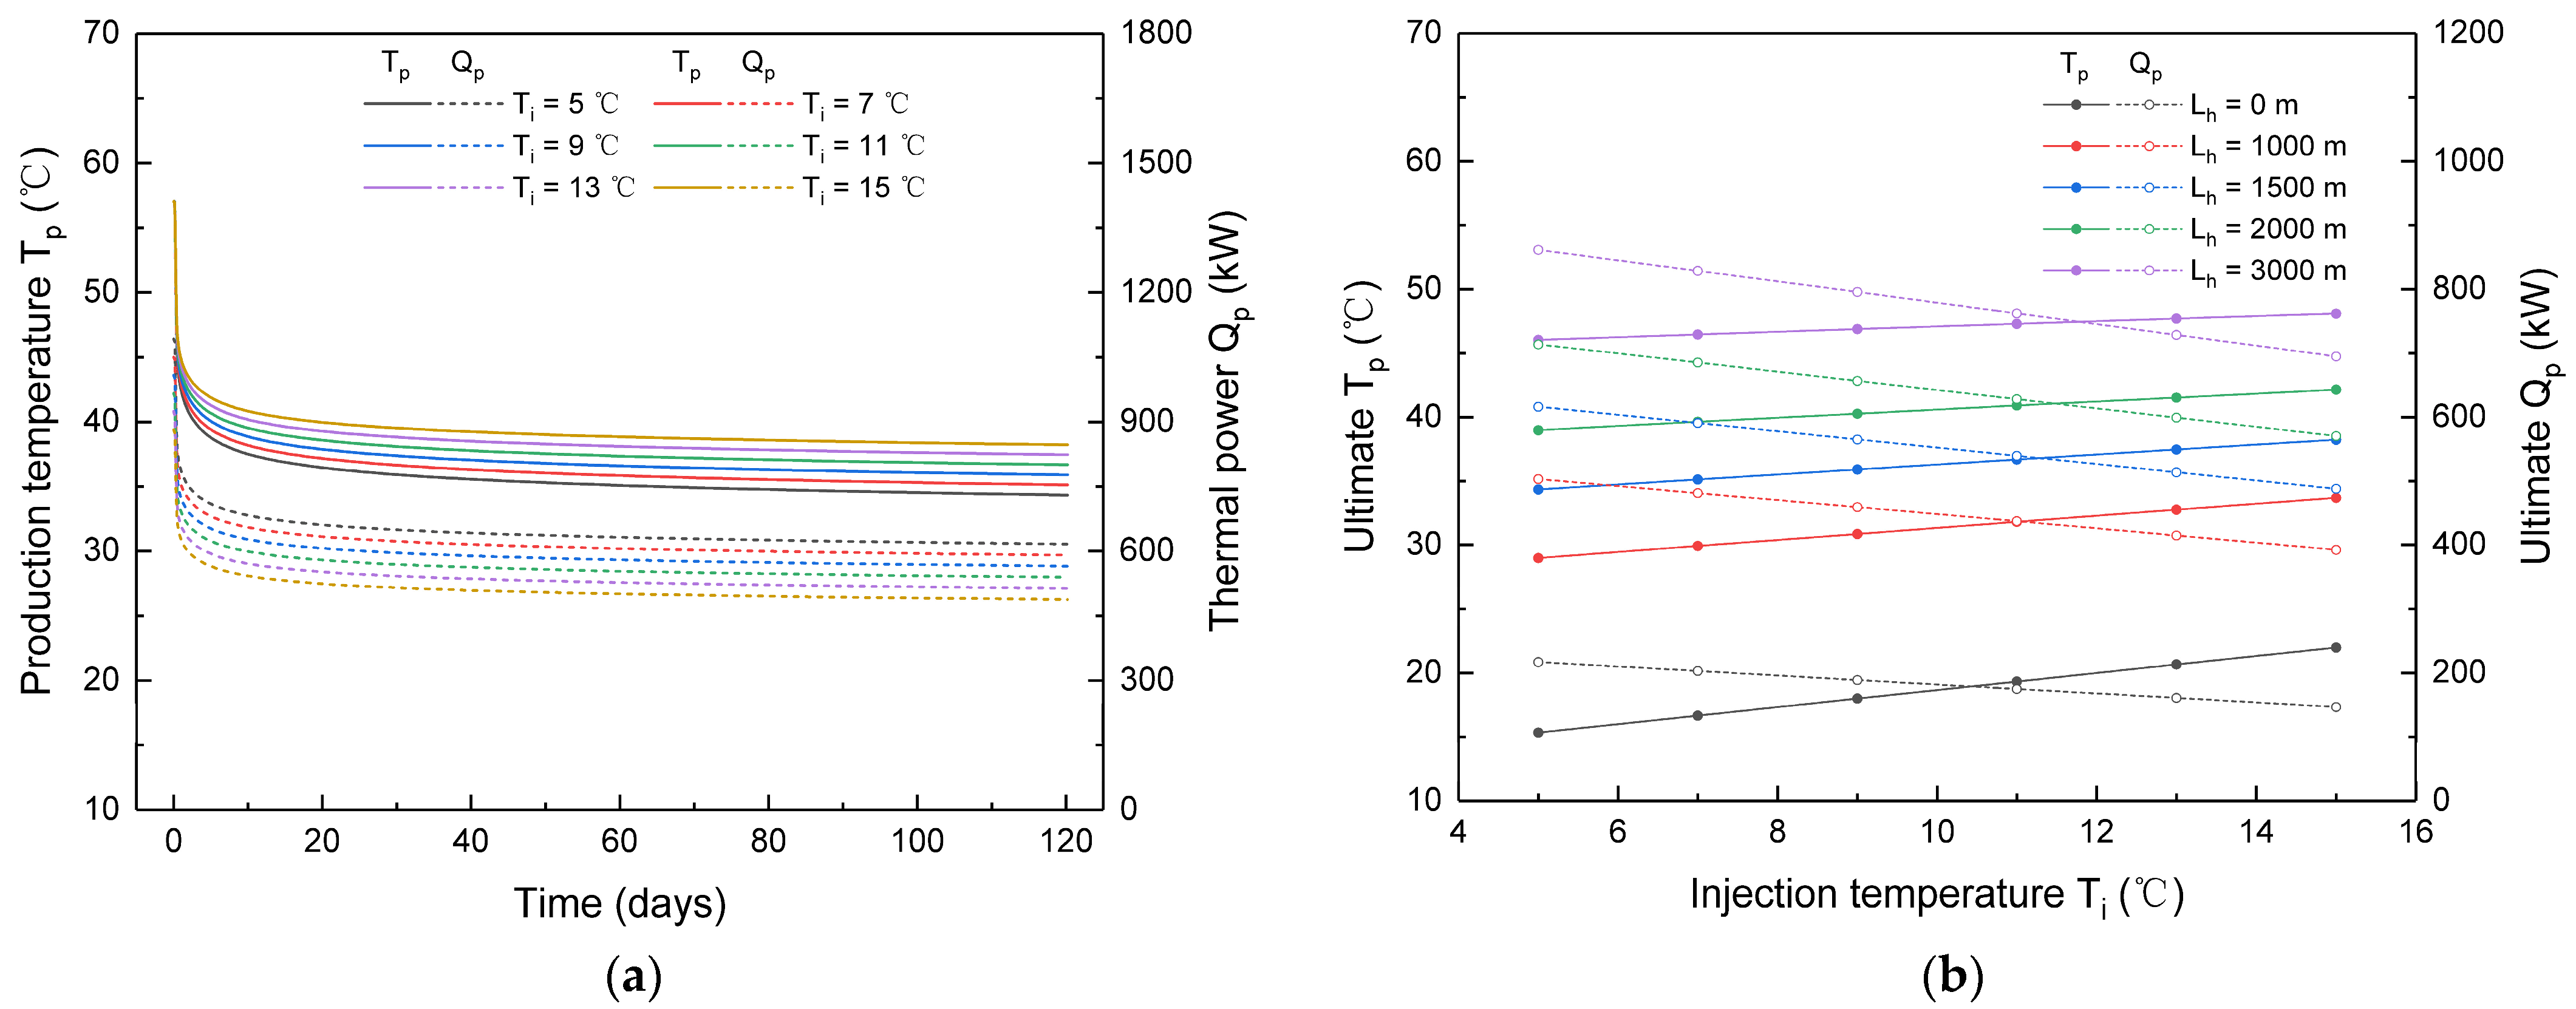
Figure 8 exhibits the TP and Qp for various Ti values. As can be seen, improving Ti favors gaining a higher Tp value. Specifically, when Ti increased from 5 to 15 °C, the ultimate TP at Lh of 1500 m increased from 34.34 to 38.22 °C, and the ultimate Qp decreased from 616 to 487 kW. That is, an improvement of 10 °C in Ti results in an improvement of only 3.88 °C in Tp. This demonstrates that improving Tp by increasing Ti is not satisfactory, as it weakens the heat extraction from the formation. In addition, the variation in both ultimate Tp and ultimate Qp at various Lh values with Ti is approximately linear. Specifically, when Ti rises from 5 to 15 °C, the increase in ultimate Tp at Lh of 0, 1000, 1500, 2000, and 3000 m is 6.66, 4.71, 3.88, 3.17, and 2.07 °C, respectively, and the decrease in ultimate Qp is 70, 111, 129, 143, and 167 kW, respectively. This indicates that as Lh increases, the contribution of improving Ti to heat extraction becomes increasingly insignificant. As a result, increasing Ti is not an ideal way to improve heat extraction capacity.

3.4. The Influence of Geothermal Gradient

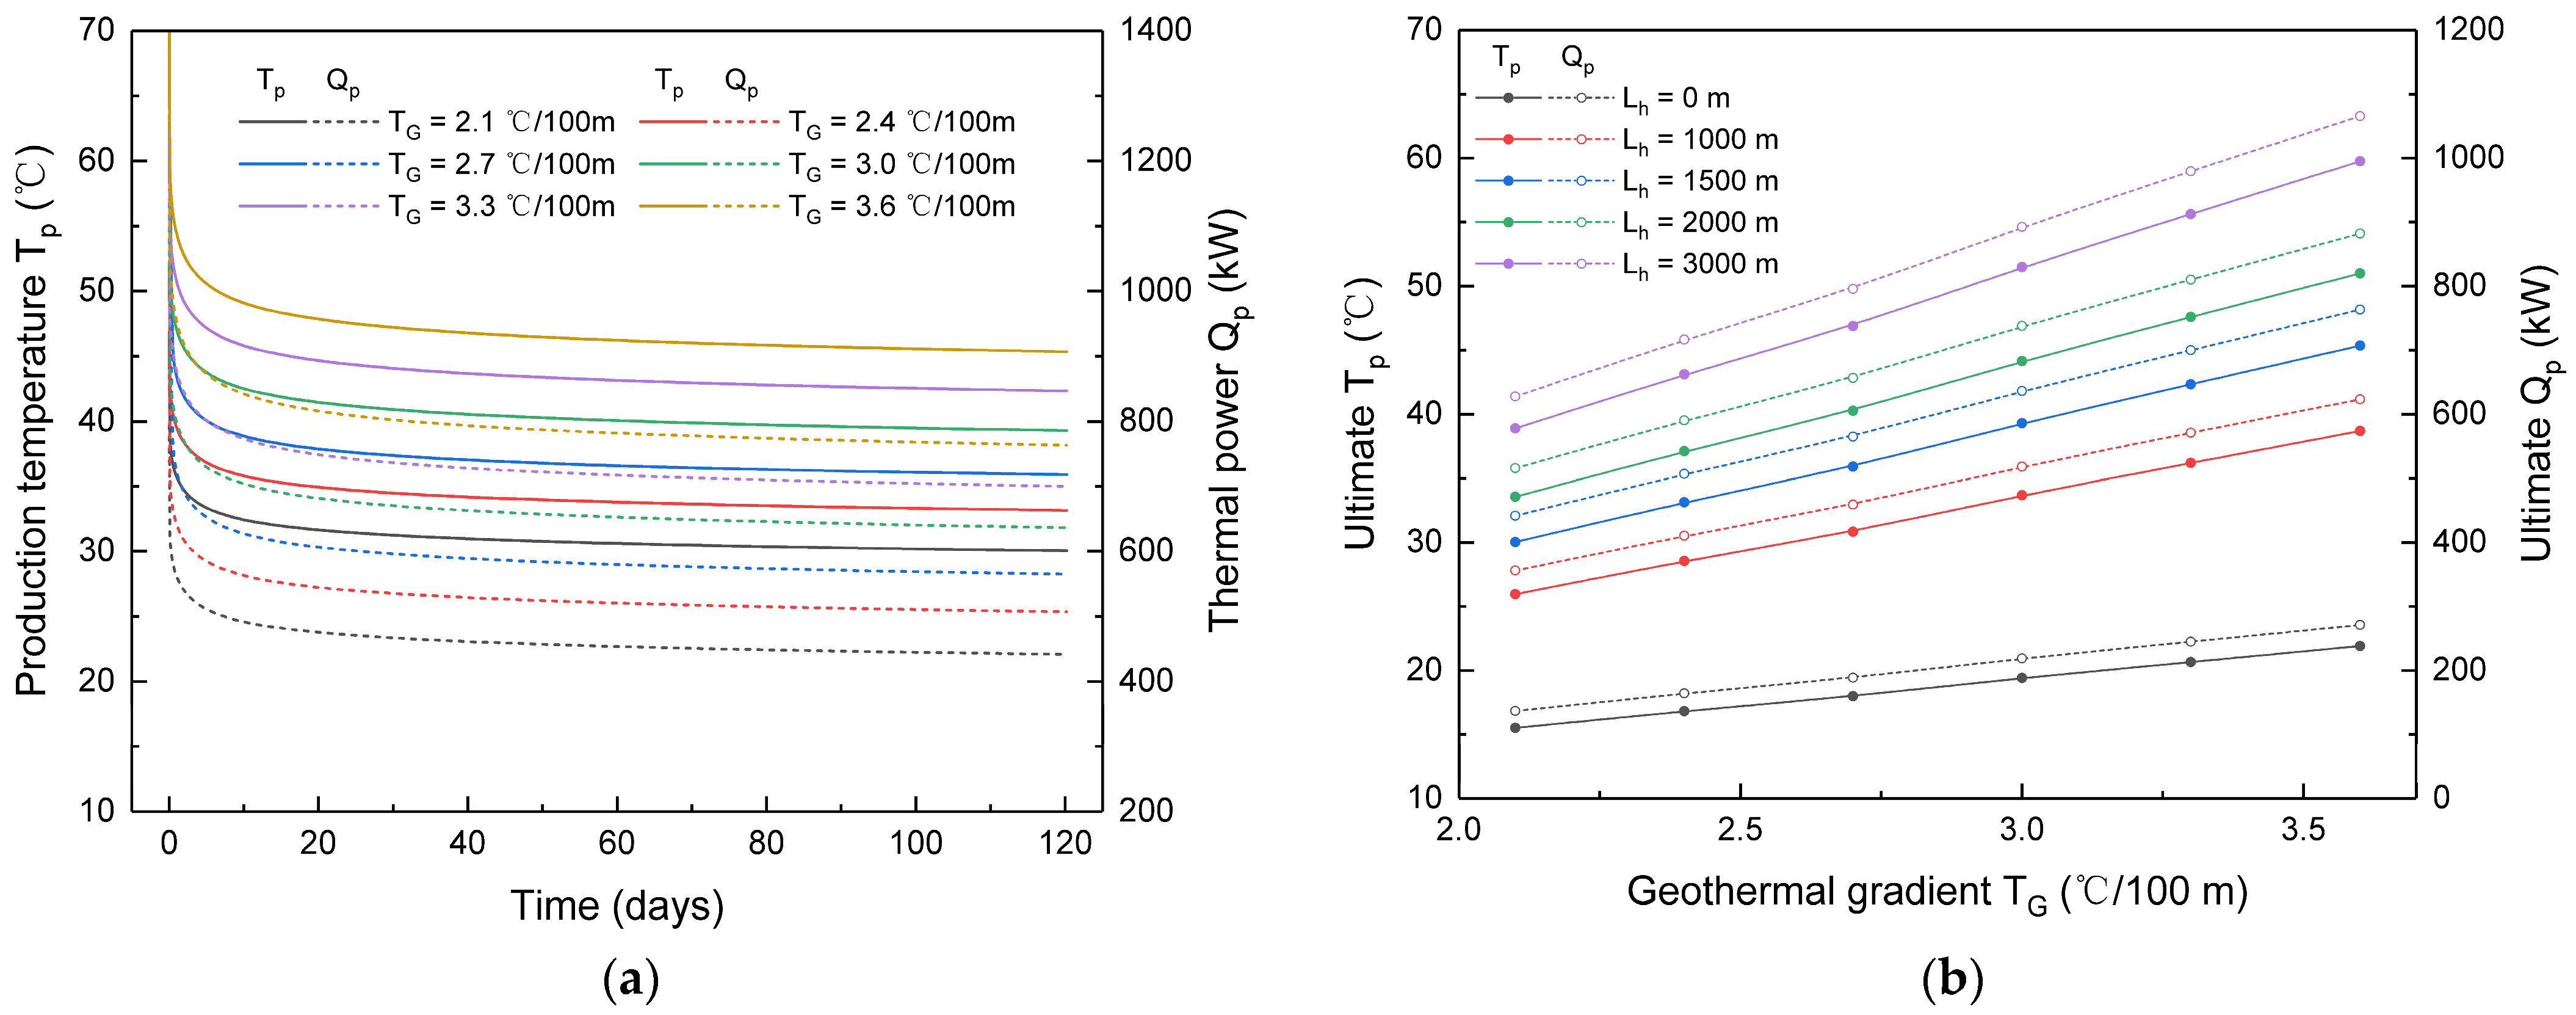
Figure 9 shows the Tp and Qp for various TG values. It can be observed that both Tp and Qp increase with increasing TG as higher formation temperatures are more conducive to heating the injected cold water. Specifically, the ultimate Tp and ultimate Qp at Lh of 1500 m increased from 30.03 °C and 441 kW to 45.34 °C and 763 kW as TG increased from 2.1 to 3.6 °C/100 m. That is, an increase in formation temperature of 27 °C at 1800 m resulted in increases of 15.31 °C and 332 kW in Tp and Qp, respectively. This illustrates that the impact of TG on heat extraction efficiency is quite noticeable. Furthermore, the ultimate Tp and ultimate Qp increase approximately linearly with increasing TG. When TG increases from 2.1 to 3.6 °C/100 m, the enhancement in ultimate Tp and ultimate Qp at Lh of 0 m are 6.40 °C and 134 kW, while they are 12.73, 15.31, 17.44, and 20.86 °C and 267, 322, 366, and 483 kW at Lh of 1000, 1500, 2000, and 3000 m. This reveals that as Lh increases, the improvement in heat extraction capacity under a greater TG value becomes more substantial due to the more efficient heat exchange occurring there.

3.5. The Influence of Rock Heat Conductivity

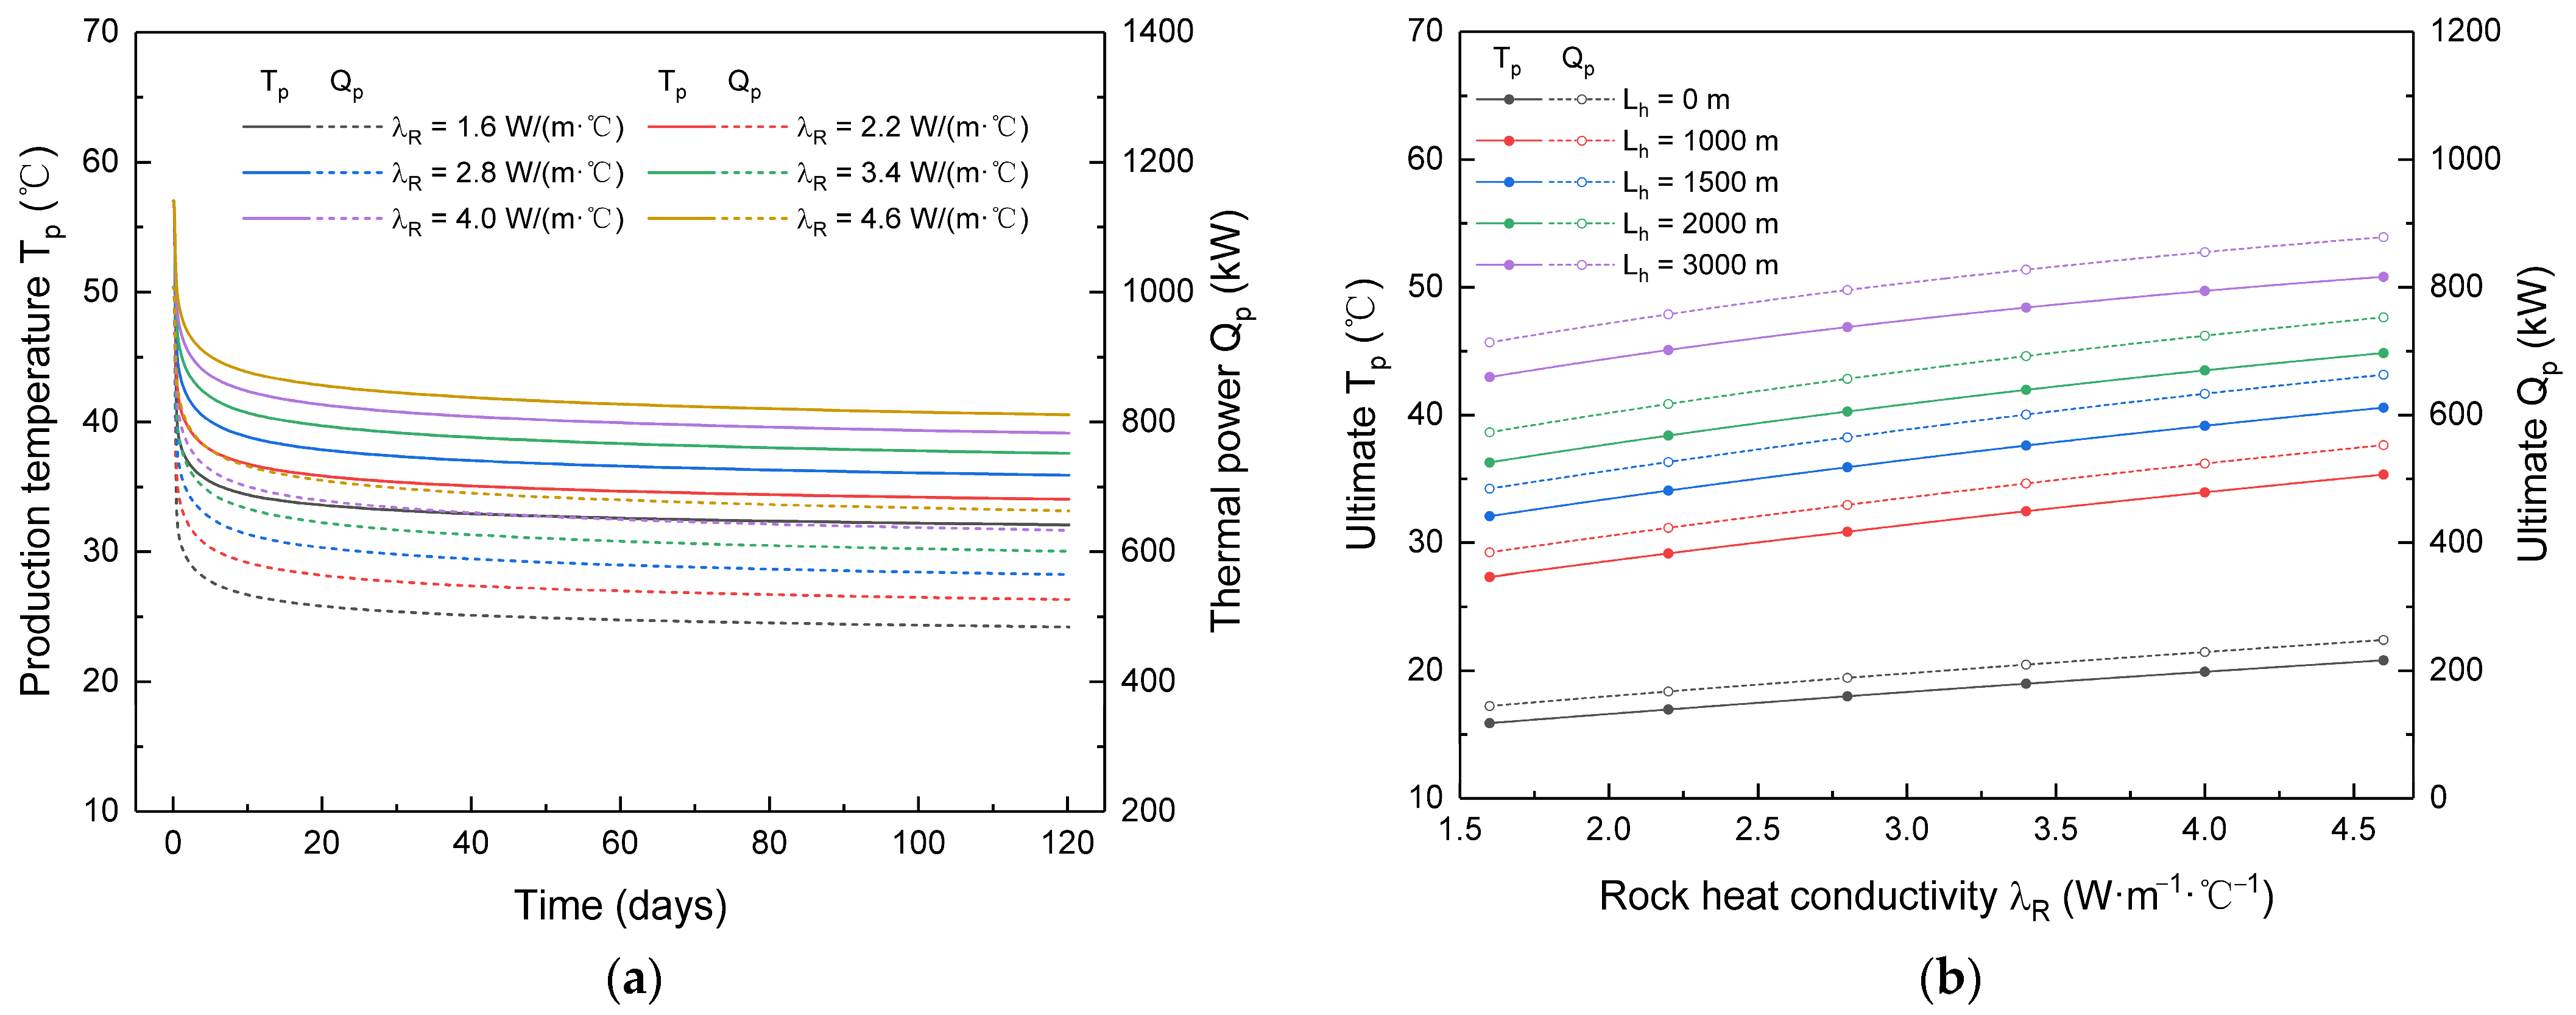
Figure 10 shows the Tp and Qp for various λR values. It can be identified that as λR increases, the initial Tp and Qp decay rates gradually decrease, resulting in a more considerable heat extraction efficiency. Specifically, the ultimate Tp and ultimate Qp increased from 15.88 °C and 144 kW to 20.80 °C and 247 kW at Lh of 1500 m as λR increased from 1.6 to 4.6 W/(m·°C). The mechanism is that a greater λR value is more conducive to the transmission of heat from the formation to the wellbore. Furthermore, the ultimate Tp and ultimate Qp increase approximately linearly as λR increases. Specifically, when λR increases from 1.6 to 4.6 W/(m·°C), the enhancement in ultimate Tp and ultimate Qp at Lh of 0 m are 4.92 °C and 103 kW, while they are 7.86–8.58 °C and 165–180 kW at Lh of 1000–3000 m. This reveals that a greater λR value is more conducive to heat extraction in horizontal well systems, attributed to the more considerable heat exchange area. Furthermore, in the current simulation, there is an optimal Lh value of 2000 m, where the improvement in heat extraction efficiency is most pronounced by increasing λR.

4. Multivariate Sensitivity Analysis

The above results analysis indicates that the heat extraction efficiency of horizontal wells is influenced by multiple geo-engineering factors. However, the relative importance of these factors in heat extraction has not yet been quantitatively determined. In this study, the eXtreme Gradient Boosting (XGBoost) algorithm combined with SHapley Additive exPlanations (SHAP) algorithm was employed to address this concern.
XGBoost is an ensemble learning algorithm that improves upon traditional gradient boosting trees. By combining multiple weak learners (typically decision trees), it builds a powerful ensemble model in which each weak learner attempts to correct the errors of the previous weak learner [42]. SHAP is an explainable machine learning method used to explain model predictions [43]. Currently, the combination of XGBoost and SHAP has become an effective means of feature recognition, multivariate importance assessment, and decision-making support in complex engineering systems [44].
The application process of XGBoost-SHAP in this study is as follows: firstly, the ultimate Tp and ultimate Qp was treated as target output, respectively, and influencing factors including Lh, Mi, Ti, TG, and λR were treated as model inputs to construct the XGBoost regression model; then, based on the simulation data, the XGBoost regression modes were trained until the prediction error is less than 1%; finally, the SHAP value of each influencing factor was calculated using the SHAP algorithm for importance assessments.
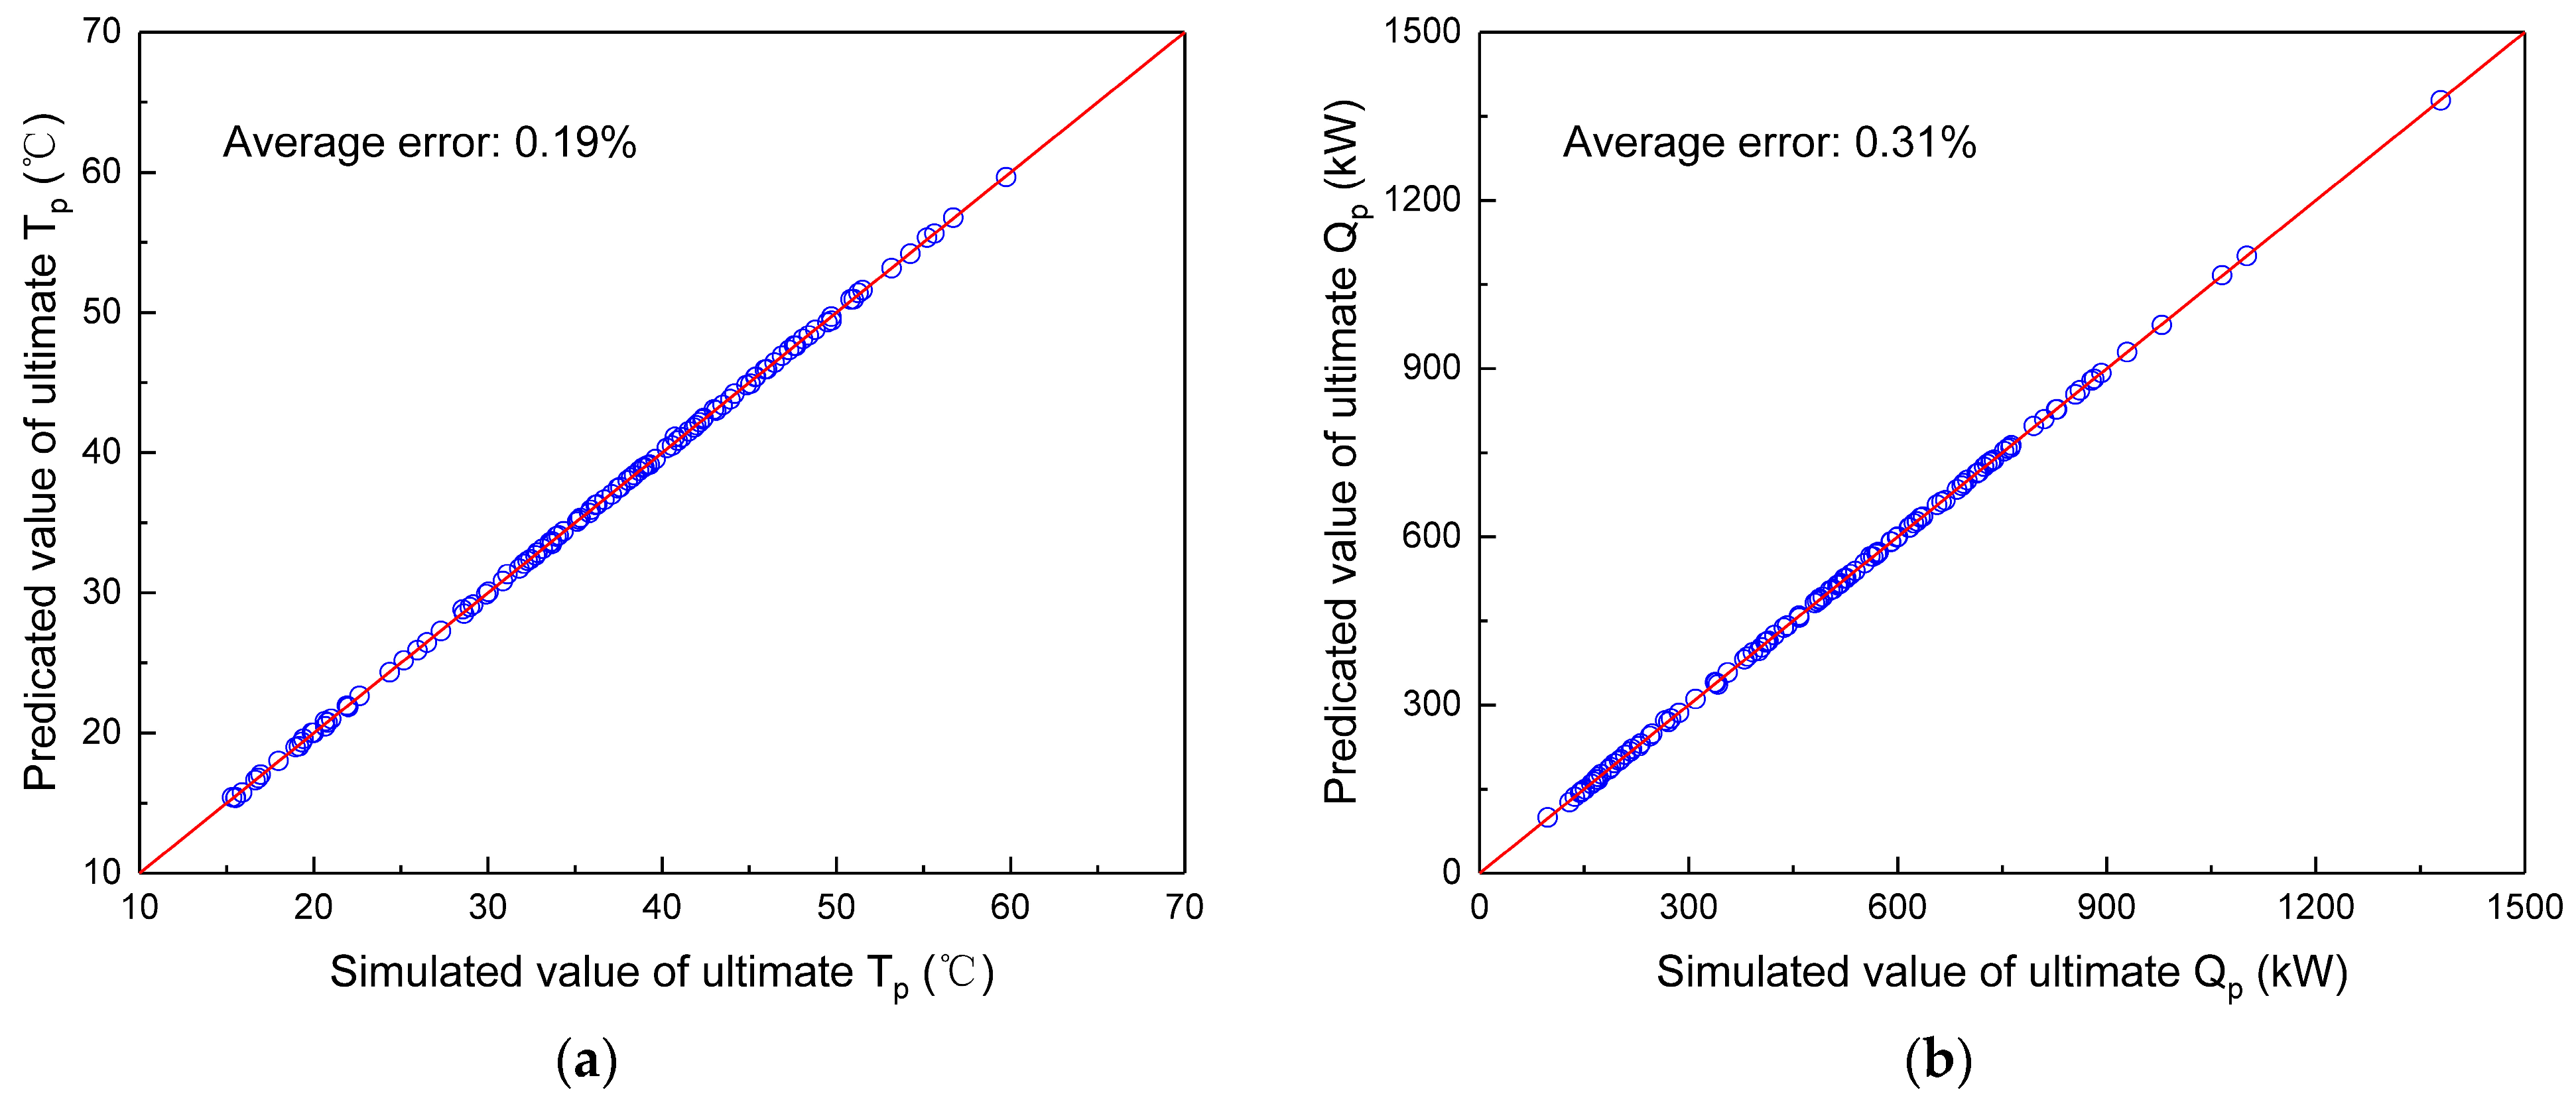
Figure 11 shows the prediction error of the trained XGBoost models. It can be observed that the prediction values of ultimate Qp and ultimate Tp based on the trained XGBoost models are basically consistent with the simulated values, with prediction errors of 0.19% and 0.31%, respectively, indicating prediction accuracies of over 99.6%, which proves the reliability of the trained XGBoost models.
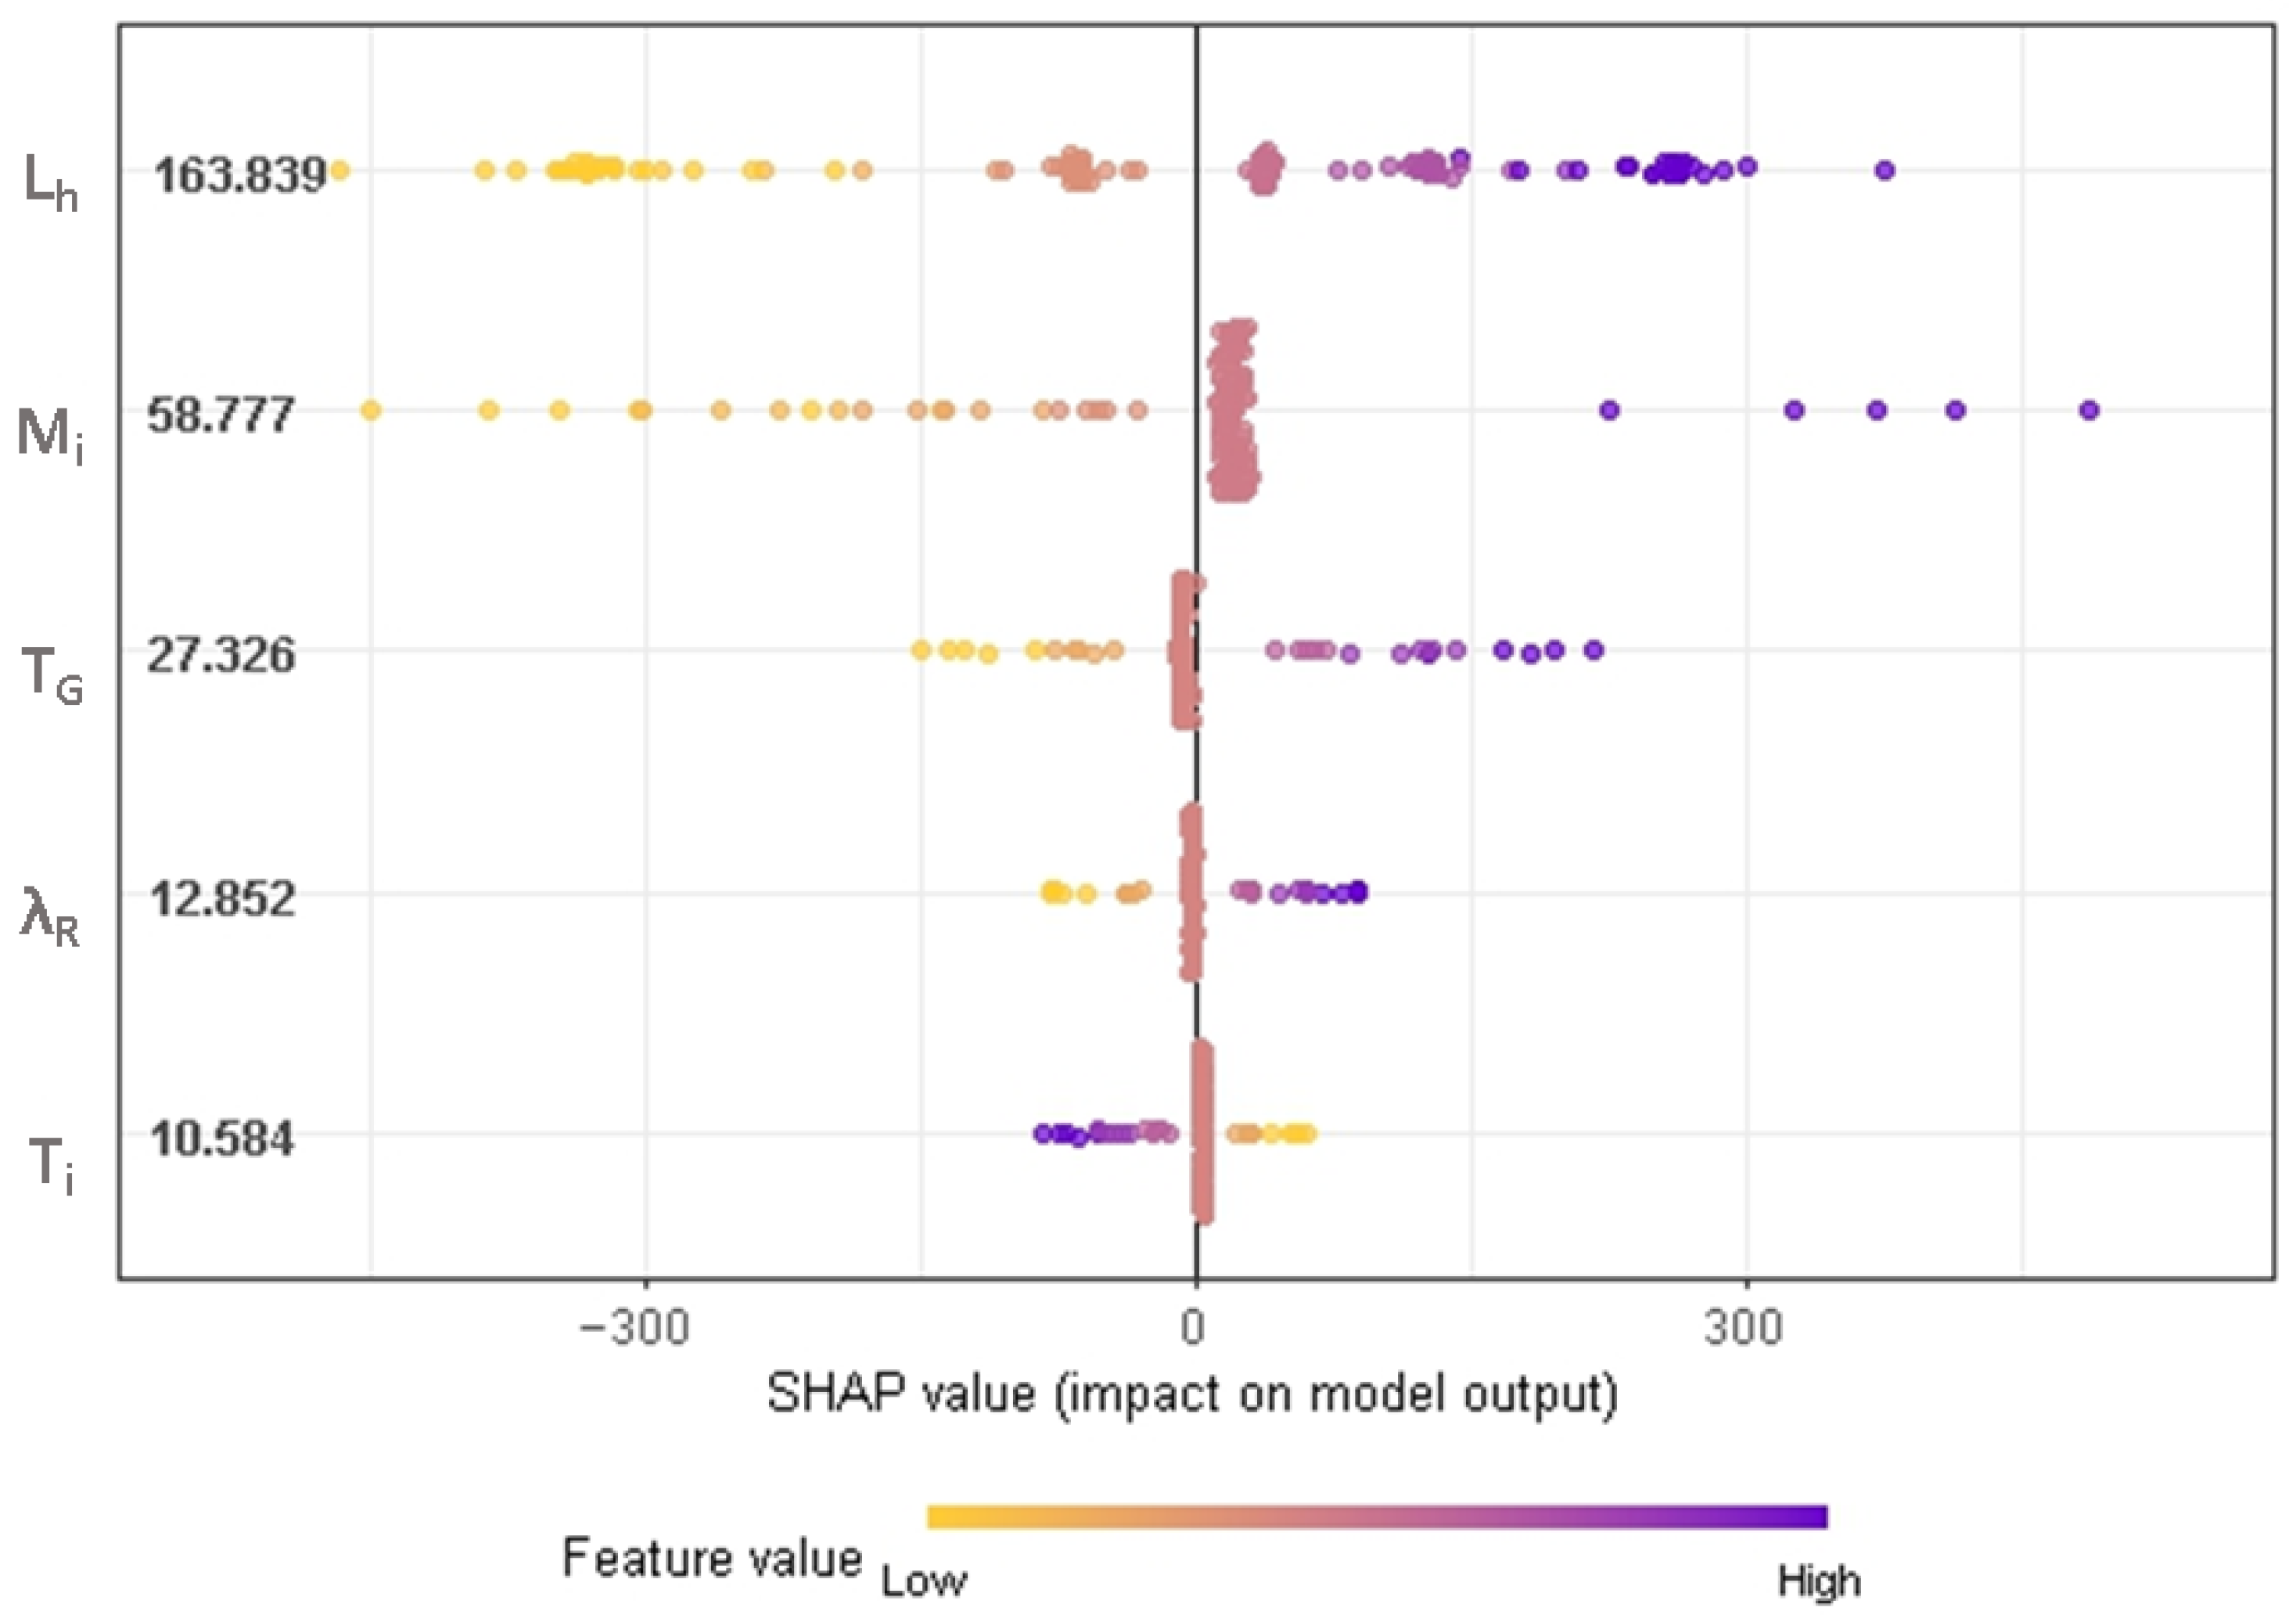
Figure 12 shows the SHAP value of each influencing factor on the ultimate Tp. The feature values of Lh, Ti, TG, and λR increase as the SHAP value increases, indicating they have a positive impact, while Mi presents an opposite trend. Based on the mean SHAP values, the importance of each influencing factor to ultimate Tp is ranked in descending order as follows: Lh (8.134), Mi (1.963), TG (1.270), λR (0.593), and Ti (0.334).
Figure 13 shows the SHAP value of each influencing factor on the ultimate Qp. The feature values of Lh, Mi, TG, and λR increase as the SHAP value increases, indicating they have a positive impact, while Ti presents an opposite trend. Additionally, the importance of each influencing factor to ultimate Qp is ranked in descending order as follows: Lh (165.189), Mi (64.353), Ti (21.428), TG (19.974), and λR (17.054). Consequently, Lh is the dominant factor controlling heat transfer, followed by Mi.
Figure 14 illustrates the interaction effects among the parameters. The shapviz package in R was used to visualize interaction effects, as shown in Figure 14a,b. Main effects are displayed along the diagonal, while interaction effects are indicated on either side of the diagonal. The greater the dispersion of points, the stronger the interaction between parameters. To quantify interaction effects, interaction matrices were further plotted as shown in Figure 14c,d. It can be observed that for ultimate Tp, interaction strengths between parameters are all below 0.36 and relatively weak, indicating that Tp primarily depends on the main effects of Lh and Mi. For Qp, a significant interaction exists between Lh and Mi, with a maximum interaction strength of 23.598. Interactions among other parameters are relatively weak. Therefore, Qp is primarily determined by the main effects of Lh and Mi, as well as their interaction.
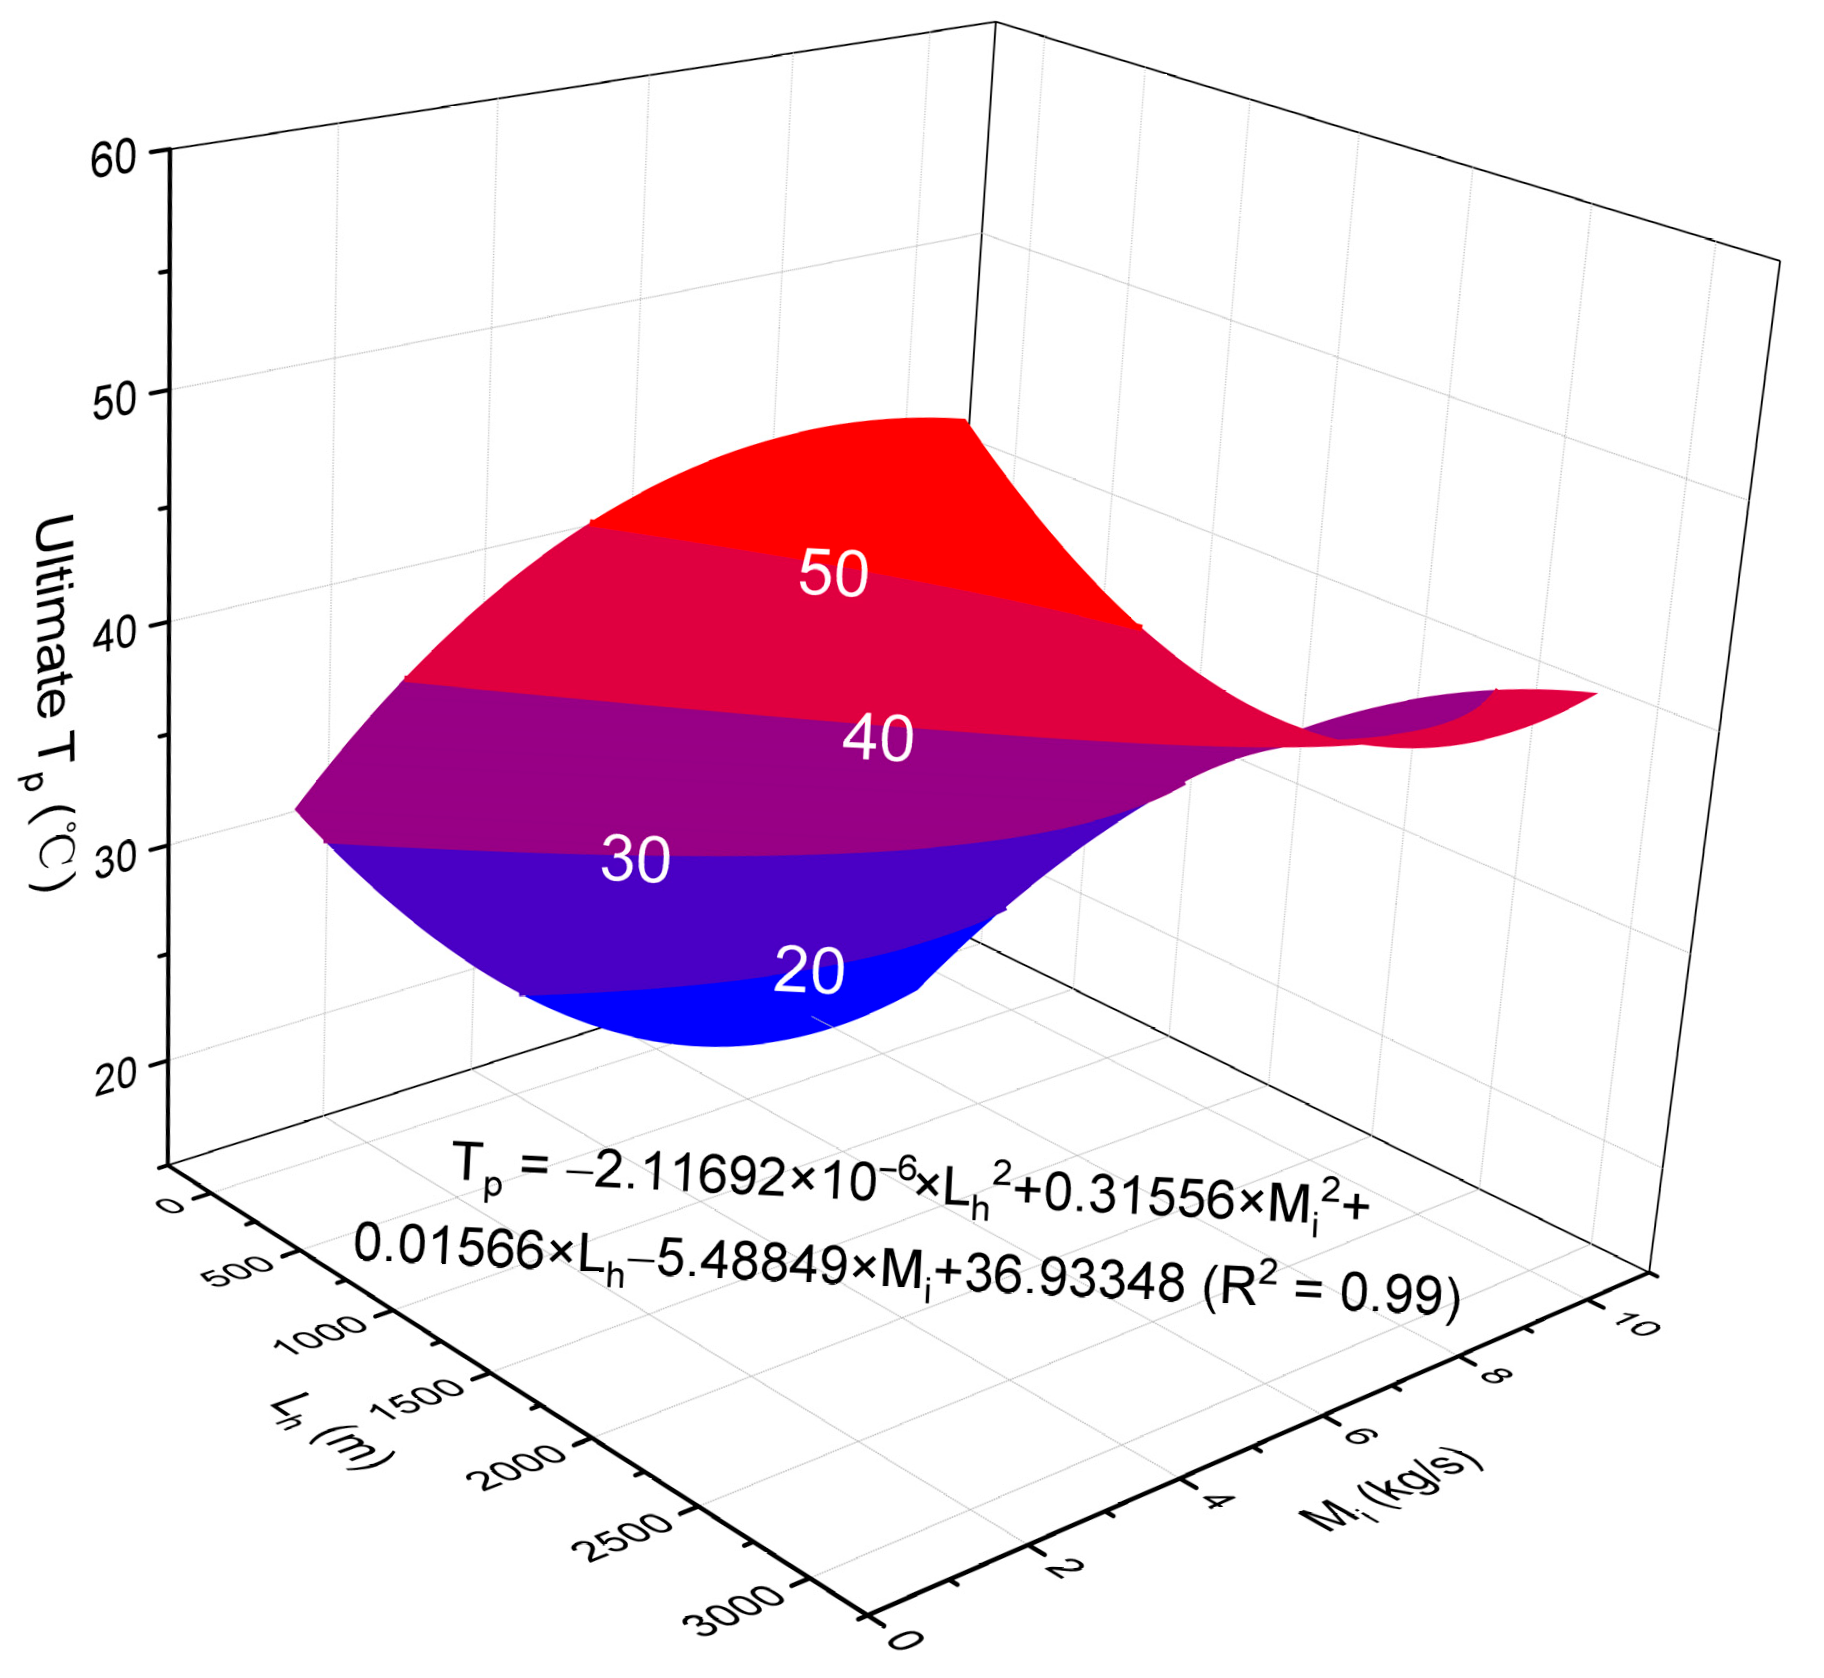
The above analysis indicates that Lh and Mi are the dominant factors influencing heat extraction efficiency. Based on this, we optimized the horizontal well closed-loop geothermal system for the Xiong’an New Area geothermal field. Taking the operational conditions of the vertical well closed-loop geothermal system in Ref. [41] as a typical case (Mi = 23 m3/h, Ti = 9 °C), the relationship between ultimate Tp with Mi and Lh is presented in Figure 15. The Tp and Qp of the vertical well closed-loop geothermal system were reported as 16.2 °C and 192 kW, respectively, far below the minimum acceptable temperature of 40 °C for winter heating. However, when the Lh reaches 2375 m in the horizontal well closed-loop geothermal system, the Tp and Qp can be maintained above 40 °C and 831 kW, respectively, demonstrating tantalizing application potential.

5. Conclusions

This study numerically evaluated the heat extraction potential of the horizontal well closed-loop geothermal system and clarified the influencing patterns through multi-parameter analysis. The following conclusions can be drawn.
1. Horizontal well closed-loop geothermal systems demonstrate tantalizing heat extraction potential because the increase in horizontal section length allows for a greater heat exchange area. Specifically, when the horizontal section length increased from 0 to 3000 m, the ultimate production temperature and ultimate thermal power increased from 17.98 °C and 188 kW to 46.87 °C and 795 kW, respectively.
2. The heat extraction efficiency of the horizontal well increases with increasing injection rate, geothermal gradient, and rock heat conductivity, as well as decreasing injection temperature. Particularly, sufficient production temperatures can be achieved at high injection rates by increasing the horizontal section length. E.g., at the maximum injection rate of 10 kg/s, the ultimate production temperature increased from 15.54 to 41.83 °C as the horizontal section length increased from 0 to 3000 m.
3. Multivariate analysis based on XGBoost-SHAP algorithms revealed that horizontal section length (SHAP values of 8.134 and 165.189) was the primary factor influencing the production temperature and thermal power, followed by injection rate (SHAP values of 1.963 and 64.353), injection temperature (SHAP values of 1.270 and 21.428), geothermal gradient (SHAP values of 0.953 and 19.974), and rock heat conductivity (SHAP values of 0.334 and 17.054). As a result, horizontal section length and injection rate are crucial for the design of the horizontal well closed-loop geothermal system.
4. For the Xiong’an New Area geothermal field, it is recommended that the horizontal section length not be less than 2375 m. This ensures that at the injection rate of 23 m3/h, the produced water temperature and thermal power are higher than 40 °C and 831 kW, thereby meeting the heating demands of buildings during winter.
The findings of this study could provide valuable insight and guidance on the design and application of the horizontal well closed-loop geothermal system in hydrothermal reservoirs. However, it should be noted that the current model was relatively idealized, particularly without accounting for cement sheath conduction and flow regime inside the well (laminar/turbulent). Consequently, targeted model refinement and enhancement are required in subsequent research. In addition, economic feasibility assessments considering construction costs, operational expenses, well lifetime, and heating tariff standards are also required before engineering implementation.

Author Contributions

Conceptualization, S.N.; Methodology, S.N.; Software, X.Z.; Validation, H.G.; Formal analysis, X.Z.; Investigation, K.L., B.Y., J.L. and K.X.; Resources, B.Y.; Data curation, K.L., H.G., J.L. and K.X.; Writing—original draft, S.N.; Project administration, B.Y. All authors have read and agreed to the published version of the manuscript.

Funding

This research was Funded by Science Research Project of Hebei Education Department, grant number QN2024286.

Data Availability Statement

The original contributions presented in this study are included in the article. Further inquiries can be directed to the corresponding author.

Conflicts of Interest

The authors declare no conflicts of interest. The funders had no role in the design of the study, in the collection, analyses, or interpretation of data, in the writing of the manuscript, or in the decision to publish the results.

References

  1. Hong, Y.; Cao, S.; Xu, P.; Pan, Z. Interpreting the effect of global economic risks on crude oil market: A supply-demand perspective. Int. Rev. Financ. Anal. 2024, 91, 103008. [Google Scholar] [CrossRef]
  2. Höök, M.; Tang, X. Depletion of fossil fuels and anthropogenic climate change—A review. Energy Policy 2013, 52, 797–809. [Google Scholar] [CrossRef]
  3. Zhang, T.; Guo, W.; Yang, L.; Li, J.; Tu, J.; Zhu, C. Effect of permeability and oil content on the autothermal pyrolysis in-situ conversion technology. Geoenergy Sci. Eng. 2025, 247, 213692. [Google Scholar] [CrossRef]
  4. Guo, W.; Pan, J.; Yang, Q.; Li, Q.; Deng, S.; Zhu, C. Study of the residual carbon oxidation trigger mechanism in fractured oil shale formation under real condition. Int. Commun. Heat Mass Transf. 2025, 160, 108369. [Google Scholar] [CrossRef]
  5. Afifa; Arshad, K.; Hussain, N.; Ashraf, M.H.; Saleem, M.Z. Air pollution and climate change as grand challenges to sustainability. Sci. Total Environ. 2024, 928, 172370. [Google Scholar] [CrossRef]
  6. Nkinyam, C.M.; Ujah, C.O.; Asadu, C.O.; Kallon, D.V.V. Exploring geothermal energy as a sustainable source of energy: A systemic review. Unconv. Resour. 2025, 6, 100149. [Google Scholar] [CrossRef]
  7. Huang, R.; Song, R.; Zhang, C.; Wang, Y.; Liu, G.; Li, T.; Wu, Y. Geothermal resources along the coast of Beibu Gulf and their utilization: An example from Hepu geothermal field. Nat. Gas Explor. Dev. 2022, 45, 141–149. [Google Scholar]
  8. Zhu, J.; Hu, K.; Lu, X.; Huang, X.; Liu, K.; Wu, X. A review of geothermal energy resources, development, and applications in China: Current status and prospects. Energy 2015, 93, 466–483. [Google Scholar] [CrossRef]
  9. Bao, Y.; Zhao, F.; Du, L.; Pang, Z.; Kong, Y.; Yang, F.; Yang, C.; Huang, J.; Ma, C.; Wu, M.; et al. Review on assessment methodology for hydrothermal resources based on renewable energy attributes. Energy Geosci. 2025, 6, 100397. [Google Scholar] [CrossRef]
  10. Lebbihiat, N.; Atia, A.; Arıcı, M.; Meneceur, N. Geothermal energy use in Algeria: A review on the current status compared to the worldwide, utilization opportunities and countermeasures. J. Clean. Prod. 2021, 302, 126950. [Google Scholar] [CrossRef]
  11. Yu, C.; Zhang, C.; Yang, Y.; Song, R. Cascade utilization of geothermal resources in western Sichuan Province. Nat. Gas Explor. Dev. 2021, 44, 15. [Google Scholar]
  12. Kamila, Z.; Kaya, E.; Zarrouk, S.J. Reinjection in geothermal fields: An updated worldwide review 2020. Geothermics 2021, 89, 101970. [Google Scholar] [CrossRef]
  13. Bodvarsson, G.S.; Stefansson, V. Some theoretical and field aspects of reinjection in geothermal reservoirs. Water Resour. Res. 2010, 25, 1235–1248. [Google Scholar] [CrossRef]
  14. Stefansson, V.-đ. Geothermal reinjection experience. Geothermics 1997, 26, 99–139. [Google Scholar] [CrossRef]
  15. Zhang, L.; Chao, J.; Geng, S.; Zhao, Z.; Chen, H.; Luo, Y.; Qin, G. Particle migration and blockage in geothermal reservoirs during water reinjection: Laboratory experiment and reaction kinetic model. Energy 2020, 206, 118234. [Google Scholar] [CrossRef]
  16. Wang, X.; Wang, J.; Yan, G.; Liu, X.; Huang, Y.; Tian, S.; Xu, Q. Study on prevention and control measures of sandstone geothermal reinjection plugging. Water Sci. Technol. 2023, 87, 1571–1581. [Google Scholar] [CrossRef]
  17. Xia, J.; Tian, H.; Dou, B.; Xiao, P.; Zheng, J.; Lai, X. Experimental Review: Particle clogging in porous sandstone geothermal reservoirs during tail water reinjection. J. Hydrol. 2023, 625, 130066. [Google Scholar] [CrossRef]
  18. Li, C.; Guan, Y.; Yang, R.; Lu, X.; Xiong, W.; Long, A. Effect of inner pipe type on the heat transfer performance of deep-buried coaxial double-pipe heat exchangers. Renew. Energy 2020, 145, 1049–1060. [Google Scholar] [CrossRef]
  19. Li, C.; Jiang, C.; Guan, Y.; Tan, Z.; Zhao, Z.; Zhou, Y. Development and applicability of heat transfer analytical model for coaxial-type deep-buried pipes. Energy 2022, 255, 124533. [Google Scholar] [CrossRef]
  20. Li, H.; Yang, Y.; Song, R.; Wang, Y.; Sun, H.; Zheng, L. Adaptability of single-well downhole heat exchanger in developing mid-deep geothermal resources. Nat. Gas Explor. Dev. 2021, 44, 17. [Google Scholar]
  21. Spitler, J.D.; Gehlin, S.E.A. Thermal response testing for ground source heat pump systems—An historical review. Renew. Sustain. Energy Rev. 2015, 50, 1125–1137. [Google Scholar] [CrossRef]
  22. Horne, R.N. Design considerations of a down-hole coaxial geothermal heat exchanger. Trans.-Geotherm. Resour. Counc. 1980, 4, CONF-800920-. [Google Scholar]
  23. Morita, K.; Sugimoto, S.; Yamada, Y.; Fujita, T.; Mukai, R.-I. Preliminary Considerations for Power Generation Using a Downhole Coaxial Heat Exchanger System (I). J. Geotherm. Res. Soc. Jpn. 1989, 11, 319–338. [Google Scholar] [CrossRef]
  24. Morita, K.; Mizogami, F.; Bollmeier, W.S. Analysis of the Results from the Proof of Concept Experiment in Hawaii Studies on the Downhole Coaxial Heat Exchanger. J. Geotherm. Res. Soc. Jpn. 1993, 15, 275–303. [Google Scholar] [CrossRef]
  25. Zanchini, E.; Lazzari, S.; Priarone, A. Improving the thermal performance of coaxial borehole heat exchangers. Energy 2010, 35, 657–666. [Google Scholar] [CrossRef]
  26. Zhang, Y.; Yu, C.; Li, G.; Guo, X.; Wang, G.; Shi, Y.; Peng, C.; Tan, Y. Performance analysis of a downhole coaxial heat exchanger geothermal system with various working fluids. Appl. Therm. Eng. 2019, 163, 114317. [Google Scholar] [CrossRef]
  27. Song, X.; Zheng, R.; Li, G.; Shi, Y.; Wang, G.; Li, J. Heat extraction performance of a downhole coaxial heat exchanger geothermal system by considering fluid flow in the reservoir. Geothermics 2018, 76, 190–200. [Google Scholar] [CrossRef]
  28. Liu, S.; Dahi Taleghani, A. Closed-loop geothermal systems: Critical review of technologies, performance enhancement, and emerging solutions. Renew. Sustain. Energy Rev. 2025, 225, 116177. [Google Scholar] [CrossRef]
  29. Huang, Y.; Zhang, Y.; Xie, Y.; Zhang, Y.; Gao, X. Thermal performance analysis on the composition attributes of deep coaxial borehole heat exchanger for building heating. Energy Build. 2020, 221, 110019. [Google Scholar] [CrossRef]
  30. Wang, Z.; Wang, F.; Liu, J.; Ma, Z.; Han, E.; Song, M. Field test and numerical investigation on the heat transfer characteristics and optimal design of the heat exchangers of a deep borehole ground source heat pump system. Energy Convers. Manag. 2017, 153, 603–615. [Google Scholar] [CrossRef]
  31. Xu, W.; Li, J.; Zhang, G.; Sun, Z.; Li, J. Research status and future development of the medium-deep geothermal heat pump heating system—A comprehensive review. Renew. Sustain. Energy Rev. 2025, 225, 116141. [Google Scholar] [CrossRef]
  32. Gu, F.; Li, Y.; Zhang, Y.; Gao, Y.; Yang, P.; Wang, A.; Cui, J. Convection-heat transfer coupling mechanism for closed-loop heat extraction from hydrothermal resources using horizontal wells. Coal Geol. Explor. 2024, 52, 121–130. [Google Scholar] [CrossRef]
  33. Wang, G.; Song, X.; Song, G.; Shi, Y.; Yu, C.; Xu, F.; Ji, J.; Song, Z. Analyzes of thermal characteristics of a hydrothermal coaxial closed-loop geothermal system in a horizontal well. Int. J. Heat Mass Transf. 2021, 180, 121755. [Google Scholar] [CrossRef]
  34. Hou, X.; Zhong, X.; Nie, S.; Wang, Y.; Tu, G.; Ma, Y.; Liu, K.; Chen, C. Study on the heat recovery behavior of horizontal well systems in the Qiabuqia geothermal area of the Gonghe Basin, China. Energy 2024, 286, 129424. [Google Scholar] [CrossRef]
  35. Liao, J.; Xie, Y.; Zhao, P.; Xia, K.; Xu, B.; Wang, H.; Li, C.; Li, C.; Liu, H. Probabilistic assessment of the thermal performance of low-enthalpy geothermal system under impact of spatially correlated heterogeneity by using XGBoost algorithms. Energy 2024, 313, 133947. [Google Scholar] [CrossRef]
  36. Liu, H.; Sun, W.; Zheng, J.; Dou, B. Adaptive Kriging-Based Heat Production Performance Optimization for a Two-Horizontal-Well Geothermal System. Appl. Sci. 2024, 14, 6415. [Google Scholar] [CrossRef]
  37. Pruess, K.; Oldenburg, C.M.; Moridis, G.J. TOUGH2 User’s Guide Version 2. 1999. Available online: https://scispace.com/pdf/tough2-user-s-guide-version-2-2qtqe8so9y.pdf (accessed on 3 June 2024).
  38. Moridis, G.; Pruess, K. Flow and Transport Simulations Using T2CG1, A Package of Conjugate Gradient Solvers for the TOUGH2 Family of Codes. 1995. Available online: https://scispace.com/pdf/flow-and-transport-simulations-using-t2cg1-a-package-of-3t38261q9r.pdf (accessed on 10 March 2024).
  39. Xu, T.; Hu, Z.; Feng, B.; Feng, G.; Li, F.; Jiang, Z. Numerical evaluation of building heating potential from a co-axial closed-loop geothermal system using wellbore–reservoir coupling numerical model. Energy Explor. Exploit. 2019, 38, 733–754. [Google Scholar] [CrossRef]
  40. Nie, S.; Li, J.; Liu, K.; Zhong, X.; Wang, Y. Numerical Evaluation of Commingled Production Potential of Marine Multilayered Gas Hydrate Reservoirs Using Fractured Horizontal Wells and Thermal Fluid Injection. J. Mar. Sci. Eng. 2024, 12, 365. [Google Scholar] [CrossRef]
  41. Song, X.; Zhang, Y.; Li, G.; Li, R.; Yu, C.; Li, J.; Guo, X. Performance Study of the Downhole Coaxial Closed-Loop Heat Exchange Technology in Xiong’an New Area. J. Tianjin Univ. Sci. Technol. 2021, 54, 972–980. [Google Scholar]
  42. Chen, T.; He, T.; Benesty, M.; Khotilovich, V.; Tang, Y.; Cho, H.; Chen, K.; Mitchell, R.; Cano, I.; Zhou, T.; et al. Extreme Gradient Boosting. 2014. Available online: https://github.com/dmlc/xgboost (accessed on 13 July 2025).
  43. Saadallah, A. SHAP-Guided Regularization in Machine Learning Models. In Proceedings of the 3rd World Conference on eXplainable Artificial Intelligence, Istanbul, Turkey, 11 July 2025. [Google Scholar]
  44. Gu, M.; Kang, S.; Xu, Z.; Lin, L.; Zhang, Z. AE-XGBoost: A Novel Approach for Machine Tool Machining Size Prediction Combining XGBoost, AE and SHAP. Mathematics 2025, 13, 835. [Google Scholar] [CrossRef]
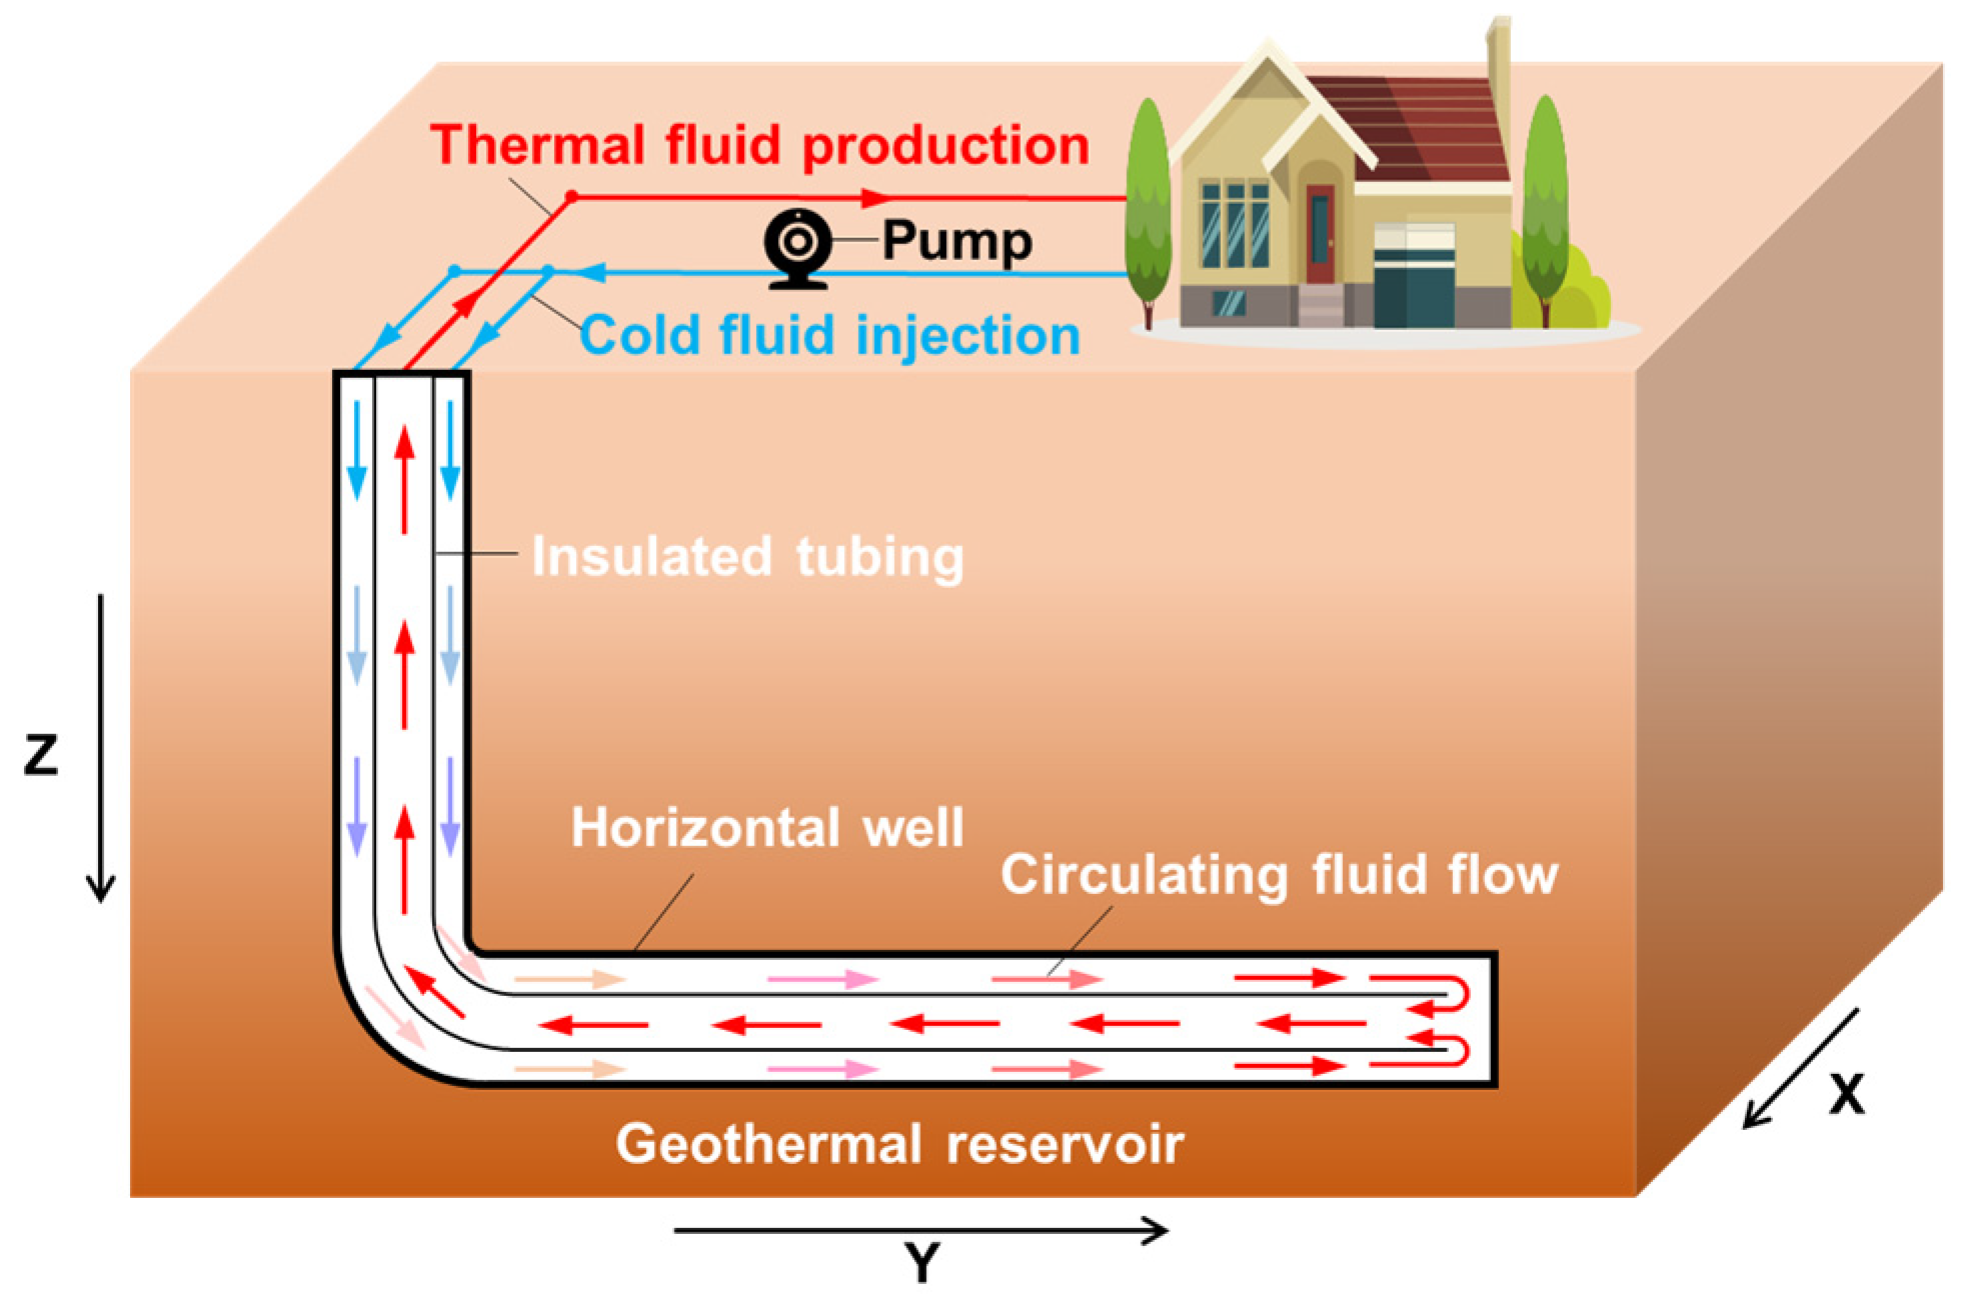
Figure 1. Horizontal well closed-loop geothermal system in hydrothermal reservoirs.
Processes 13 03237 g001
Figure 2. Initial reservoir pressure field and temperature field on the X = 50 m slice plane: (a) reservoir pressure PR; (b) reservoir temperature TR.
Processes 13 03237 g002
Figure 3. (a) Grid count independence test; (b) Accuracy assessment of simulation results.
Processes 13 03237 g003
Figure 4. Evolution of the temperature field of the vertical well system: (a) on the X = 50 m slice plane at 120 days; (b) on the Z = 1500 m slice plane at 30, 60, 90, and 120 days.
Processes 13 03237 g004
Figure 5. Evolution of the temperature field of the horizontal well system: (a) on the X = 50 m slice plane at 120 days; (b) on the Y = 1550 m slice plane at 30, 60, 90, and 120 days.
Processes 13 03237 g005
Figure 6. The Tp and Qp for various Lh values: (a) the variation of Tp and Qp with time; (b) the variation in ultimate Tp and Qp with Lh.
Processes 13 03237 g006
Figure 7. The Tp and Qp for various Mi values: (a) the variation of Tp and Qp with time; (b) the variation in ultimate Tp and Qp with Mi.
Processes 13 03237 g007
Figure 8. The Tp and Qp for various Ti values: (a) the variation of Tp and Qp with time; (b) the variation in ultimate Tp and Qp with Ti.
Processes 13 03237 g008
Figure 9. The Tp and Qp for various TG values: (a) the variation of Tp and Qp with time; (b) the variation in ultimate Tp and Qp with TG.
Processes 13 03237 g009
Figure 10. The Tp and Qp for various λR values: (a) the variation of Tp and Qp with time; (b) the variation in ultimate Tp and Qp with λR.
Processes 13 03237 g010
Figure 11. Prediction error of the trained XGBoost models. (a) model for Tp; (b) model for Qp.
Processes 13 03237 g011
Figure 12. The SHAP value of each influencing factor on the ultimate Tp.
Processes 13 03237 g012
Figure 13. The SHAP value of each influencing factor on the ultimate Qp.
Processes 13 03237 g013
Figure 14. Interaction effects among the parameters: (a) interaction visualization summary chart for ultimate Tp; (b) interaction visualization summary chart for ultimate Qp; (c) SHAP interaction matrix heatmap for ultimate Tp; (d) SHAP interaction matrix heatmap for ultimate Qp.
Processes 13 03237 g014
Figure 15. The relationship between ultimate Tp with Mi and Lh.
Processes 13 03237 g015
Table 1. Model parameters.
ParametersValue and Unit
Formation density2650 kg/m3
Density of water 1000 kg/m3
Wellbore diameter0.2 m
Porosity of the reservoir0.20
Reservoir permeability100 mD
Rock heat conductivity2.8 W/(m·°C)
Specific heat capacity of formation920 J/(kg·°C)
Specific heat capacity of water4200 J/(kg·°C)
Geothermal gradient0.027 °C/m
Surface temperature 9 °C
Hydrostatic pressure gradient0.0098 MPa/m
Table 2. Simulation scheme.
Scenario No.Lh, mMi, kg/sTi, °CTG, °C/100 mλR, W/(m·°C)Simulation Objective
1#0; 100; 300; 500; 800; 1000; 1500; 2000; 2500; 3000592.72.8Impact of Lh
(Section 3.1)
2#0; 1000; 1500; 2000; 3000 1; 2; 3; 4; 5; 1092.72.8Impact of Mi (Section 3.2)
3#0; 1000; 1500; 2000; 300055; 7; 9; 11; 13; 152.72.8Impact of Ti (Section 3.3)
4#0; 1000; 1500; 2000; 3000592.1; 2.4; 2.7; 3.0; 3.3; 3.62.8Impact of TG (Section 3.4)
5#0; 1000; 1500; 2000; 3000592.71.6; 2.2; 2.8; 3.4; 4.0; 4.6Impact of λR
(Section 3.5)
Disclaimer/Publisher’s Note: The statements, opinions and data contained in all publications are solely those of the individual author(s) and contributor(s) and not of MDPI and/or the editor(s). MDPI and/or the editor(s) disclaim responsibility for any injury to people or property resulting from any ideas, methods, instructions or products referred to in the content.