1. Introduction
Lignocellulosic biomass is considered one of the most important renewable energy sources [
1]. Its energy value can be enhanced through thermochemical treatments such as pyrolysis, gasification, and thermal liquefaction. In particular, the pyrolysis of organic residues requires specific operating conditions, including high temperatures and non-oxidative atmosphere. Typically, the energy supply is derived from the combustion of raw material itself, in electric solar furnaces, microwaves, and to a lesser extent, from renewable sources.
Pyrolysis offers advantages over other treatments due to its processing times and commercial appeal, despite current technological challenges [
2]. This reaction yields three fractions which are solid, liquid, and gaseous, all of which are of interest for diverse applications. The solid fraction, biochar, is used for soil remediation and improvement, carbon sequestration, additive in organic solid waste composing, and for water and wastewater decontamination, among others [
3]. The liquid fraction, or bio-oil, originates from the condensable vapors during pyrolysis at environmental temperature. Bio-oil has emerged as a promising alternative to crude oil, with several advantages such as CO
2/GHG-neutral emissions, absence of SOx, and the possibility of renewable local production, in contrast to conventional fuels [
4]. The gaseous fraction, or syngas, holds high energetic potential and may address issues related to energy storage and transport [
5,
6].
A considerable number of studies on the pyrolysis of organic residues have been reported, addressing different aspects such as reaction kinetics, feedstock type, residence time, operating temperature, and reactor configurations. This study conducts a systematic comparison of the literature on auger reactors with different energy sources, with particular emphasis on solar-powered systems. The analysis reported in
Table 1 considers energy sources, feedstock type, operating temperatures, system scale, and product yields. In addition, the previously published studies about auger reactors and solar-powered systems are analyzed as a part of this comparison.
Campuzano et al. [
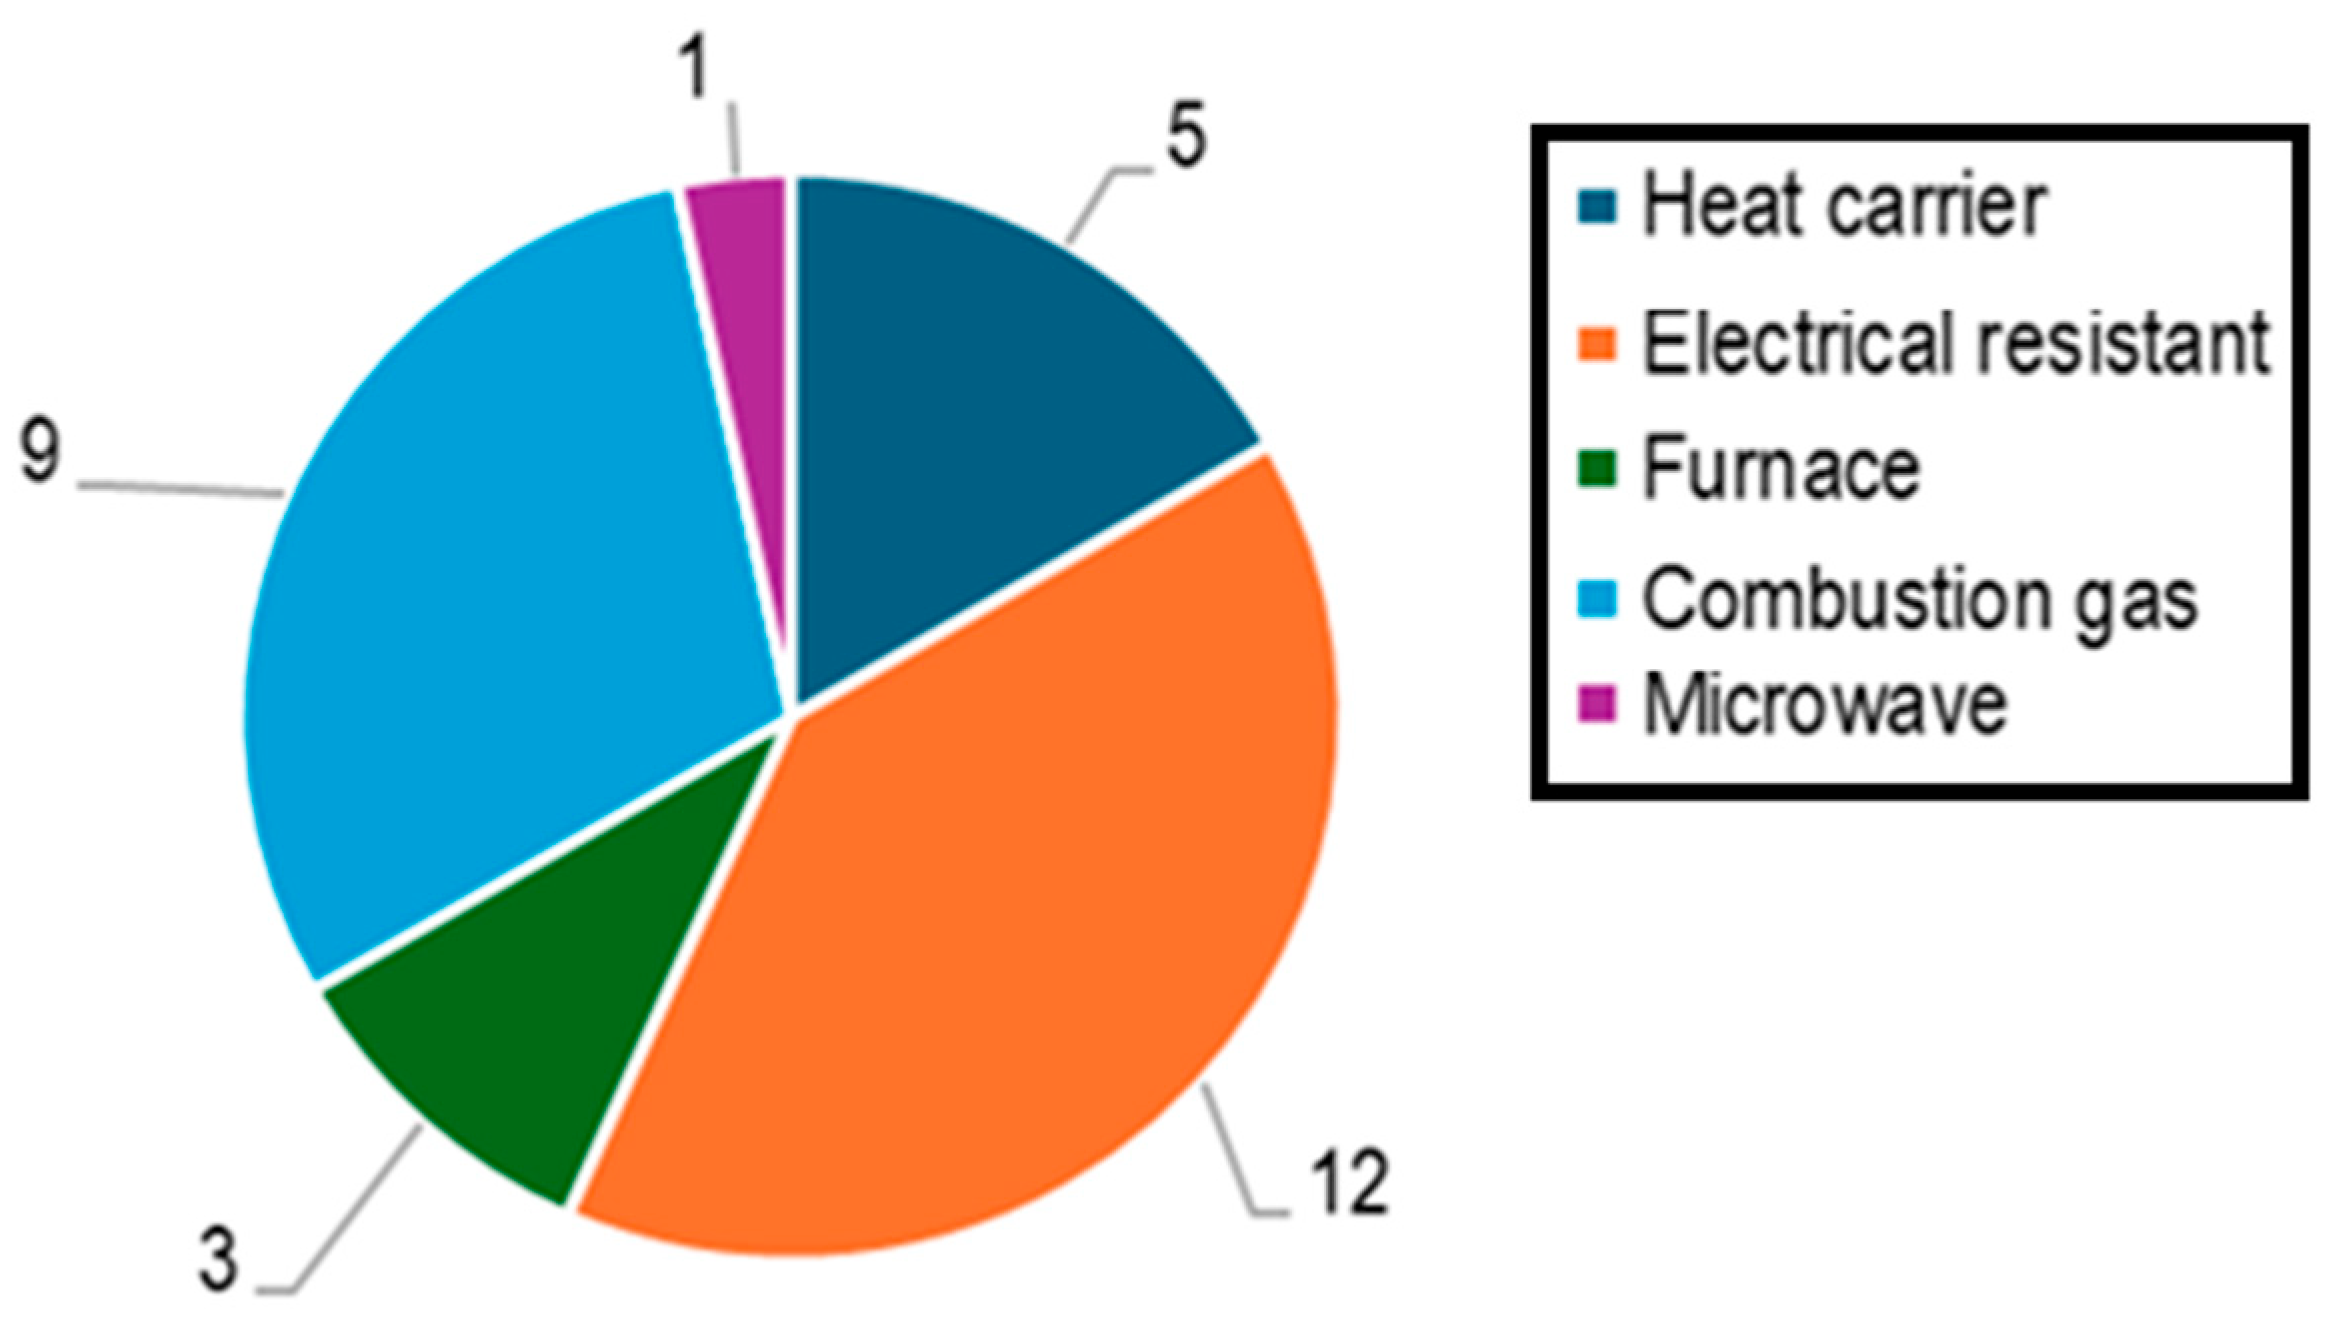
7] published a review article on auger reactors for the pyrolysis of organic residues, considering various factors such as reactor design, screw configuration, biomass type, and thermal energy supply. From this study, 30 auger reactors were reviewed, and the distribution by type of energy supply is presented in
Figure 1. The predominant energy source reported in this study was electric resistance heating.
Table 1.
Summary of the reported literature on auger reactors for pyrolysis.
Table 1.
Summary of the reported literature on auger reactors for pyrolysis.
| Ref. | Scale | Energy Source | Feedstock | Temperature (°C) | Product Yield (%) |
|---|
| Biochar | Tar | Gas |
|---|
| [1] | Laboratory | Electricity | Saw dust | 350–550 | 19 | 57 | 24 |
| [8] | Laboratory | Heat solid carriers | Sawdust and bagasse | 500 | - | - | - |
| [9] | Laboratory | Microwaves | Red wood waste and textile dyeing sludge | 450–750 | 65–50 | 20–18 | 15–40 |
| [10] | Laboratory | Microwaves | Wood waste | 550 | - | - | - |
| [11] | Industrial | Flue gas | Elephant grass | 400–600 | 35–26 | 27–30 | 35–45 |
| [12] | Laboratory | Flue gas | Palm oil waste | 450–750 | - | - | - |
| [13] | Laboratory | Electricity | Flax shive | 500–700 | 86–46 | 3–2 | 10–31 |
| [14] | Pilot | Electricity | Cogon grass | 400–500 | 32–24 | 27–21 | - |
| [15] | Laboratory | Electricity | Mustard | 500 | 33 | 51 | 16 |
| [16] | Industrial | Electricity | Cane bagasse | 450–550 | 13–15 | 40–70 | 46–14 |
| [17] | Laboratory | Electricity | Wood | 300–900 | 54–19 | 34–11 | 10–70 |
| [18] | Industrial | Electricity | Pine nut shell | 300–700 | 52–27 | 31–39 | 16–41 |
| [19] | Laboratory | Electricity | Pine sawdust | 400–600 | 38–22 | 20–21 | 28–37 |
| [20] | Laboratory | Electricity | Pine sawdust | 700–900 | 30–20 | 20–10 | 50–74 |
| [21] | Laboratory | Electricity | Coffee grounds | 350–550 | 27–18 | 21–14 | 27–45 |
| [22] | Laboratory | Electricity | Sugarcane bagasse | 400–600 | 27–17 | 30–22 | - |
| [23] | TLR-5 | Electricity | Rice husk | 850 | 35 | 8 | 39 |
The authors conducted a literature review of studies reported after 2019, summarized in
Table 1. The analysis focused on the type of energy supply, identifying electricity as the most common, followed by flue gas and microwaves. Most reactors were operated at laboratory scale, with few industrial scales reported. Operating temperatures typically ranged between 400 and 550 °C, with some exceptions at significantly higher values [
23].
Some authors describe pyrolysis as a sustainable process, since its own products can compensate for the energy demand of the plant [
24]. However, only a limited number of studies address the use of renewable energy to satisfy its energy demand, compared to the extensive research available on pyrolysis. Maytorena et al. [
25] reviewed the state of the art in solar-driven pyrolysis, where energy demand was supplied by concentrated technologies. Their review highlighted advances and challenges of this synergy. This report also includes studies employing solar simulators as the energy source. The distribution by type of concentrated technology is as follows: 39% parabolic dish, 30% solar simulator, 17% solar furnace, 9% Fresnel lens, and 4% parabolic through. Reported solar reactor types included fixed bed (61%), batch (33%), and tubular reactor (6%), all at laboratory scale. Despite successful industrial cases such as Synhelion [
26], major technological challenges remain, particularly in scalability and industrial deployment.
Zeng et al. [
27] investigated beech wood pyrolysis in a fixed bed reactor heated by a solar furnace. The biomass, with high volatile content (~85 wt.%) and low moisture (~6 wt.%) was directly irradiated with concentrated solar energy in an argon rich atmosphere at 600–2000 °C. Product yields were reported as 15–8 wt.% biochar, 63–35 wt.% tar, and 20–62 wt.% gas, with heating rates of 10–450 °C min
−1, highlighting precise laboratory control.
Aspiazu et al. [
28] examined walnut shell pyrolysis (~80 wt.% volatiles, ~7 wt.% moisture) in a fixed bed reactor indirectly heated with a solar simulator under argon at 380–670 °C, obtaining product distributions of 41–28 wt.% biochar, 49–53 wt.% tar, and 9–18 wt.% gas.
This review compares reported auger reactors by energy source and highlights the absence of documented solar powered devices, underscoring the novelty of solarized auger reactors. To the best of the author’s knowledge, research on solar powered auger reactors remains scarce. To address this, the research team designed and tested an uncommon reactor solar driven auger system. This article reports its initial thermochemical performance using walnut tree pruning residues as feedstock for biochar production.
The Solarized Auger Reactor for Pyrolysis (SARP), developed at the Renewable Energy Institute in collaboration with Green Oil Energy Systems, was designed, constructed, and is currently being evaluated within the framework of the DGAPA-UNAM PAPIIT AG-101525 project. This project aims to establish a sustainable process under real and reproducible operating conditions, enabling the production of solar fuels and offering an alternative pathway for organic solid waste management. The integration of concentrated solar energy with biomass provides economic, social, and environmental benefits. Furthermore, the conversion of organic solid waste into solar fuels through concentrated solar energy can be considered a form of chemical storage of renewable energy.
2. Experimental Setup
2.1. Solarized Auger Reactor for Pyrolysis from IER-UNAM
The Solarized Auger Reactor for Pyrolysis from IER is an auger reactor designed for the pyrolysis of organic solid waste (
Figure 2).
The SARP is equipped with an internal screw conveyor driven by a chain mechanism coupled to an electrical motor. The screw transports the feedstock from the low temperature zone, located beneath the feedstock system, to the high temperature zone, situated near to a volumetric receiver and above the biochar depot. On the opposite side of the biochar depot, the condensation system is located, comprising a tar filter, a bio-oil outlet, two condensers, and a syngas collection line linked to an online gas chromatography. Inert gas inlets are provided at both the feed hopper and the biochar depot to maintain a non-oxidizing atmosphere.
Thermal energy is supplied indirectly through a concentric tube heat exchanger composed of three concentric cylinders. The first cylinder (reactor) houses the screw conveyor and is equipped with external fins to enhance heat transfer. The second cylinder (heat transfer chamber), concentric to the first, conducts high temperature air. The heat transfer fluid flows countercurrent respect to the feedstock motion. The third cylinder, concentric to the second, contains thermal insulation.
The heat transfer fluid is atmospheric air, which is heated as it flows through a volumetric receiver positioned in front of the reactor. The receiver absorbs concentrated solar radiation delivered by a solar furnace. After leaving the receiver volume, the heated air circulates through the heat transfer chamber, transferring thermal energy to the reactor.
The temperature control method inside the reactor is achieved by regulating the concentrated radiative flux from the solar furnace using a shutter.
2.2. Solar Furnace from IER-UNAM
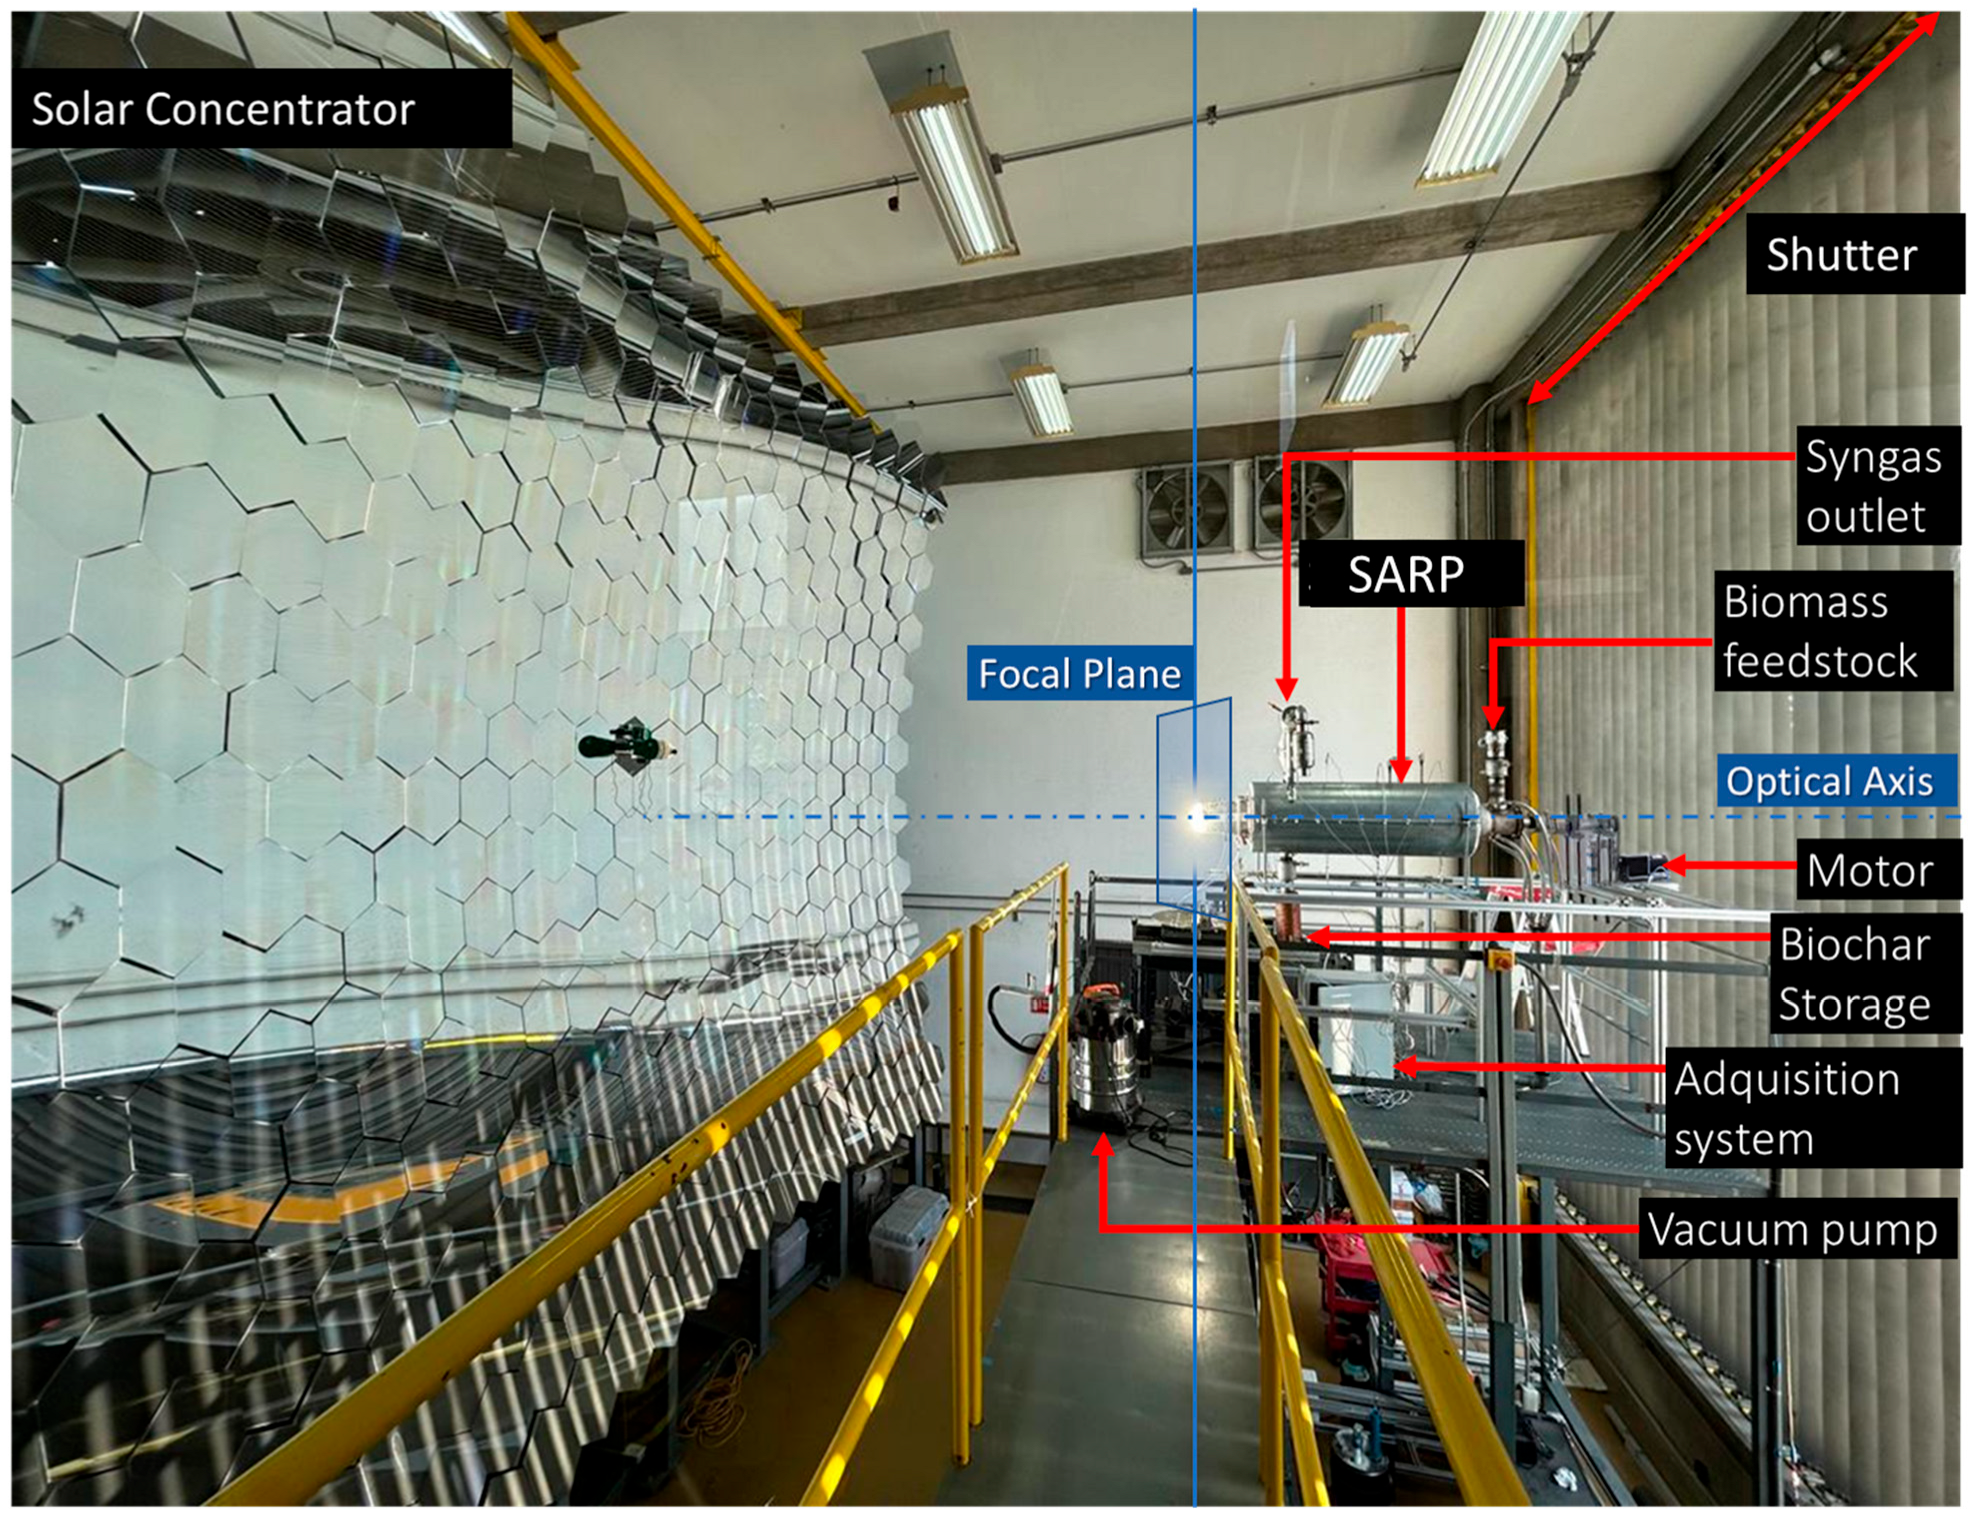
The SARP was tested at the Solar Furnace of the Institute of Renewable Energies (HoSIER). The facility includes an 81 m
2 heliostat that directs solar radiation to a concentrator of 409 hexagonal facets with spherical curvature, with a focal length of 3.85 m (
Figure 3).
The reactor was mounted on the experimental platform, with its front face placed and centered at the focal point and the housing aligned with the optical axis of the concentrator.
Radiative flux on the volumetric receiver was controlled by a vertical curtain attenuator (Shutter) located between the heliostat and the platform; this system allows stabilization of the reactor temperature according to the reaction requirements and climatic conditions, and it enables partial or total blocking of the incident radiative energy for conditioning tests or as a safety measure in the event of unforeseen circumstances or component failures.
Figure 4 presents a photograph of the SARP installation at HoSIER, allowing for visual identification of the main components previously described. The solar concentrator, with its large array of spherical mirrors, and the shutter (attenuator) are both clearly visible. The shutter is positioned to regulate the solar flux that is reflected from the heliostat (not in view) toward the reactor’s volumetric receptor.
On the other hand, the reactor system consists of the SARP reactor installed on the optical axis, the biomass feedstock inlet for introducing agroindustrial residues, the motor that drives the screw conveyor, and the biochar storage unit for collecting the solid product. The syngas outlet enables extraction of the gaseous products. The vacuum pump is used to force air through the volumetric receiver, thereby increasing the inlet temperature. The data acquisition system controls the movement and speed of the auger motor, while also monitoring and recording signals from temperature, pressure, and irradiance sensors throughout the experiments.
On a clear day, with the shutter fully open (100%), the concentrated solar radiation incident on a volumetric receiver located at the focal plane can raise its temperature to nearly 2000 °C. Reactor temperature can be controlled by two strategies: adjusting the attenuator aperture or varying the suction rate of the vacuum pump. However, to regulate the temperature at the center of the volumetric receiver while maintaining a fully open attenuator, it is necessary either to increase the distance between the receiver and the focal region by displacing the entire system along the optical axis, or to incorporate a secondary optical element that homogenizes the concentrated solar radiation delivered by the HoSIER.
4. Results
4.1. Solar Furnace Characterization
On a clear day (DNI = 1000 W/m
2), the solar radiation concentrated by the HoSIER at the focal zone reaches a peak flux intensity of 6800 suns (
Figure 7a), concentrated at the center of the receiver. Under this distribution, however, the central region of the SARP volumetric receiver reaches its melting temperature, causing the porous surface to degrade and obstruct the air channels required for heat transfer from the receiver to the reactor interior. This effect reduces the overall thermal efficiency of the system during operation under optimal solarimetric conditions, when the HoSIER attenuator is fully open.
To enable operation at maximum furnace power, the SARP receiver was repositioned 8 cm away from the focal plane, identified as the optimal distance for complete radiative flux entry into the reactor. At this position, the flux distribution (
Figure 7b) of the concentrated solar radiation is spread over a circular area in diameter of 18 cm, while the peak flux intensity decreases from 6800 to 1600 suns. This configuration allows reactor operation at the maximum capacity of the HoSIER with the attenuator fully open, while preserving the structural integrity of the volumetric receiver.
4.2. Physicochemical Characterization of Raw Material
Table 2 presents the results of proximate and ultimate analyses for the pruning of
Carya illinoinensis. The high percentage of volatiles in the sample predicts a high production of condensable vapors, while it is expected to obtain a low production of biochar. It was also found that the raw material has a low percentage of ash (below 3%). On the other hand, high percentages of C and O in elemental analysis predict that it is suitable to obtain a fuel with a high energy value.
In addition,
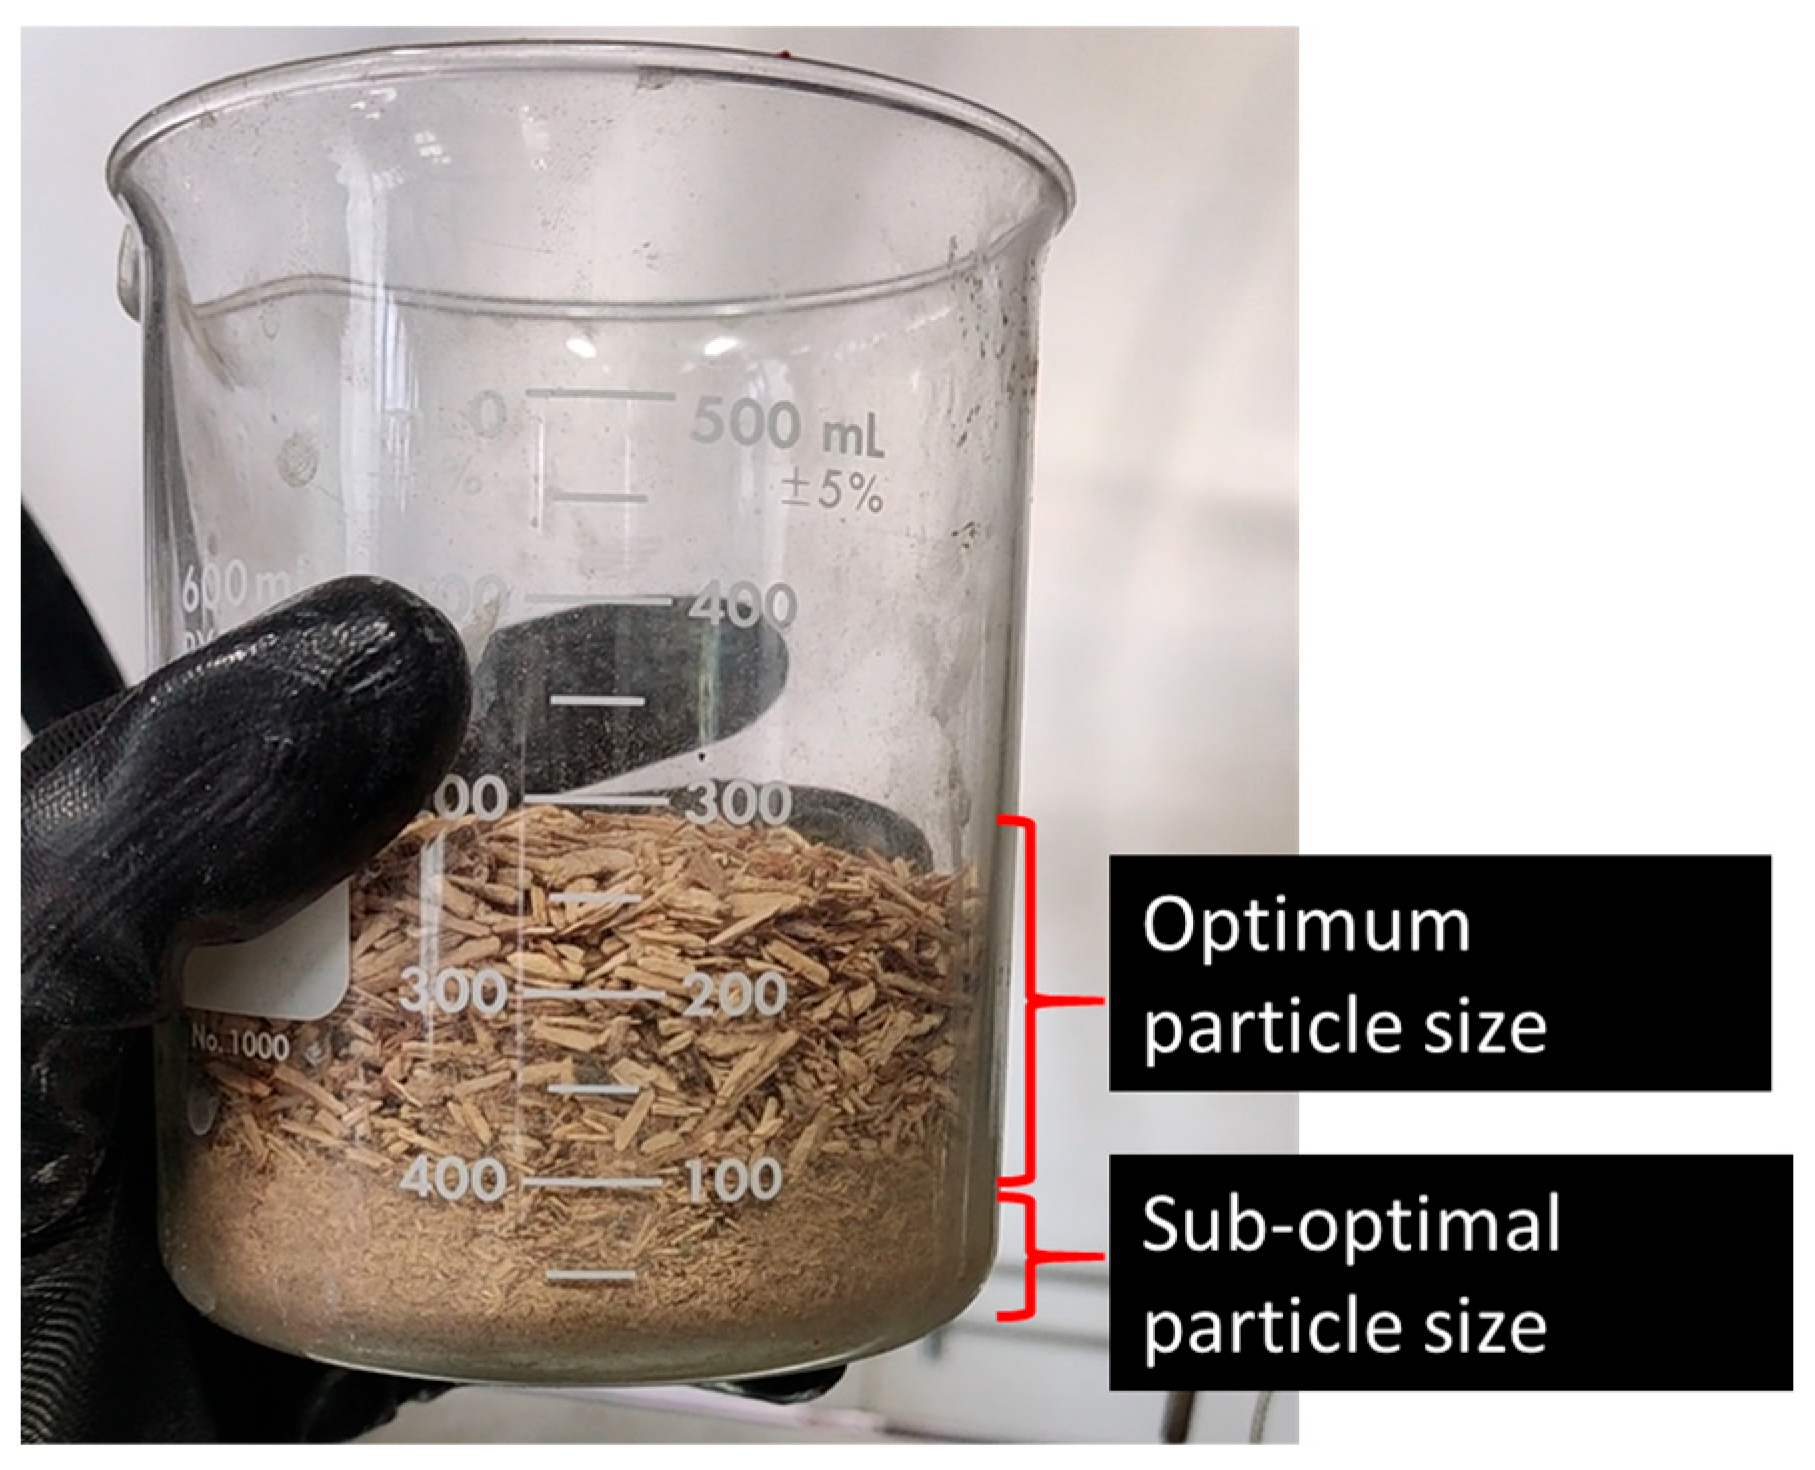
Table 3 shows the biomass characterization parameters of the raw material, as well as the particle size defined for this study.
Figure 8 shows the results of thermogravimetric analysis (TGA), performed with a heating ramp of 10 °C/min under controlled nitrogen atmosphere. The derivative thermogravimetric (DTG) curve distinguishes three main stages: sample drying, active pyrolysis and passive pyrolysis. Drying occurs in the temperature range of 50 to 150 °C and corresponds to the removal of moisture contained in the sample. Active pyrolysis is associated with the thermal degradation of hemicellulose and cellulose, showing a significant loss of mass in the DTG between 200 and 400 °C, with a maximum peak around 329 °C. Finally, passive pyrolysis is linked to the decomposition of lignin, characterized by a gradual loss of mass where DTG tends towards zero from 400 °C.
4.3. Thermal Analysis
Figure 9 shows the evolution of temperatures in SARP for stages II, III and IV of the experiment, as well as the behavior of Direct Normal Irradiance (DNI).
Stage II begins with the aperture of the solar furnace shutter During this period, it is observed that reactor temperatures increase rapidly. Trec increases from an ambient temperature of ~30 °C to 900 °C in 8 min. During experimentation, the shutter was kept fully open, stabilizing the air temperature at the volumetric receiver outlet at 947 °C for 130 min. Stage II is concluded when a threshold temperature (TintMax) of 600 °C is reached after 37 min, however it depends on irradiance conditions.
Stage III initiates the movement of the screw leading to the displacement of organic matter within the reactor. During experimentation the average temperature in the pyrolysis zone was TIntMax = 669 °C ± 21, while the temperature of the porous media (Trec) remained at 970 °C ± 30, in addition DNI had an average value of 848 W/m2 ± 49. The output of synthesis gas was observed at approximately t = 40 min.
TRec behavior is influenced by the adjustment of the heliostat tracking system during operation. The temperature values recorded at this point vary with respect to the peak positioning of the concentrated solar radiation received by the volumetric receiver. However, because adjustments are made at short intervals, there is no significant change in the temperatures inside the reactor.
The heating method of this reactor is one of the most distinctive characteristics. In this system, the flow of thermal energy arrives from one of the longitudinal ends of the reactor, i.e., from one of the bases of the cylinder. In contrast, in previously reported Auger reactors where heating comes from the longitudinal center or at a point very close to it. For this reason, the determination of the temperature distribution throughout the reactor is considered important for the performance of the pyrolysis reaction.
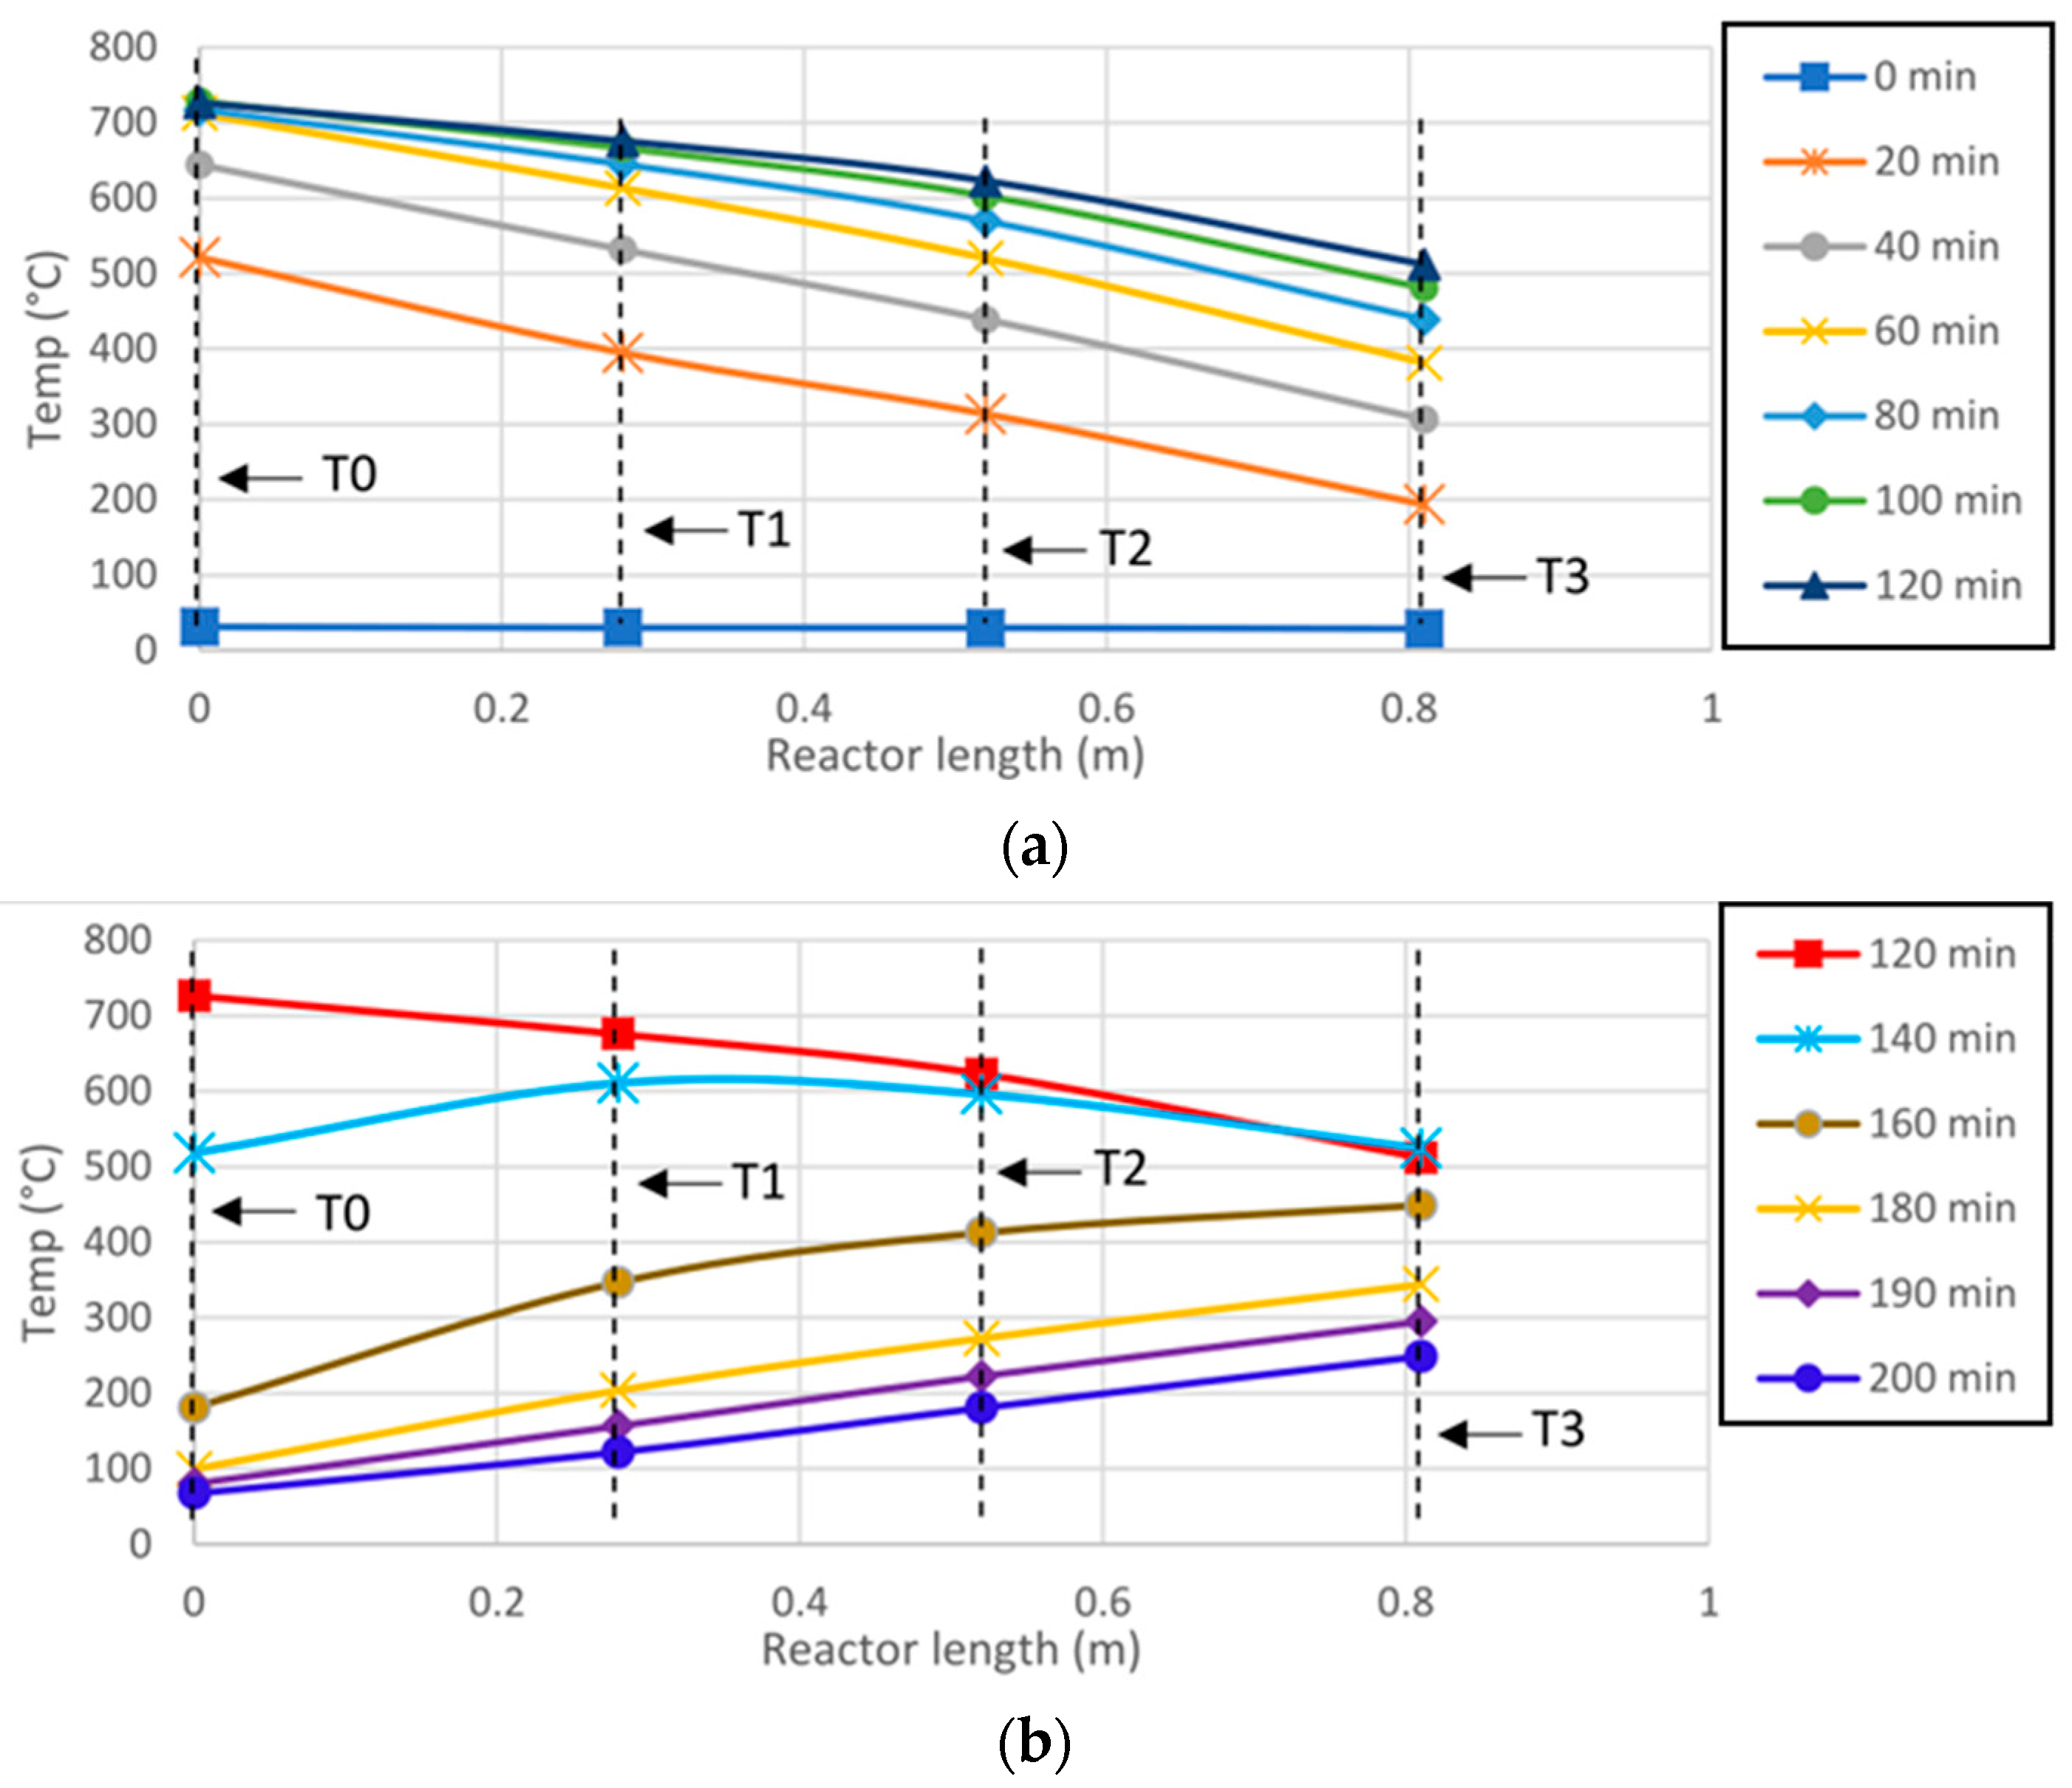
Figure 10 shows the behavior of reactor surface temperatures (T
0, T
1, T
2 and T
3) as a function of reactor length for time intervals of 20 min.
Figure 10a exhibits the temperature curves for stages II and III, corresponding to the heating phase. On the other hand,
Figure 10b shows the temperatures of stage IV, which correspond to the cooling of the SARP.
The initial reactor temperature is 29.9 °C (blue line), and after 20 min of starting heating (orange line), the thermocouple T
0, reaches a temperature of 500 °C, while the thermocouple T
3 shows 200 °C, just 0.8m from the front of the SARP obtaining a temperature gradient of 300 °C between the frontal and rear part of the reactor. As the reactor heats up and after 120 min of heating, this temperature difference decreases to 200 °C (
Figure 10a).
The gray line represents the temperatures recorded at the onset of the pyrolysis process. At this stage, the value of T0 is similar to that of TIntMax, with a percentage difference of 5.1%. On the other hand, the percentage difference between T3 and TIntMin is 81%. Although the 306 °C recorded at T3 is sufficient to initiate pyrolysis, this temperature is only reached at TIntMin after 150 min, corresponding to Stage IV.
From 60 min onward, the temperatures at T0 and T1 approach steady state, remaining within the operating limits of the reactor materials (<750 °C). In contrast, T2 reaches steady state only after 100 min, while T3 requires more than 140 min under the same irradiance conditions.
Figure 10b presents the cooling behavior of the SARP during Stage IV. The receiver shows a sharp temperature decrease at T
0, with a 33.3% drop between 120 and 140 min, but the largest temperature decrease (96.6%) appears between 140 and 160 min. Due to their greater distance from the receiver, T
1 and T
2 exhibit reductions of 55.1% and 36.3% in the same interval, respectively.
After 160 min, the thermal behavior of the SARP’s frontal zone is reversed, with T0 becoming the coldest point in the reactor. This inversion occurs because the volumetric receiver no longer absorbs concentrated solar radiation, while the reactor body remains hot; consequently, the temperatures at T1, T2, and T3 exceed that of T0.
4.4. Hydrogen Production
During the first experimental campaign, hydrogen production was monitored as an indicator of the pyrolysis process.
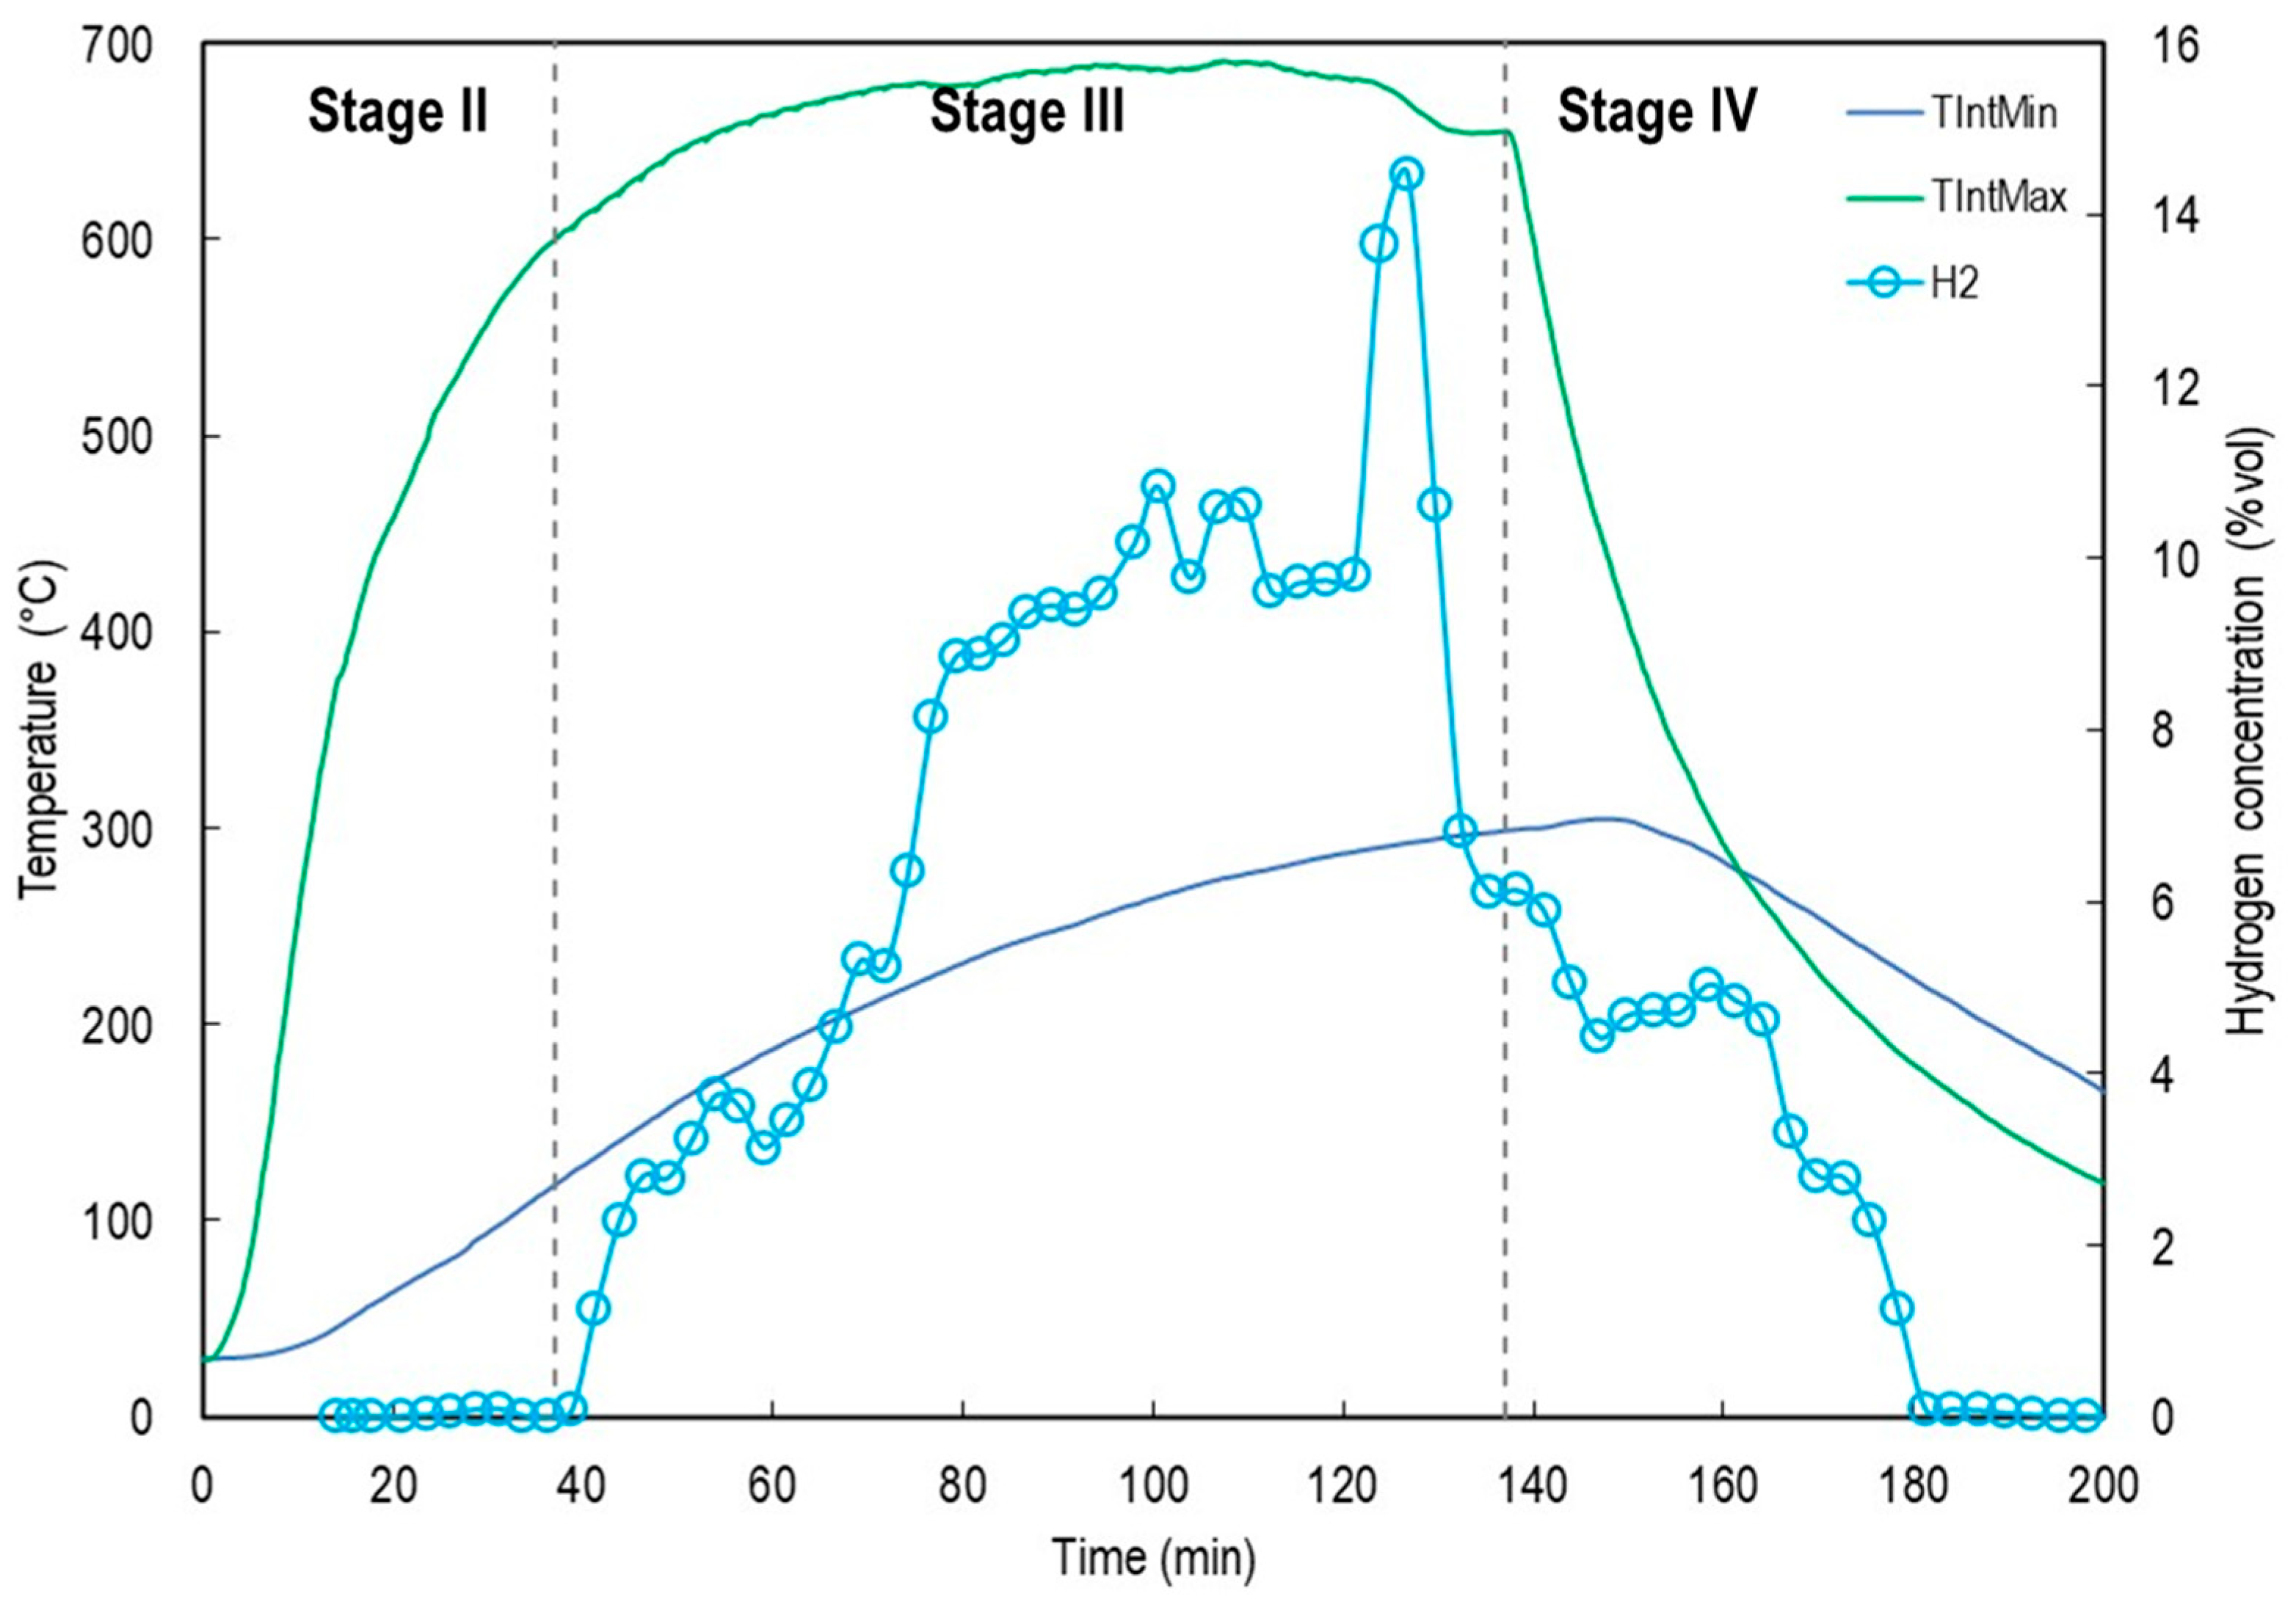
Figure 11 shows the H
2 concentration (% vol) measured by gas chromatography and its relationship with the internal reactor temperatures, T
IntMin and T
IntMax.
As illustrated in
Figure 11, hydrogen production exhibited a strong correlation with reactor temperature, particularly with the average value of T
IntMax. Following the activation of the feeding screw, the H
2 concentration increased sharply, reaching peak values between 2.5 and 3.0% vol. during the thermal steady-state phase. These results confirm that the pyrolytic decomposition of walnut tree pruning under solar heating produces both condensable and non-condensable volatiles, while also promoting hydrogen formation, likely through secondary cracking and reforming reactions.
As shown in the graph, hydrogen production began with the opening of the attenuator (Stage III) and continued for 148 min, reaching a peak concentration of 14.5% vol 88 min after the onset of pyrolysis. Hydrogen generation continued even after the attenuator was closed, during the cooling phase (Stage IV), for an additional 43 min. During this period, the maximum and minimum average reactor temperatures were TIntMax = 345 °C and TIntMin = 278 °C, respectively. Moreover, the highest temperature recorded at the coldest point inside the reactor during Stage IV was 305 °C, measured 11 min after attenuator closure. This temperature was sufficient to sustain pyrolysis reactions within the bed formed beneath the feeding screw, composed of fine particles (<4 mm) that were not transported forward.
4.5. Biochar
Under the analyzed experimental conditions, a biochar yield of 65.08% (wet/ash basis) was obtained for a residence time of ~100 min. Although a high yield of biochar is favored by shorter residence times, the non-uniform temperature distribution within the reactor influences this yield. T
IntMax measures the highest temperature of raw material; however, organic matter moves through lower temperature zones as recorded by T
IntMin, obtaining an incomplete biomass transformation. These results are comparable with the yields obtained by Kakku et al. [
34], who reported a 53% conversion to biochar for a temperature of 400 °C in a screw reactor with a similar raw material according to the reported proximate and ultimate analyses. Furthermore, Syafiqah et al. [
35] reported the pyrolysis of a biomass with physicochemical properties similar to those in this study in a fixed-bed reactor using Fresnel lens technology, achieving a biochar yield of 32% (dry, ash-free basis) at 435 °C.
The XRD analysis of the biochar indicated the following crystalline phases: C in graphite form, CaSO4, CaCO3, CaC2O4·H2O and CaMnF5. On the other hand, the identification of CaSO4 and CaCO3 indicates mineral impurities commonly found in agro-industrial wastes and formed by reacting with SO2 and CO2, respectively. Additionally, CaC2O4·H2O is a compound frequently found in walnut shells (which is the fruit of the Carya illinoinensis tree) and can be detected after thermal processes if not fully decomposed. Finally, CaMnF5 indicates possible interactions of raw material with some reactor components.
The results of the SEM analysis of biochar are shown in
Figure 12. The morphology of
Carya illinoinensis surface before pyrolysis is observed in
Figure 12a. The thermal decomposition accelerates the structural composition of
Carya illinoinensis obtaining an amorphous structure with pores and cracks (
Figure 12b). On the other hand, in
Figure 12c prismatic structures corresponding to mineral crystalline phases are observed on the surface.
5. Discussion
The results obtained from the solar-driven pyrolysis experiments demonstrate the technical feasibility of operating a solarized auger reactor under real operating conditions for the conversion of agricultural biomass into hydrogen-rich syngas. The thermal and chemical response of the system reveals critical insights into reactor performance, dynamic process, and solar integration.
5.1. Thermal Behavior and Reactor Stability
Figure 9 illustrates the ability of the reactor to reach and maintain the high temperatures required for effective pyrolysis. Under stable solar irradiance input, the temperature at the volumetric receiver exceeded 1000 °C, while the internal pyrolysis zone (T
IntMax) stabilized around 620–650 °C. This range is consistent with literature-reported optimal temperatures for fast pyrolysis and gas-phase cracking of volatiles. However, a significant axial temperature gradient was observed, with T
IntMin remaining around 300 °C, suggesting non-uniform heat distribution along the reactor length. This gradient is characteristic of solar-irradiated systems with unidirectional energy input.
The behavior of TRec was found to be influenced by several factors, mainly by fluctuations in direct normal irradiance and adjustments in the heliostat tracking system. The latter produces variations in temperature due to the changes in the position of the solar flux peak received by the volumetric receiver. However, since such adjustments were performed at short intervals, no significant effects were observed on the internal reactor temperatures. This highlights the thermal stability of the SARP under variable solar conditions.
5.2. Longitudinal Temperature Distribution Profile
The longitudinal temperature distribution profile on the reactor surface proved to be a key factor for pyrolysis performance. A minimum temperature of 300 °C was identified as necessary to promote thermal degradation of biomass components. Although only surface temperatures were recorded, they provide a valuable approximation of the internal reaction environment, serving as a reference for future studies on longitudinally heated reactors. Interestingly, the expected exponential distribution was not observed. Instead, both heating and cooling curves exhibited nearly linear trends (
Figure 11), which has important implications for modeling heat transfer phenomena during solar pyrolysis. These results suggest that reactor design and thermal inertia contribute to a more homogeneous temperature distribution than initially assumed.
Another limitation identified was the impossibility of directly measuring the actual reaction temperature. Only approximations from TIntMax readings were available. Nevertheless, the thermal behavior observed offers a basis for future correlations between surface and internal temperatures, which could support improved reactor monitoring and operational protocols.
5.3. Biochar Production
As noted in
Section 4.5, the high biochar yield results from incomplete pyrolysis, strongly influenced by the non-uniform temperature distribution and the internal Archimedes screw.
Figure 9 and
Figure 10 show that the internal thermocouples record markedly different temperatures: T
IntMin, near the feeding zone, averages 232.6 °C, while T
IntMax, near the focal zone, averages 669 °C, yielding a gradient of 436.4 °C across the reactor. Although the slow screw movement favors gradual heating, heat transfer limitations constrain temperature rise.
To improve mixing and extend residence time, paddles were integrated between the flights of the auger shaft in the first half of the screw (
Figure 5b). These paddles redirect part of the biomass backward, delaying its advance and avoiding immediate exposure to higher-temperature regions. Consequently, partially pyrolyzed material mixes with unreacted feedstock, leading to non-uniform conversion and higher biochar yield compared with more controlled pyrolysis systems.
Due to equipment limitations, conversion rates could not be quantified. Future work will address pyrolysis conversion and the role of temperature distribution in product selectivity.
5.4. Hydrogen Production and Pyrolysis Dynamics
Several experimental studies have reported hydrogen generation during biomass pyrolysis under different operating conditions. Alvarado documented peak hydrogen yields as a function of temperature for various feedstock, finding that maximum production generally occurs above 700 °C [
36]. Xia investigated the pyrolysis of Chinese chestnut shells and showed that H
2 production increases with temperature, both in the absence and presence of a catalyst, with maximum yields reached at 800 °C [
37]. Al Arni compared slow and fast pyrolysis of sugarcane bagasse, demonstrating that the heating rate has a direct proportional effect on hydrogen generation [
38].
In this work, the fluctuations observed in H
2 production (
Figure 11) can be explained by the progressive transport of biomass by the screw conveyor, which exposes the material to zones of increasing temperature along the reactor. This dynamic results in a gradual increase in heating rate, thereby inducing oscillations in hydrogen generation. Such findings underscore the relevance of residence time control and heating profiles in continuous solar-driven pyrolysis.
5.5. Process Relevance and Technological Outlook
From a technological perspective, the solar Auger reactor demonstrated clear advantages for continuous biomass processing with direct solar heat. Compared to batch systems, this configuration allows precise control of residence time, mixing, and feed rate, all of which are essential for process scalability. Furthermore, the use of agro-industrial residues such as walnut pruning waste illustrates the potential of solar pyrolysis to contribute to a circular and decarbonized economy by producing both green hydrogen and biochar.
Despite these promising outcomes, several challenges remain. The thermal gradient along the reactor must be minimized to achieve more uniform conversion. Longer and more stable irradiation periods should be tested to evaluate process performance under near-industrial conditions. In addition, systematic studies on product yields and composition (gas, liquid, and solid) under varying operational parameters are required to optimize process efficiency and strengthen the technological readiness of solar-driven pyrolysis.
6. Conclusions
The experimental evaluation of a solarized Auger-type reactor for pyrolysis, named SARP, designed to operate under real direct solar irradiation conditions, has demonstrated its potential for continuous high-temperature (700 °C) biomass pyrolysis. The process produced biochar with a yield of 65.1% and synthesis gas containing hydrogen at concentrations relevant for energy applications.
During pyrolysis, average steady-state reactor temperatures of 669 °C ± 21 were achieved, along with sustained hydrogen production for 148 min, reaching a peak concentration of 14.5% vol at 88 min. Additionally, synthesis gas was generated at the onset of the cooling phase, during the 43 min following attenuator closure. These results confirm the feasibility of using concentrated solar energy to drive the thermochemical conversion of agricultural residues.
Temperature fluctuations in the volumetric receiver, measured by the TRec thermocouple and caused by adjustments to the optical system or cloud cover, were imperceptible inside the reactor as recorded by TIntMin and TIntMax over the short term. This demonstrates the system’s high resilience to radiative fluctuations under real operating conditions, attributable to its high thermal inertia and low axial temperature gradients in the critical zones of the SARP.
Future efforts should focus on optimizing the flux distribution in the receiver and increasing axial temperature uniformity within the reactor, without reducing the maximum temperatures recorded by TIntMax. Additionally, hybrid control strategies are needed to ensure process stability and scalability. These findings contribute to the development of sustainable solar technologies for decentralized hydrogen and biofuel production in regions with abundant biomass from agro-industrial processes and high direct solar radiation.
