Abstract
Despite converting large, laterally unbounded, highly connected low-permeability lithologic gas reservoirs—without faults or fixed lithological boundaries—into underground gas storage, the evolution of transition zone pressures and the mechanisms of gas escape under multiple injection–production cycles remain poorly understood. This knowledge gap critically hinders the safe and efficient operation of such facilities. A core–transition zone injection–withdrawal model for the S4 underground gas storage was developed using the numerical well test module of Saphir software v4.20. The model quantifies transition zone pressure dynamics over ten injection–withdrawal cycles and elucidates how the interplay of formation permeability and operating conditions governs gas leakage. During multi-cycle injection–withdrawal operations, formation pressure in the transition zone steadily accumulates under the combined influence of core zone gas crossflow and local gas advection equilibrium within the non-utilizable region. Assessed by the transition zone boundary formation pressure, suppressing gas leakage depends primarily on total injection and withdrawal volume, followed by the injection schedule and, lastly, the location of the boundary injection well. To achieve cost-effective containment, we therefore recommend prioritizing a shorter injection duration, moderately reducing total injection and withdrawal volume, and increasing the distance between the boundary injection wells and the transition zone. Under the geological conditions of the S4 UGS, by sequentially adjusting the injection duration, reducing the total injected–withdrawal gas volume to 6000 × 104 m3, and increasing the distance between boundary injection wells and the transition zone to 900 m, the transition zone boundary pressure rise over ten cycles was controlled to below 1 MPa, thereby effectively preventing gas leakage.
1. Introduction
Existing gas reservoir storage facilities, both domestically and internationally, have predominantly been repurposed from structural reservoirs characterized by well-defined boundaries and robust sealing conditions. From a structural standpoint, previous studies have focused on the geological evaluation of anticlinal, fault block, and fault nose storage sites [1,2,3]. Regarding reservoir types, research has addressed sealing assessments and development strategies for water-bearing volcanic reservoirs, aquifer sandstones, and medium-to-low permeability gas reservoirs [4,5,6]. To date, most findings have concentrated on cap rock sealing evaluations [7,8,9,10,11,12,13,14] and fault sealing analyses [3,15,16,17], leading to the development of a well-validated suite of techniques for assessing the integrity of gas storage geological systems. Research on converting low-permeability lithologic gas reservoirs into underground storage began relatively late [18,19,20,21,22,23,24,25,26,27,28], and to date, the constructed facilities are mainly concentrated in the Ordos Basin. These low-permeability lithologic reservoir underground gas storage sites are characterized by pronounced lateral heterogeneity, the absence of obvious sealing boundaries, and a dominance of low-permeability layers with only localized high-permeability zones. Low-permeability carbonate reservoir storage facilities are small in scale (Table 1) and rely on lateral lithologic seals (e.g., S2, SD). For large, broadly connected low-permeability clastic gas reservoirs such as Y3, where neither faults nor fixed lithologic boundaries exist, a “three zones” [22,25] collaborative development model has been proposed. This model facilitates a transition from an overall to a localized focus and from static to dynamic boundaries, offering new insights for the construction of underground gas storage in such reservoirs. In this approach, the storage area is divided into three functional zones based on the strong heterogeneity of extensive low-permeability reservoirs: (1) a localized “sweet spot” core zone, selected for its considerable effective reservoir thickness, good connectivity, and favorable reservoir properties to satisfy high-rate injection and withdrawal requirements; (2) a surrounding transition zone with poorer reservoir properties and reduced flow capacity to control further outward gas crossflow; and (3) a peripheral zone serving both gas field development and monitoring functions (Figure 1). Gas leakage can cause serious environmental impacts, making the operational sealing safety of the gas storage facility critically important [29,30]. The lateral sealing of the “three-zone” storage relies primarily on the inferior properties of the transition zone, which form a dynamic barrier against lateral gas crossflow, effectively suppressing gas leakage and ensuring safe operation under multi-cycle, high-rate injection and withdrawal conditions.

Table 1.
Comparison of construction conditions for lithologic gas reservoir-type UGS.
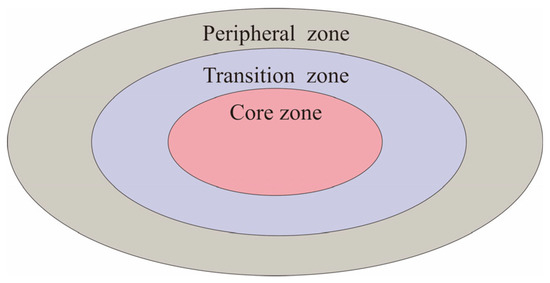
Figure 1.
Schematic of three-zone underground gas storage construction mode.
The successful development of large-scale, low-permeability lithologic underground gas storage reservoirs critically depends on preventing lateral gas crossflow through the transition zone during high-rate injection and withdrawal operations [22,24]. Previous studies have primarily employed reservoir engineering and numerical simulation techniques to estimate gas pressure propagation distances during individual injection cycles, thereby delineating the transition zone boundary. To delineate the extent of the transition zone, Zhang Jianguo et al. [25] applied the pressure propagation radius formula, calibrated with actual Y3 reservoir parameters, to calculate the maximum pressure transmission distance over a 200-day injection period; this distance was then adopted as the transition zone boundary. To assess how transition zone reservoir properties influence the operational safety of three-zone underground gas storage, Wang et al. [22] performed numerical simulations in which they increased the transition zone sand body thickness and permeability to 1.5 and 2 times their baseline values, respectively. Under these extreme scenarios, they evaluated gas leakage and found that the core zone pressure boundary did not shift significantly outward. Moreover, permeability exerted a much stronger control on the extent of seepage compared to sand body thickness, indicating that gas crossflow in low-permeability reservoirs is primarily governed by reservoir properties. To quantify the spill control zone (transition zone) under various injection–withdrawal scenarios, Li Chun et al. [24] prescribed a pressure threshold (e.g., 0.1 MPa) as the spill influence limit and then applied reservoir engineering techniques to assess how injection–withdrawal duration, sweet spot permeability, and spill zone permeability affect the spill zone extent. They found that increasing the spill zone permeability from 0.1 mD to 3 mD expanded the spill zone radius from 685 m to 3487 m—a growth of 2801 m—demonstrating that spill zone permeability is the dominant factor controlling the transition zone extent.
In summary, existing studies on the dynamic control of the transition zone in large, low-permeability lithologic reservoir UGS have only modeled the pressure propagation boundary following a single 200-day gas injection cycle. In practice, UGS operations involve multiple injection–withdrawal cycles, and the spatial influence of pressure diffusion varies with specific injection and withdrawal schemes. Defining the transition zone boundary based solely on the gas diffusion front after one 200-day injection period thus overlooks the cumulative retention of gas in the formation over successive cycles. Moreover, these studies focus on reservoirs such as the Y3 field—large, delta-controlled, highly connected, low-permeability clastic systems with extensive continuous low-permeability formations surrounding the core zone—where transition zone boundaries are delineated by computing the gas crossflow radius without adjusting core zone operating parameters. In contrast, the S4 field features laterally constrained low-permeability formations, requiring adaptive injection–production parameters to effectively limit radial gas leakage under actual geological conditions. In this paper, we employ the Saphir numerical well testing software to construct a simplified three-dimensional core-to-transition zone model and quantify the evolution of formation pressure in the transition zone under multi-cycle injection–withdrawal regimes. We systematically analyze the sensitivity of gas leakage to variations in permeability combinations and operating conditions, thereby providing a scientific basis for transition zone containment strategies in low-permeability formations. Our findings offer valuable guidance for the design of storage capacity parameters and for the safe, efficient operation of similar UGS projects.
2. Background and Methods
2.1. Basic Geological Conditions of Study Area
The S4 focuses on a low-permeability weathered crust carbonate gas reservoir, which is segmented by erosional gullies into an independent gas-bearing system covering 422.7 km2, with geological reserves of 29.58 billion m3. The reservoir interval selected for conversion into underground gas storage has a thickness of 2.4–4.2 m (average 3.0 m) and exhibits low porosity, low permeability, and significant heterogeneity. Under a three-zone scheme for the repurposed storage, the most favorable petrophysical zones are designated as the core zone and the adjacent lower-quality formation as the transition zone. In the core zone, the effective thickness is 3.0–4.8 m, porosity ranges from 3.37% to 11.06%, and well testing permeability is 8.61–16.54 mD. In the transition zone, the effective thickness is 1.4–3.1 m, porosity ranges from 3.10% to 7.80%, and permeability ranges from 0.14 to 6.37 mD (Table 2). Unlike the facies-controlled development pattern of the Y3 UGS (underground gas storage), the S4 gas storage displays markedly complex internal variability and pronounced heterogeneity. Geological constraints limit the transition zone to a lateral width of only 2000–3000 m. If the gas flow path exceeds a critical length, the gas can breach this low-permeability barrier and directly connect with adjacent high-permeability reservoir units, resulting in a significant leakage risk. This risk constitutes a critical technical bottleneck for the safe and efficient operation of the S4 UGS. To address this challenge, we developed a mechanistic model with a fixed transition zone length. By varying injection–withdrawal schemes, we simulated pressure evolution within the transition zone, identified the key factors controlling lateral gas leakage under different operational conditions, and determined the optimal injection–withdrawal parameters for the transition zone under constrained conditions.
Table 2.
Statistics of static and dynamic parameters for S4 underground gas storage.
2.2. Model Construction
Conventional reservoir simulators, designed for steady-state flow calculations, are ill suited to capture the rapid injection–withdrawal cycles and highly variable operating conditions of underground gas storage. In contrast, Saphir software offers superior accuracy for modeling transient flow behavior. Its Saphir numerical module employs a finite-difference scheme to build 2D/3D reservoir models and is capable of handling heterogeneous formations, multiphase flow, complex boundary conditions (including faulted interfaces and closed or constant-pressure boundaries), and nonlinear flow regimes.
2.2.1. Fluid PVT Properties
Dry gas was selected as the simulation fluid, and its specific gravity was set to 0.7. The pressure-dependent gas properties are defined according to the following model.
The compressibility factor () quantitatively describes the degree to which a real gas deviates from ideal behavior; in this study, the DAK model—which offers superior applicability across a wide pressure range—was employed:
: Natural gas compressibility factor (dimensionless).
: Reduced density (dimensionless): the ratio of the actual density to critical density.
: Reduced temperature (dimensionless): the ratio of the actual temperature to critical temperature.
, , : Density correlation coefficient (dimensionless), obtained by fitting to the reduced temperature .
, , : Exponential term coefficient (dimensionless): a fixed fitting constant of the model.
Gas viscosity: The Lee–Gonzalez–Eakin model is the first systematic correlation for natural gas viscosity. Its core formula is as follows:
: Natural gas viscosity (mPa·s).
: Natural gas relative density (dimensionless).
: Temperature (°F).
Gas formation volume factor (): The parameter describing the change in natural gas volume from reservoir conditions to standard surface conditions. The Bg parameter directly depends on the compressibility factor Z, which is calculated using the aforementioned DAK model.
: Natural gas volume in reservoir conditions (m3);
: Natural gas volume in standard conditions (m3);
: Compressibility factor (calculated using the DAK model);
, : Formation temperature (K) and pressure (MPa);
= 293 K and = 0.1 MPa.
2.2.2. 3D Simplified Geological Model Construction
To investigate formation pressure evolution during multi-cycle injection–withdrawal operations, we developed a simplified geological model reflecting the storage facility’s normal operating conditions. Considering that the narrowest section of the S4 transition zone measures 2000–3000 m in the field, we set the model’s transition zone length to 2000 m and constructed a linear composite stratigraphic model. The model consists of two homogeneous units—each 2000 m long and 1000 m wide—representing the core zone and the transition zone, respectively, with closed external boundary conditions. To ensure effective mobilization of the low-permeability reservoir, three injection wells are placed in the core zone (one located at the boundary, 500 m from the transition zone), and eight withdrawal wells are evenly distributed around these injectors (Figure 2).
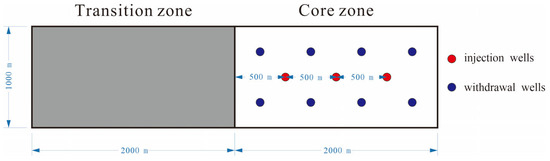
Figure 2.
Schematic diagram of 3D simplified geological model (plan view).
Based on the permeability range of the S4 gas storage formation, the core zone permeability (k1) was set to 15 mD, with a core-to-transition zone permeability contrast (k1:k2) of 10:1 (implying transition zone permeability k2 = 1.5 mD). A pre-injection formation pressure of 14 MPa was assumed in both zones. Each well was assigned an injection rate of 15 × 104 m3/d, corresponding to a total gas injection–withdrawal volume of 9000 × 104 m3 per cycle (Table 3). With reference to the actual operating conditions of reservoir-type underground gas storage, each injection–withdrawal cycle consisted of 200 days of constant-rate injection, 15 days of injection equilibrium, 120 days of constant-rate withdrawal, and 15 days of withdrawal equilibrium. The pressure evolution in both the core and transition zone was then simulated over ten consecutive cycles.
Table 3.
Parameter settings for simplified geological model.
2.2.3. 3D Mechanistic Model Construction
To further investigate prioritized control measures for gas leakage in the transition zone, a Mechanistic Model was derived from the simplified geological model by introducing a variable offset parameter (Figure 3). The geometric dimensions of both reservoir regions remained identical to those of the simplified model. A single boundary injection well was then placed at a distance d from the transition zone formation (its location adjustable), while all other injection and withdrawal well’s locations were kept unchanged.
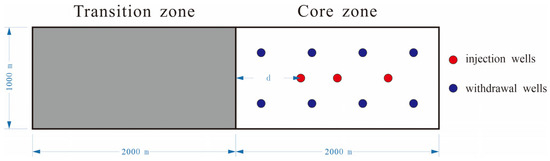
Figure 3.
Schematic Diagram of the 3D Mechanistic Model (plan view). Letter d: distance from the boundary injection well to the transition zone.
We configured multiple permeability combinations between the core and the transition zone and defined a series of injection–withdrawal scenarios, varying the total gas injection–withdrawal volume, injection schedule, and the location of the boundary injection well. Building on the simplified geological model, pre-injection formation pressure, porosity, and formation thickness were held constant, while the core zone permeability (k1), permeability contrast between the core and transition zones (k1/k2), single-cycle injection duration (t), distance from the boundary injection well to the transition zone (d), and total gas injection–withdrawal volume per cycle (Q) were systematically varied (see Table 4 for details). Each cycle comprised 200 days of injection, followed by a 15-day injection equilibrium period, 120 days of withdrawal, and a 15-day withdrawal equilibrium period. The model was run for ten successive cycles to simulate and analyze the evolution of formation pressure at the transition zone boundary.
Table 4.
Calculation parameters for Mechanistic Model.
2.2.4. Discussion on Model Applicability
The two-zone homogeneous formation mechanism model for underground gas storage established in this study simplifies formation heterogeneity due to limited access to data. It focuses on the macro pressure transmission law between the “core zone–transition zone”, which not only avoids parameter uncertainty issues to quickly establish the correlation between key variables, but also provides support for the calculation of macro injection–production parameters and verification of basic mechanisms in the early stage of gas storage, thus possessing certain engineering rationality. However, it should be noted that this model does not incorporate the internal heterogeneity of regional formations (such as spatial variations in permeability and porosity) and the dynamic evolution characteristics of preferential seepage channels, making it difficult to accurately adapt to the actual geological and development scenarios of the S4 gas storage. In the future, based on this macro simplified model, further detailed formation characterization work should be carried out to improve the guiding value of the model for the engineering practice of the S4 gas storage.
3. Results
3.1. Characteristics of Formation Pressure Changes in Transition Zones over Multiple Injection–Withdrawal Cycles
3.1.1. Characteristics of Formation Pressure Changes in Transition Zones over Multiple Injection–Withdrawal Cycles
- Characteristics of Single-Cycle Formation Pressure Variations in Transition Zone
By the end of the first injection cycle (Figure 4a), core zone pressure had increased from the initial 14 MPa to 27.5 MPa, exhibiting excellent uniformity except for a slight decrease near the transition zone. In the transition zone, however, deterioration of formation properties markedly reduced gas permeability, imposing significant flow resistance and generating a steep pressure gradient adjacent to the core zone. After 200 days of injection, no significant pressure buildup was observed throughout the transition zone. Beyond 1000 m from the core, pressures remained essentially unaffected by gas pressure propagation; the outer boundary of the transition zone registered 14.01 MPa at the end of injection, a mere 0.07% increase. Following the first cycle of withdrawal (Figure 4b), with equal injection and withdrawal volume, the gas that crossflowed into the transition zone during injection remained unrecovered. As a result, core zone pressure fell slightly below its pre-injection level, while transition zone pressure exceeded that of the core zone. At the end of the first cycle of withdrawal, the transition zone boundary pressure stabilized at 14.17 MPa, representing a cumulative increase of 1.21% above the initial pressure.
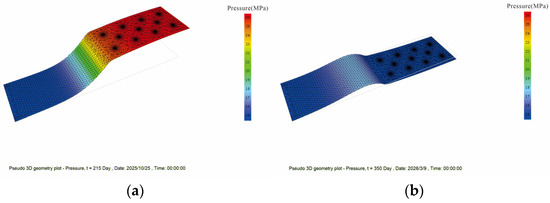
Figure 4.
Formation pressure field map at end of first injection–withdrawal cycle. (a) End of gas injection; (b) end of gas withdrawal.
- 2.
- Characteristics of Formation Pressure Variations in Transition Zones under Different Injection–Withdrawal Cycles
Figure 5, Figure 6 and Figure 7 illustrate the calculated formation pressures after the injection–withdrawal operations at the end of the 2nd, 5th, and 10th cycles. Although the transition zone’s low permeability imposes flow restrictions, its boundary pressure exhibits a clear, cumulative upward trend with successive injection–withdrawal cycles. Specifically, at the end of the second-cycle injection, the transition zone boundary pressure was 14.75 MPa, rising to 15.06 MPa after gas withdrawal. Following the fifth-cycle injection, it reached 16.77 MPa and further increased to 16.90 MPa post withdrawal. After the tenth-cycle injection, it reached 18.20 MPa, with a slight increase to 18.24 MPa upon completion of withdrawal.
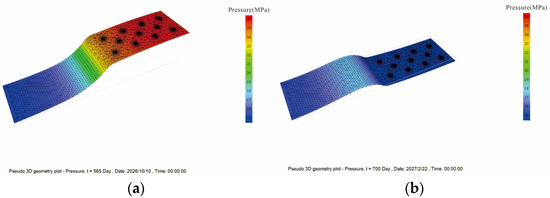
Figure 5.
Formation pressure field map at end of second injection–withdrawal cycle. (a) End of gas injection; (b) end of gas withdrawal.
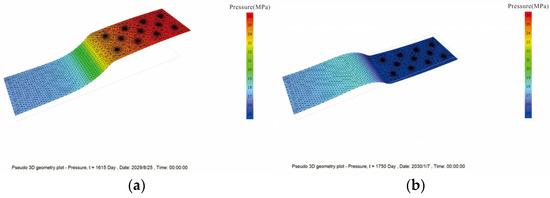
Figure 6.
Formation pressure field map at end of fifth injection–withdrawal cycle. (a) End of gas injection; (b) end of gas withdrawal.
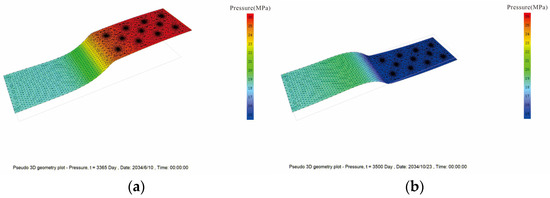
Figure 7.
Formation pressure field map at end of tenth injection–withdrawal cycle. (a) End of gas injection; (b) end of gas withdrawal.
- 3.
- Dynamic Evolution Patterns of Multi-Cycle Injection–Withdrawal Pressure in Transition Zone
Comparison of pressure field distribution across multiple cycles shows that, upon completion of the second cycle of withdrawal, a narrow high-pressure belt developed in the transition zone at 500–700 m from the core zone (Figure 5b). By the end of the fifth cycle of withdrawal, this high-pressure band significantly expanded within the transition zone (Figure 6b). During the tenth cycle of withdrawal, pressure in the formation immediately to the left of the critical point within the transition zone not only remained elevated but also displayed a homogenized distribution pattern (Figure 7b).
3.1.2. Spatial Regional Characteristics of Pressure Variations in the Transition Zone
An in-depth analysis of the simulation results indicates that the pressure distribution in the transition zone is not uniform but can be subdivided into two distinct regions (Figure 8). Using the formation pressure profile at the end of the first injection–withdrawal cycle as an example, the pressure change characteristics exhibit a critical point when the injection and withdrawal pressure curves intersect. The dynamic interface at this critical point divides the transitional zone of the formation into two regions. To the right of this point, post-injection pressures consistently exceed post-withdrawal pressures throughout each injection–withdrawal cycle, indicating that this region maintains sufficiently low-pressure during withdrawal to recover fugitive gas. Consequently, it meets the criteria for effective utilization and is hereafter referred to as the ‘utilizable region’. Conversely, to the left of the critical point, post-injection pressures remain lower than post-withdrawal pressures across multiple cycles, indicating that the pressure drawdown during withdrawal never reaches the threshold required for effective utilization. This region is therefore designated as the ‘non-utilizable region’.
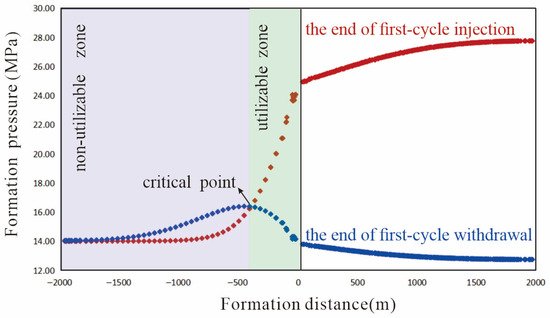
Figure 8.
Schematic diagram of stratigraphic regional division in transition zone. Red squares: Formation pressure values at the end of gas injection in the first cycle; Blue squares: Formation pressure values at the end of gas production in the first cycle.
3.1.3. The Causes of Sustained Pressure Increase in the Transition Zone
An in-depth analysis of gas flow mechanisms reveals that formation pressures within the transition zone progressively increase over successive injection–withdrawal cycles. This trend is governed by two principal factors. First is the cumulative effect: Owing to the transition zone’s inherent permeability, each cycle causes high-pressure gas to flow from the core zone into the transition zone, where it gradually accumulates. During the gas injection operation, which spans 200 days, gas crossflows slowly over extended periods, resulting in a larger diffusion radius. In contrast, during the 120-day gas withdrawal operation—characterized by a short-term, high-rate withdrawal—the gas diffusion radius is smaller. Only the high-permeability conduits are effectively drained, while the low-permeability portions remain largely untapped and accumulate with each cycle. As the number of cycles increases, this cumulative stacking effect becomes increasingly pronounced, leading to an overall rise in transition zone pressure. Second is pressure equilibration within the non-utilizable region: Gas that crossflows into the region lying on the low-pressure side of the critical point cannot be effectively recovered during withdrawal, so it continuously seeps toward adjacent lower-pressure strata until the region attains dynamic equilibrium. This ongoing equilibration further contributes to the progressive rise in boundary pressures throughout the transition zone.
3.2. Research on the Control Mechanism of Gas Leakage in the Transition Zone
Based on the clarified characteristics and evolutionary patterns of multi-cycle injection–withdrawal pressure variations within the transition zone, and with the aim of identifying the primary controls on gas leakage and guiding its operation, we investigated gas leakage control mechanisms under different formation combinations and injection–withdrawal scenarios. Previous studies have shown that the degree of gas crossflow within the transition zone is closely related to contrasts in petrophysical properties between the core and transition zones, as well as to operational parameters, with reservoir permeability identified as the primary geological control on gas outflow [22,24]. Therefore, this study evaluates four key influencing factors—formation permeability, injection schedule, total injection and withdrawal volume, and the distance from the boundary injection well to the transition zone formation—by using the increase in formation pressure at the transition zone boundary as a metric for gas leakage control to quantify each factor’s impact on leakage management.
3.2.1. Effect of Formation Permeability on Gas Leakage Control
Holding all other parameters constant, we established five scenarios of combined core zone and transition zone permeabilities (Table 5): (i) constant core zone permeability with variable transition zone permeability (scenarios 2, 3, and 4); (ii) variable core zone permeability with a fixed core-to-transition permeability contrast (scenarios 1, 3, and 5); (iii) constant transition zone permeability with variable core zone permeability (scenarios 2 and 5). Numerical simulations were then performed, and the results show the following:
Table 5.
Formation assemblage parameter settings.
Due to cumulative gas crossflow over successive injection–withdrawal cycles and the evolving pressure equilibrium within the non-utilizable region, all five permeability combination scenarios show a pronounced increase in the transition zone boundary formation pressure as the number of cycles rises.
By comparing formation assemblages 2, 3, and 4—each with a constant core zone permeability of 15 mD but core-to-transition permeability contrasts of 5, 10, and 20, respectively—it is evident that lower transition zone permeability (i.e., higher permeability contrast) imposes greater flow resistance. Consequently, the transition zone boundary pressure increases with increasing permeability contrast. After ten injection–withdrawal cycles, the boundary pressures for assemblages 2, 3, and 4 reach 18.96 MPa, 18.24 MPa, and 17.15 MPa, respectively (Figure 9). These simulation results demonstrate that, with core zone permeability held constant, reservoir configurations exhibiting higher permeability contrasts more effectively inhibit gas leakage.
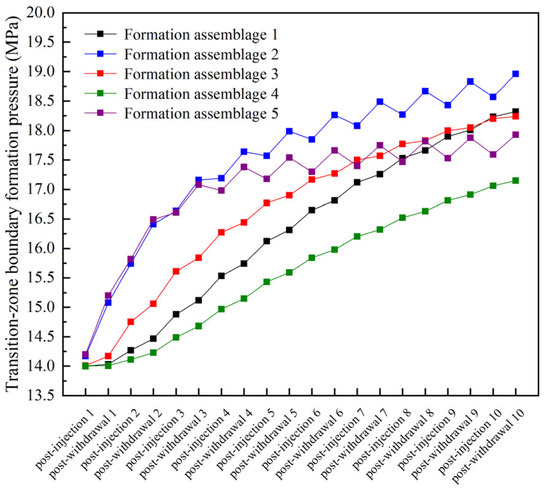
Figure 9.
Impact of different formation assemblages on formation pressure at transition zone boundary.
By comparing formation assemblages 1, 3, and 5—each with a fixed core-to-transition permeability contrast of 10 but core zone permeabilities of 10 mD, 15 mD, and 30 mD, respectively—it is observed that during the early injection–withdrawal cycles, scenarios with higher transition zone permeability (i.e., lower core zone permeability) exhibit faster boundary pressure buildup. In contrast, during the later cycles, models with higher core zone permeability display a pronounced slowdown in pressure increase. After ten cycles, the transition zone boundary pressures for assemblages 1, 3, and 5 reach 18.32 MPa, 18.24 MPa, and 17.93 MPa, respectively (Figure 9). These results demonstrate that at a constant permeability contrast, formations with higher transition zone permeability allow for greater initial gas leakage, but the enhanced containment provided by higher core zone permeability becomes increasingly significant over successive cycles.
By comparing formation assemblages 2 and 5—both featuring a transition zone permeability of 3 mD but core zone permeabilities of 15 mD and 30 mD, respectively—it is evident that their relatively high transition zone permeability induces a pronounced rise in transition zone boundary pressure during the early injection–withdrawal cycles. As cycling progresses, the boundary pressure closely follows the core zone pressure profile, exhibiting the characteristic ‘high pressure at the end of injection, low pressure at the end of withdrawal’ behavior. In the later cycles, assemblage 5, with its higher core zone permeability (and thus greater core-to-transition permeability contrast), shows a clear deceleration in the rate of boundary pressure increase (Figure 9). These results further confirm that for a given absolute transition zone permeability, formation assemblages with larger permeability contrasts more effectively inhibit gas leakage.
3.2.2. Effect of Injection–Withdrawal Conditions on Gas Leakage Control
- Gas Injection Schedule
A single injection–withdrawal cycle is conducted with a constant total injection and withdrawal volume of 9000 × 104 m3. By varying the injection schedules of three injection wells, seven distinct schemes are defined: early intensive injection with an extended equilibrium period (schemes 1–3), constant-rate injection (scheme 4), and late intensive injection with a short equilibrium period (schemes 5–7) (Table 6). Numerical simulations are then performed for the five formation assemblages listed in Table 5. In scheme 4, gas is injected at a uniform rate over 200 days, followed by a 15-day equilibrium period before gas withdrawal. In schemes 1–3, the entire injection volume is delivered within the first 50, 100, and 150 days, respectively, of the 200-day injection period; injection is then suspended until the end of the 200 days, after which withdrawal begins. Conversely, in schemes 5–7, injection is postponed during the early stage and completed within the last 150, 100, and 50 days, respectively, of the 200-day injection period, followed by a 15-day equilibrium period prior to gas withdrawal.
Table 6.
Setting of injection schedules.
The calculation results are shown in Figure 10. Although each formation assemblage exhibits different capacities to restrain gas leakage, all simulation results display a consistent trend: after ten injection–withdrawal cycles under scheme 7, the increase in transition zone boundary pressure is the smallest. For instance, in formation assemblage 3, the boundary pressures after ten cycles under schemes 1 through 7 are 20.56 MPa, 19.81 MPa, 19.03 MPa, 18.24 MPa, 17.60 MPa, 16.95 MPa, and 16.28 MPa, respectively. Compared with scheme 4 (constant-rate injection), schemes 1–3 result in higher boundary pressures, indicating that early-stage intensive injection with extended equilibration exacerbates gas leakage. Conversely, schemes 5–7 produce lower boundary pressures, demonstrating that late-stage intensive injection with a brief equilibration period effectively suppresses leakage. Further analysis reveals that high injection rates early in the cycle accelerate gas crossflow into the transition zone; shorter injection durations at even higher rates intensify leakage, and prolonged equilibration allows for continued crossflow, ultimately causing a pronounced pressure rise. In contrast, concentrating injection at the end of the injection period limits gas leakage because, after a short equilibration period, gas withdrawal before significant outward crossflow can occur. For example, in formation assemblage 3, shifting from 200-day constant-rate injection to a 50-day late-stage intensive injection reduces the transition zone boundary pressure rise by 46%.
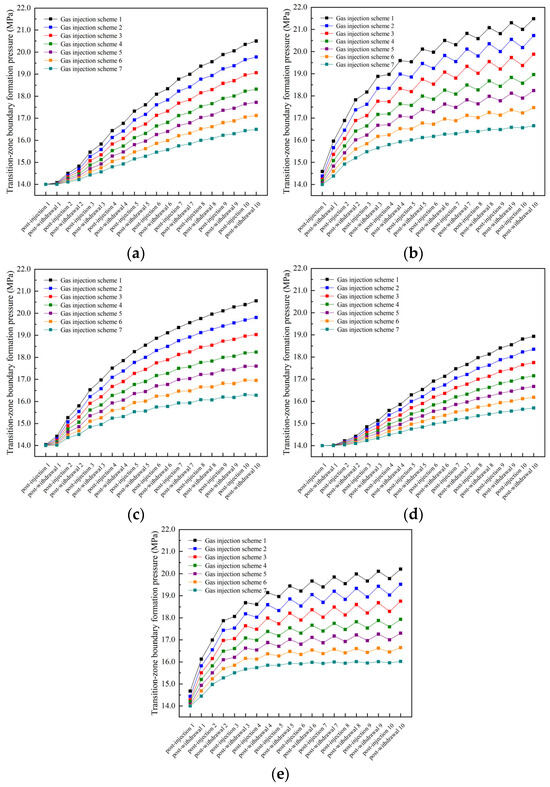
Figure 10.
Impact of different injection schedules on formation pressure at transition zone boundary. (a) Formation assemblage 1; (b) formation assemblage 2; (c) formation assemblage 3; (d) formation assemblage 4; (e) formation assemblage 5.
- 2.
- Total injection and withdrawal volume
The investigation of injection schedule effects on gas leakage control demonstrates that, regardless of the formation assemblage, variations in injection duration produce a consistent leakage control response. Therefore, this study will henceforth focus exclusively on formation assemblage 3—characterized by a core zone permeability of 15 mD, a transition zone permeability of 1.5 mD, and a permeability contrast of 10—and will omit further consideration of other permeability scenarios in all subsequent analyses.
By stepwise reducing the total injection and withdrawal volume per cycle from 9000 × 104 m3 to 5000 × 104 m3, the simulation results presented in Figure 11 show that for total injection and withdrawal volumes of 9000 × 104 m3, 8000 × 104 m3, 7000 × 104 m3, 6000 × 104 m3, and 5000 × 104 m3, the transition zone boundary pressures after ten injection–withdrawal cycles are 18.24 MPa, 17.42 MPa, 16.70 MPa, 16.11 MPa, and 15.70 MPa, respectively. These results indicate that as the total injection and withdrawal volume per cycle decreases, the reduction rate of boundary pressure in the transition zone also decreases. Specifically, lowering the total injection and withdrawal volume per cycle from 9000 × 104 m3 to 5000 × 104 m3 reduces the magnitude of the transition zone pressure rise by 60%.
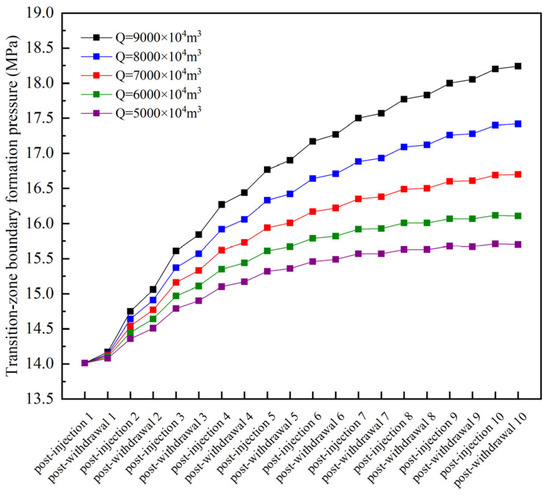
Figure 11.
Impact of different total injection and withdrawal volumes on formation pressure at transition zone boundary.
- 3.
- Location of Boundary Gas Injection Well
To examine the effect of boundary injection well location on gas leakage control, formation assemblage 3 was chosen as the study case. Keeping the total injection and withdrawal volume per cycle constant at 9000 × 104 m3, the distance between the boundary injection well and the transition zone formation was incrementally increased from 500 m to 900 m. The resulting simulation outcomes are presented in Figure 12.
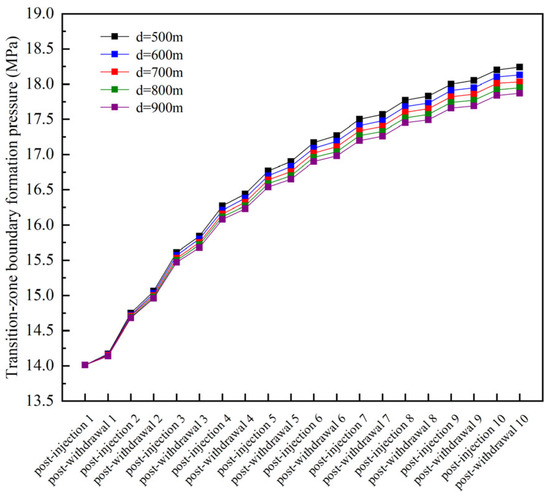
Figure 12.
Impact of different locations of boundary gas injection well on formation pressure at transition zone boundary.
For boundary injection well distances (d) of 500, 600, 700, 800, and 900 m from the transition zone, the transition zone boundary pressures are 18.24 MPa, 18.13 MPa, 18.03 MPa, 17.95 MPa, and 17.87 MPa, respectively. These results show that increasing the distance between the boundary injection well and the transition zone has only a minor effect on transition zone boundary pressure; when d increases from 500 m to 900 m, the pressure rise magnitude at the transition zone boundary decreases by only 8%.
- 4.
- Comparative Analysis of Control Parameters
To assess the sensitivity of transition zone gas leakage to three operational parameters—injection schedule, total injection and withdrawal volume, and location of boundary injection well—reservoir scheme 3 was selected as the case study. The results indicate the following: switching from a 200-day constant-rate injection to a 50-day intensified late-cycle injection reduces the transition zone boundary pressure increase by 46%; decreasing the total injection and withdrawal volume per cycle from 9000 × 104 m3 to 5000 × 104 m3 lowers the pressure rise by 60%; increasing the distance between the boundary injection well and the transition zone formation from 500 m to 900 m reduces the pressure increase by only 8%. Therefore, the relative effectiveness of these controls on gas leakage can be ranked as follows: total injection and withdrawal volume > injection schedule > location of boundary injection well.
From an economic standpoint, in underground gas storage operations, both reducing the total injection and withdrawal volume and increasing the distance from the boundary injection well to the transition zone formation can mitigate transition zone gas leakage. However, reducing the total injection and withdrawal volume undermines injection–withdrawal efficiency, and increasing the distance from the boundary injection well to the transition zone formation diminishes the formation’s usable storage capacity. In contrast, adjustments to the injection schedule exert minimal impact on operational economics and efficiency. Therefore, the injection schedule should be prioritized as the principal control measure, supplemented by a moderate reduction in total injection and withdrawal volume and a judicious increase in the distance from the boundary injection well to the transition zone formation, to achieve efficient and coordinated management of transition zone gas leakage.
3.3. Application Example
To ensure the economic viability of the storage operation, this study defines gas leakage control by limiting the increase in transition zone boundary formation pressure to within 1 MPa after ten injection–withdrawal cycles, using this threshold as the criterion for acceptable gas leakage.
Using four sets of core zone and transition zone permeability combinations from the S4 underground gas storage as an example (average core zone permeability: 13.01 mD; average transition zone permeability: 2.07 mD; mean permeability range: 6.28 mD; see Table 7), and acknowledging that excessively high injection rates may cause low-permeability formations to exceed the design pressure limit, we imposed a maximum single-well injection rate of 40 × 104 m3/d in accordance with S4 design constraints. We then conducted simulations for three total injection and withdrawal volumes—60 × 104 m3, 55 × 104 m3, and 50 × 104 m3 per cycle—setting the injection durations to 55, 50, and 45 days, respectively. Finally, we compared and analyzed the transition zone boundary formation pressures after ten injection–withdrawal cycles under different boundary injection well configurations across these three scales.
Table 7.
Actual S4 gas storage reservoir permeability.
The results indicate that at a total injection and withdrawal volume of 5000 × 104 m3 per injection–withdrawal cycle, the control criterion is satisfied without relocating the boundary injection well. When the volume increases to 5500 × 104 m3, the boundary well must be positioned at least 700 m away from the transition zone, and at 6000 × 104 m3 per cycle, the well spacing must be extended to 900 m to meet the control requirements (Figure 13). Balancing the economic performance of underground gas storage operations, the scenario with the highest total cyclic gas injection and withdrawal volume is selected as the optimal strategy for preventing gas leakage.
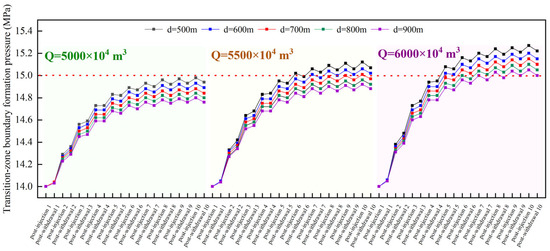
Figure 13.
Comparison of gas leakage control schemes for S4 underground gas storage. Red dot: Formation pressure value at the transition zone boundary is 15 MPa.
4. Discussion and Conclusions
- (1)
- In the absence of gas leakage control measures, formation pressure in the transition zone steadily increases over multiple injection–withdrawal cycles. Based on the observed pressure evolution patterns, the transition zone can be subdivided into a utilizable region adjacent to the core and a non-utilizable region located farther away. The ongoing rise in boundary formation pressure is primarily driven by the cumulative effects of gas leakage over repeated cycles and the pressure-rebalancing processes within the non-utilizable region.
- (2)
- The effectiveness of gas leakage control in the transition zone of an underground gas storage reservoir is strongly dependent on the permeability pairing between the core and transition zones. When core zone permeability is held constant, formations with a larger permeability contrast exhibit more pronounced suppression of gas leakage. When the permeability contrast is fixed, assemblages with higher core zone permeability demonstrate an increasingly significant control advantage as injection–withdrawal cycles progress. Likewise, with transition zone permeability fixed, assemblages featuring greater permeability contrasts deliver superior control performance.
- (3)
- Adjusting the cyclic injection–withdrawal parameters of underground gas storage can further suppress gas leakage. Reducing the total injection and withdrawal volume yields the most significant control effect in the transition zone, followed by optimizing the injection schedule and, finally, the location of the boundary injection well. To balance operational economy and efficiency, priority should be given to refining the injection schedule; thereafter, the total injection and withdrawal volume should be moderately reduced and the location of the boundary injection well suitably adjusted to achieve efficient, synergistic control of gas leakage in the transition zone.
- (4)
- We define an increase in transition zone boundary formation pressure of no more than 1 MPa as the acceptable threshold for gas leakage. To balance operational economics and efficiency, the injection–withdrawal scheme that maximizes total injection and withdrawal volume is selected as the optimal control scheme. Under the in situ reservoir conditions of the S4 underground gas storage, setting the single-cycle total injection and withdrawal volume to 6000 × 104 m3 requires positioning the boundary injection wells 900 m from the transition zone to achieve effective lateral containment of gas leakage.
Author Contributions
Conceptualization, L.O. and S.X.; methodology, L.O. and G.D.; software, Y.S.; validation, S.X., Y.S. and G.D.; formal analysis, H.X.; investigation, L.O.; data curation, X.L., Y.W. and B.Z.; writing—original draft preparation, L.O.; visualization, W.Z.; supervision, G.D. All authors have read and agreed to the published version of the manuscript.
Funding
This research was funded by the National Major Special Project Subject 6 “Research on Efficient Operation and Intelligent Peak Shaving Technology of Gas Storage”, grant number 2025ZD1406806, and the PetroChina Oil & Gas and New Energy Branch Science and Technology Project “Research on Key Technologies for Capacity Expansion, Production Target Achievement of Gas Storage in Complex Gas Reservoirs and New Storage Construction”, grant number 2023YQX106.
Data Availability Statement
The data that support the findings of this study are available from the corresponding author upon reasonable request.
Acknowledgments
The authors acknowledge the technical support provided by the Research Institute of Petroleum Exploration & Development and the CNPC Key Laboratory of Oil & Gas Underground Storage Engineering.
Conflicts of Interest
Authors Lanhantian Ou, Guosheng Ding, Shujuan Xu, Yunhe Su, Hongcheng Xu, Xin Lai, Yanqi Wu, Bingtong Zhang, and Wenjing Zhao are employed by the China National Petroleum Corporation. The authors declare that this research was conducted in the absence of any commercial or financial relationships that could be constructed as potential conflicts of interest. The funder was not involved in the study design, collection, analysis, and interpretation of data, the writing of this article, or the decision to submit it for publication.
References
- Xuan, T.; Gao, L.; Qin, P.; Su, Z.; Li, J.; Cai, Z. Feasibility of rebuilding abandoned offshore gas reservoir into underground gas storage: Case study of H gas field in Qiongdongnan Basin. Nat. Gas Geosci. 2022, 33, 324–332. [Google Scholar] [CrossRef]
- Yin, S. Feasibility Study on the Conversion and Construction of Underground Gas Storage from the Wanshunchang Carboniferous Gas Reservoir. Master’s Thesis, Southwest Petroleum University, Chengdu, China, 2015. [Google Scholar]
- Liu, C. Feasibility on Rebuilding the Underground Gas Storage in the Depleted Gas Reservoirs. Pet. Geol. Oilfield Dev. Daqing 2016, 35, 56–59. [Google Scholar] [CrossRef]
- Liao, W.; Liu, G.; Chen, R.; Sun, J.; Zhang, S.; Wang, Y.; Liu, X. Evaluation on the dynamic sealing capacity of underground gas storages rebuilt from gas reservoirs: A case study of Xinjiang H underground gas storage. Nat. Gas Ind. 2021, 41, 133–141. [Google Scholar] [CrossRef]
- Bruno, M.S.; Lao, K.; Diessl, J.; Childers, B.; Xiang, J.; White, N.; Van Der Veer, E. Development of Improved Caprock Integrity Analysis and Risk Assessment Techniques. Energy Procedia 2014, 63, 4708–4744. [Google Scholar] [CrossRef]
- Zhang, P.; Shu, P. Feasibility study on converting vocalnic gas reservoir with edge-bottom water into underground gas storage-A case study from Block D in Xushen Gas Field. Nat. Gas Ind. 2015, 35, 104–109. [Google Scholar]
- Zheng, Y.; Sun, J.; Qiu, X.; Lai, X.; Liu, J.; Guo, Z.; Wei, H.; Min, Z. Connotation and evaluation technique of geological integrity of UGSs in oil-gas fields. Nat. Gas Ind. B 2020, 40, 94–103. [Google Scholar] [CrossRef]
- Watts, N.L. Theoretical Aspects of Cap-Rock and Fault Seals for Single- and Two-Phase Hydrocarbon Columns. Mar. Pet. Geol. 1987, 4, 274–307. [Google Scholar] [CrossRef]
- Wang, C.; Jia, S.; Yang, J.; Zhong, G.; Chen, Z.; Chang, Y. Variation characteristics of dynamic stress of cap rock during gas storage multi-cycle injection-production process. Natrual Gas Oil 2022, 40, 59–68. [Google Scholar] [CrossRef]
- Liu, L.; Sang, Q.; Cao, J.; Zhang, C.; Wang, X.; Ding, Q. Comprehensive evaluation of sealing capacity of depleted gas reservoir reconstructed to gas storage: A case study of Xu 2 gas reservoir in Zhongba Gas Field, northwest Sichuan. Pet. Geol. Oilfield Dev. Daqing 2022, 41, 42–50. [Google Scholar] [CrossRef]
- Zheng, D.; Xu, H.; Wang, J.; Sun, J.; Zhao, K.; LI, C.; Shi, L.; Tang, L. Key evaluation techniques in the process of gas reservoir being converted into underground gas storage. Pet. Explor. Dev. 2017, 44, 794–801. [Google Scholar] [CrossRef]
- Sun, J.; Xu, H.; Wang, J.; Shi, L.; Li, C.; Tang, L.; Zhong, R. Injection–production mechanisms and key evaluation technologies for underground gas storages rebuilt from gas reservoirs. Nat. Gas Ind. 2018, 38, 138–144. [Google Scholar] [CrossRef]
- Mi, L.; Guo, Y.; Li, Y.; Zeng, D.; Lu, C.; Zhang, G. Evaluation of the Dynamic Sealing Performance of Cap Rocks of Underground Gas Storage under Multi-Cycle Alternating Loads. Energy Geosci. 2024, 5, 100319. [Google Scholar] [CrossRef]
- Chen, B.; Li, Q.; Tan, Y.; Yu, T.; Li, X.; Li, X. Experimental Measurements and Characterization Models of Caprock Breakthrough Pressure for CO2 Geological Storage. Earth-Sci. Rev. 2024, 252, 104732. [Google Scholar] [CrossRef]
- Teatini, P.; Castelletto, N.; Gambolati, G. 3D Geomechanical Modeling for CO2 Geological Storage in Faulted Formations. A Case Study in an Offshore Northern Adriatic Reservoir, Italy. Int. J. Greenh. Gas Control 2014, 22, 63–76. [Google Scholar] [CrossRef]
- Ngwenya, B.T.; Elphick, S.C.; Main, I.G.; Shimmield, G.B. Experimental Constraints on the Diagenetic Self-Sealing Capacity of Faults in High Porosity Rocks. Earth Planet. Sci. Lett. 2000, 183, 187–199. [Google Scholar] [CrossRef]
- Pei, Y.; Paton, D.A.; Knipe, R.J.; Wu, K. A Review of Fault Sealing Behaviour and Its Evaluation in Siliciclastic Rocks. Earth-Sci. Rev. 2015, 150, 121–138. [Google Scholar] [CrossRef]
- Ding, G.; Wang, Y.; Wanyan, Q.; Wang, J.; Xu, H.; Li, K.; Xia, Y.; Li, L.; Zeng, D.; Liu, Z. Construction difficulties and research directions of various complex UGSs. Nat. Gas Ind. 2023, 43, 14–23. [Google Scholar] [CrossRef]
- Li, J.; Xia, Y.; Zhang, J.; Wang, D.; Zhao, C.; Wang, W. Key Technologies and Development Directions for the Design and Operation of Low-Permeability Lithologic Gas Reservoir-Type Gas Storage. In Proceedings of the 33rd National Natural Gas Academic Annual Conference (2023) (06 Comprehensive Topics), Nanning, China, 31 May–2 June 2023; Natural Gas Professional Committee of the Chinese Petroleum Society: Beijing, China, 2023; p. 11. [Google Scholar]
- Chen, F.; Yan, Z.; Wu, Y.; Xia, Y.; You, L. Techniques for UGS Sealing Evaluation of Lithologic Gas Reservoir—A Case Study of SH224 UGS in Jingbian Gas Field. Unconv. Oil Gas 2015, 2, 58–64. [Google Scholar]
- Feng, M.; Li, F.; Bai, H.; Hou, K.; Tian, Q.; Liu, Z. Comprehensive Evaluation Method for Sealing Performance of Lithologic Gas Reservoir-Type Gas Storage—Taking the SD5 Gas Storage in Sulige Gas Field as an Example. In Proceedings of the National Natural Gas Academic Annual Conference, Hangzhou, China, 19–20 September 2017; Natural Gas Professional Committee of the Chinese Petroleum Society: Beijing, China; Sichuan Petroleum Society: Chengdu, China; Zhejiang Petroleum Society: Zhoushan, China, 2017; p. 8. [Google Scholar]
- Wang, J.; Wang, J.; Xu, S.; Wu, R.; Lv, J.; Li, Z.; Li, C.; Zhang, J.; Zhao, L.; Xie, J.; et al. A Novel Mode for “Three Zones” Collaborative Reconstruction of Underground Gas Storage and Its Application to Large, Low-Permeability Lithologic Gas Reservoirs. Energy 2022, 253, 124148. [Google Scholar] [CrossRef]
- Yang, Q.; Tian, W.; Wang, Y.; Sun, J. Site selection and effect analysis of lithologic gas storage. Petrochem. Ind. Appl. 2022, 41, 90–93. [Google Scholar] [CrossRef]
- Li, C.; Wang, J.; Xia, Y.; Sun, J.; Zhong, R.; Tu, K. A New Model for Large Lithological Underground Gas Storage Rebuilded and Dynamic Boundary Prediction Method. In Proceedings of the 2023 International Field Exploration and Development Conference 2023, Wuhan, China, 20–22 September 2023; IFEDC Organizing Committee: Beijing, China, 2023. [Google Scholar]
- Zhang, J.; Xia, Y.; Zhao, C.; Wang, L. Key technologies for geological evaluation of UGSs rebuilt from low-permeability lithological gas reservoirs in the Ordos Basin. Nat. Gas Ind. 2023, 43, 55–63. [Google Scholar] [CrossRef]
- Li, C.; Min, Z.; He, H.; Liu, J.; Tu, K.; Wu, H. New Trend and Development Suggestions for Change of Underground Gas Storage Sites in China. Pet. Drill. Tech. 2024, 52, 153–158. [Google Scholar]
- Li, J.; Xia, Y.; Wang, D.; Zhao, C.; Zhang, J.; Wang, L.; He, Y.; An, W. Key technologies of construction design and operation optimization for underground gas storage of low permeability lithologic gas reservoirs in Ordos Basin. Nat. Gas Geosci. 2023, 34, 1442–1451. [Google Scholar] [CrossRef]
- Xia, Y.; Zhang, J.; He, Y.; Yang, Q.; Wang, L.; Fu, J.; Wang, W. Feasibility and operating index design of low permeability lithological reservoir into underground gas storage: Case study of S area in Ordos Basin. Nat. Gas Geosci. 2023, 34, 1452–1459. [Google Scholar] [CrossRef]
- Li, Q.; Han, Y.; Liu, X.; Ansari, U.; Cheng, Y.; Yan, C. Hydrate as a By-Product in CO2 Leakage during the Long-Term Sub-Seabed Sequestration and Its Role in Preventing Further Leakage. Environ. Sci. Pollut. Res. 2022, 29, 77737–77754. [Google Scholar] [CrossRef]
- Li, Q. Reservoir Science: A Multi-Coupling Communication Platform to Promote Energy Transformation, Climate Change and Environmental Protection. Reserv. Sci. 2025, 1, 1–2. [Google Scholar] [CrossRef]


Disclaimer/Publisher’s Note: The statements, opinions and data contained in all publications are solely those of the individual author(s) and contributor(s) and not of MDPI and/or the editor(s). MDPI and/or the editor(s) disclaim responsibility for any injury to people or property resulting from any ideas, methods, instructions or products referred to in the content. |
© 2025 by the authors. Licensee MDPI, Basel, Switzerland. This article is an open access article distributed under the terms and conditions of the Creative Commons Attribution (CC BY) license (https://creativecommons.org/licenses/by/4.0/).