Article

Stress Distribution and Mechanical Modeling of Double-Layer Pipelines Coupled with Temperature Stress and Internal Pressure

1
Henan No.2 Hydraulic Engineering Bureau, Zhengzhou 450016, China
2
Zhengzhou University Infrastructure Department, Zhengzhou 450001, China
*
Author to whom correspondence should be addressed.
Processes 2025, 13(10), 3193; https://doi.org/10.3390/pr13103193
Submission received: 29 July 2025 / Revised: 23 September 2025 / Accepted: 30 September 2025 / Published: 8 October 2025
(This article belongs to the Section Materials Processes)

Abstract

In deepwater oil and gas transportation, Pipe-in-Pipe (PIP) systems are an effective solution for mitigating external loads while preserving internal thermal integrity. A finite element model with ITT elements and nonlinear spring contacts was developed in ABAQUS to simulate thermal expansion and contraction under extreme conditions. The coupled mechanical response of double-layer pipelines under non-uniform temperature fields and internal pressure was analyzed, focusing on stress distribution and deformation coordination between the inner and outer pipes. The inner pipe primarily sustains compressive or tensile stress depending on the thermal load direction, while the outer pipe experiences opposing stresses due to mechanical coupling. Distinct stress transfer zones are present near the pipe ends, governed by pipe-soil interaction and internal bending moments. The proposed model for double-layer pipelines under coupled thermal and internal pressure loads demonstrates a prediction accuracy within 5% as compared with benchmark numerical solutions. The simulations capture axial stress variations of up to 68% between extreme thermal expansion and contraction scenarios, with radial deformation ranging from 0.9 mm to 3.4 mm. These findings provide valuable insights into the safe and efficient design of subsea PIP systems, particularly for optimizing material selection and structural configuration in high-temperature, high-pressure environments.

1. Introduction

In offshore oil and gas development, subsea pipelines are often subjected to harsh deep-sea conditions, such as high pressure, low temperatures, and strong currents. Traditional single-layer steel pipelines have frequently proved inadequate in terms of thermal insulation, corrosion protection, and their ability to withstand external water pressure. These shortcomings are especially pronounced when transporting fluids like high-viscosity crude oil or natural gas condensate. Without effective insulation, these fluids may cool and solidify at low ambient temperatures or form gas hydrates that could block the pipeline [1,2].
These challenges have spurred the development of marine ‘pipe-in-pipe (PIP)’ systems. A PIP system consists of two concentric steel pipes—an inner flowline housed within an outer carrier pipe—with insulation filling the annular space between them. The outer pipe is typically a high-strength, thick-walled carbon or alloy steel tube, designed to resist external loads such as hydrostatic pressure, seabed soil pressure, and impacts from the marine environment. The inner pipe, by contrast, is usually a smooth, corrosion-resistant steel (or stainless steel) pipeline dedicated to transporting high-temperature, high-pressure fluids (crude oil, natural gas, or multiphase mixtures).
An annular gap between the inner and outer pipes is filled with advanced thermal insulation materials—such as high-performance polyurethane foam, aerogel blankets, or other composite insulating layers—to create an effective thermal barrier. In addition, porous media can be employed as insulating materials due to their favorable thermal characteristics and low weight [3,4]. Spacer blocks and centralizers are utilized to maintain concentricity and to isolate the inner and outer pipes. This composite configuration allows the heat of the transported fluid to be efficiently retained during operation (suppressing thermal losses), while the outer pipe’s rigidity and strength protect the system against various external hazards in the subsea environment [5,6]. The PIP configuration thus offers two primary advantages.
First, PIP systems greatly enhance insulation and thermal management. Subsea pipelines often carry oil and gas at elevated temperatures. If the flow is rapidly cooled by the surrounding seawater, its viscosity increases, and flow can be hindered; more critically, condensates, gas hydrates, or wax can precipitate on the pipe wall, eventually causing blockages. By incorporating closed-cell polymer foam (e.g., rigid polyurethane) or aerogel insulation into the annulus between the pipes, PIP systems significantly reduce heat loss to the environment. Some PIP designs further improve thermal performance by introducing vacuum-insulated sections in the annulus, thereby minimizing heat transfer. As a result, the fluid inside the inner pipe remains at a sufficiently high temperature—and thus stays free-flowing—significantly lowering the risk of wax or hydrate formation and reducing the maintenance costs associated with flow stability and performance.
Second, the double-layer PIP structure provides significant load-bearing and protective advantages. As the outer pipe carries the vast majority of external loads (such as high hydrostatic pressure, pore-water pressure in the seabed, and impacts from shifting seabed sands), the inner pipe can focus on withstanding internal pressure and thermal stresses. This separation of roles results in a lower probability of structural failure compared to a traditional single-pipe system. Even if the outer pipe suffers from local deformation or corrosion, it is unlikely to directly compromise the inner pipe; as long as the inner pipe remains intact and the insulation layer is not severely degraded, safe fluid transport can continue. Moreover, for long-distance pipelines deployed in deepwater, the combined stiffness and stability of the double-pipe structure help it accommodate local seabed movements and free spans, thereby preventing the occurrence of pipe-wall cracking or fatigue failure due to bending stress concentrations.
In contemporary offshore oil and gas field development, PIP systems have emerged as one of the mainstream technologies for deepwater production and transportation. They have been successfully deployed in several deepwater regions, including the North Sea, the Gulf of Mexico, offshore Brazil, and West Africa. Owing to their superior capabilities in thermal insulation, flow assurance, and resistance to external loads, PIP systems significantly extend the service life of subsea pipelines and reduce the frequency of subsea interventions and maintenance operations. Looking ahead, as offshore exploration advances toward ultra-deepwater and extremely cold environments, future PIP systems are expected to incorporate next-generation insulation materials of lower thermal conductivity, along with vacuum-based technologies and intelligent sensors. These innovations will enable real-time monitoring of temperature, stress, and corrosion within and outside the pipeline, thereby enhancing overall system safety and performance. Accordingly, marine PIP systems will continue to demonstrate their unique advantages in deep-sea oil and gas transportation, flow assurance, and integrated safety protection, offering reliable engineering solutions for global offshore energy development.
In terms of impact resistance, Qu, H. et al. [7] investigated the impact behavior of circular steel pipes and proposed a damage evaluation method suitable for steel pipe components with impact loads. Jones et al. [8] introduced a method for idealizing deformed pipe cross-sections and conducted a comprehensive analysis of their impact resistance. Zeinoddini et al. [9,10] performed extensive experimental studies on the lateral impact performance of steel pipes. In recent years, many researchers worldwide have adopted numerical simulation techniques to analyze local deformations in pipelines under transverse impact.
Regarding the buckling mechanisms and control measures of PIP systems, Karampour, H. et al. [11] investigated propagation buckling of subsea single pipes and PIP systems. Bruton et al. [12] utilized numerical simulations to show that effective axial force, initial geometric imperfections, and soil resistance are critical factors influencing lateral buckling. Goplen et al. [13] provided structural response analyses and proposed several criteria for global buckling in PIP systems. Kristoffersen et al. [14] applied finite element analysis to study the global buckling of a PIP system on an uneven seabed and presented a corresponding methodology along with the analysis results.
In the area of dynamic response, Nikoo et al. [15] simplified the inner and outer pipes of a PIP system as lumped masses and modeled the structure as a non-conventional tuned mass damper (TMD) system for dynamic analysis. Their studies incorporated MATLAB R2017a-based numerical solutions and simulations using ANSYS 17.0 and ABAQUS 2017 to investigate vortex-induced vibrations (VIVs) and their suppression. They further identified the effects of key structural and environmental parameters on pipeline vibration and proposed corresponding mitigation measures [16]. Bi et al. [17] developed a vibration control equation by introducing springs and dampers in the annular space between the inner and outer pipes. Fyrileiv et al. [18] pointed out that the natural frequency of free-spanning subsea pipelines is influenced by the effective axial force rather than the actual axial force. Liu et al. [19] established three-dimensional dynamic control equations for PIP systems and proposed a VIV suppression method.
Extensive research has been conducted on the thermal effects of deepwater PIP systems using analytical methods. Bokaian [20] derived a computational model for thermal stress at pipe ends under various loading conditions based on linear superposition, assuming simplified pipeline connections. Guo et al. [21] found that when thermal effects are considered, the stability of PIP systems is superior to that of single-wall pipelines. Paul et al. [22] proposed an optimized thermal design method for PIP systems based on heat conduction theory. Kim et al. [23] developed a leakage detection method based on a threshold value of temperature difference. Moawed et al. [24] presented an analysis of the heat transfer mechanism for fluid flow inside the inner pipe. Jian Su [25,26,27] analyzed transient thermal conduction during flow initiation and shutdown in multi-layer pipelines and provided the fluid temperature profiles along the pipeline for these processes.
However, finite element simulations that accurately reflect real-world deep-sea conditions—particularly the thermal effects on PIP systems under non-uniform temperature fields—are still lacking; thus, further investigation is warranted. An improved deepwater PIP model is developed by introducing ITT (Interface Thermal Transfer) elements and nonlinear spring elements in the paper. The temperature-induced effects under non-uniform thermal fields are comprehensively simulated, and the resulting stress distribution characteristics under combined internal pressure and thermal loading are clarified. Unlike previous analytical and numerical studies on PIP systems, which typically analyze thermal and pressure effects in isolation, a mechanical response model capturing the differential deformation behavior between the inner and outer pipes is established. The unified mechanical model fully couples temperature-induced stresses and internal pressure loads in double-layer subsea pipelines. The formulation captures the mutual axial stress interaction between inner and outer pipes under extreme thermal expansion and contraction, enabling more realistic stress predictions for high-temperature, high-pressure operating conditions. Furthermore, the model achieves prediction errors within approximately 5% compared with high-fidelity finite element simulations, ensuring both computational efficiency and engineering accuracy. These advancements make the proposed approach a significant improvement over existing models, offering new insights into safe and cost-effective PIP design.

2. Finite Element Modeling of the PIP System

2.1. Element Selection

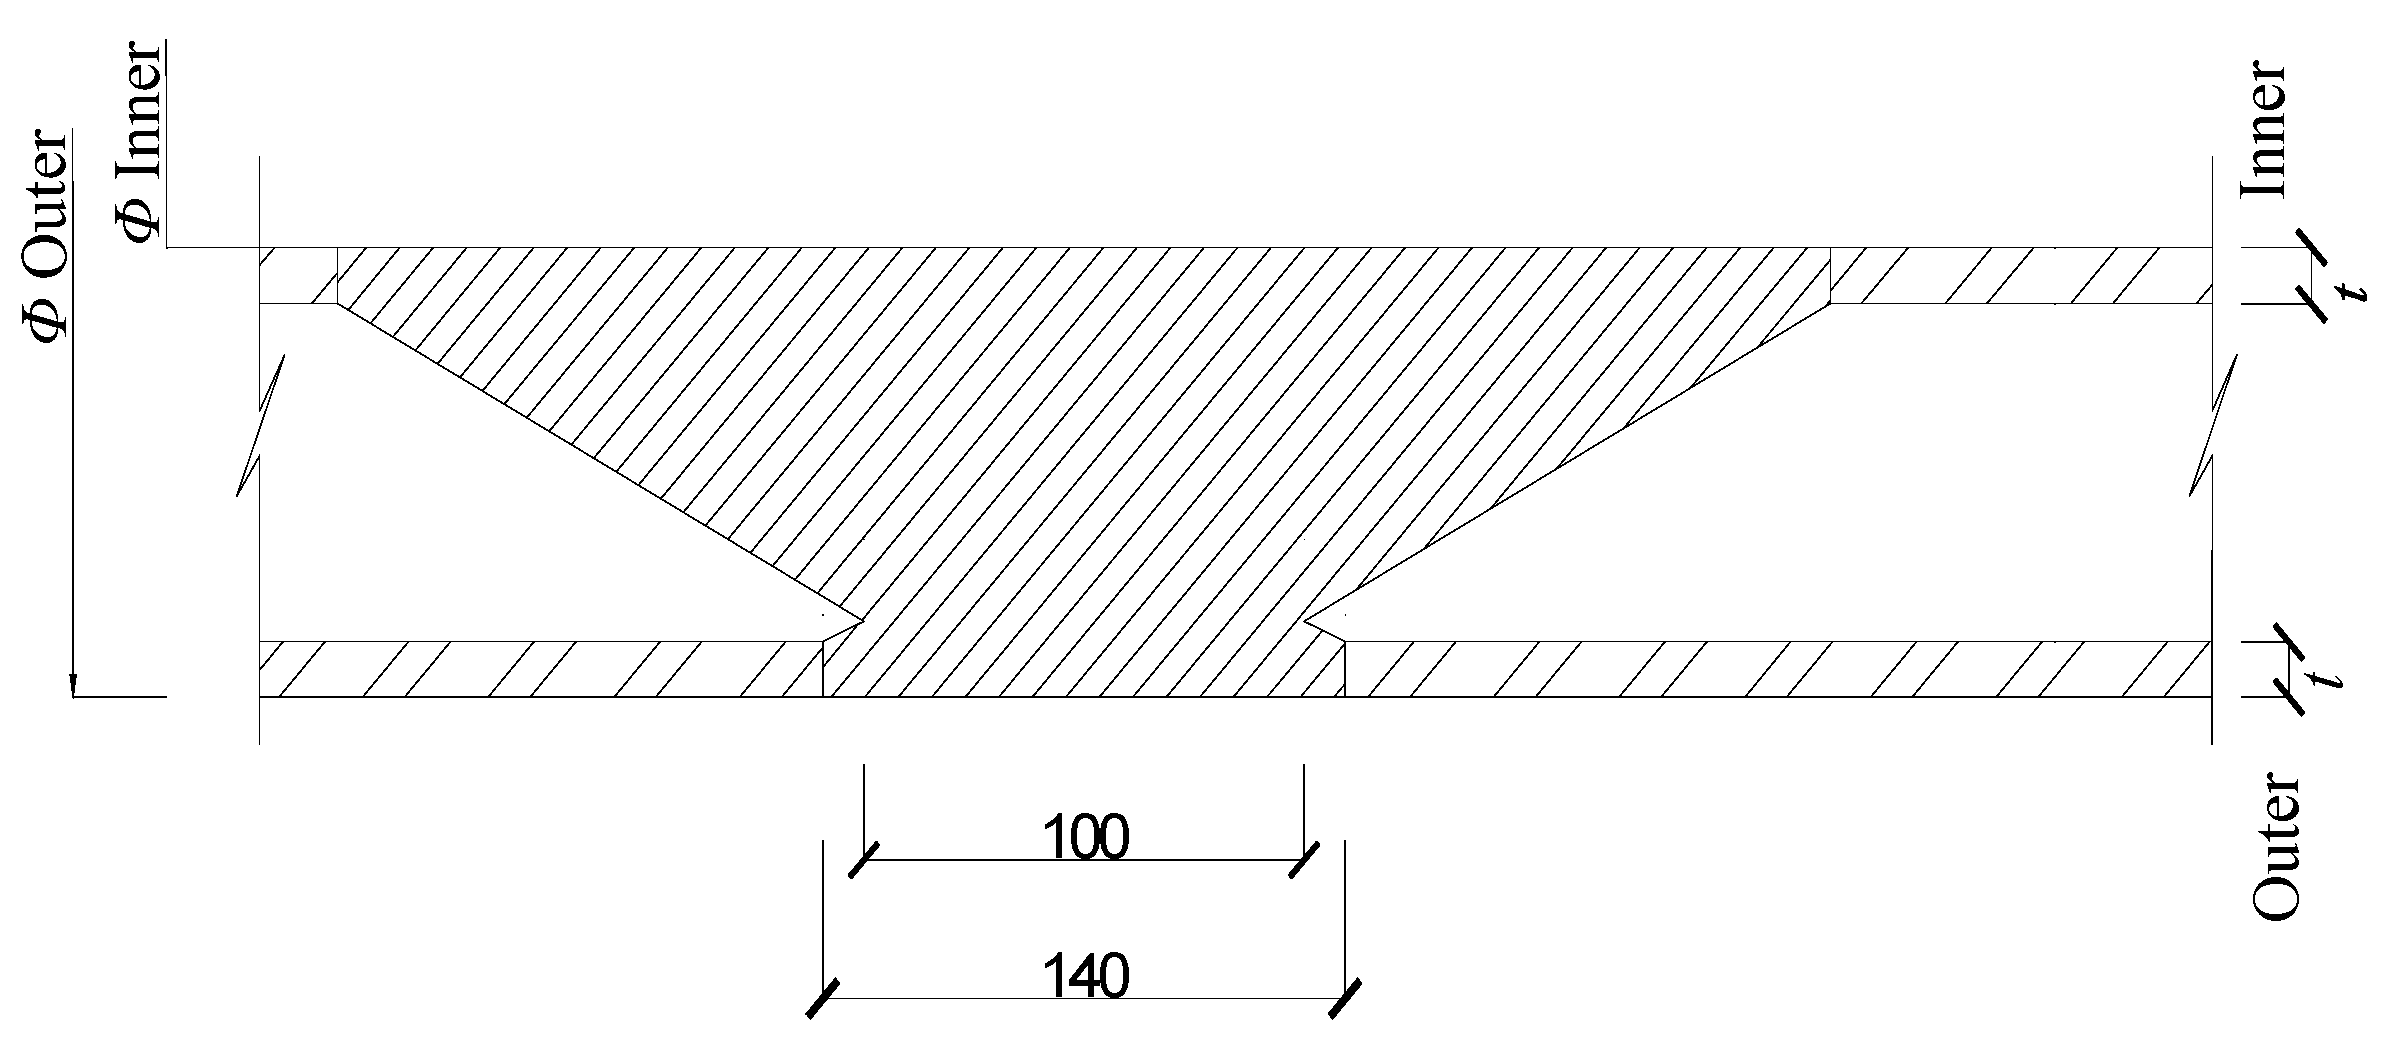
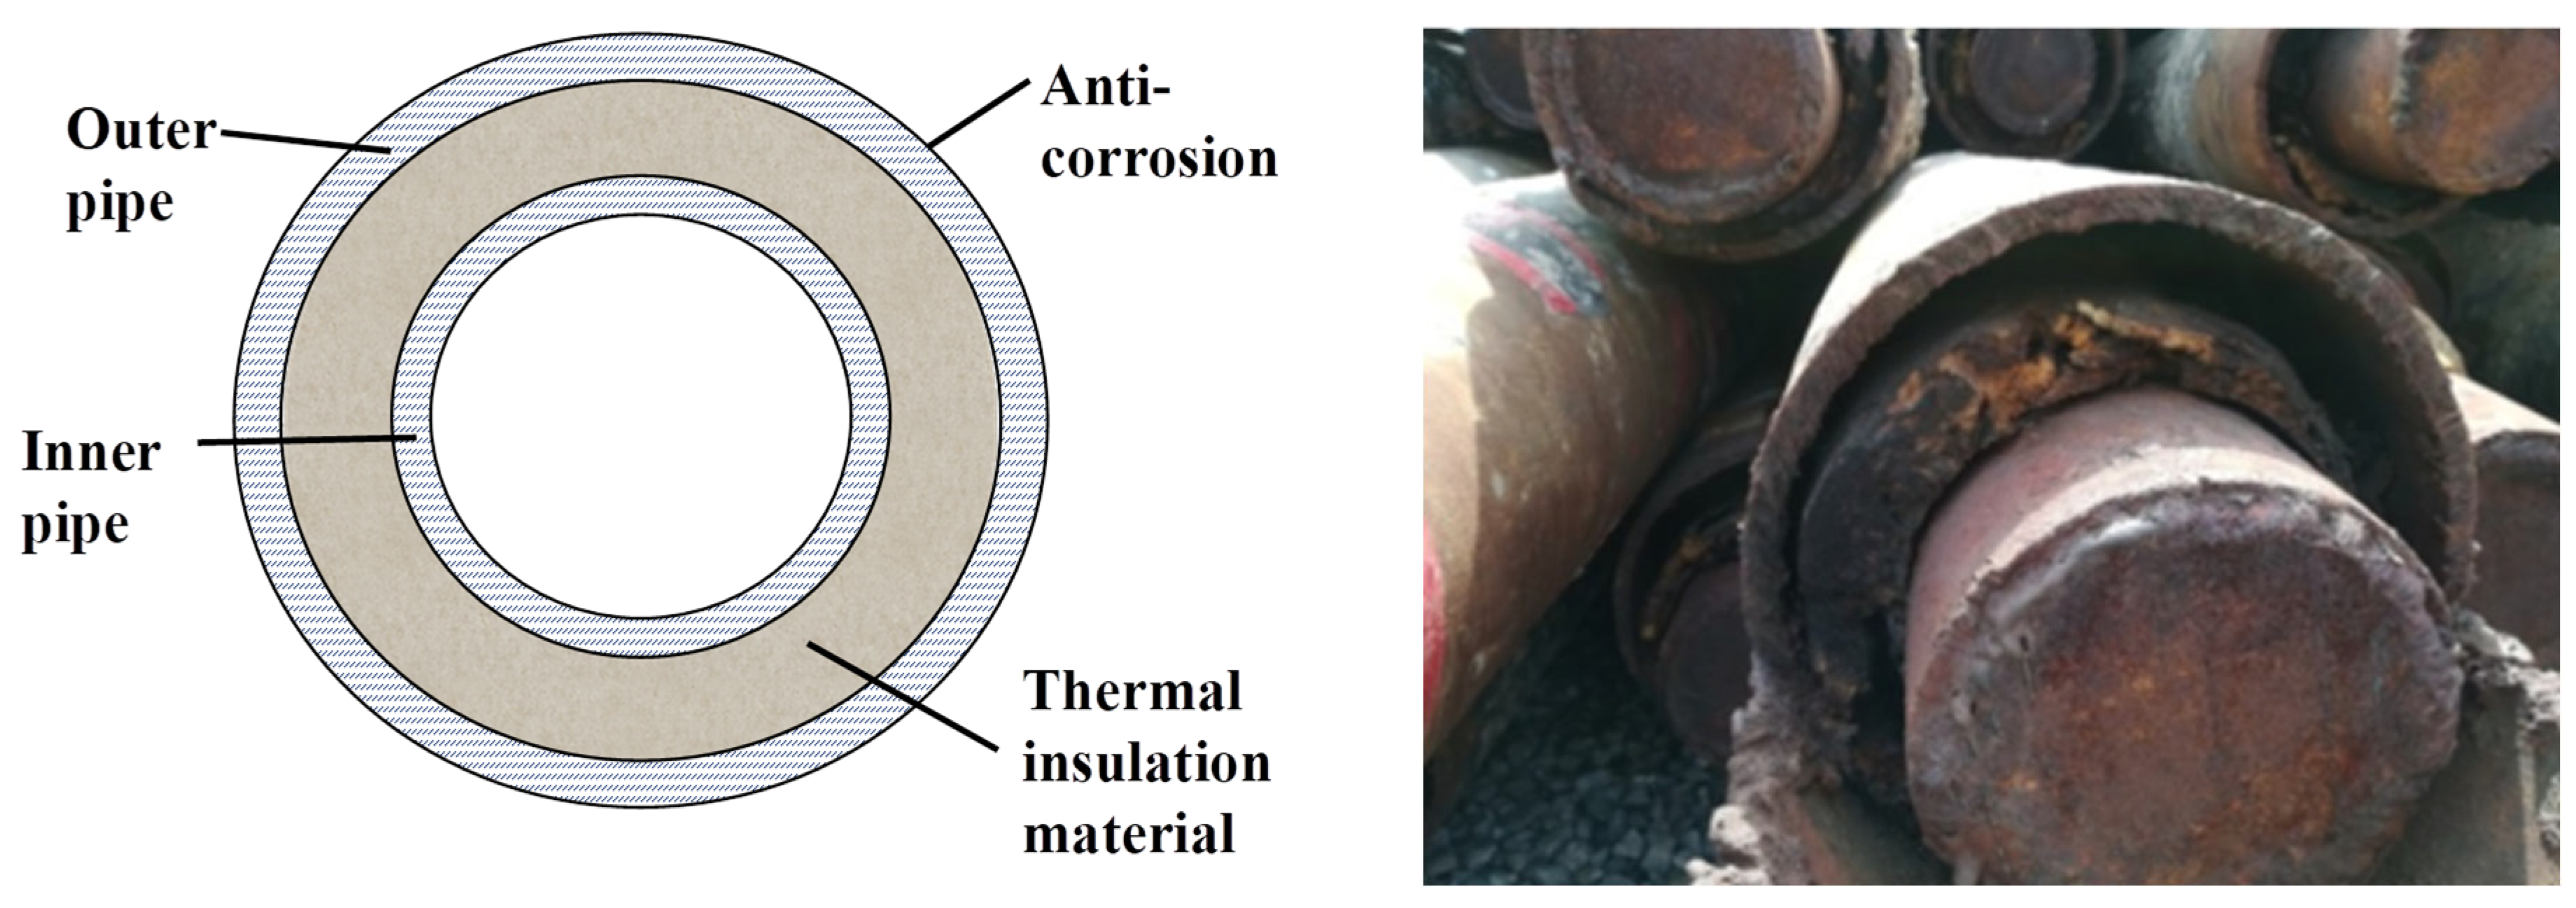
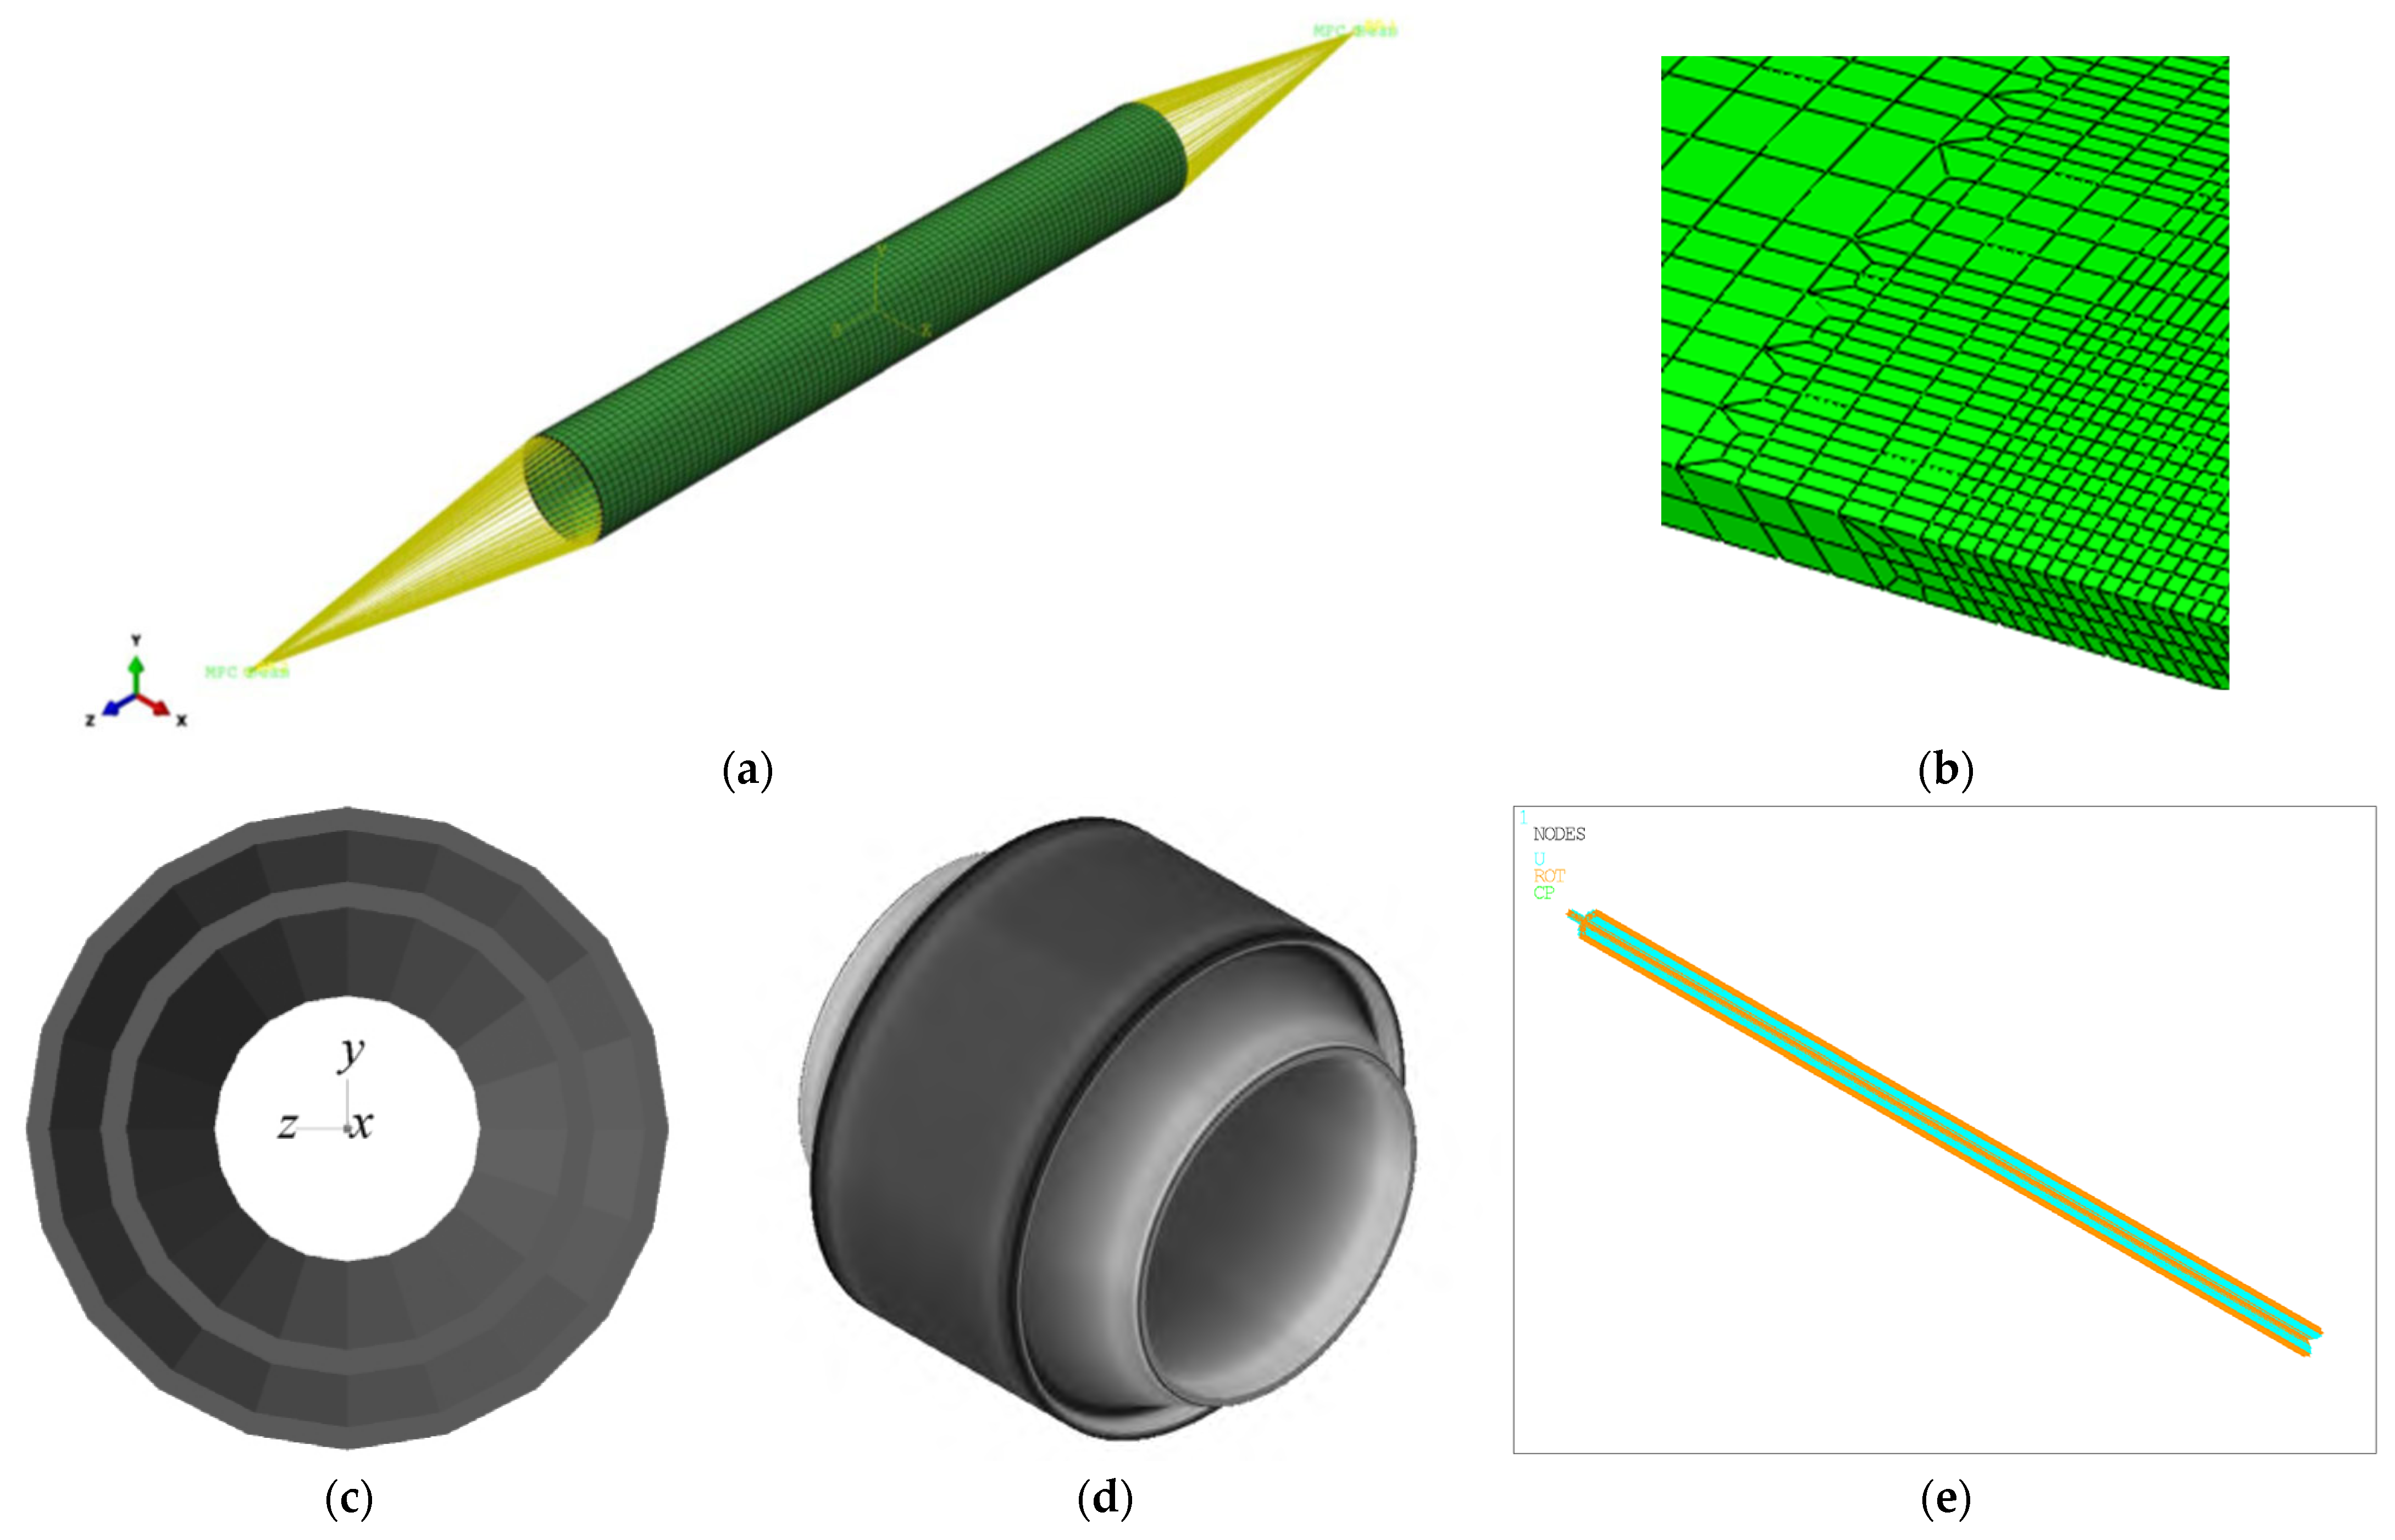
The composition of PIP is shown in Figure 1. The finite element analysis was performed with the ABAQUS 2025 software package. Due to the substantial length of deep-sea PIP systems, where the axial dimension significantly exceeds the radial and circumferential dimensions, PIPE 31 elements were used to model the pipeline, as shown in Figure 2. In accordance with the structural configuration of deep-sea PIP systems, centralizers (i.e., rigid spacers between the inner and outer pipes, as shown in Figure 3 and Figure 4) were incorporated between the two pipes. The model used PIPE31 beam elements, with a total of 42,500 elements, including 3 prism layers to accurately capture radial gradients.
These centralizers play a crucial role in maintaining the mechanical coupling between the inner and outer pipes, and their interaction must be accurately represented in the finite element model. ITT31 interface elements were introduced via an ABAQUS input script to simulate the contact behavior between the inner and outer pipes. Each ITT31 element consists of two nodes: one attached to the inner pipe’s inner surface and the other to the outer pipe’s inner surface. This configuration enables a realistic representation of the contact interface and captures the structural interdependence between the two concentric pipes.
The contact between the inner and outer pipes was modeled using nonlinear spring elements with a bilinear force–displacement relationship. The initial (elastic) stiffness was determined from the elastic modulus and thickness of the insulation layer, representing the compliant behavior under small deformations. Beyond a specified displacement threshold, the secondary stiffness was reduced to simulate the progressive softening effect of insulation materials or the presence of air gaps. The stiffness parameters were calibrated through preliminary numerical tests and reference to experimental data from PIP systems, ensuring that the contact behavior realistically reproduced both insulation compression and potential gap closure under combined thermal and pressure loading.
The novelty of this work lies in the integration of ITT elements and nonlinear spring contact modeling to simulate realistic inner–outer pipe interaction under non-uniform thermal fields, improving prediction accuracy for coupled stress behavior compared to conventional FEM approaches.

2.2. Boundary Conditions

In the simulation of boundary conditions, axial displacement due to thermal loading was considered, as it induces frictional interaction between the pipeline and the seabed. A bilinear friction model was adopted to represent the axial pipe-soil interaction [28]. To capture displacement variations along the pipeline’s axial direction, symmetry boundary conditions were applied at the model’s mid-span (centerline). The ambient deep-sea temperature was assumed constant, and a fixed-temperature boundary condition was applied to the outer pipe’s external surface.
To represent the frictional interaction between the PIP system and the rigid seabed, nonlinear spring elements were employed in lieu of conventional hard-contact constraints. Each such spring element consists of two nodes: one attached to the outer pipe’s exterior surface and the other to the seabed. By defining a nonlinear force-displacement relationship for these elements, the model captures the complex pipe-soil interaction behavior under axial thermal loads [29,30,31].
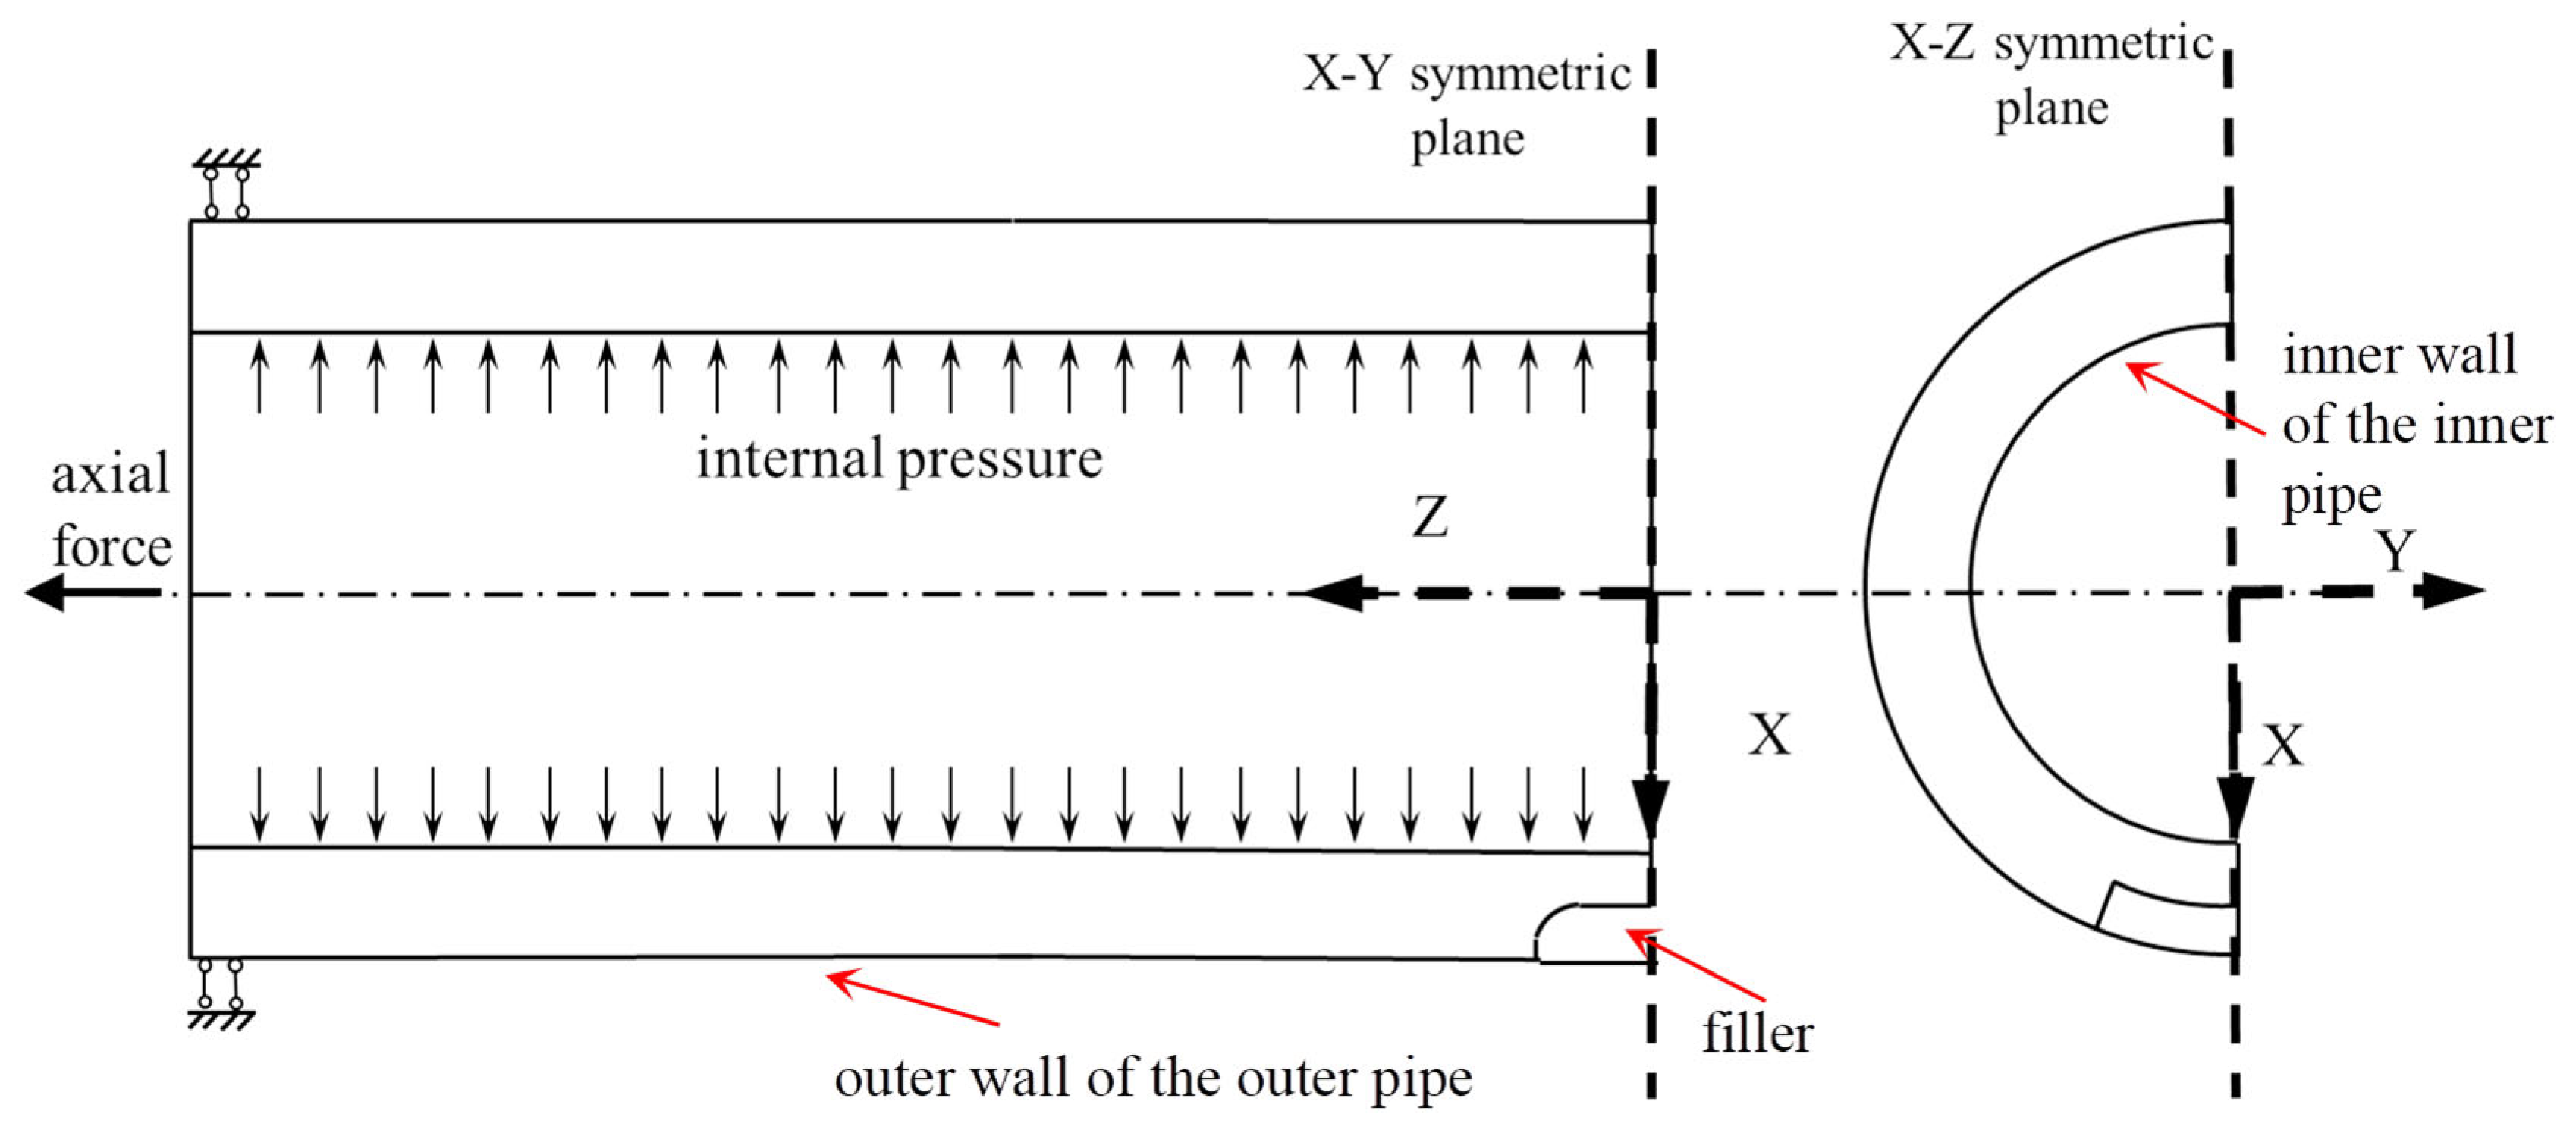
Symmetrical displacement boundary conditions are adopted on the X-Y plane and the X-Z plane. The displacement of the nodes on the end section in the X and Y directions is restricted, and the pipe end is only allowed to move in the Z direction. All boundary conditions are shown in Figure 5.

2.3. Mesh Sensitivity Analysis

The numerical results for various mesh densities are presented in Table 1, where the element dimensions range from 200 × 2 mm in the coarsest configuration to 0.1 × 0.1 mm in the finest configuration. The corresponding maximum stresses decreased monotonically from 245 MPa for the coarsest mesh to 190 MPa at an element size of 10 × 0.75 mm, indicating a significant reduction in numerical error with progressive refinement.
To assess convergence, the absolute and relative differences in maximum stress between successive mesh refinements were calculated. For coarse meshes (200 × 2 mm to 10 × 0.75 mm), relative differences were in the range of approximately 5–7%, demonstrating that the solution was still sensitive to mesh density in this range. However, refining the mesh from 10 × 0.75 mm to 0.75 × 0.5 mm resulted in a smaller change of only 6 MPa, corresponding to a relative difference of 3.16%. Further refinement beyond 0.75 × 0.5 mm, down to 0.1 × 0.1 mm, yielded identical stress values of 184 MPa, indicating that the FE model had reached a mesh-independent state.
Based on these results, the element size of 0.75 × 0.5 mm was selected for the final simulations. This choice ensures that the numerical solution lies within the convergence zone, as further refinement does not alter the computed maximum stress, while also avoiding the unnecessary computational cost associated with excessively fine meshes. The selected mesh provides a balance between numerical accuracy and computational efficiency, satisfying the mesh convergence criterion typically adopted in finite element analysis for engineering applications.

3. Thermal Effects Analysis of Pipe-in-Pipe Systems

This section aims to validate the accuracy of the finite element model by comparing theoretical calculations and numerical simulations of axial stress and axial displacement. Two representative PIP systems of different lengths—11,000 m (long pipeline) and 6000 m (short pipeline)—are analyzed, each under different end anchoring conditions.

3.1. Model Parameters

Both the inner and outer pipes are made of 16 Mn steel. The material properties include a Young’s modulus of 2.07 × 10¹¹ N/m2, density of 7850 kg/m3, thermal expansion coefficient of 1.17 × 10⁻⁵/°C, and Poisson’s ratio of 0.3. The main geometric and mechanical parameters are listed in Table 2. Constant mechanical properties were adopted for all simulations. This choice is justified by the relatively narrow temperature variation range in deepwater service conditions (approximately −18~65 °C), within which the temperature-induced variation in steel properties such as Young’s modulus and yield strength is minimal [32,33]. Neglecting such minor variations does not significantly affect stress distribution analysis in steel pipelines. Therefore, the use of constant properties provides a reasonable simplification that allows for clearer focus on the combined effects of internal pressure and temperature-induced expansion.

3.2. Analytical Formula

The analytical formula proposed by Bokaian [20] is derived based on several simplifications, particularly regarding the structural interaction between the inner and outer pipes. It omits considerations such as non-uniform temperature fields and inner–outer pipe contact mechanics, which limits its applicability and precision in practical scenarios.
The thermal stress in PIP systems is primarily governed by parameters such as the self-weight of the inner and outer pipes, axial stiffness, pipe length, seabed friction, interfacial friction, and thermal expansion properties of the pipe material.
In this section, the inner and outer pipes are denoted by subscripts p and c, respectively. The axial equilibrium at the pipeline anchor ends is expressed by the following linear superposition of six axial force components [20]:
NT,p + Nv,pNE + Fs + Nδ + Nc = 0
where NT,p is the axial thermal force in the inner pipe due to temperature increase, Nv,p is the axial force induced by Poisson’s effect, NE is the end force arising from anchoring and external pressure effects, Fs is the frictional resistance from the seabed, Nδ is the axial force due to inner pipe displacement, and Nc is the tensile force in the outer pipe. These components collectively maintain force equilibrium at the pipe anchor locations.

3.3. Comparison of Numerical and Theoretical Results

A uniform temperature field of 58 °C was applied in the finite element simulations performed using ABAQUS. The theoretical calculation followed Bokaian’s analytical model [20], assuming uniform axial stiffness, constant friction coefficient, and fixed end constraints. The resulting thermal responses—namely axial displacement and axial force—were compared with analytical solutions for both long and short PIP systems. As shown in Table 3, the relative errors are within approximately 1%, confirming the validity and accuracy of the finite element model.

4. Mechanical Response of Pipe-in-Pipe Systems Coupled with Differential Deformation and Internal Pressure

4.1. Equivalent Stress Analysis with Expansion of Inner Ppipe

As the primary conduit for fluid transport, the inner pipe experiences significant thermal stresses induced by temperature variations along the flow direction. As the pipeline is first commissioned or restarted after a prolonged shutdown, the inner pipe is subjected to internal pressure as well as thermal loads from the transported fluid. Simultaneously, the outer pipe constrains the deformation of the inner pipe, resulting in a coupled mechanical response through reactive forces. The operating conditions are presented in Table 4.
The pipeline is designed for a normal operating pressure of 4.0 MPa, with a restart pressure of 6.0 MPa. During startup, the internal pressure is set to 6 MPa. The fluid temperature is assumed to be 65 °C at the inlet and 40 °C at the outlet. Considering the dominant influence of ambient temperature on the inner pipe’s thermal boundary, an Extreme Condition I scenario is defined using the lowest recorded seawater temperature in the region (−18 °C). This yields a maximum temperature differential of 83 °C, resulting in pronounced thermal expansion of the inner pipe.
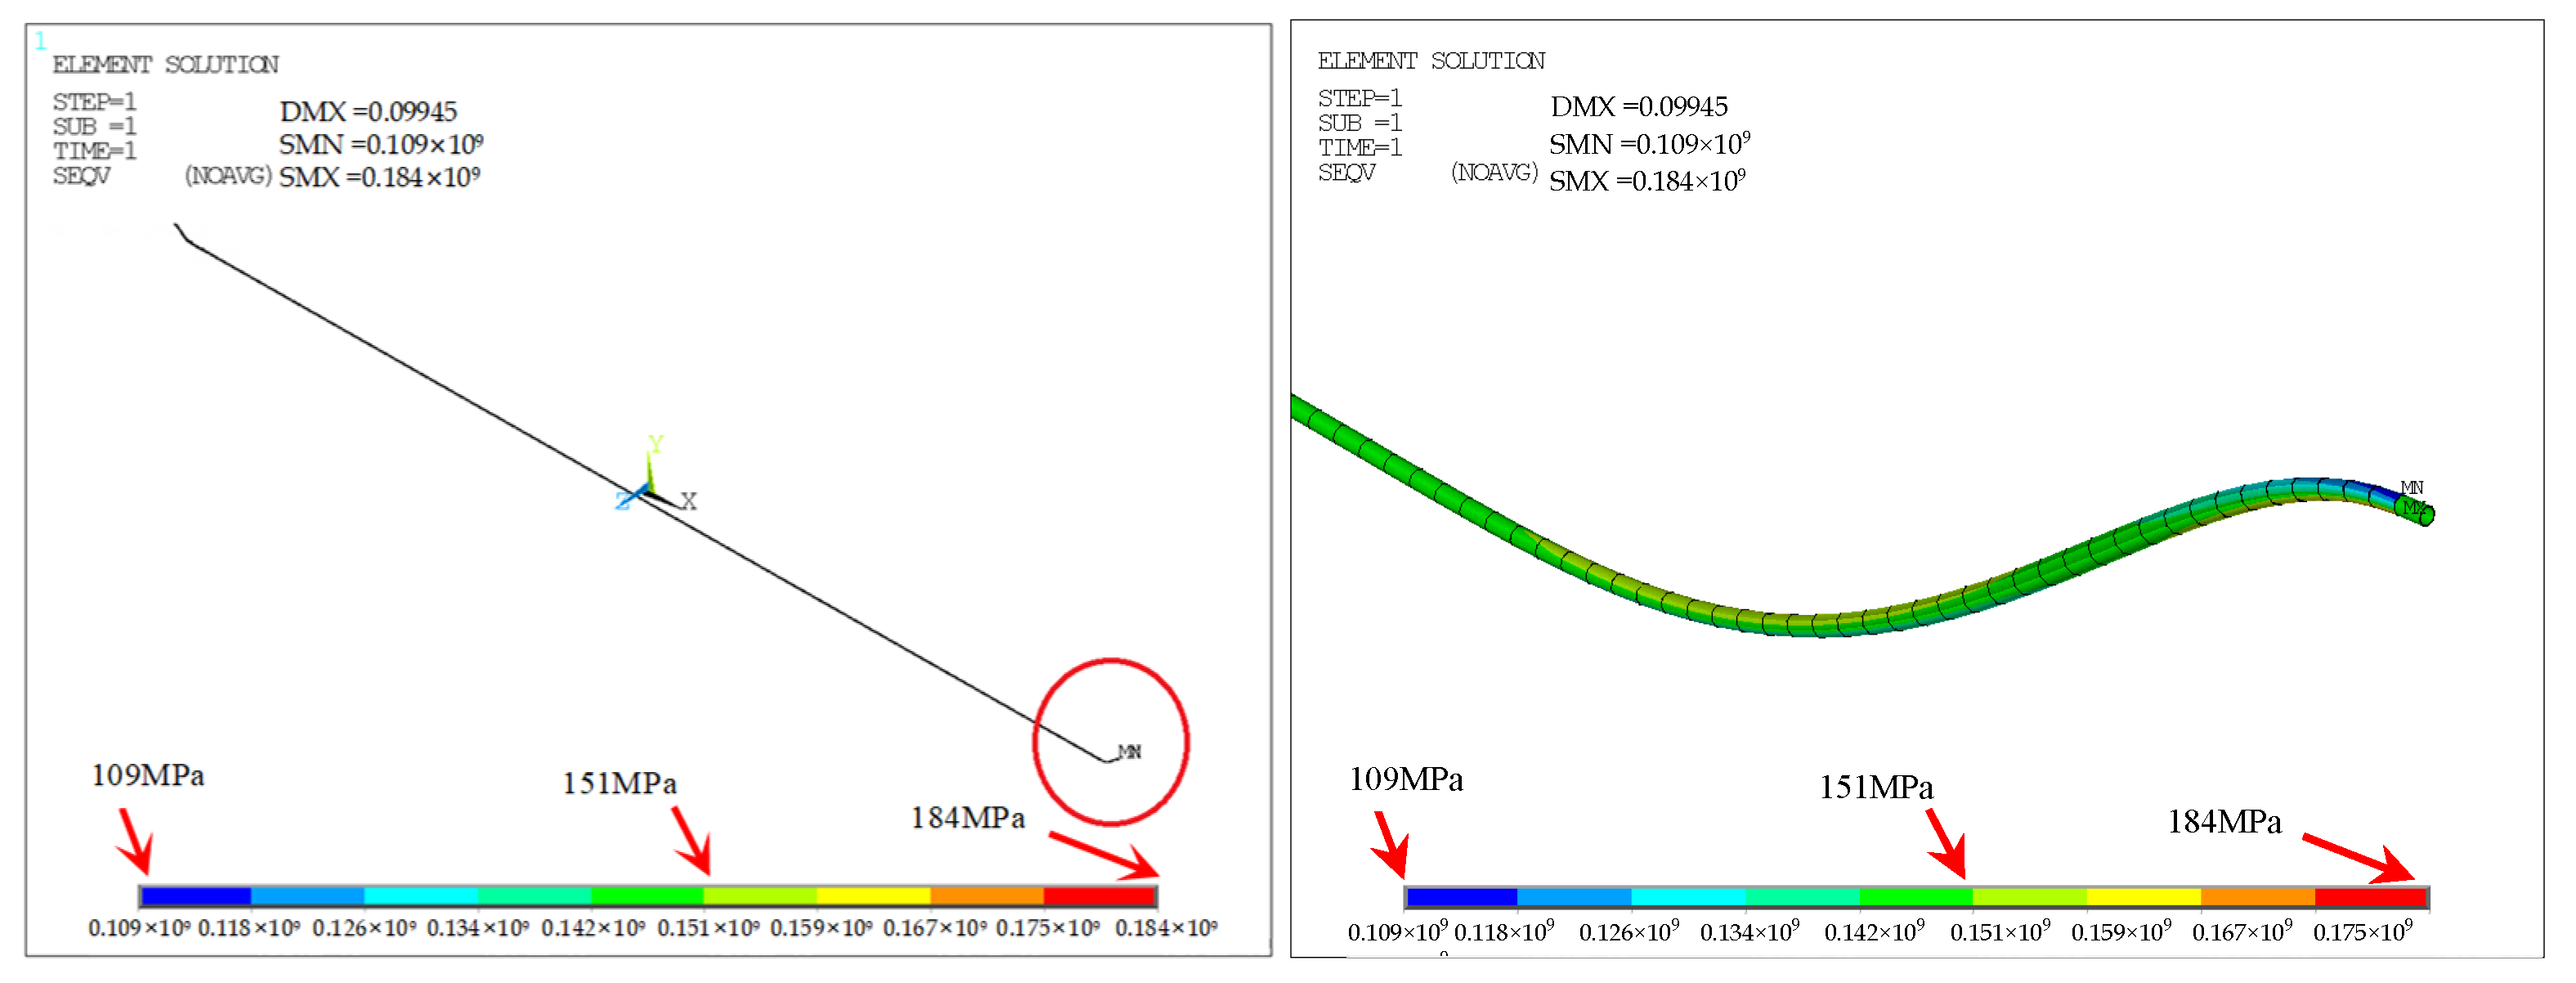
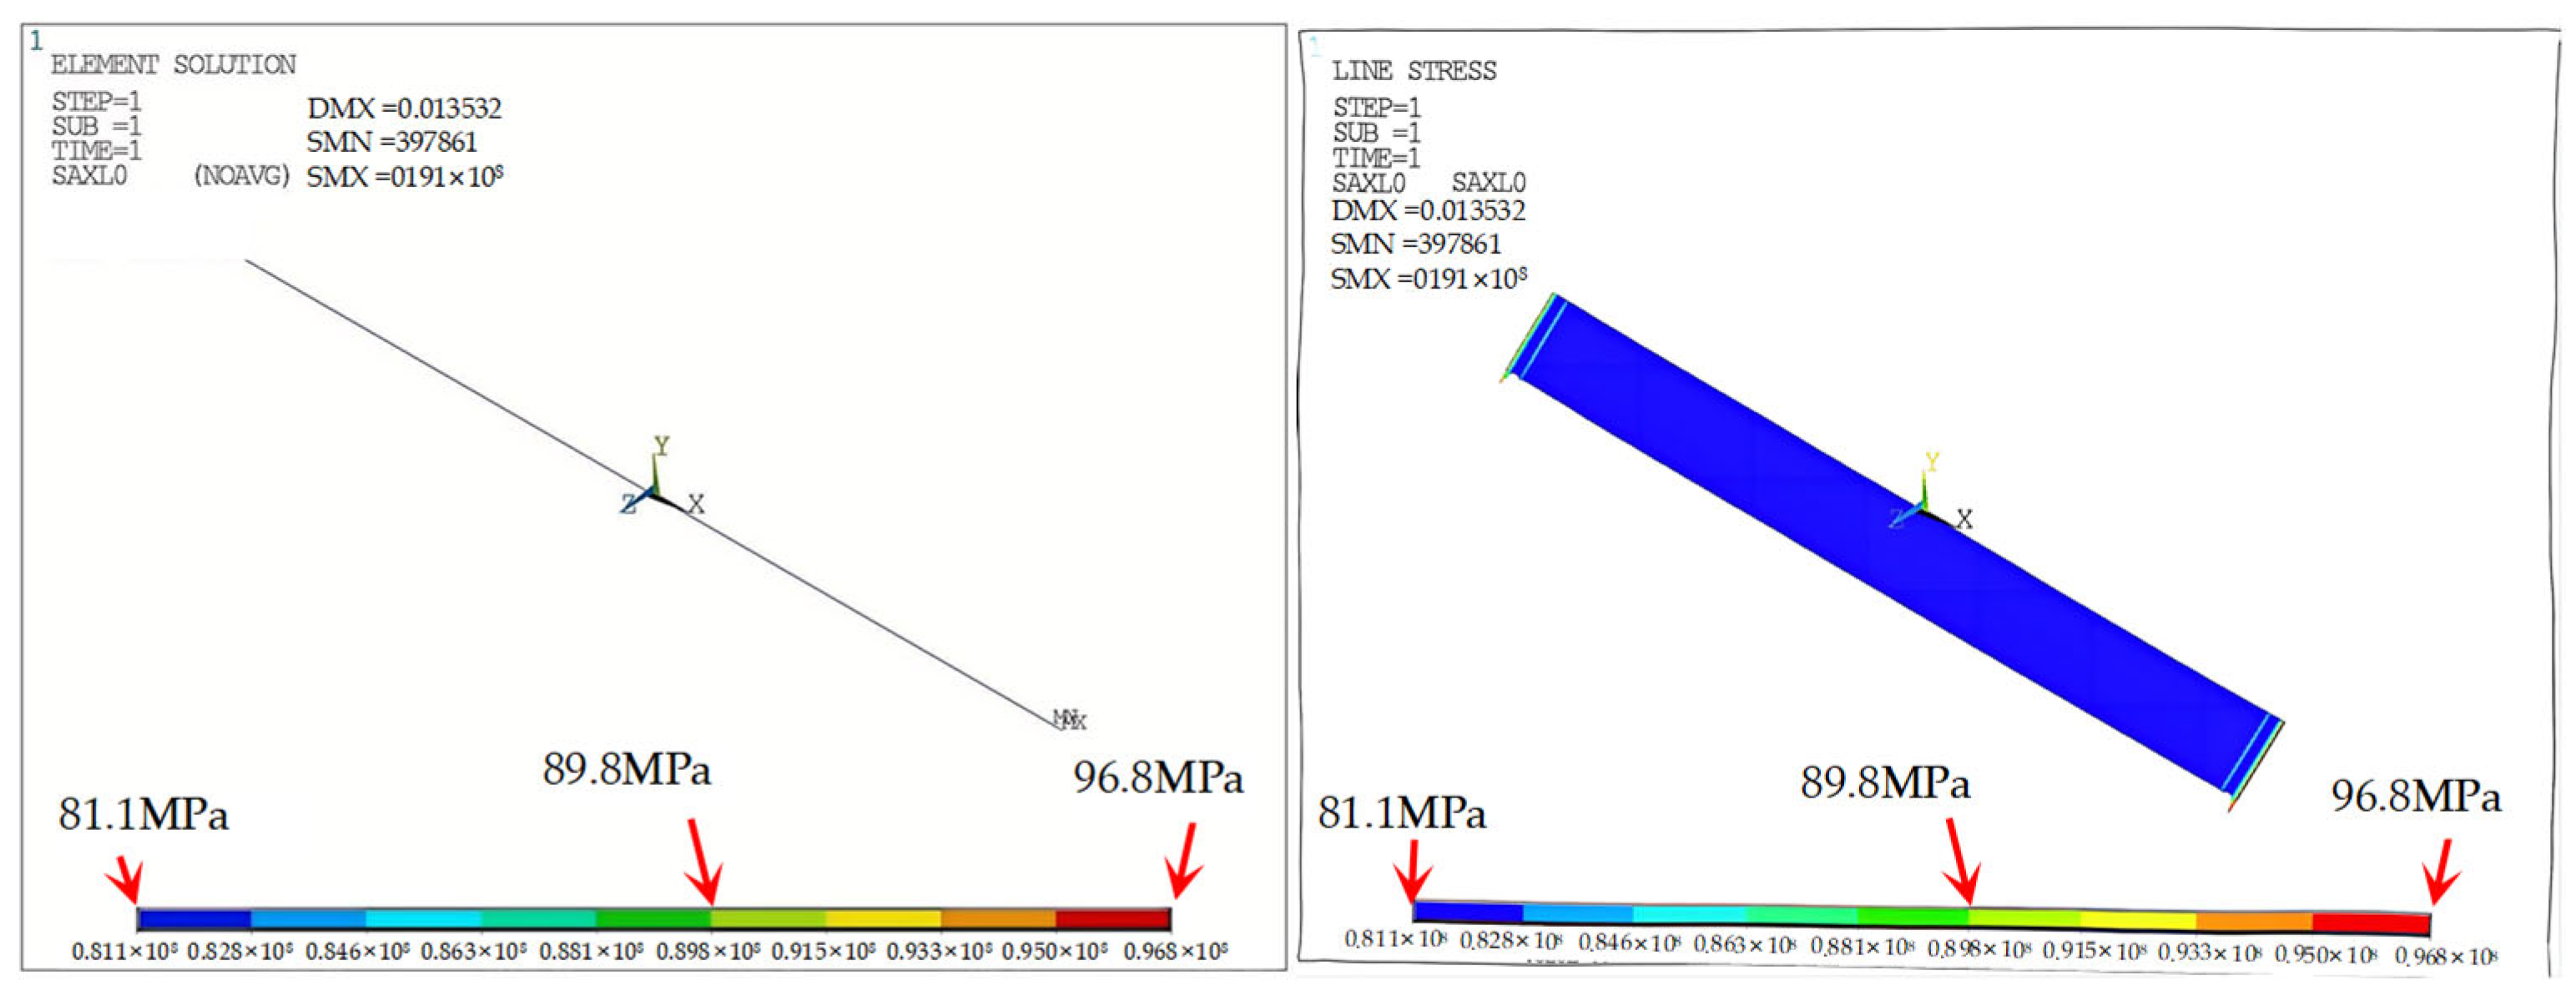
Figure 6 illustrates the equivalent stress distribution in the inner pipe under Extreme Condition I. As temperature-induced expansion occurs, the internal pressure simultaneously introduces axial and circumferential tensile stresses. The inner pipe is rigidly connected to the outer pipe at both ends via forged joints. Consequently, the thermally induced displacements at the pipe ends, which would otherwise move away from the pipe center, are constrained by the outer pipe. Ideally, this would result in a bow-shaped deformation; however, due to radial confinement by the outer pipe wall, only the coupling regions at the pipe ends experience direct mechanical interaction. The remaining sections of the inner pipe are allowed to deform freely into the annular gap, resulting in a bowl-shaped displacement pattern as depicted in the simulation.
With the combined effect of thermal stress and internal pressure, the equivalent stress throughout most of the inner pipe—excluding the ends—ranges from 142 MPa to 151 MPa. The peak stress concentrations occur at the pipe ends: a maximum of 184 MPa is observed at the “−y” direction (bottom of the pipe end), while the minimum is 109 MPa in the “+y” direction (top of the pipe end), indicating asymmetric stress distribution.
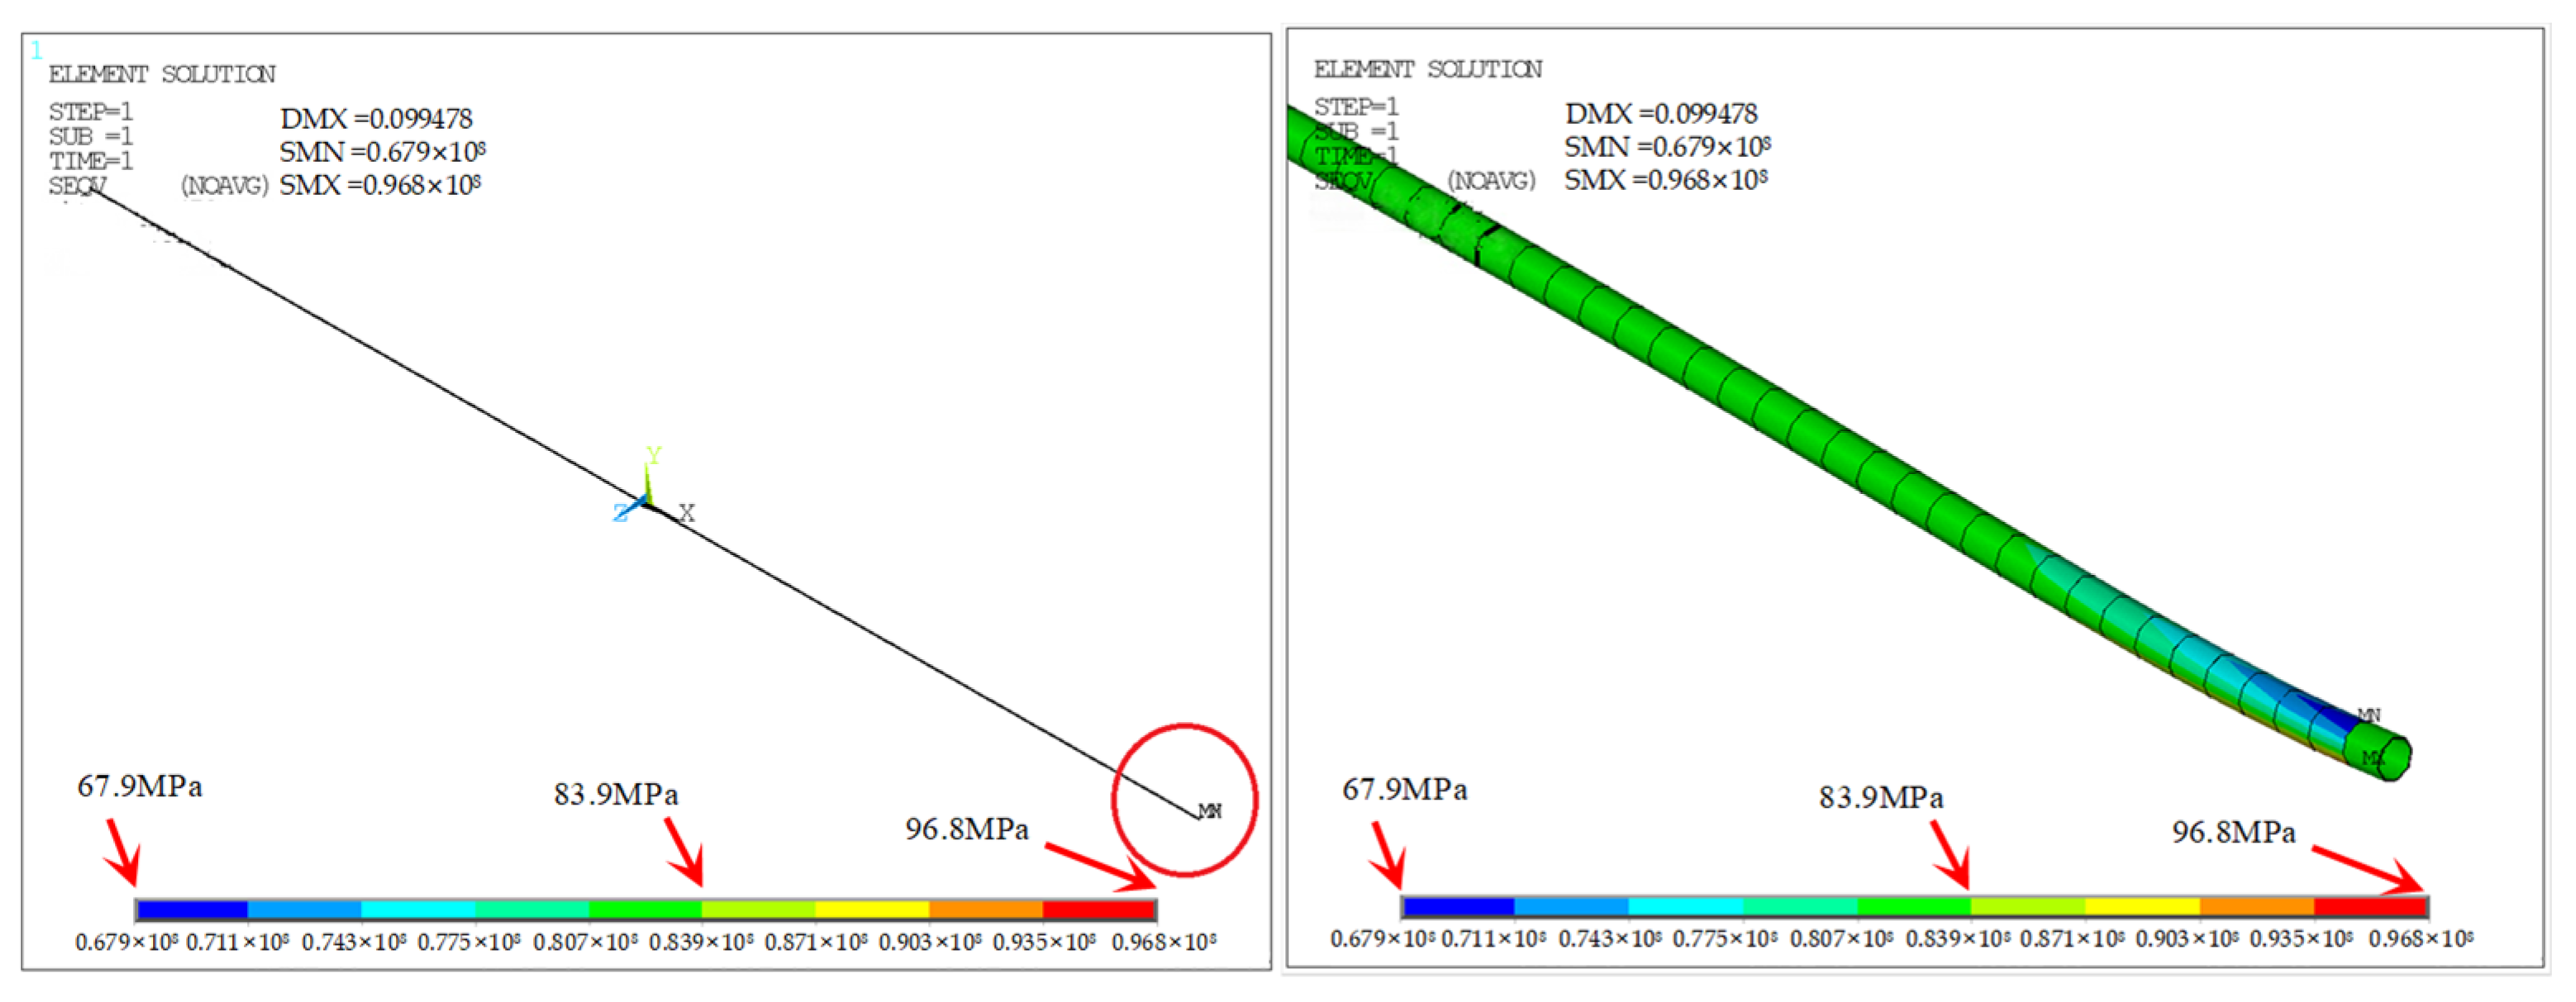
Figure 7 presents the equivalent stress distribution in the outer pipe under the same extreme condition. The deformation of the inner pipe, caused by both thermal and pressure loads, transmits force to the outer pipe at the end joints, thereby inducing stress in the outer structure. In most regions of the outer pipe body, the equivalent stress ranges between 80.7 MPa and 83.9 MPa. However, pronounced stress gradients appear near the ends due to the reactive forces exerted by the inner pipe. At the bottom of the pipe end (“−y” direction), the maximum stress reaches 96.8 MPa, while at the top of the pipe end (“+y” direction), the minimum stress drops to 67.9 MPa.

4.2. Equivalent Stress Analysis with Contraction of Inner Pipe

After offshore pipeline installation, hydrostatic and pressure testing is typically required to verify pipeline integrity. During such tests, the pipeline is filled with a pressurizing medium under internal load. Since the temperature of the test medium is significantly lower than that of the surrounding seawater, thermal contraction of the inner pipe occurs, resulting in structural deformation. Water is commonly used as the testing fluid, typically pressurized to 1.25 times the design pressure, which corresponds to 5 MPa in this case. For the second extreme condition, December is selected due to the largest observed temperature differential, with an ambient seabed temperature of 18.6 °C and test water temperature of −5 °C, yielding a thermal gradient of −23.6 °C (which is defined as Extreme Condition II).
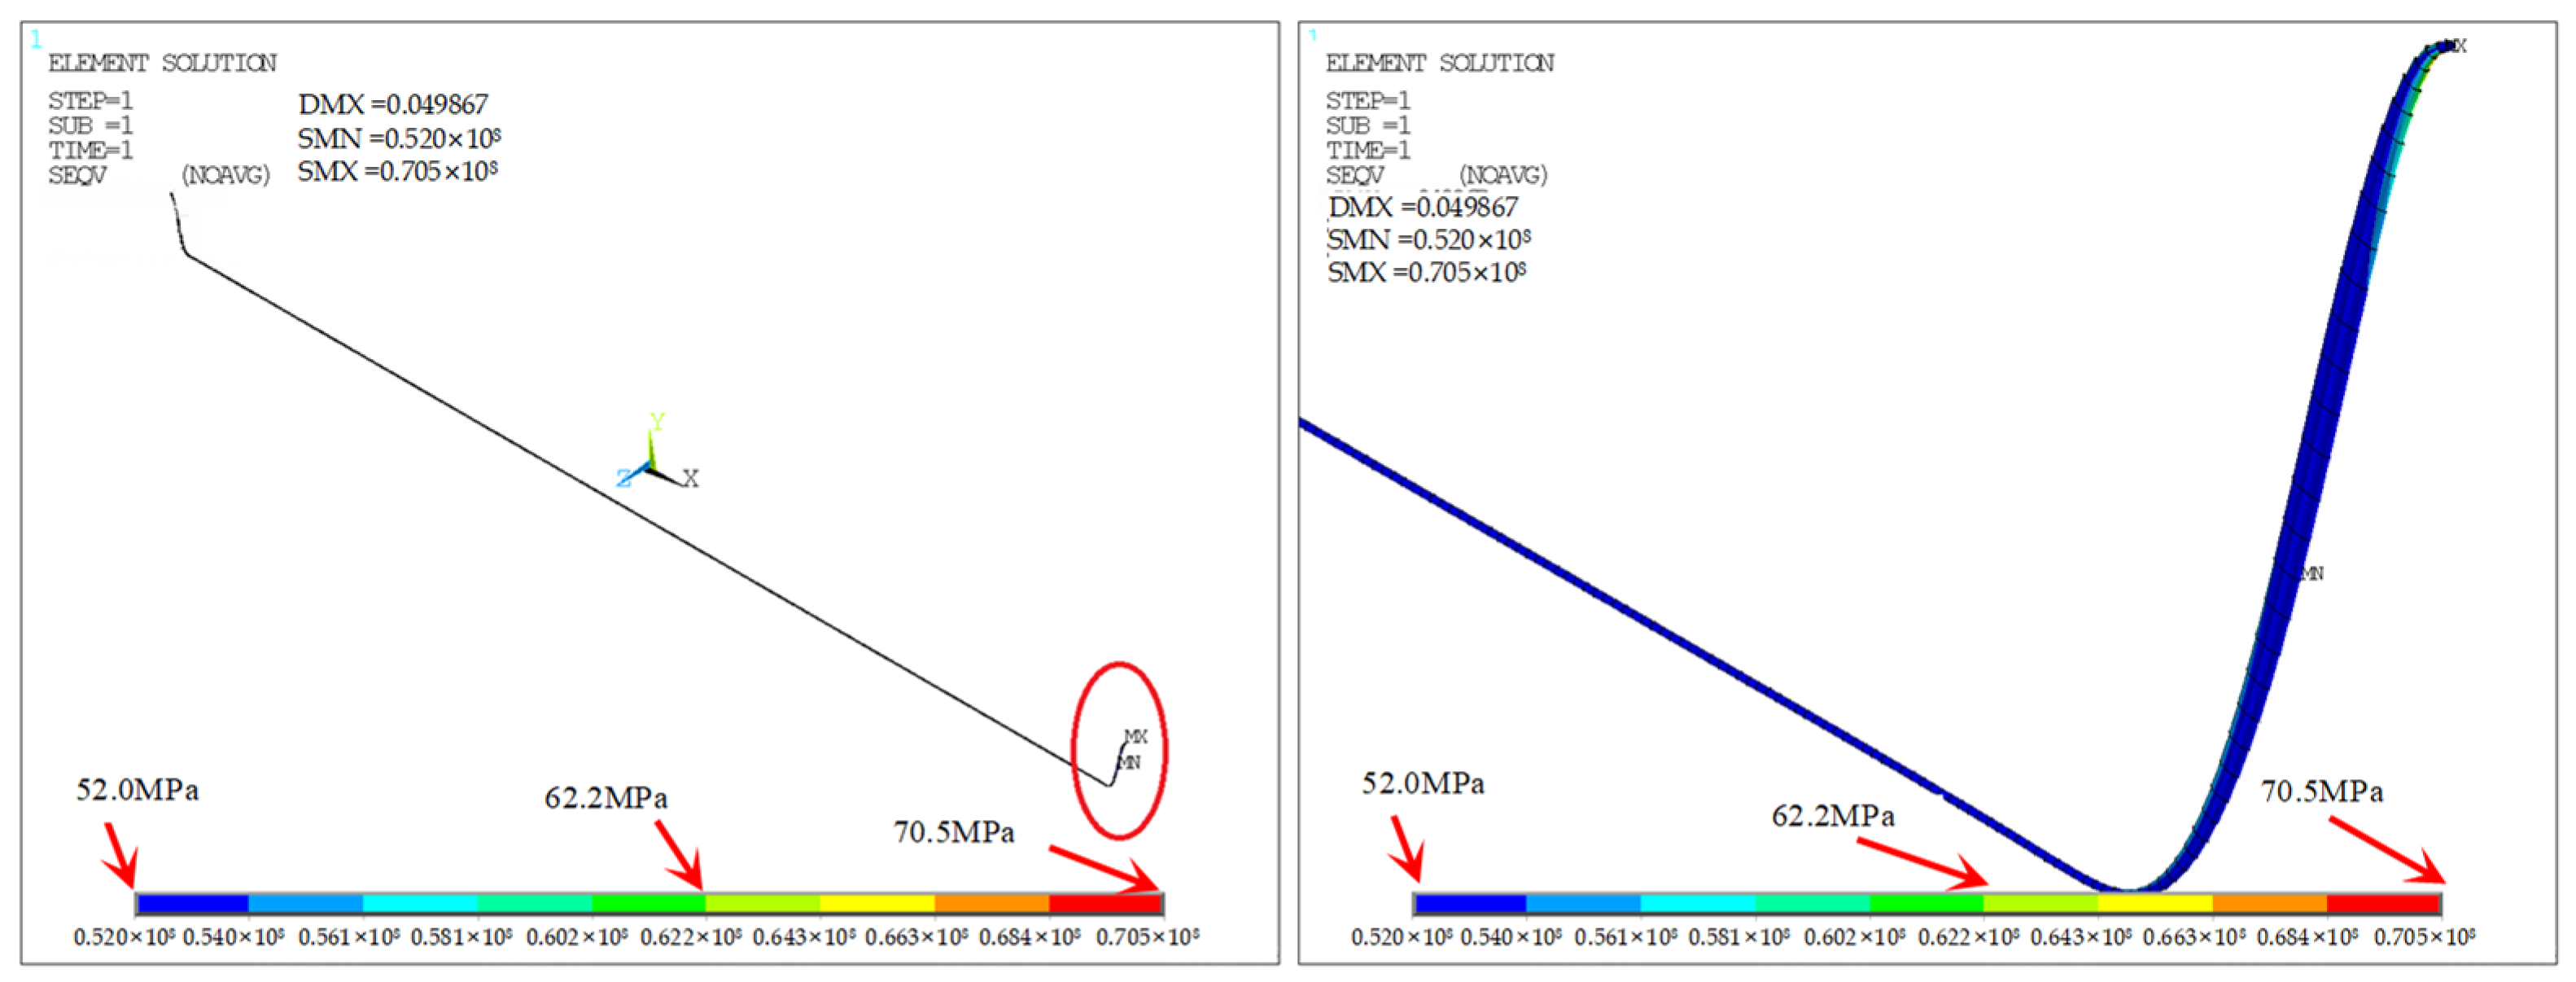
Figure 8 illustrates the equivalent stress distribution in the inner pipe under this thermal contraction scenario. As the inner pipe contracts due to temperature-induced shrinkage, internal pressure concurrently induces axial and circumferential tensile stresses. Additionally, the inner pipe exhibits vertical displacement due to gravitational forces, resulting in a bowl-shaped deformation similar to that described previously. Under the combined action of thermal and internal pressure loads, most regions of the inner pipe (excluding the end sections) experience stress in the range of 52 MPa to 54 MPa. Stress concentrations occur at the pipe ends, with the minimum equivalent stress reaching 52 MPa in the “−y” direction (bottom of the pipe end) and a maximum of 70.5 MPa in the “+y” direction (top of the pipe end).
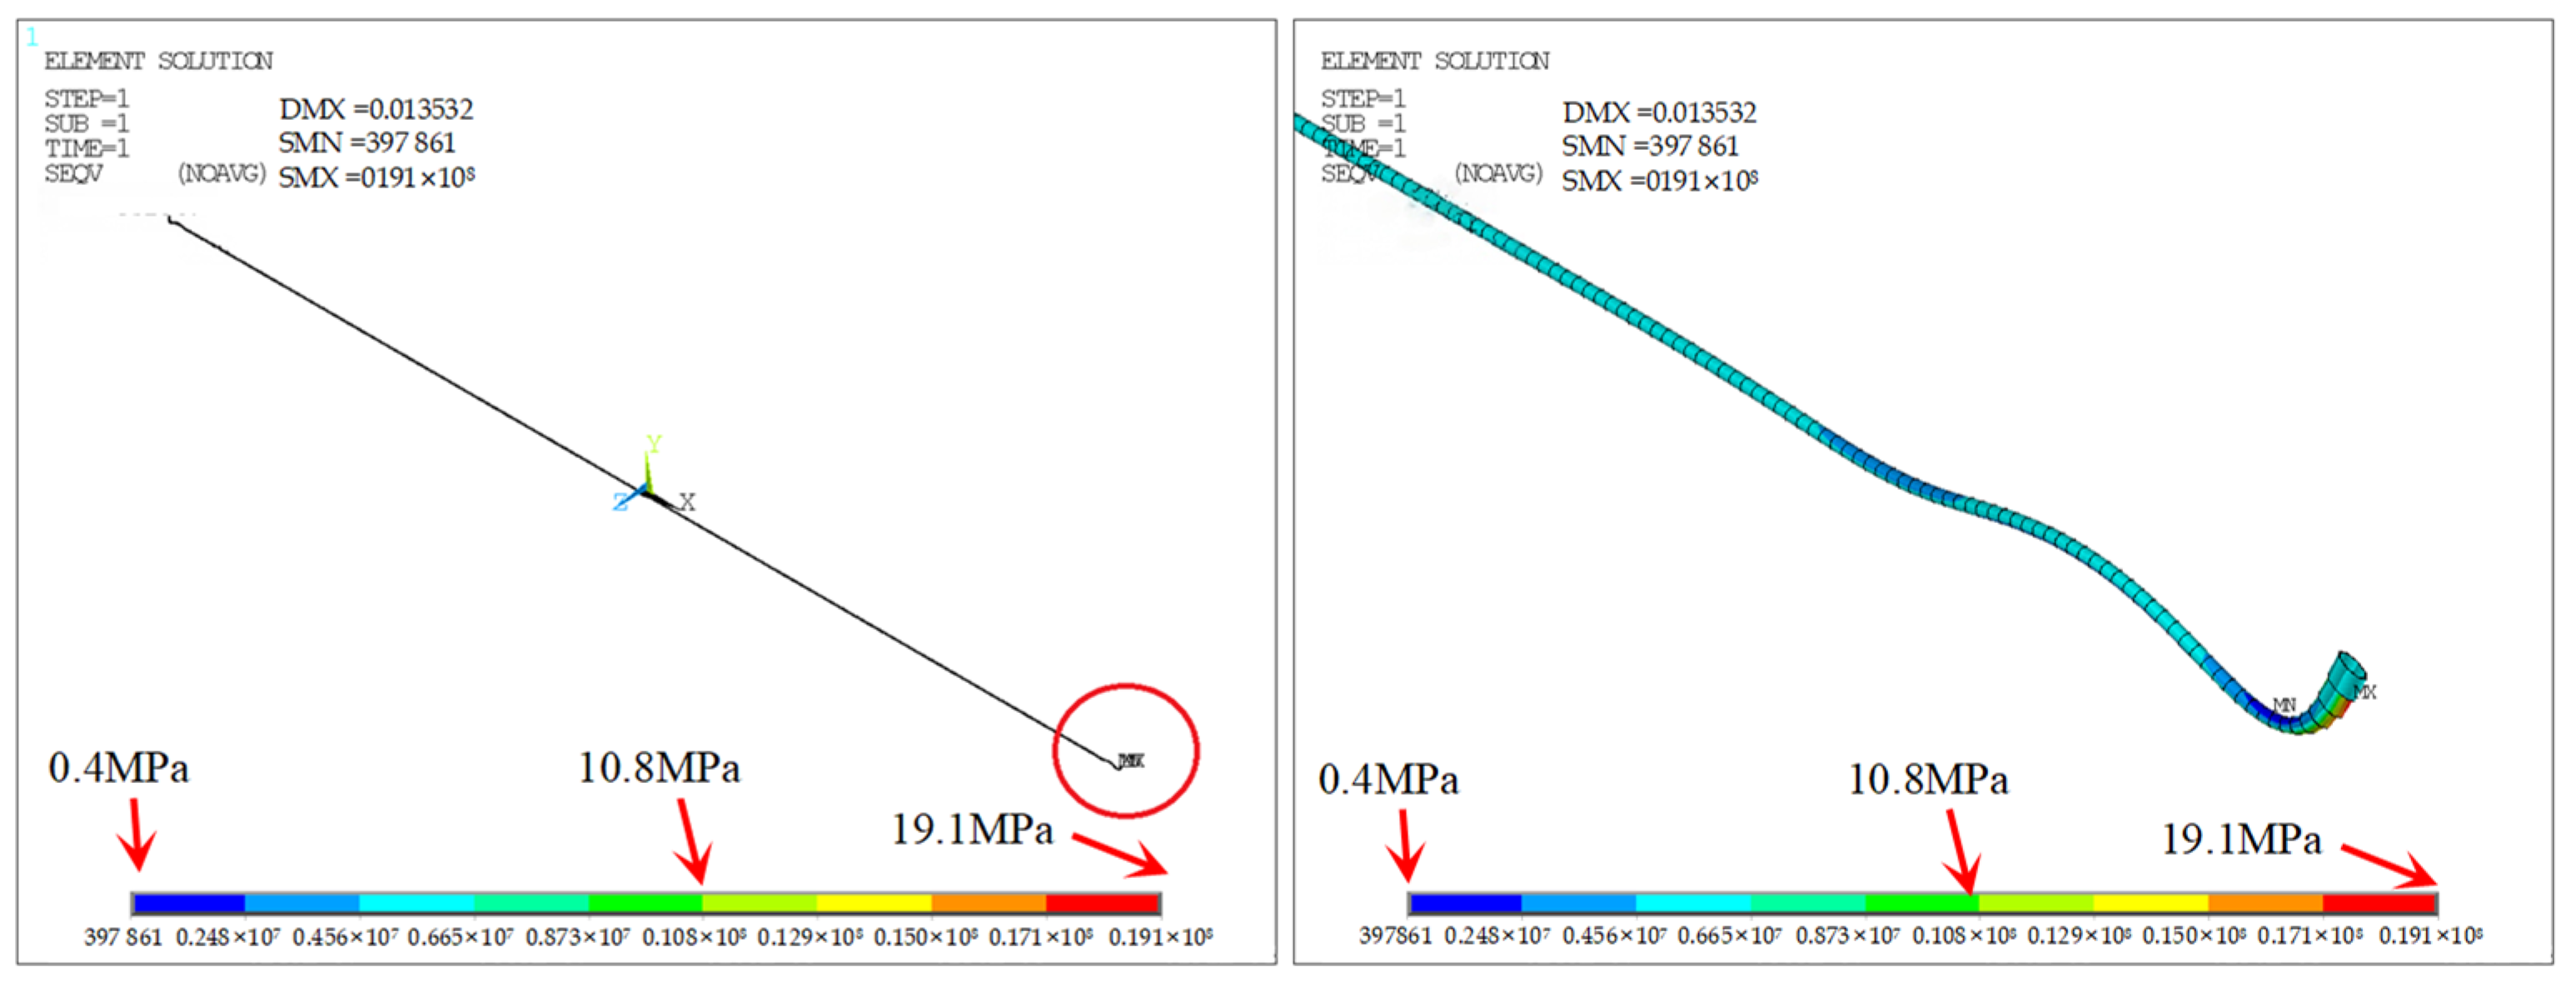
Figure 9 demonstrates the equivalent stress distribution of the outer pipe under Extreme Condition II, where the inner pipe undergoes thermal contraction due to the low-temperature test fluid. The stress in the outer pipe is primarily induced through mechanical coupling at the end joints with the inner pipe. Most regions of the outer pipe experience relatively low equivalent stress (15–17.1 MPa), indicating that the outer pipe serves mainly as a passive structural constraint during thermal contraction.
The pronounced stress concentrations near the pipe ends, with a maximum of 19.1 MPa at the top (“+y” direction) and a minimum of 0.4 MPa at the bottom (“−y” direction), reflect the combined effects of vertical displacement of the inner pipe due to gravity and the reactive axial and bending forces transmitted to the outer pipe. This asymmetric stress pattern demonstrates that the outer pipe’s structural integrity is most challenged near the ends, suggesting that reinforcement or careful joint design is critical in these regions to accommodate axial and bending interactions.
Furthermore, the observed stress gradients indicate potential zones where fatigue or local yielding could initiate under repeated thermal cycling, emphasizing the importance of considering end-region mechanics in the design, installation, and maintenance of pipe-in-pipe systems. This analysis extends beyond a simple description of stress magnitudes and provides a physical interpretation of the coupled thermal-mechanical behavior between the inner and outer pipes.

4.3. Directional Stress Analysis and Mechanical Modeling of the Pipe-in-Pipe System

4.3.1. Axial and Circumferential Stress Analysis of the Inner Pipe

Given that the inner and outer pipes exhibit similar stress distribution patterns under both types of extreme deformation scenarios, Extreme Condition I is selected here as a representative case to illustrate the stress variations in different circumferential directions.
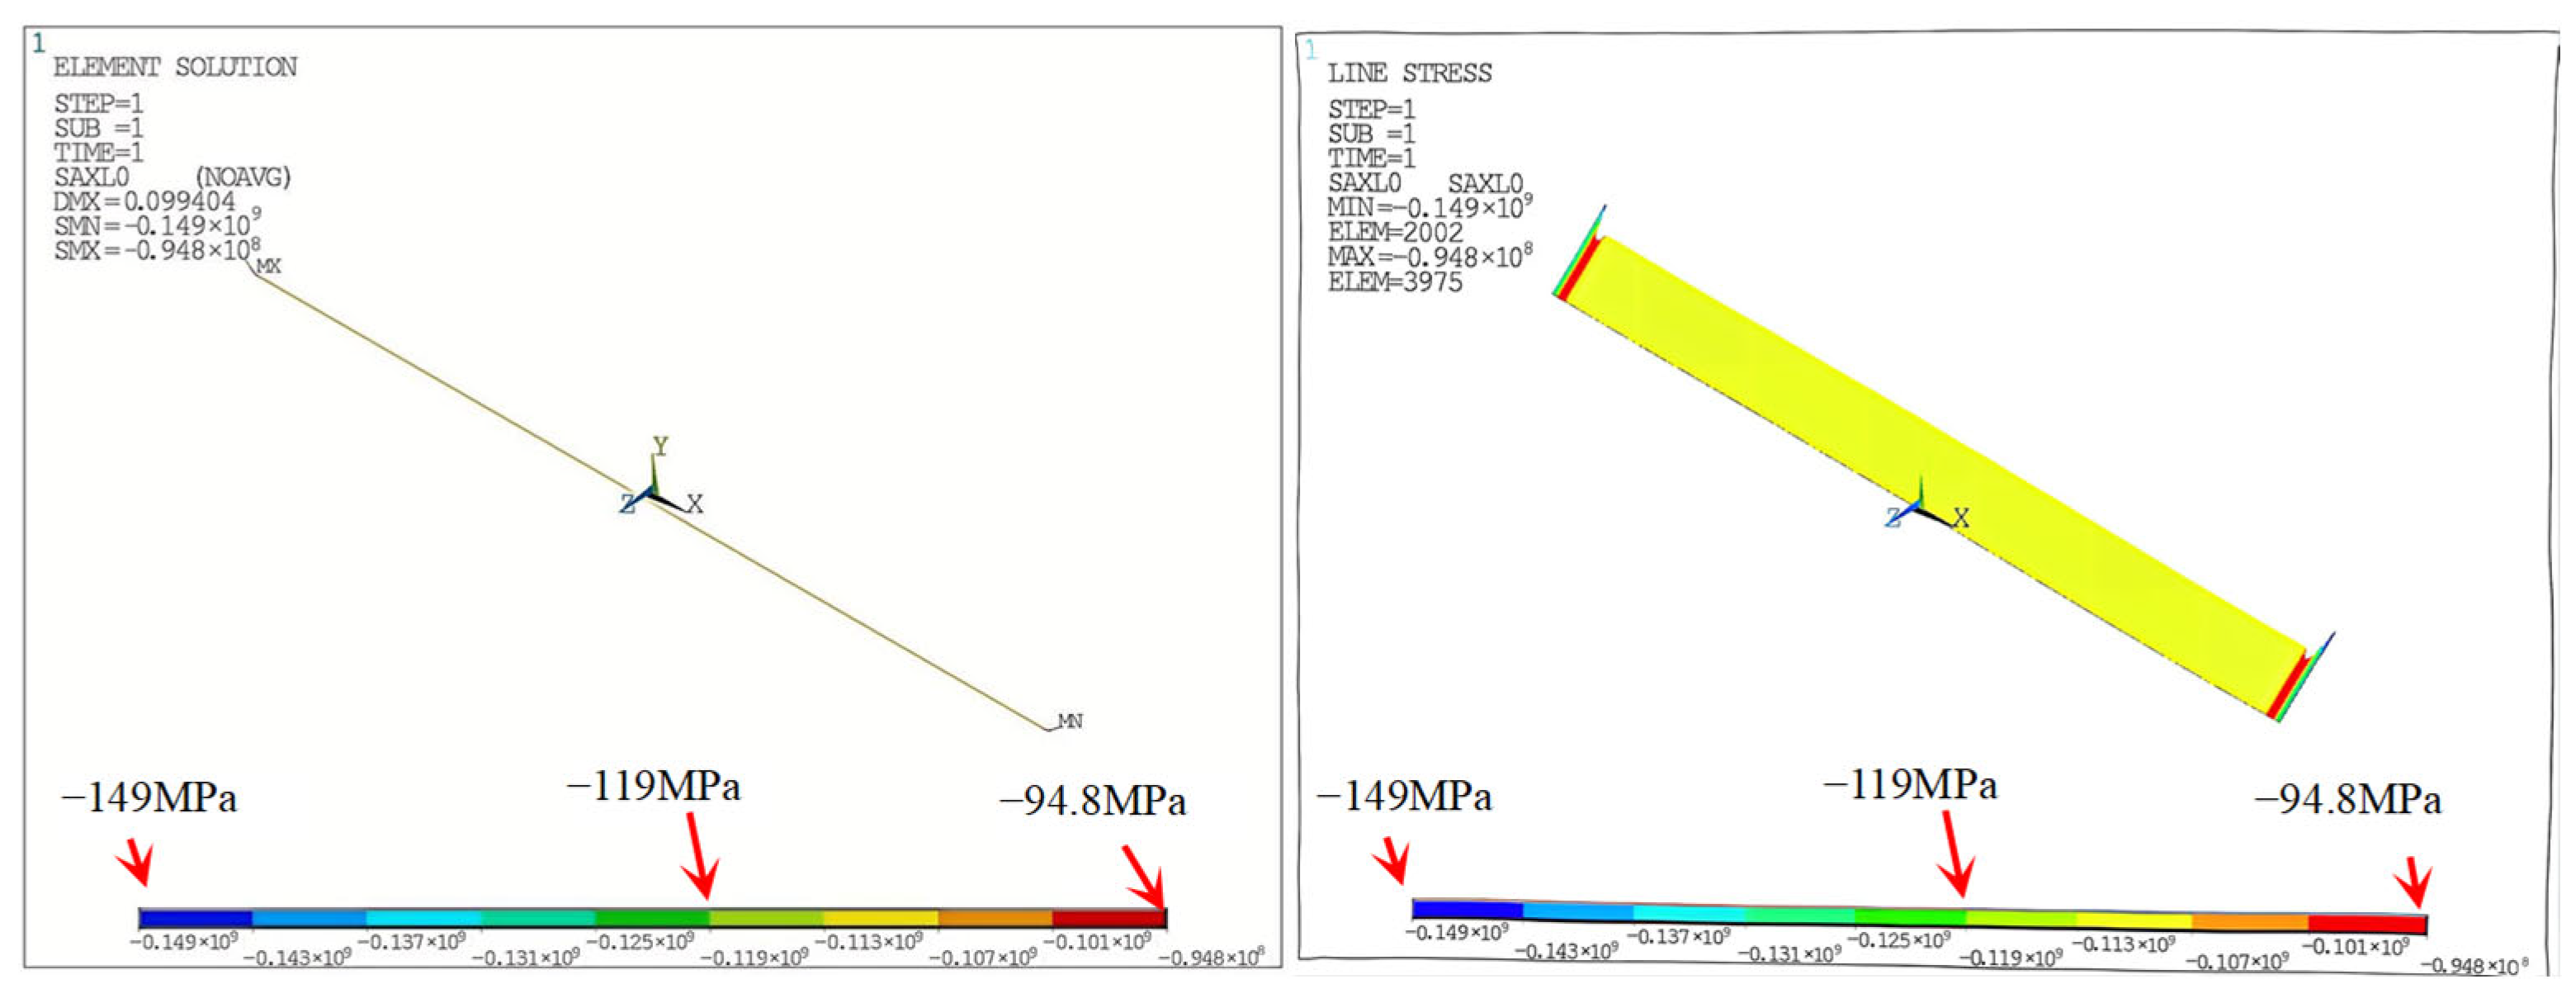
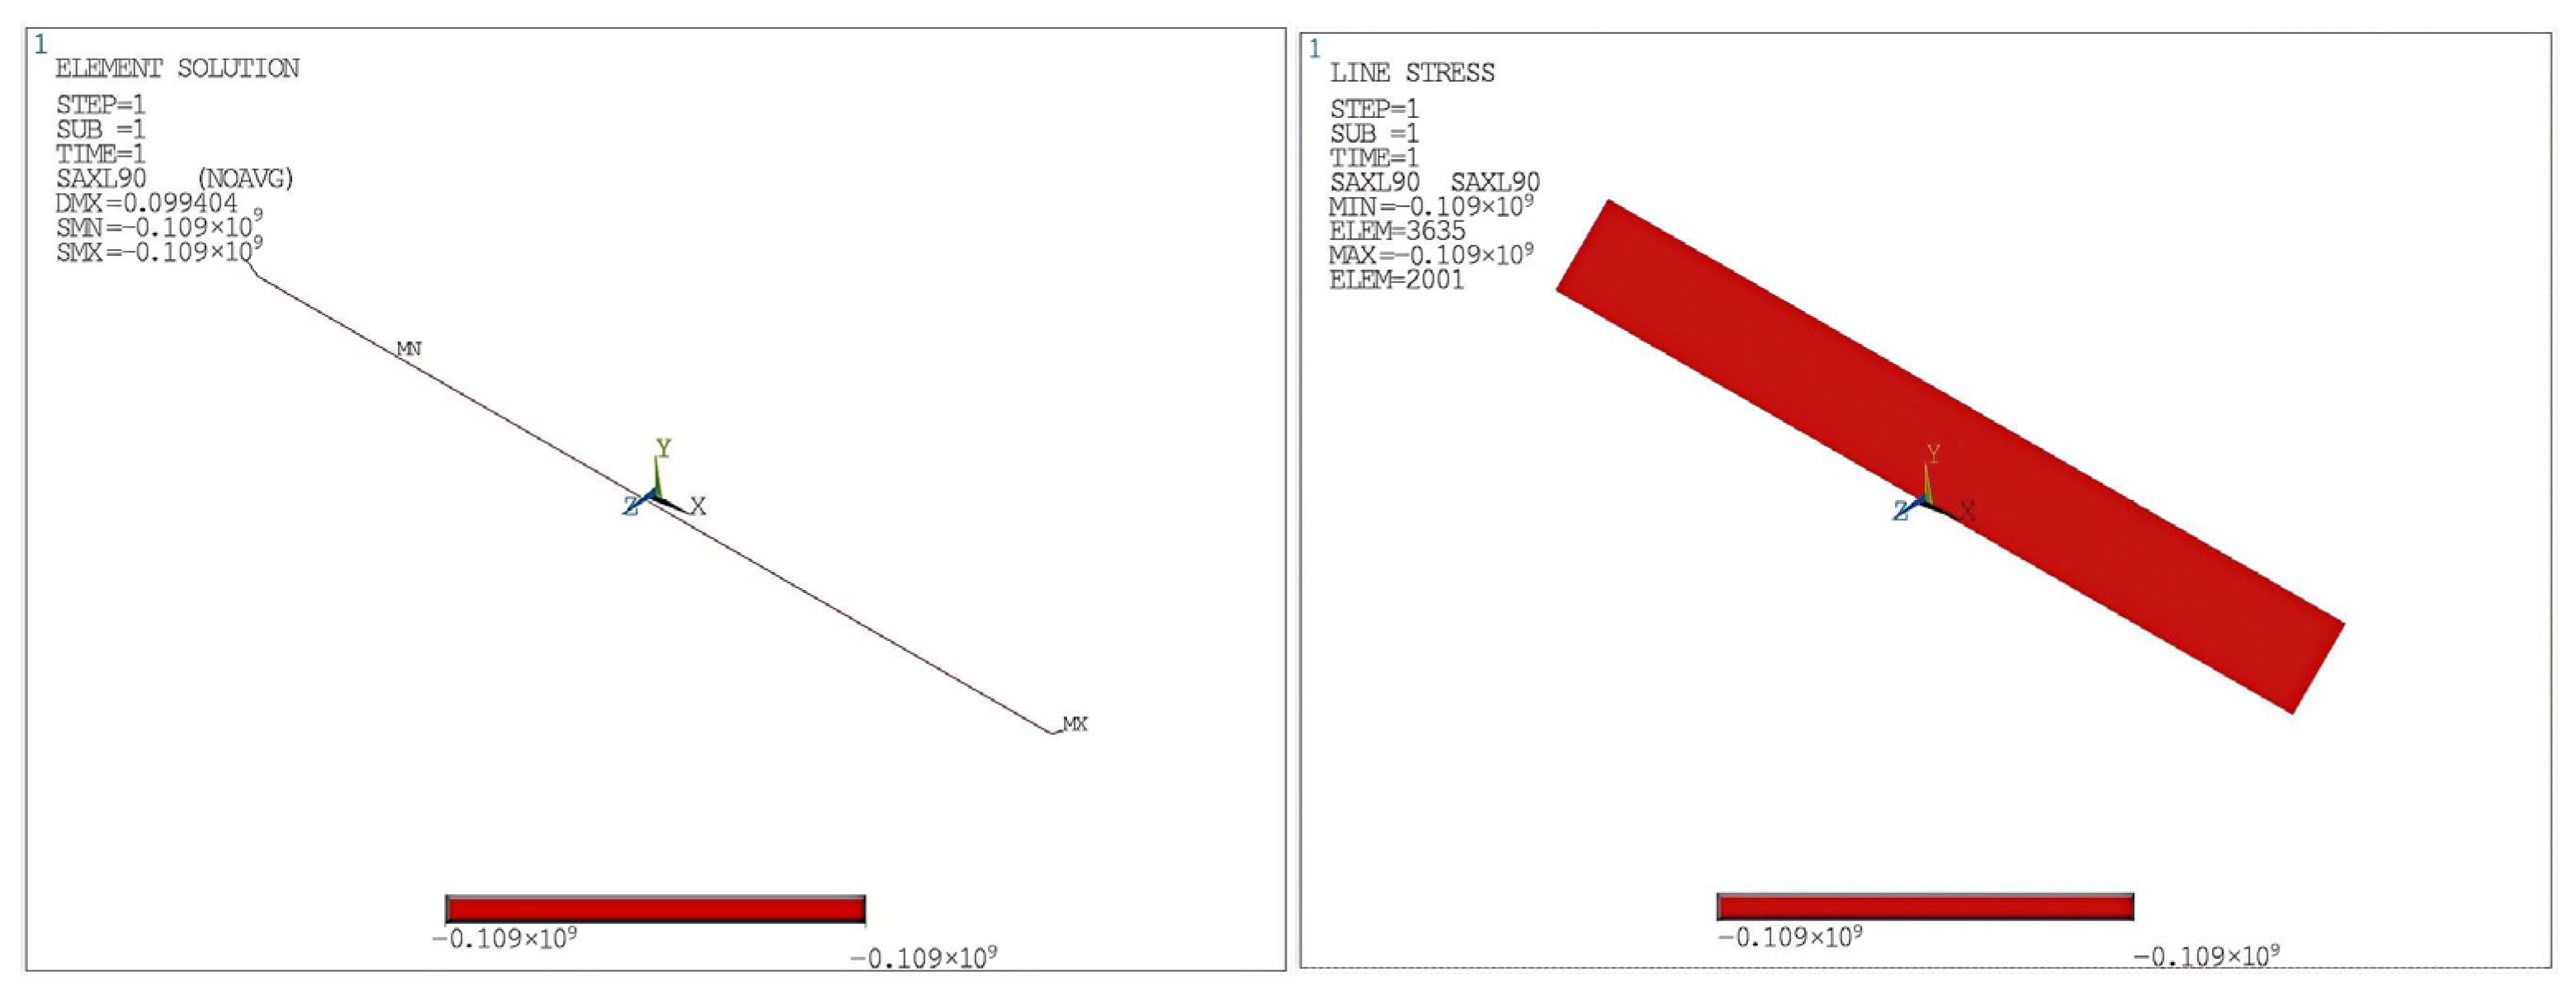
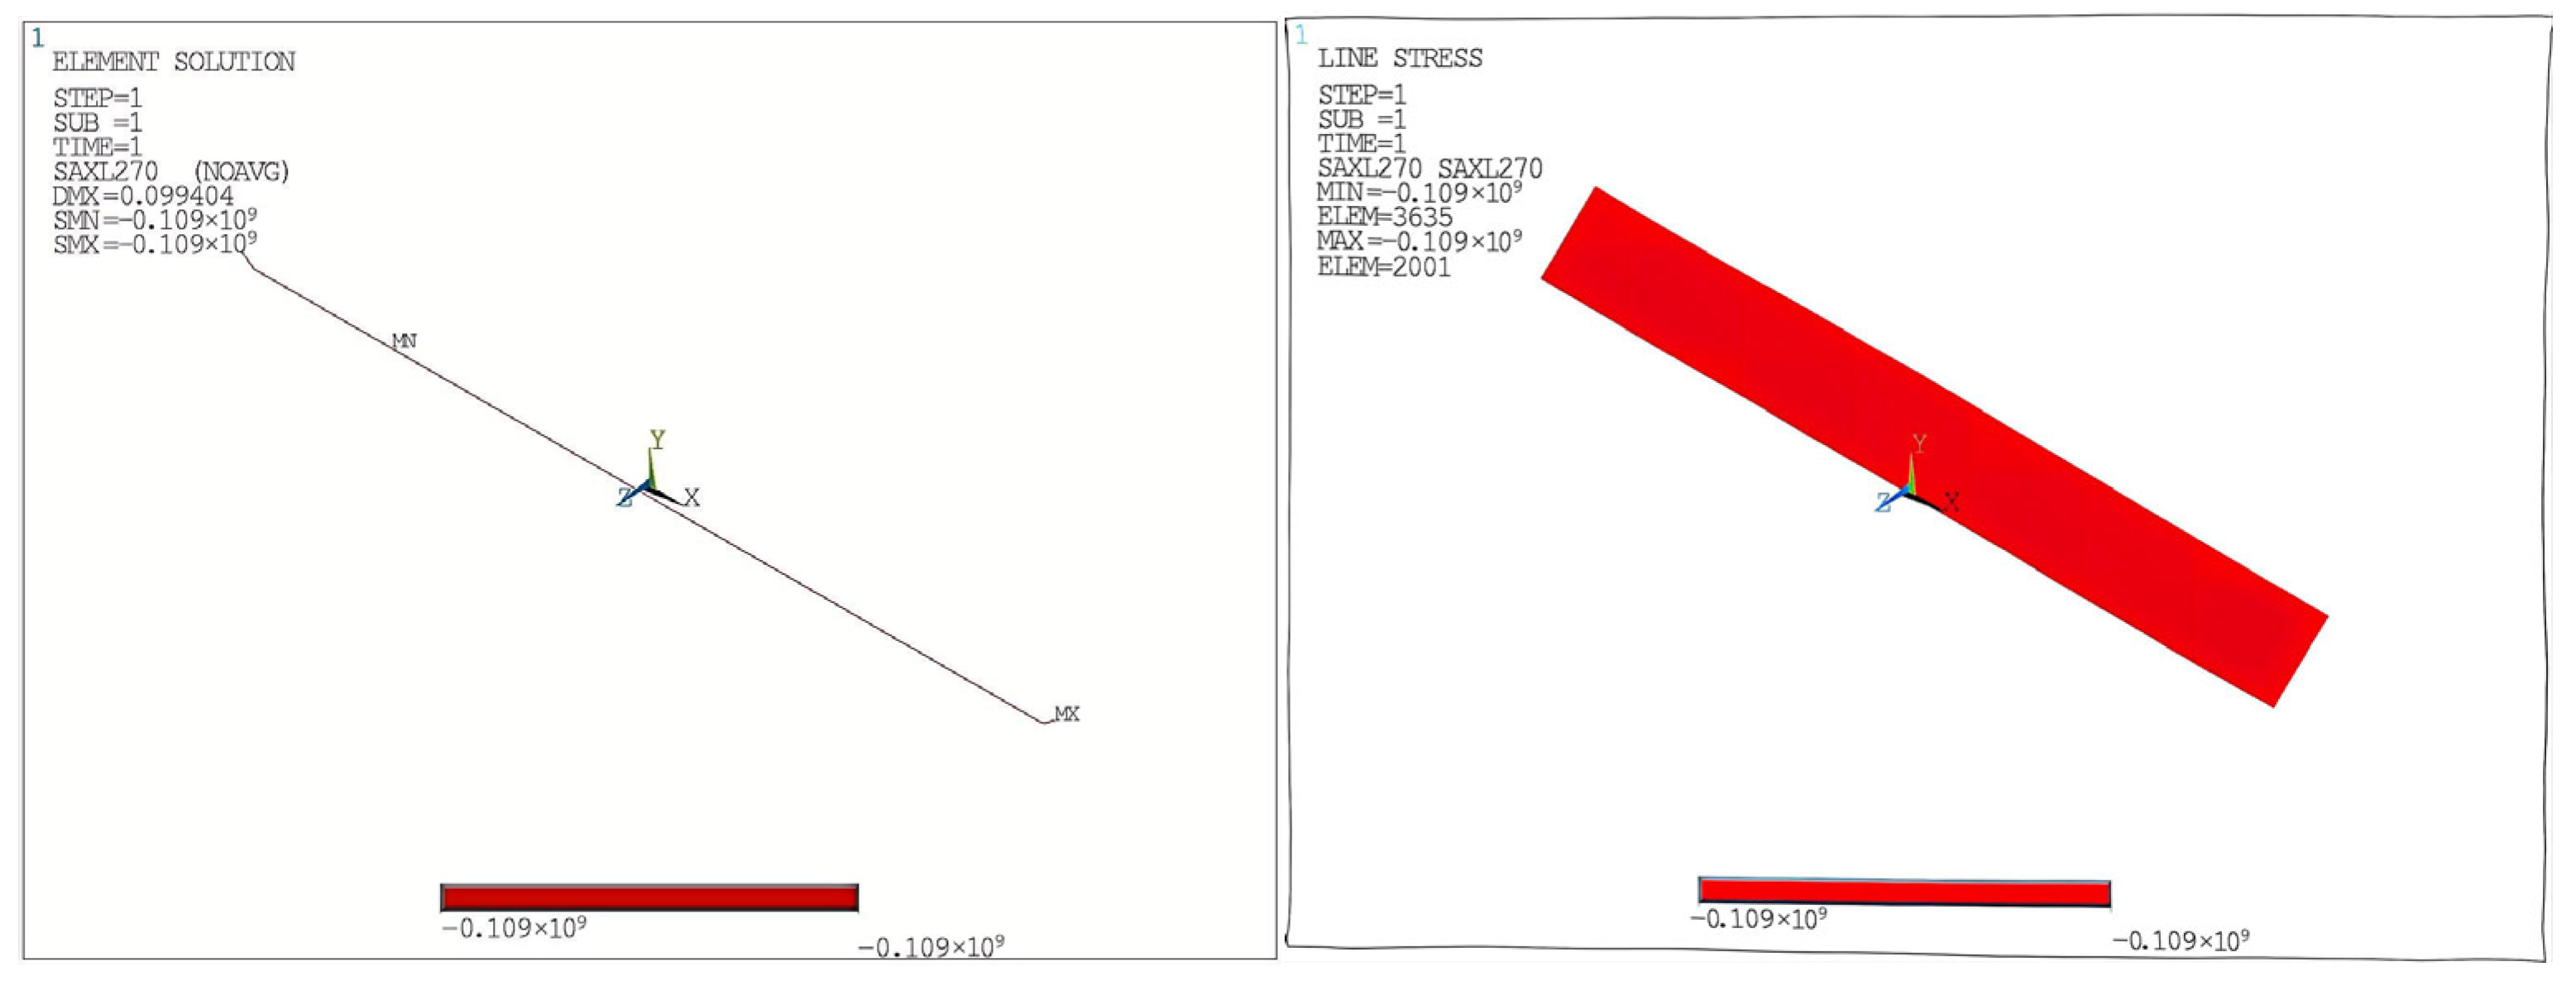
Figure 10, Figure 11, Figure 12 and Figure 13 present the axial stress distribution of the inner pipe along its length at four circumferential orientations (0°, 90°, 180°, and 270°). As shown, the axial stress distributions at 90° and 270° remain constant throughout the pipe length, with values uniformly equal to −109 MPa. In contrast, the 0° and 180° orientations exhibit axial stress variation near the pipe ends. These variations are attributed to the reaction forces generated by the inner pipe’s expansion being constrained by the outer pipe. Outside of the end regions, the middle segments of the pipe—where direct interaction with the outer pipe is absent—maintain a constant axial stress of −109 MPa, unaffected by deformation constraints.
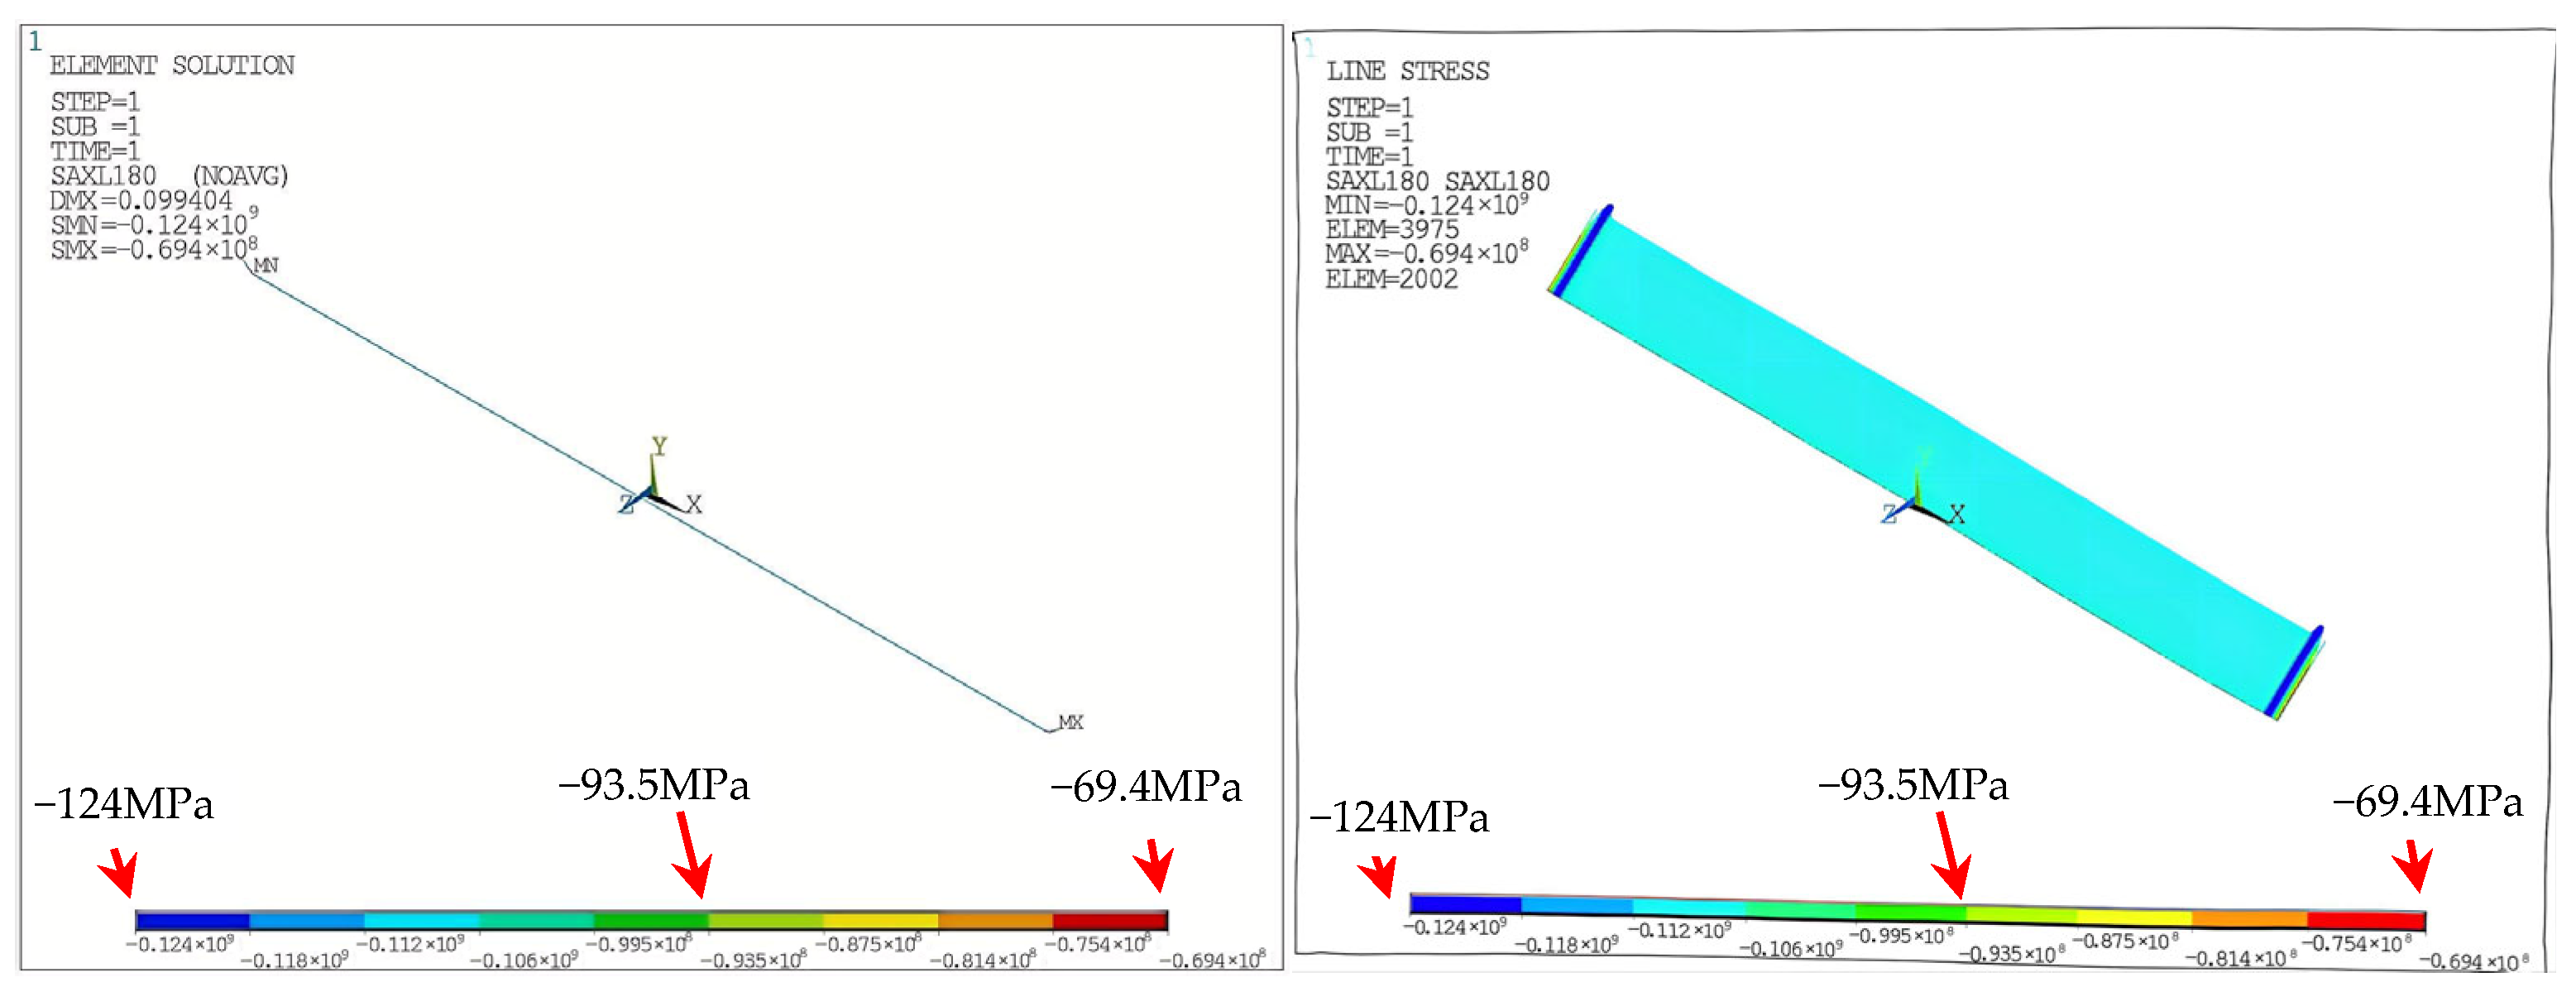
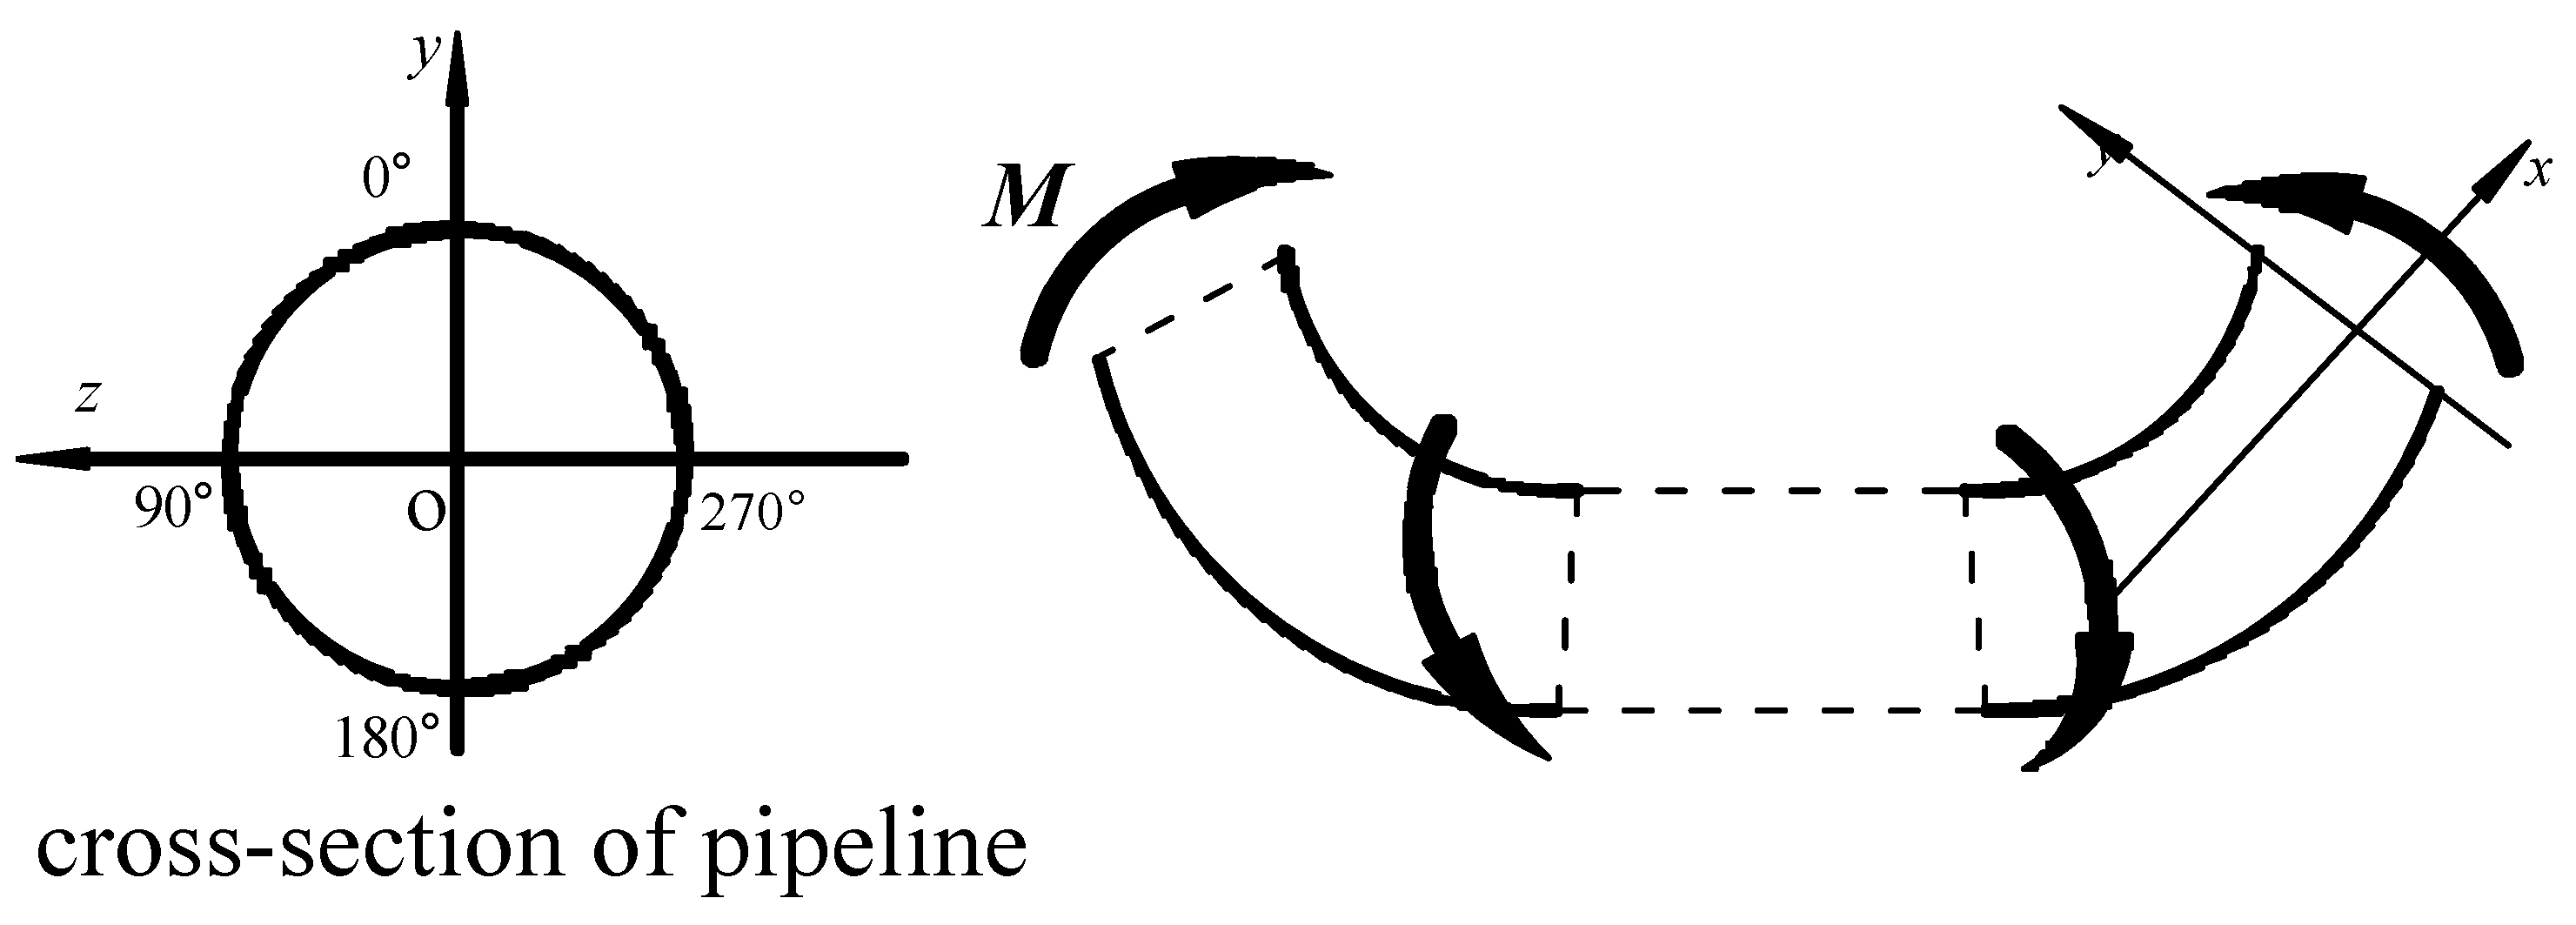
Figure 14 illustrates the bending moment diagram at both ends of the inner pipe. Due to the thermal expansion of the inner pipe being constrained by rigid connections to the outer pipe, compressive stresses are induced. The axial thermal deformation is partially restricted, leading to vertical displacement. Meanwhile, the radial confinement imposed by the outer pipe wall causes the end of the inner pipe to deform into an “L”-shaped configuration, while the central region of the pipe remains approximately horizontal. At the pipe ends, the constraint imposed by the outer pipe induces a positive bending moment (+Mz), resulting in a clockwise rotational tendency in the left-side “L” segment (in the x–y plane). Consequently, the compressive stress at the bottom of the pipe end (−y direction or 180°) decreases to a minimum of −69.4 MPa, while the compressive stress at the top of the pipe end (+y direction or 0°) increases to a maximum of −149 MPa.
At the elbow junction between the vertical and horizontal segments of the “L”-shaped inner pipe, the stress behavior differs significantly. The bending constraint of the inner pipe at both ends leads to a negative bending moment (−Mz) at the elbow. Accordingly, the compressive stress at the −y direction increases to −124 MPa, which is higher than the average stress value of −109 MPa. In contrast, the stress at the +y direction decreases to −94.8 MPa, which is lower than the average. Notably, the maximum axial stress in the 0° direction appears at the pipe end, whereas in the 180° direction, the peak occurs at the elbow.
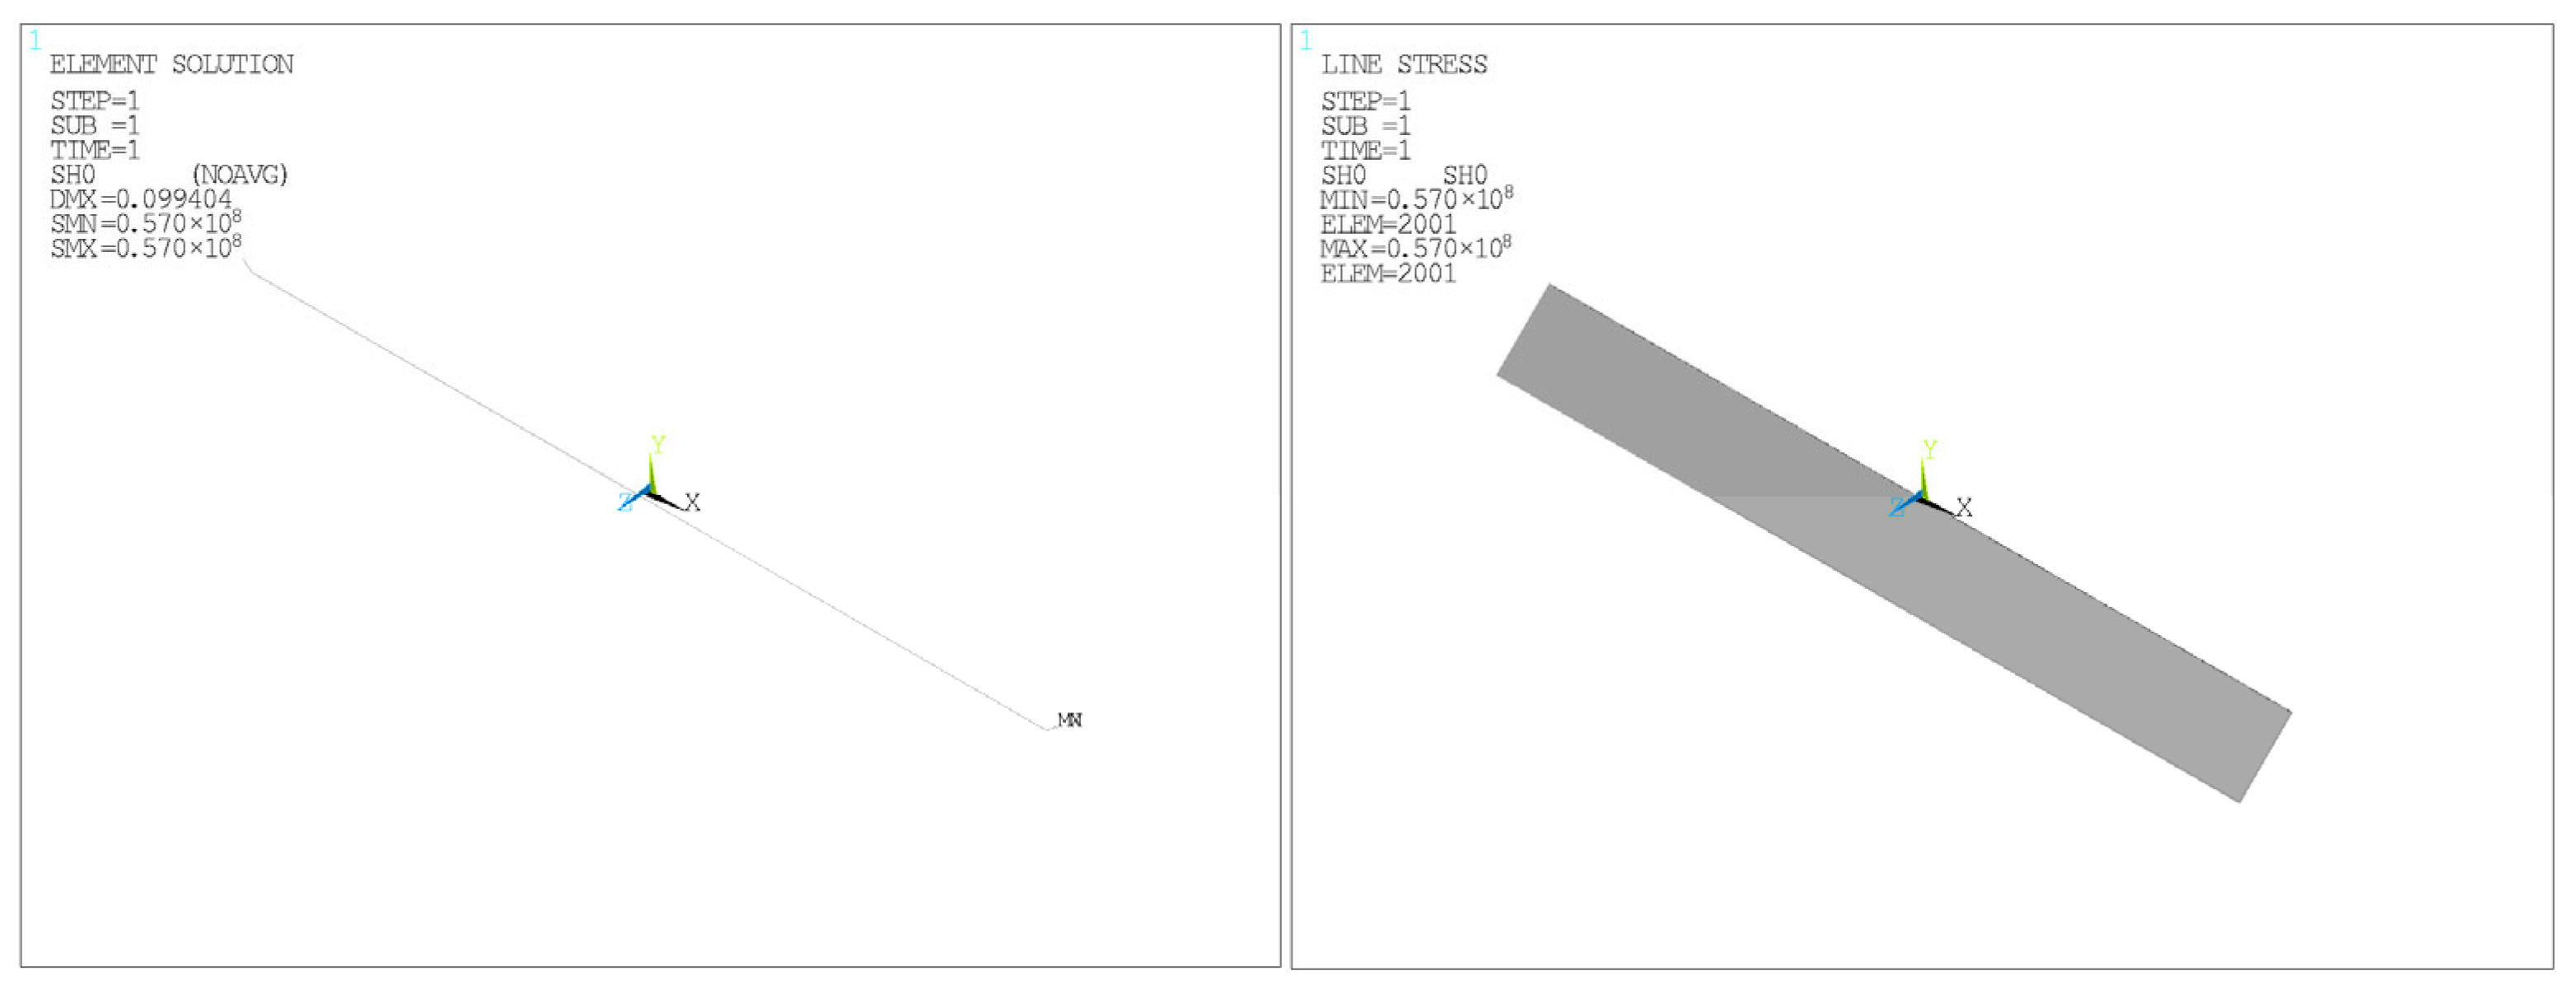
Figure 15 shows the circumferential stress distribution at the 0° direction of the inner pipe. Since no additional circumferential loads other than internal pressure are present, the circumferential stresses in all directions are uniformly distributed at 57 MPa.
Table 5 compares axial and circumferential stress values across the four orientations. As indicated, the circumferential stress remains constant (57 MPa) regardless of orientation. The “L”-shaped deformation at the pipe ends arises due to the inner pipe’s expansion being constrained by the outer pipe’s wall and end fittings. The mechanical coupling between the inner and outer pipes produces mutual stress and strain interactions. Specifically, the outer pipe’s constraint induces a positive bending moment (+Mz) at the pipe ends and a negative bending moment (−Mz) at the elbow due to local reaction forces. The +Mz moment primarily affects the vertical segment of the “L”-shaped pipe, while the horizontal segment remains mostly unaffected. The central region of the pipe experiences negligible influence from these moments, resulting in minimal stress variation. As these bending moments are localized near the pipe ends, the majority of the pipe length maintains a consistent axial stress of −109 MPa across all directions.

4.3.2. Axial and Circumferential Stress Analysis of the Outer Pipe

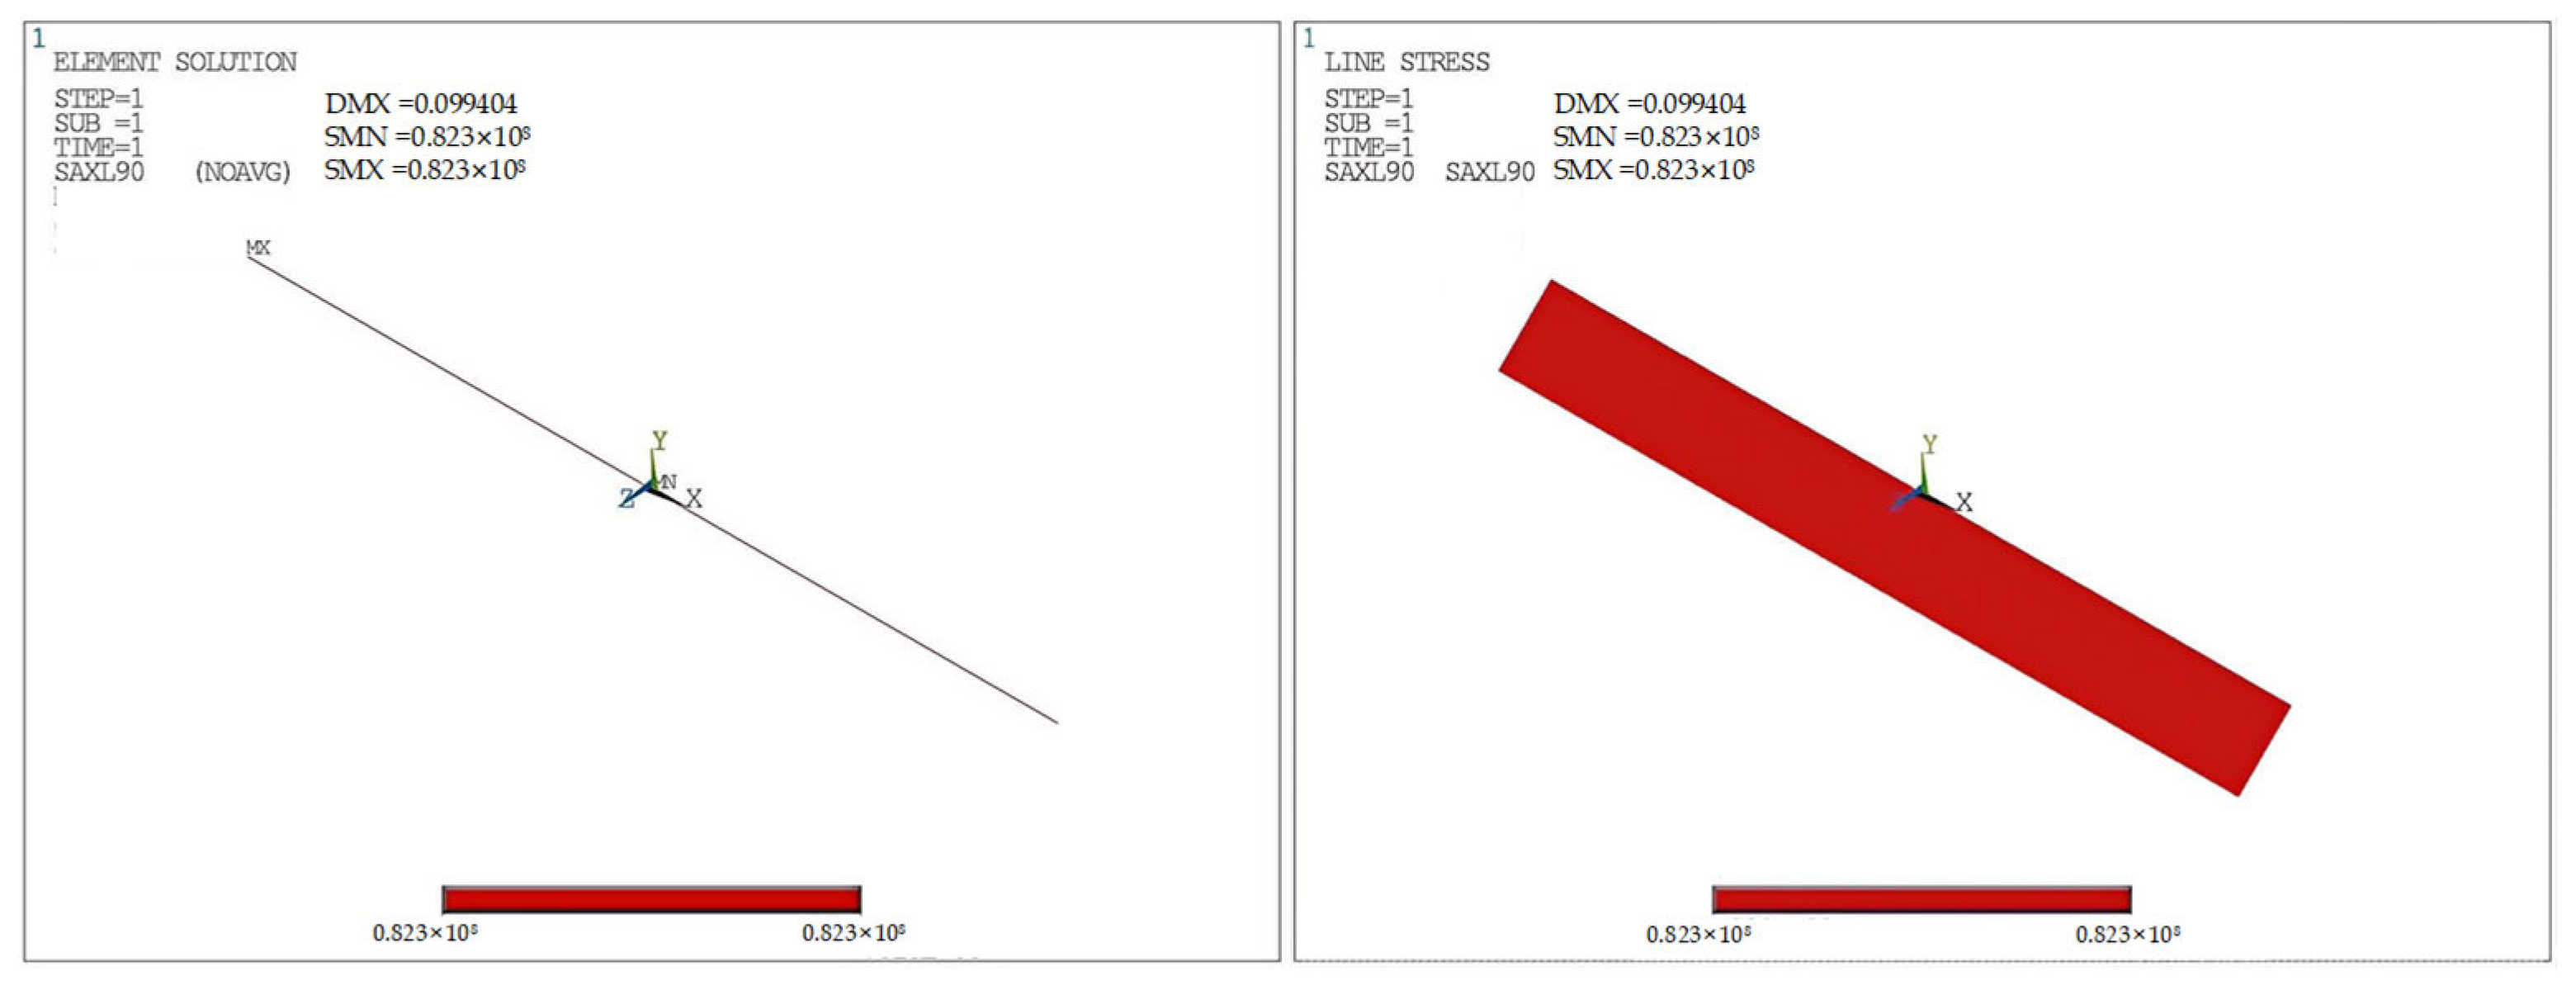
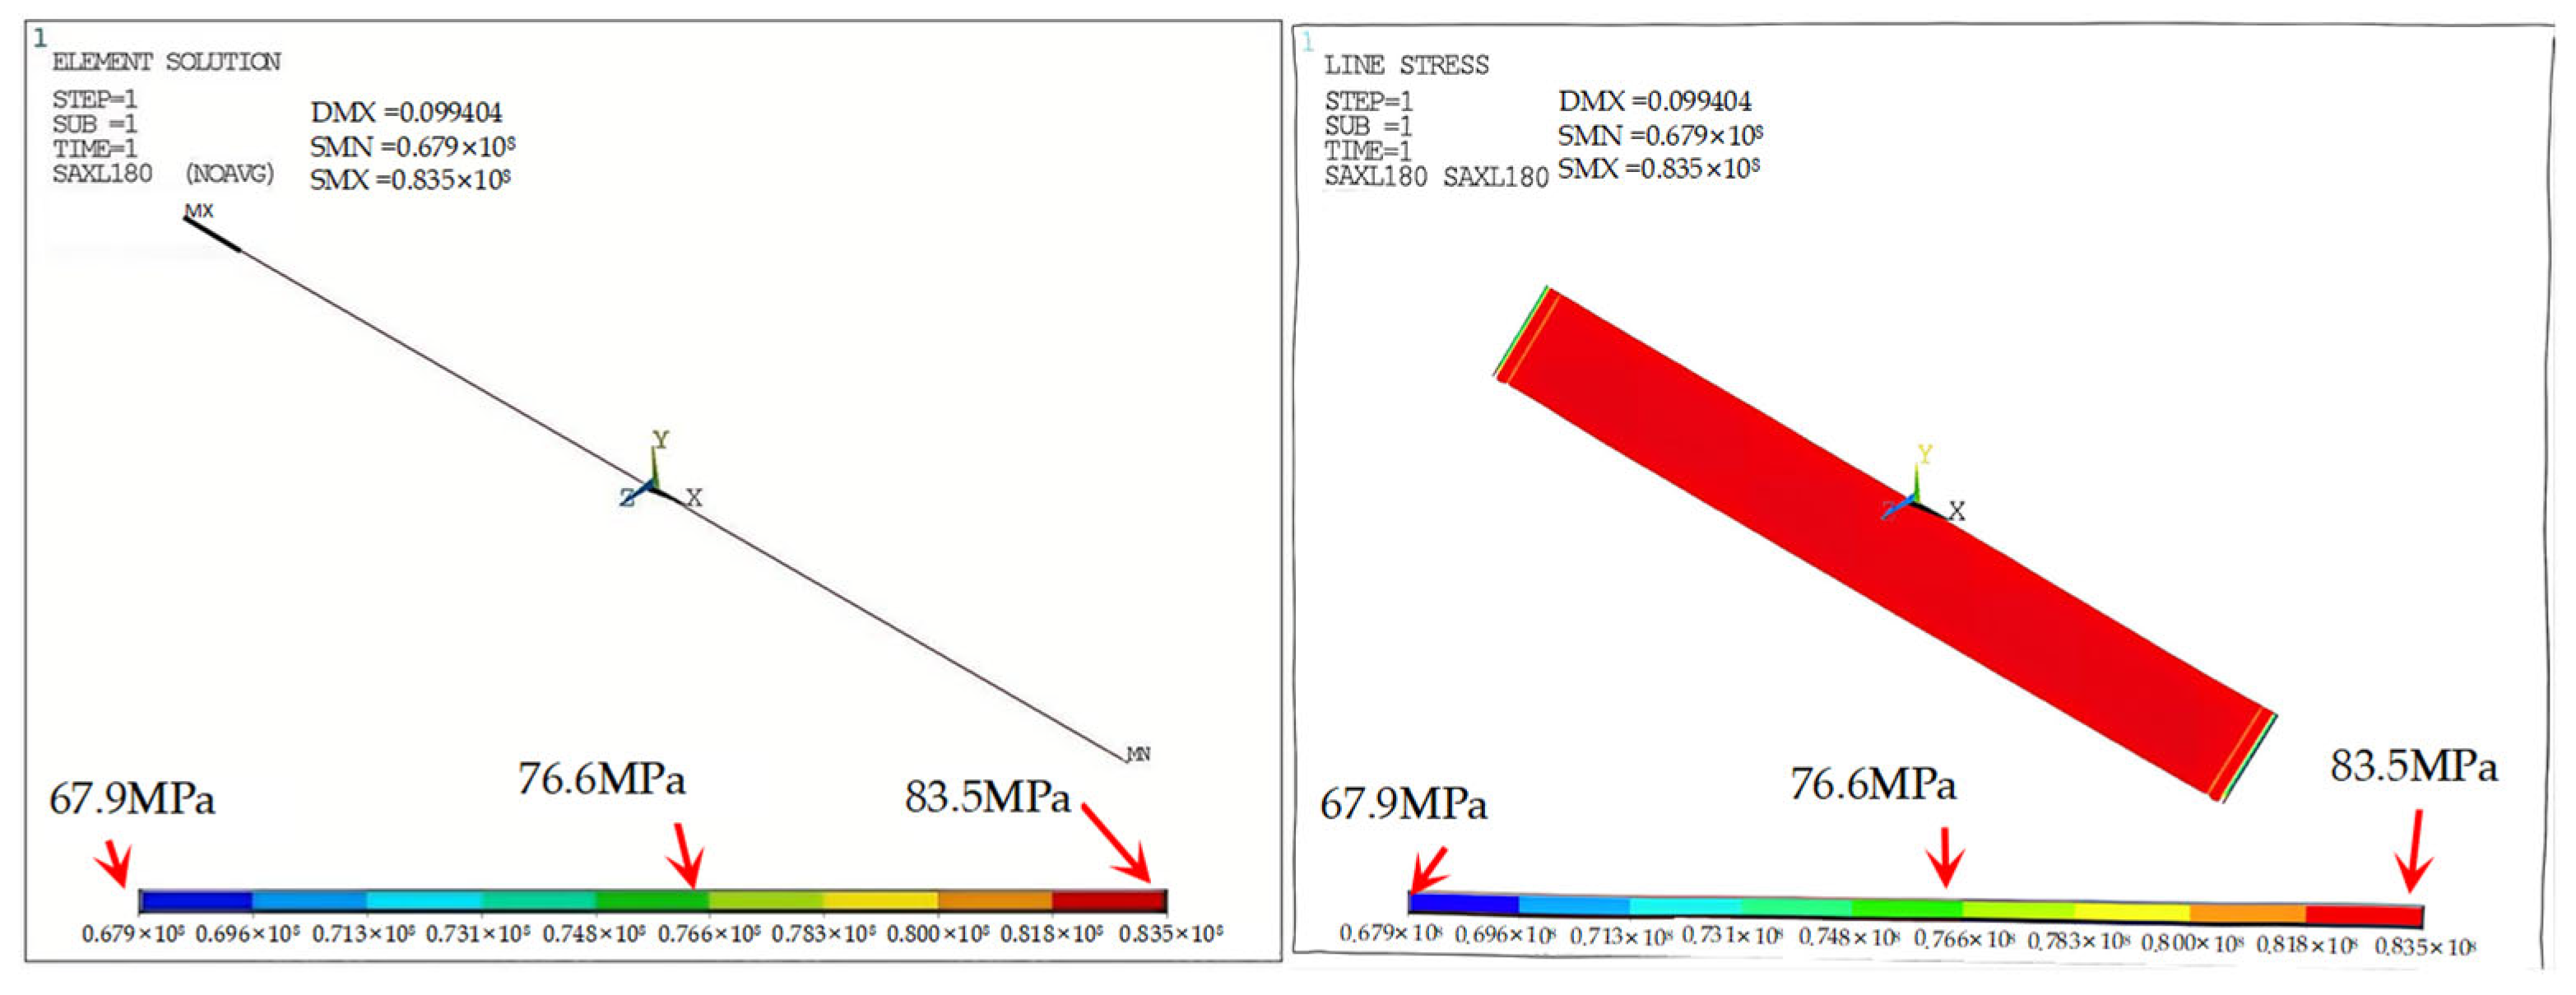
Figure 16, Figure 17, Figure 18 and Figure 19 illustrate the axial stress distribution along the pipeline length for the outer pipe at four circumferential angles. Under this loading condition, the outer pipe is not subjected to active loading; rather, it passively bears the mechanical response induced by the inner pipe. Specifically, axial expansion of the inner pipe exerts tensile forces on both ends of the outer pipe, resulting in an overall axial tensile stress state.
As shown in the figures, the axial stress along the 90° and 270° directions remains constant at 82.3 MPa throughout the entire length. However, the stress distribution along the 0° and 180° directions is non-uniform. Near the pipe ends at these two directions, axial stress deviates due to the reactive force transmitted by the inner pipe. In contrast, the midsections along these directions, which are not directly coupled to the inner pipe, experience minimal influence and maintain a uniform stress of 82.3 MPa.
Figure 20 presents the force diagram of the outer pipe. As the inner pipe undergoes thermal expansion and internal pressure-induced axial elongation, it exerts an axial tensile force on both ends of the outer pipe, placing the latter under tensile stress. However, due to non-uniform constraint conditions along the pipeline, the inner pipe does not deform purely in the axial direction. Instead, significant vertical displacement occurs at the pipe ends.
Given that the top elevation of the inner pipe is lower than that of the outer pipe, the expansion of the inner pipe introduces a negative bending moment (−Mz) at the pipe-end interface. This moment reduces tensile stress at the “−y” (180°) direction of the outer pipe end, resulting in a minimum stress of 6.79 MPa, and simultaneously increases tensile stress at the “+y” (0°) direction, reaching a maximum value of 96.8 MPa.
Table 6 summarizes the axial and circumferential stress values of the outer pipe in four directions under Extreme Condition I. Since there is no internal pressure acting on the outer pipe in this case, all circumferential stresses remain zero. The mechanical coupling between the inner and outer pipes produces mutual constraint and interaction in terms of stress and strain. The deformation of the inner pipe induces a positive bending moment (+Mz) at the outer pipe ends, increasing the tensile stress at 180°, while reducing it at 0°. Midsections of the pipe are largely unaffected by this bending moment, resulting in negligible stress variation along the length. Because the effect of the bending moment is highly localized near the pipe ends, the majority of the outer pipe remains unaffected. Accordingly, the average axial stress across the four directions is approximately 82.2 MPa.

5. Stress Modeling of Pipe-in-Pipe Systems

Considering the mechanical coupling between the inner and outer pipes, the mechanical behavior of the PIP system can be broadly categorized into two types based on the initial deformation stage:
Type I: The inner pipe elongates relative to the outer pipe (e.g., expansion with Extreme Condition I). Type II: The outer pipe elongates relative to the inner pipe (e.g., contraction of the inner pipe with Extreme Condition II).
Table 7 summarizes the stress types in both pipes for these two categories. As shown, in Type I loading scenarios, the inner pipe is predominantly subjected to compressive stress, while the outer pipe experiences tensile stress. This is due to the inner pipe’s thermally induced expansion being constrained by the outer pipe, resulting in internal compressive stress, whereas the outer pipe develops axial tensile stress in response to the inner pipe’s expansion.
In contrast, under Type II loading, the inner pipe experiences tensile stress, while the outer pipe is subjected to compressive stress. This arises because the outer pipe elongates relative to the inner pipe and is constrained at the ends by the inner pipe, which in turn induces compressive stress in the outer pipe and tensile stress in the inner pipe.
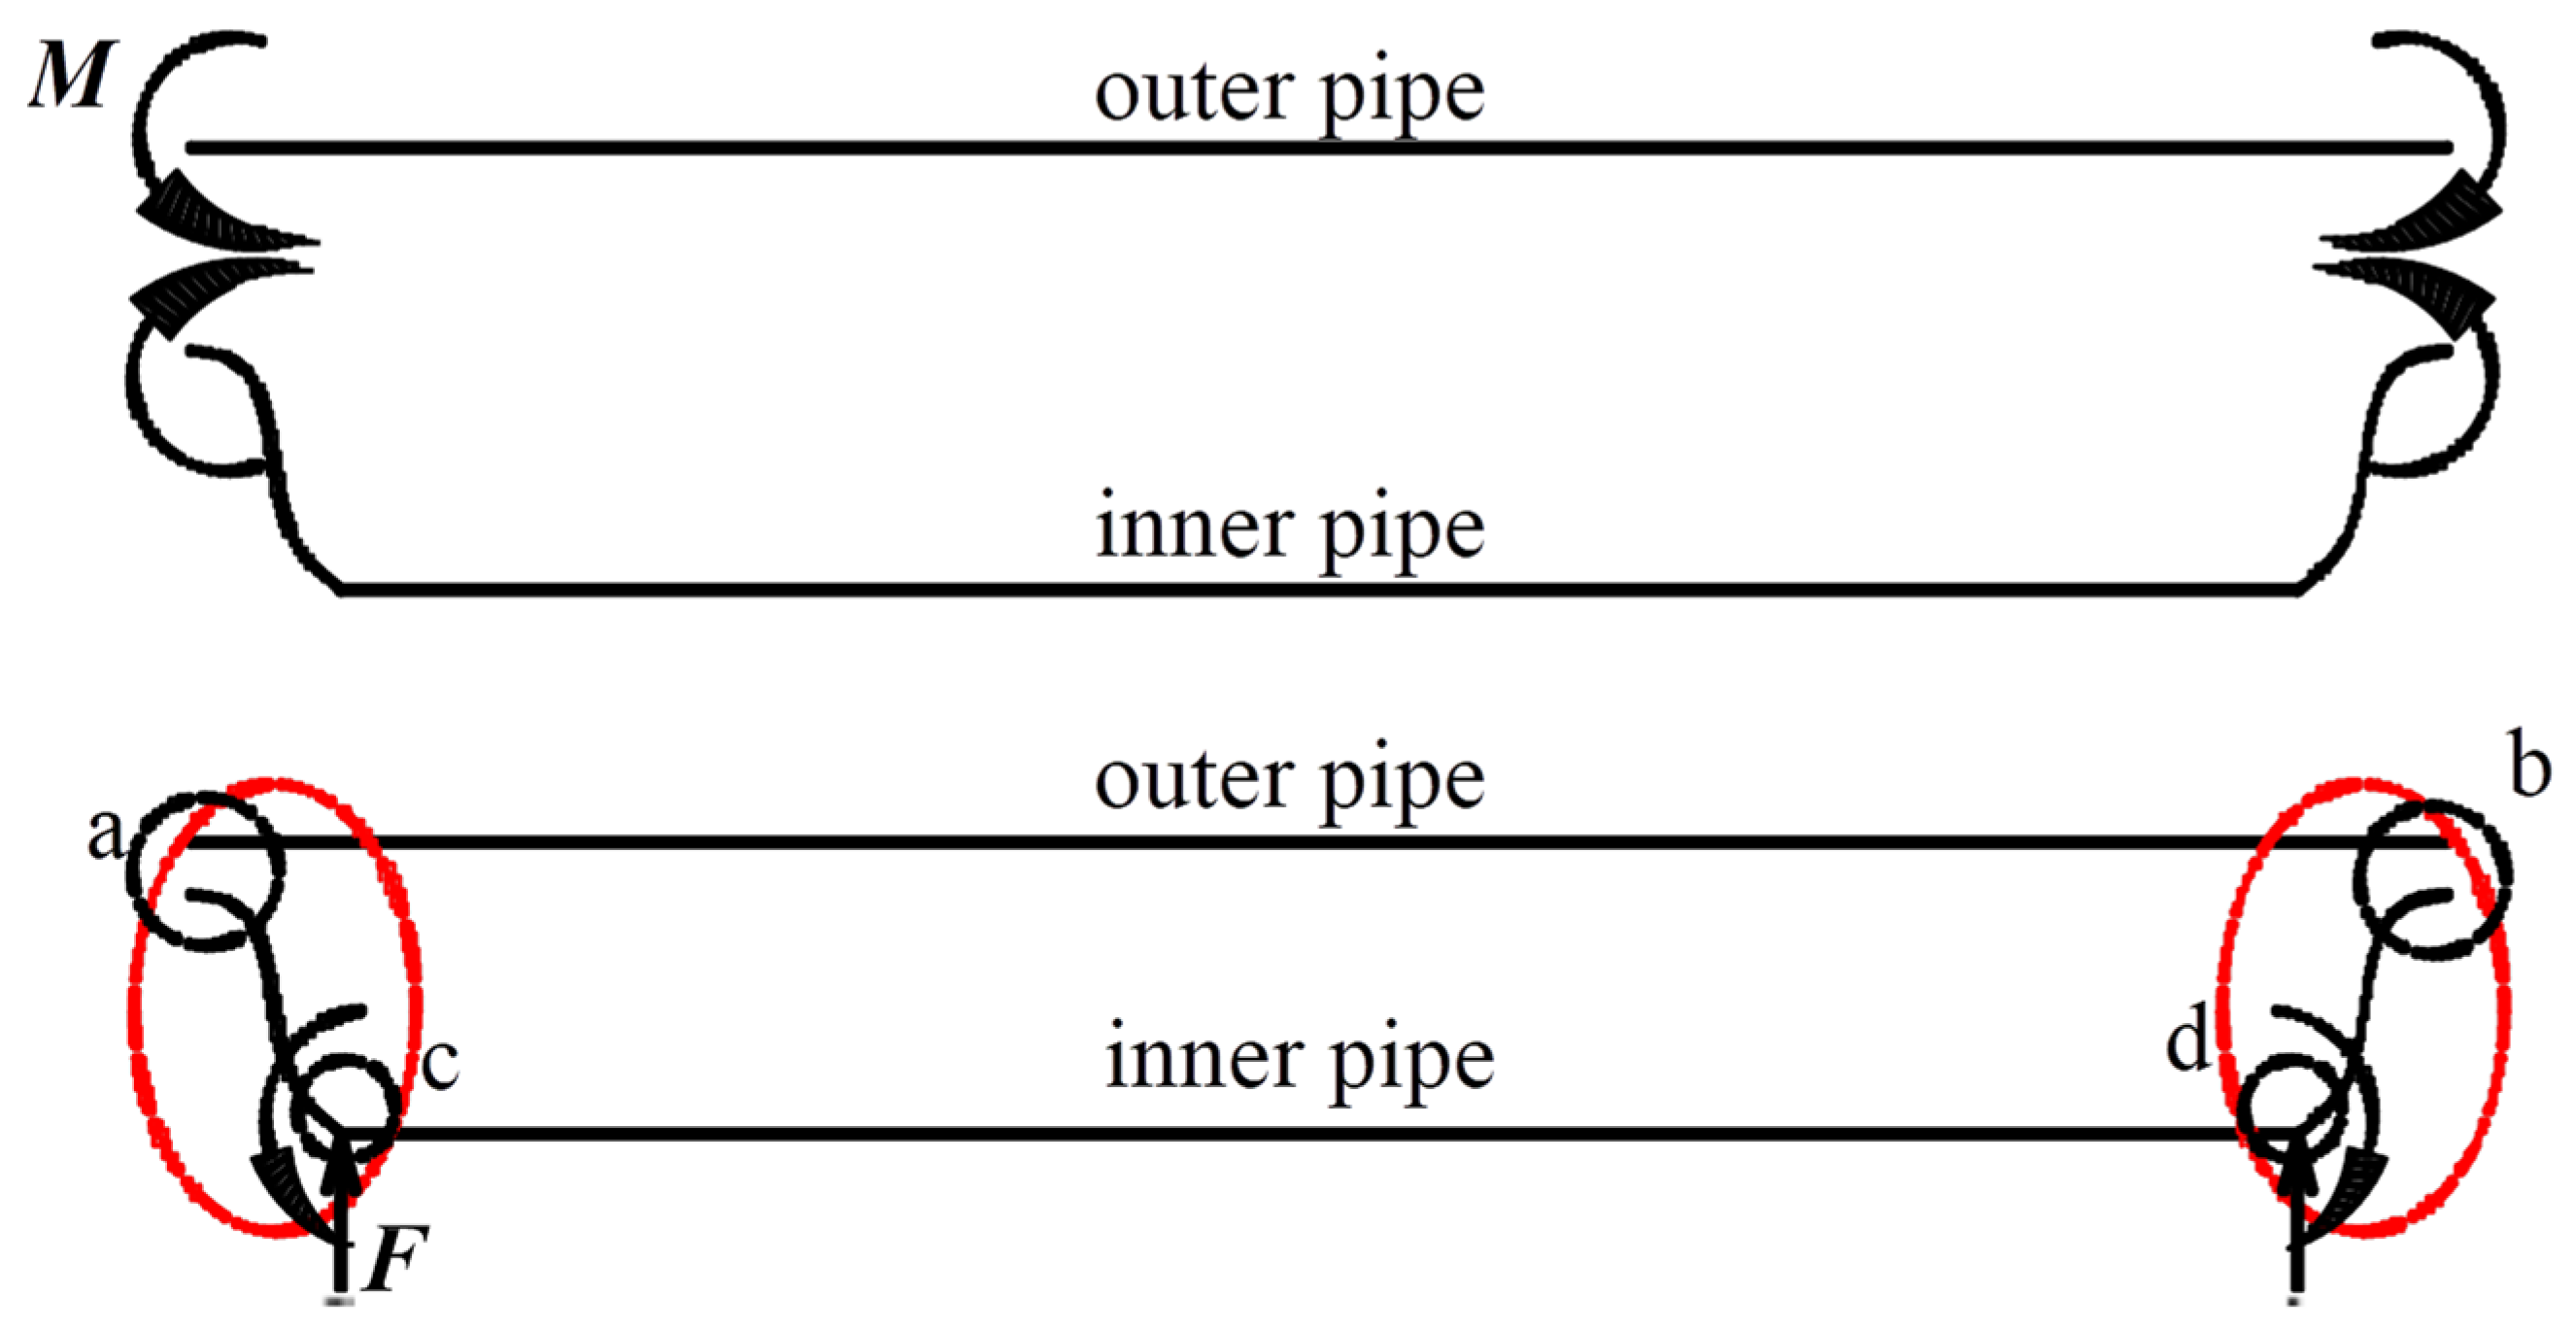
Figure 21 illustrates the end-region stress model of a pipe-in-pipe system under differential deformation conditions. At the ends of the system, both the inner and outer pipes develop bending moments in the Z-direction [6]. The bending moment direction is consistent: the outer pipe end experiences a negative moment (−Mz), and the inner pipe end is subjected to a positive moment (+Mz). At the inflection point of the inner pipe, another negative bending moment (−Mz) occurs. The bending moment is caused by the differential deformation of the inner and outer pipes and the internal pressure.

5.1. Stress Model for Inner Pipe Expansion Due to Preheating

For Extreme Condition I, the primary external loads are the thermal stress and internal pressure acting on the inner pipe. Internal pressure mainly contributes to hoop stress in the inner pipe, while its influence on axial stress is relatively small due to its limited magnitude. The principal factor governing the mechanical behavior of the coupled system is thus the thermal expansion of the inner pipe.
In the first loading stage, thermal expansion of the inner pipe induces axial displacements at the connection points a and b, directed toward the midsection of the pipe. However, these displacements are constrained by external soil resistance. Furthermore, since the top elevation of the outer pipe is higher than that of the inner pipe, expansion of the inner pipe produces a negative bending moment (−Mz) at the outer pipe ends. The inner pipe, in response to the outer pipe’s constraint, develops a positive moment (+Mz) at its ends. This results in an increase in tensile stress at the 0° position of the outer pipe and a decrease at the 180° position. The inner pipe, conversely, experiences increased compressive stress at the 0° direction and reduced stress at 180°.
As both ends of the inner pipe are constrained, it bends under thermal expansion. However, as it is embedded inside the outer pipe, the deformation is confined, and the midsection remains restricted. The ends of the inner pipe consequently develop symmetrical L-shaped deformations. The outer pipe, being in tension, develops tensile stress, while the constrained ends a and b exert compressive forces on the inner pipe.
In the second loading stage, the continued constraint of the expanding inner pipe by the outer pipe leads to vertical displacement. Without outer pipe confinement, the inner pipe would deform into an arch shape. Considering the influence of the outer wall, the deformation instead results in an L-shaped profile as shown in Figure 21. The corners of this L-shape (points c and d) act as pivot points for bending deformation, where the outer pipe wall imposes reactive forces F onto the inner pipe.
Given that points a and b are constrained by soil, points c and d experience negative bending moments (−Mz) under the action of F. This induces decreased compressive stress at 0° and increased compressive stress at 180° in those regions. The red regions in Figure 21 represent the stress-affected zones arising from the mechanical interaction between inner and outer pipes. Beyond these areas, the remaining pipe segments are largely unaffected by the end bending moments, and the stress fields remain stable.
Table 8 presents the axial stress influence zones of the connecting forgings at ends a and b. The influence zones differ between inner and outer pipes. For example, in Extreme Condition I, the outer pipe acts as the passive load bearer and has more rigid boundary constraints, making it less deformable. As a result, the outer pipe has a reduced capacity for internal stress redistribution, and its stress-affected region is broader, with an average length of 16.5 m, compared to 10.2 m for the inner pipe.
The middle sections of the outer pipe are not affected by external loads at the ends because these forces are absorbed by the end constraints. Similarly, the middle section of the inner pipe remains unaffected due to the L-shaped deformation at both ends, where points c and d act as pivot supports that neutralize external loads through reaction forces.

5.2. Mechanical Interaction Model of Pipe-in-Pipe System with Inner Pipe Pre-Cooling Contraction

In Extreme Condition II, the dominant external loads acting on the system include thermal contraction stress and internal pressure within the inner pipe. The principal factor altering the mechanical interaction model between the inner and outer pipes is the shrinkage deformation of the inner pipe under pre-cooling conditions. Figure 21 illustrates the mechanical response model of the PIP system during inner pipe contraction.
In the first loading stage, the inner pipe undergoes thermal expansion, causing the interface locations—denoted as ends a and b—to displace toward the center of the pipeline segment. However, because the ends a and b are constrained by the surrounding soil, and due to the fact that the outer pipe is located at a higher elevation than the inner pipe, the inner pipe undergoes thermal contraction. This results in the generation of a negative bending moment (−Mz) at the outer pipe ends, while a positive bending moment (+Mz) is produced at the inner pipe ends due to the reaction force from the outer pipe.
The asymmetric loading leads to a decrease in compressive stress at the 0° circumferential direction of the outer pipe and an increase at 180°. Correspondingly, tensile stress in the inner pipe decreases at 0° and increases at 180°. Due to gravitational effects, the inner pipe exhibits symmetric “L”-shaped deformations at both ends. While the outer pipe experiences compressive stress, the inner pipe is predominantly subjected to tensile stress.
In the second loading stage, as the inner pipe attempts to expand, it is constrained by the outer pipe. Without this confinement, the inner pipe would deform into a bow-shaped profile. However, accounting for the stiffness of the outer pipe wall, the inner pipe instead assumes an “L”-shaped deformation along its segment, as shown in Figure 21. At locations c and d—the corners of the “L” shape—the pipe wall of the outer pipe exerts a reaction force F on the inner pipe. These points function as structural supports for the “L”-shaped riser section of the inner pipe. Given that ends a and b are constrained by external soil, the reaction forces F at c and d produce negative bending moments (−Mz), leading to a reduction in compressive stress at the 0° direction and an increase at 180° in those regions.
In Figure 21, the red-highlighted zones represent the influence regions where mechanical interaction between the inner and outer pipes occurs due to end connectivity. The remaining pipe segments remain largely unaffected by end-induced bending moments, showing little to no change in equivalent stress values. Table 9 presents the axial stress influence ranges of the forged joints at ends a and b for both pipes. Compared to Extreme Condition II, the influence range in this case is significantly larger. This difference is attributed to the tensile forces acting on the inner pipe in Extreme Condition II, where the vertical component of the tensile force partially counteracts the weight of the bent segments. As a result, the reaction force F at the bends is smaller in Extreme Condition II, yielding a narrower influence region for the generated bending moments.
In this scenario, the outer pipe—which passively bears the loads—has a stricter confinement condition and higher structural stiffness than the inner pipe, making it less susceptible to deformation. Consequently, the outer pipe does not follow the same stress evolution pattern as the inner pipe. The outer pipe also demonstrates poorer self-regulation of its stress field, resulting in a broader influence zone at the pipe ends, with an average range of 16.875 m—larger than the inner pipe’s influence range of 13.375 m. The midsection of the outer pipe remains unaffected by external loads from the pipe ends due to boundary constraint dissipation. Similarly, the midsection of the inner pipe is also unaffected, as the “L”-shaped deformation at the ends and the reaction force at points c and d effectively cancel out the axial transmission of end loads along the pipe axis.

5.3. Calculation Method of Dual-Layer Pipe

5.3.1. Principal Stresses

For pipelines subjected to both internal pressure and thermal gradients, the radial stress is typically negligible. The dominant stress components are the axial stress and the hoop stress:
(1)
Axial stress
Axial stress in buried pipelines arises from thermal expansion or contraction and from Poisson’s effect due to hoop stress. It is calculated with Equation (2).
σz = σt ± σa = αEΔT + μpDi/2t
where σz is the axial stress; σt is the thermal stress caused by temperature difference; σa is the axial stress due to internal pressure (Poisson effect); E is the Young’s modulus of the pipe material; ΔT is the temperature variation; p is the internal pressure; α is the coefficient of linear thermal expansion; μ is the Poisson’s ratio; t is the wall thickness of the pipe.
(2)
Hoop stress
Hoop stress is directly induced by internal pressure and is one of the principal stresses determining the pipe’s stress state. It is given by Equation (3):
σh = pDi/2t

5.3.2. Computation Model of Pipe-in-Pipe System

As the inner pipe undergoes temperature-induced expansion or contraction, thermal stress is generated due to the restraint imposed by the outer pipe. This constraint also results in secondary stress in the outer pipe. As illustrated in Figure 22, where f denotes the frictional force between the outer pipe and the surrounding soil, the inner pipe’s thermal deformation is transferred through mechanical coupling to the outer pipe, which is assumed to be fixed at both ends [6]. The system achieves force equilibrium according to Equations (4)–(7):
Fi = Ft ± Fp
Fo = Fi ± f
Fo = σoAo
Fi = σiAi
where Fi is the axial force in the inner pipe; Fo is the axial force in the outer pipe; Ft is the axial force caused by thermal expansion of the inner pipe; Fp is the axial force due to Poisson’s effect of internal pressure; σo and σi are the axial stresses in the outer and inner pipe, respectively; Ao and Ai are the cross-sectional areas of the outer and inner pipe, respectively.

5.3.3. Validation with Extreme Condition I

The analytical and finite element results for Extreme Condition I are summarized in Table 10 and Table 11. The theoretical hoop stress in the inner pipe is σh = 57 MPa = pD/2t, consistent with the FEM result.
Thermal stress with free expansion is computed as σ’t = αEΔT = 206 MP, corresponding to a free elongation of Δl = αLΔT =0.498 m. Accounting for constrained displacement of 0.09945 m, the effective thermal stress is: σt = σ’t × (1 − 0.09945/0.498) = 124 MPa. Given a measured Poisson’s ratio of 0.26, the axial stress due to Poisson’s effect is σa = μσh = 14.82 MPa. Since Poisson and thermal stresses act in opposite directions, the net axial stress is: σi =σtσa = 109.18 MPa according to Equation (2). This matches the FEM result with only 0.06% error, confirming the validity of Equation (4).
The axial force in the inner pipe is calculated as: Fi = σiAi = 438.79 kN. Based on the soil parameters listed in Table 12, the soil friction force is computed with Equation (8).
f = μsγhLf
where μs is the friction coefficient, γ is the effective weight, h is the burial depth of the pipeline, Lf is the length of the single-sided friction zone (taken as the average influence range of the outer pipe deformation of 16.5 m), and f = 107.46 kN.
For Extreme Condition I, the inner pipe is relatively free to expand, whereas the outer pipe is heavily constrained by soil friction and end anchoring. Therefore, the load path of the thermal force is: Inner pipe → Support → Outer pipe → Soil. The thermal deformation is mainly absorbed by the inner pipe, while the thermal load is mainly resisted by the outer pipe. Hence, the axial force in the outer pipe is: Fo = f + Fi = 546.25 kN≈547.91 kN with error of 0.3%. Equation (5) is validated.

5.3.4. Validation with Extreme Condition II

The parameters and FEM results for Extreme Condition II are listed in Table 13. Theoretical hoop stress is σh = 47.5 MPa = pD/2t, consistent with the FEM result. Unrestrained thermal stress: σ’t = αEΔT = 58.6 MPa. Free expansion is Δl = αLΔT = 0.142 m. Measured displacement is 0.049867 m; thus effective thermal stress is σt = σ’t × (1 − 0.049867/0.142) = 38 MPa. The axial force generated by the Poisson effect is σa = μσh = 12.35 MPa.
Since Poisson and thermal stresses act in the same direction, σi = σt + σa = 50.35 MPa. This result differs from the FEM value by 2.25 MPa (error = 4.27%), which is within acceptable range and confirms Equation (4). Axial force of inner pipe is Fi = σiAi = 211.4 kN. Assuming outer pipe deformation influences an average length of 15.625 m, soil friction is calculated as f = 101.75 kN.
In this case, the inner pipe contracts due to a temperature decrease, while the outer pipe remains relatively unaffected due to external constraints. The inner pipe’s contraction is hindered by internal constraints or end fixities, resulting in significant axial tensile stress within the pipe. Meanwhile, the outer pipe bears minimal reaction force. Thus the axial force in the outer pipe is Fo = Fif = 109.64 kN≈111.83 kN. This confirms the accuracy of Equation (5) with an error of 1.96%.

5.4. Applicability in Normal and Slightly Acidic Water

While the proposed mechanical model has been validated for marine conditions with high salinity, its applicability extends to other aqueous environments. In normal freshwater (pH ≈ 7.0), the absence of significant salinity ensures that the thermal–mechanical coupling mechanisms remain unchanged, as the governing equations are independent of dissolved salt content. For slightly acidic water (pH 5.5–6.5), which may occur in certain industrial or inland river systems, the primary consideration is the potential for accelerated corrosion of metallic pipeline components.
It should be emphasized that the present study focuses on intact PIP systems without corrosion defects. This intact-condition analysis provides a necessary baseline for understanding the fundamental thermomechanical responses of the system, which can then be extended to cases involving material degradation. In the context of corrosion, the model can incorporate defect effects by introducing a time-dependent wall-thickness reduction based on corrosion rate data, accompanied by the corresponding reduction in Young’s modulus and yield strength. Such modifications allow simulation of different corrosion severities (e.g., uniform corrosion and localized pitting) by locally altering the finite element mesh and material property assignments. Comparative simulations between intact and corroded conditions can then quantify the increase in stress concentration, radial deformation mismatch, and potential fatigue life reduction caused by corrosion. This approach ensures that the proposed model remains applicable not only to pristine PIP systems but also as a foundation for life-extension assessment and integrity management in corrosive environments.
6. Conclusions and Limitations

6.1. Conclusions

This study develops a comprehensive finite element model to investigate the coupled thermal and mechanical behavior of Pipe-in-Pipe systems, providing detailed insights into stress distribution, deformation coordination, and failure mechanisms under extreme operating conditions. The results reveal the complex interactions between thermal expansion and mechanical loads, highlighting their impact on pipeline performance, reliability, and safety. In addition to marine environments, the model can be adapted for normal freshwater and slightly acidic water conditions by incorporating corrosion-related mechanical degradation, thereby broadening its applicability in diverse operational scenarios.
(1)
Stress distribution and deformation patterns: The inner and outer pipes exhibit non-uniform stress responses, with critical regions showing significant stress concentrations and differential displacements. The presence of axial stress significantly amplifies local stress peaks, emphasizing the necessity of considering multi-axial interactions in structural evaluations and design.
(2)
Failure mechanism and predictive capability: The model quantifies the effect of combined thermal and mechanical loads on the ultimate internal pressure, enabling accurate identification of regions prone to failure. This predictive capability supports risk assessment, preventive maintenance, and optimization of pipeline design under extreme operating conditions.
(3)
Engineering significance and future applications: The validated modeling framework provides practical guidance for material selection, structural configuration, and load management strategies. Furthermore, it establishes a foundation for future investigations into more complex coupled physical phenomena, facilitating the extension of this approach to diverse pipeline systems under varying environmental and operational scenarios.

6.2. Limitations

(1)
Simplified Environmental Conditions. The effects of hydrodynamic loading, such as wave- and current-induced forces, were not explicitly modeled, and hydrodynamic forces can significantly influence the global and local responses of subsea PIP systems. The mechanical modeling framework and stress distribution results presented herein form a theoretical and computational basis that can be extended to include hydrodynamic effects in future work. Incorporating realistic hydrodynamic loads into the model would further improve the applicability of the proposed method to deepwater engineering design.
(2)
Alternative materials, such as higher-grade steels, corrosion-resistant alloys, or fiber-reinforced composites, can be incorporated by substituting their elastic modulus, Poisson’s ratio, and coefficient of thermal expansion. Nevertheless, care must be taken when extrapolating the results to very thin-walled pipes (Do/t > 100) or materials exhibiting nonlinear plastic or creep behavior under service conditions, as these effects are not captured in the present linear elastic framework.

Author Contributions

Conceptualization, G.L. and M.S.; methodology, H.D.; software, H.D.; validation, G.L., M.S. and H.D.; formal analysis, H.D.; investigation, M.S.; resources, M.S.; data curation, M.S.; writing—original draft preparation, G.L.; writing—review and editing, M.S.; visualization, H.D.; supervision, H.D.; project administration, M.S.; funding acquisition, M.S. All authors have read and agreed to the published version of the manuscript.

Funding

This project is supported by Henan Province Science and Technology Research and Development (252102241011).

Data Availability Statement

The original contributions presented in this study are included in the article. Further inquiries can be directed to the corresponding author.

Acknowledgments

The authors sincerely thank Jinyong Wu for his valuable support in this study’s practical engineering case selection.

Conflicts of Interest

The authors declare no conflicts of interest.

Nomenclature

SymbolDescriptionUnit
Di/Doinner or outer Pipe diametermm
tWall thicknessmm
pInternal pressureMPa
EYoung’s modulusPa
LPipeline lengthm
TTemperature°C
ΔTTemperature difference°C
σzAxial stressMPa
σhHoop stressMPa
σtThermal stressMPa
σaAxial stress due to Poisson’s effectMPa
σ’tFree (unrestrained) thermal stressMPa
σoAxial stress in outer pipeMPa
σiAxial stress in inner pipeMPa
FiAxial force in inner pipekN
FoAxial force in outer pipekN
FtAxial force caused by thermal expansionkN
FpAxial force due to Poisson’s effectkN
fSoil friction forcekN
μPoisson’s ratio
μsFriction coefficient between pipe and soil
αCoefficient of linear thermal expansion°C−1
γEffective unit weight of soilN/m3
hBurial depth of pipelinem
AoCross-sectional area of outer pipem2
AiCross-sectional area of inner pipem2
vAxial displacementmm or m
NT,pAxial thermal force in inner pipe due to temperature increasekN
Nv,pAxial force induced by Poisson’s effect in inner pipekN
NEEnd force from anchoring and external pressurekN
FsFrictional resistance from seabedkN
NδAxial force due to inner pipe displacementkN
NcTensile force in outer pipekN
MzBending moment around z-axiskN·m
LfSingle-sided friction influence lengthm
cSoil cohesionkPa
φInternal friction angle of soil°
wTotal unit weight of soilN/m3

Abbreviations

AbbreviationFull Form
PIPPipe-in-Pipe
FEMFinite Element Method
ITTInterface Thermal Transfer
TMDTuned Mass Damper
VIVVortex-Induced Vibration
HP/HTHigh Pressure/High Temperature
Eq.Equation
MPaMegapascal
kNKilonewton
°CDegrees Celsius
mmMillimeter
mMeter
kPaKilopascal
SubscriptDescription
iInner pipe
oOuter pipe
tThermal
aAxial
hHoop
pPressure related/Pipe
cCarrier pipe
T,pThermal load in inner pipe
v,pPoisson effect in inner pipe

References

  1. Hu, Y.; Luo, F.; Duan, S.; Zhou, W.; Zhu, D. Mechanical and dielectric properties of SiCf/SiC composites fabricated by PIP combined with CIP process. Ceram. Int. 2016, 42, 6800–6806. [Google Scholar] [CrossRef]
  2. Wang, Z.; Chen, Z.; Liu, H.; He, Y.; Ma, K. Buckling response of pipe-in-pipe systems subjected to bending. Trans. Tianjin Univ. 2015, 21, 492–500. [Google Scholar] [CrossRef]
  3. Jasim, L.; Alkhabbaz, A.; Hamzah, H. Preferred location of the porous sleeve in a concentric annulus depending on the thermal insulation. Proc. Inst. Mech. Eng. Part C J. Mech. Eng. Sci. 2023, 237, 2002–2013. [Google Scholar] [CrossRef]
  4. Alkhabbaz, A.; Dawood, A.S. Mixed convection heat transfer in a ventilated enclosure with and without a saturated porous medium. J. Porous Media 2016, 19, 347–366. [Google Scholar] [CrossRef]
  5. Sriskandarajah, T.; Ragupathy, P.; Rao, V. Design aspects of pipe-in-pipe systems for HP-HT applications. In Proceedings of the Offshore Technology Conference, Kuala Lumpur, Malaysia, 22–25 March 2016; OTC: Houston, TX, USA, 2016; pp. D21S–D26S. [Google Scholar]
  6. Qiu, G.; Sun, M. Interaction Mechanism of Inter-Pipes in Double-Layer Pipelines and a Mechanical Model with Differential Thermal Deformation. Processes 2025, 13, 762. [Google Scholar] [CrossRef]
  7. Qu, H.; Li, J.; Tang, Z.; Li, W.; Du, M.; Feng, R. Impact resistance and damage evaluation of corroded circular steel tubes. J. Constr. Steel Res. 2025, 235, 109888. [Google Scholar] [CrossRef]
  8. Jones, N.; Birch, R.S. Low-velocity impact of pressurised pipelines. Int. J. Impact Eng. 2010, 37, 207–219. [Google Scholar] [CrossRef]
  9. Zeinoddini, M.; Harding, J.E.; Parke, G. Axially pre-loaded steel tubes subjected to lateral impacts (a numerical simulation). Int. J. Impact Eng. 2008, 35, 1267–1279. [Google Scholar] [CrossRef]
  10. Zhu, L.; Liu, Q.; Jones, N.; Chen, M. Experimental study on the deformation of fully clamped pipes under lateral impact. Int. J. Impact Eng. 2018, 111, 94–105. [Google Scholar] [CrossRef]
  11. Karampour, H.; Alrsai, M.; Albermani, F.; Guan, H.; Jeng, D. Propagation buckling in subsea pipe-in-pipe systems. J. Eng. Mech. 2017, 143, 4017113. [Google Scholar] [CrossRef]
  12. Bruton, D.; Carr, M.; Crawford, M.; Poiate, E. The safe design of hot on-bottom pipelines with lateral buckling using the design guideline developed by the safebuck joint industry project. In Proceedings of the Deep Offshore Technology Conference, Vitoria, Espirito Santo, Brazil, 2–5 May 2005. [Google Scholar]
  13. Goplen, S.; Fyrileiv, O.; Grandal, J.P.; Børsheim, L. Global buckling of pipe-in-pipe: Structural response and design criteria. In Proceedings of the 30th International Conference on Offshore Mechanics and Arctic Engineering, Rotterdam, The Netherlands, 19–24 June 2011; ASME: New York, NY, USA, 2011; pp. 777–784. [Google Scholar]
  14. Kristoffersen, A.S.; Asklund, P.O.; Nystrøm, P.R. Pipe-in-pipe global buckling and trawl design on uneven seabed. In Proceedings of the ISOPE International Ocean and Polar Engineering Conference, Rhodes, Greece, 17–22 June 2012; ISOPE: Mountain View, CA, USA, 2012; pp. 12–300. [Google Scholar]
  15. Nikoo, H.M.; Bi, K.; Hao, H. Passive vibration control of cylindrical offshore components using pipe-in-pipe (PIP) concept: An analytical study. Ocean. Eng. 2017, 142, 39–50. [Google Scholar] [CrossRef]
  16. Nikoo, H.M.; Bi, K.; Hao, H. Textured pipe-in-pipe system: A compound passive technique for vortex-induced vibration control. Appl. Ocean. Res. 2020, 95, 102044. [Google Scholar] [CrossRef]
  17. Bi, K.; Hao, H. Using pipe-in-pipe systems for subsea pipeline vibration control. Eng. Struct. 2016, 109, 75–84. [Google Scholar] [CrossRef]
  18. Fyrileiv, O.; Aamlid, O.; Andreassen, E. Pipeline free spans: Influence of internal pressure. In Proceedings of the 29th International Conference on Offshore Mechanics and Arctic Engineering, Shanghai, China, 6–11 June 2010; ASME: New York, NY, USA, 2010; pp. 651–658. [Google Scholar]
  19. Liu, Z.Y.; Jiang, T.L.; Wang, L.; Dai, H.L. Nonplanar flow-induced vibrations of a cantilevered PIP structure system concurrently subjected to internal and cross flows. Acta Mech. Sin. 2019, 35, 1241–1256. [Google Scholar] [CrossRef]
  20. Bokaian, A. Thermal expansion of pipe-in-pipe systems. Mar. Struct. 2004, 17, 475–500. [Google Scholar] [CrossRef]
  21. Guo, Y.; Zhu, B.; Zhao, X.; Chen, B.; Li, Y. Dynamic characteristics and stability of pipe-in-pipe system conveying two-phase flow in thermal environment. Appl. Ocean. Res. 2020, 103, 102333. [Google Scholar] [CrossRef]
  22. Paul, S.; Sathananthan, R.; Legge, M. Thermal Design Approaches for Pipe-in-Pipe Tiebacks for the Transportation of HP/HT Oil and Gas. In Proceedings of the Offshore Technology Conference, Houston, TX, USA, 2–5 May 2016; OTC: Houston, TX, USA, 2016; pp. D21S–D26S. [Google Scholar]
  23. Kim, H.; Lee, J.; Kim, T.; Park, S.J.; Kim, H. Advanced thermal fluid leakage detection system with machine learning algorithm for pipe-in-pipe structure. Case Stud. Therm. Eng. 2023, 42, 102747. [Google Scholar] [CrossRef]
  24. Moawed, M.A.; Ibrahim, E.; Gomaa, A. Thermal performance of a pipe in pipe heat exchanger with sinusoidal inner pipe. Energ. Convers. Manage 2008, 49, 678–686. [Google Scholar] [CrossRef]
  25. Cerqueira, D.R.; Su, J.; Estefen, S.F. Simulation of transient heat transfer of sandwich pipes with active electrical heating. In Proceedings of the 23rd International Conference on Offshore Mechanics and Arctic Engineering, Vancouver, BC, Canada, 20–25 June 2004; pp. 105–111. [Google Scholar]
  26. Su, J.; Regis, C.R.; Botto, A. Thermal analysis of combined active heating and passive insulation of deepwater pipelines. In Proceedings of the 21st International Conference on Offshore Mechanics and Arctic Engineering, Oslo, Norway, 23–28 June 2002; pp. 185–190. [Google Scholar]
  27. Su, J.; Cerqueira, D.R.; Estefen, S.F. Thermal analysis of sandwich pipes with active electrical heating. In Proceedings of the 22nd International Conference on Offshore Mechanics and Arctic Engineering, Cancun, Mexico, 8–13 June 2003; pp. 809–814. [Google Scholar]
  28. Carr, M.; Sinclair, F.; Bruton, D. Pipeline walking-understanding the field layout challenges, and analytical solutions developed for the SAFEBUCK JIP. In Proceedings of the Offshore Technology Conference, Houston, TX, USA, 1–4 May 2006; OTC: Houston, TX, USA, 2006; p. 17945. [Google Scholar]
  29. DNV-OS-F101; Offshore Standard: Submarine Pipeline Systems. Det Norske Veritas: Hovik, Norway, 2000.
  30. Tornes, K.; Ose, B.A.; Jury, J.; Thomson, P. Axial Creeping of High Temperature Flowlines Caused By Soil Ratcheting. In Conference on Offshore Mechanics and Arctic Engineering; ASME: New York, NY, USA, 2000. [Google Scholar]
  31. Ni, P. Nonlinear Soil-Structure Interaction for Buried Pressure Pipes Under Differential Ground Motion. Ph.D. Thesis, Queen’s University, Kingston, ON, Canada, 2016. [Google Scholar]
  32. Levings, J.; Sritharan, S. Effects of cold temperature and strain rate on the stress-strain behavior of ASTM A706 grade 420 (60) steel reinforcement. J. Mater. Civil. Eng. 2012, 24, 1441–1449. [Google Scholar] [CrossRef]
  33. Lou, T.; Wang, W. Mechanical properties of mild steel under combined effects of pre-damage and elevated temperatures in post-earthquake fire scenarios. J. Constr. Steel Res. 2022, 189, 107102. [Google Scholar] [CrossRef]
Figure 1. Cross-sectional view of the double-layer pipe (PIP) [6].
Processes 13 03193 g001
Figure 2. Finite element model. (a) Single-pipe model; (b) Detailed drawing of wall thickness (encryption of connection positions); (c) Double-pipe model; (d) Connection construction model; (e) Constraint conditions and connection units.
Processes 13 03193 g002
Figure 3. Typical rigid joint connection diagram. (Note: The red circle area is the rigid connection joint between the inner and outer pipes, and its finite element model is shown in Figure 2d. The detailed diagram is shown in the Figure 4).
Processes 13 03193 g003
Figure 4. Rigid joint connection.
Processes 13 03193 g004
Figure 5. Boundary conditions.
Processes 13 03193 g005
Figure 6. Equivalent stress distribution of inner pipe with Extreme Condition I (unit: Pa). (Note: The detailed image of the red area on the left is shown in the figure on the right. ‘DMX’ is the ‘Maximum deformation’, ‘SMN’ is the ‘Minimum stress’, and ‘SMX’ is the ‘Maximum stress’. (The same below)).
Processes 13 03193 g006
Figure 7. Equivalent stress distribution of the outer pipe with Extreme Condition I (unit: Pa).
Processes 13 03193 g007
Figure 8. Equivalent stress distribution of inner pipe with Extreme Condition II (unit: Pa).
Processes 13 03193 g008
Figure 9. Equivalent stress distribution of outer pipe with Extreme Condition II (unit: Pa).
Processes 13 03193 g009
Figure 10. Axial stress distribution of inner pipe at 0° with Extreme Condition I (unit: Pa).
Processes 13 03193 g010
Figure 11. Axial stress distribution of inner pipe at 90° with Extreme Condition I (unit: Pa).
Processes 13 03193 g011
Figure 12. Axial stress distribution of inner pipe at 180° with Extreme Condition I (unit: Pa).
Processes 13 03193 g012
Figure 13. Axial stress distribution of inner pipe at 270° with Extreme Condition I (unit: Pa).
Processes 13 03193 g013
Figure 14. Bending moment diagram at inner pipe ends with Extreme Condition I.
Processes 13 03193 g014
Figure 15. Circumferential stress of inner pipe at 0° with Extreme Condition I.
Processes 13 03193 g015
Figure 16. Axial stress distribution of outer pipe at 0° with Extreme Condition I (unit: Pa).
Processes 13 03193 g016
Figure 17. Axial stress distribution of outer Pipe at 90° with Extreme Condition I (unit: Pa).
Processes 13 03193 g017
Figure 18. Axial Stress Distribution of Outer Pipe at 180° with Extreme Condition I (unit: Pa).
Processes 13 03193 g018
Figure 19. Axial stress distribution of outer pipe at 270° with Extreme Condition I (unit: Pa).
Processes 13 03193 g019
Figure 20. Force diagram of outer pipe with Extreme Condition I.
Processes 13 03193 g020
Figure 21. End-region stress model of the pipe-in-pipe system. (Note: M is the bending moment generated by the differential deformation of the inner and outer pipes, points a and b are the connection positions of the inner and outer pipes, and points c and d are the positions where the bending moment acts).
Processes 13 03193 g021
Figure 22. Schematic of pipe-in-pipe stress transfer with thermal gradient.
Processes 13 03193 g022
Table 1. The results of mesh sensitivity analysis.
LevelCoarseMediumFine
length × width (mm)200 × 2100 × 150 × 120 × 110 × 0.750.75 × 0.50.5 × 0.20.5 × 0.10.1 × 0.1
maximum stress of the
inner pipe (MPa)
245232220205190184184184184
Table 2. Key design and material parameters of the PIP system.
Pipe SectionParameterSymbolValuePipe SectionParameterSymbolValue
inner pipediameter/mmDi168outer pipediameter/mmDo273
wall thickness/mmti9wall thickness/mmto9
medium density/kg/m3ρ7850soil internal friction/°φ20
axial friction coefficientμs0.26
Table 3. Comparison of analytical and finite element results for the PIP model.
Pipeline LengthParameterTheoretical ValueFem Result
long pipeline
(11,000 m)
end displacement/mm784780.5
maximum axial force in inner pipe/kN−1229−1221
tensile force at outer pipe end/kN756761.1
short pipeline
(6000 m)
end displacement/mm780778.5
maximum axial force in inner pipe/kN−613−615.1
tensile force at outer pipe end/kN806810.3
Table 4. Operating conditions and parameters.
ConditionInternal Pressure (MPa)Inlet Temp (°C)Outlet Temp (°C)Ambient Temp (°C)
Extreme I6.06540−18
Extreme II5.0−5-18.6
Table 5. Stress values of inner pipe with Extreme Condition I.
Stress TypeAxial Stress (MPa)Circumferential Stress (MPa)
direction90°
maximum−149−109
minimum−94.8−109
average−109−109
Note: The average stress values are computed as the mean of nodal stress values across the entire pipe segment.
Table 6. Stress of outer pipe with Extreme Condition I.
Stress TypeAxial StressCircumferential Stress
direction90°
maximum (MPa)96.882.3
minimum (MPa)81.182.3
average (MPa)82.482.3
Note: The average stress represents the mean value across all nodes in the pipeline along each specified direction.
Table 7. Stress characteristics of inner and outer pipes under different loading models.
ConditionLoading TypeStress Model TypeInner Pipe StressOuter Pipe Stress
Iinner pipe thermal expansion + internal pressureType Icompressivetensile
IIinner pipe thermal contraction + internal pressureType IItensilecompressive
Table 8. Stress influence zones with Extreme Condition I.
ParameterOuter Pipe 0°Outer Pipe 180°Inner Pipe 0°Inner Pipe 180°
end a (m)16.5016.7510.2510.50
end b (m)16.2516.5010.0010.25
Average (m)16.3816.7310.1310.38
Relative Sensitivity (%)6.556.694.054.15
Note: Relative sensitivity (%) = (Length a + Length b)/Baseline Length × 100%.
Table 9. Influence range of pipe segments with Extreme Condition II.
ParameterOuter Pipe 0°Outer Pipe 180°Inner Pipe 0°Inner Pipe 180°
end a (m)15.7518.2513.7513.25
end b (m)15.5018.0013.5013.00
average (m)15.6318.1313.6313.13
Relative Sensitivity (%)6.257.255.455.25
Note: Relative sensitivity (%) = (Length a + Length b)/Baseline Length × 100%.
Table 10. Parameters for Extreme Condition I.
Thermal Expansion CoefficientΔT (°C)Ao (m2)Ai (m2)Pipe Length (m)Young’s Modulus (Pa)
1.2 × 10−5830.0066570.0040195002.07 × 1011
Table 11. FEM stress results for Extreme Condition I.
Inner Pipe Displacement (m)Outer Pipe Displacement (m)Average Axial Stress (Outer Pipe) (MPa)Average Axial Stress (Inner Pipe) (MPa)Hoop Stress (Inner Pipe) (MPa)
0.099450.09947882.306109.2557
Table 12. Soil Parameters.
Cohesion (kPa)Effective Unit Weight (N/m3)Internal Friction Angle (°)Total Unit Weight (N/m3)Friction Coefficient
301670020197000.26
Table 13. FEM Stress Results for Extreme Condition II.
Inner Pipe Displacement (m)Average Axial Stress (Outer Pipe) (MPa)Average Axial Stress (Inner Pipe) (MPa)Temperature Differential (°C)
0.04986716.852.6−23.6
Disclaimer/Publisher’s Note: The statements, opinions and data contained in all publications are solely those of the individual author(s) and contributor(s) and not of MDPI and/or the editor(s). MDPI and/or the editor(s) disclaim responsibility for any injury to people or property resulting from any ideas, methods, instructions or products referred to in the content.