Article

Simulation of Compaction Process of Tight Sandstone in Xiashihezi Formation, North Ordos Basin: Insights from SEM, EDS and MIP

Geology Exploration and Development Research Institute, CNPC Chuanqing Drilling Engineering Co., Ltd., Chengdu 610051, China
*
Author to whom correspondence should be addressed.
Processes 2025, 13(10), 3191; https://doi.org/10.3390/pr13103191
Submission received: 27 August 2025 / Revised: 25 September 2025 / Accepted: 29 September 2025 / Published: 8 October 2025
(This article belongs to the Topic Exploitation and Underground Storage of Oil and Gas)

Abstract

The Permian Xiashihezi Formation in the Ordos Basin is a typical tight sandstone gas reservoir, which is characterized by low porosity and strong heterogeneity. Diagenesis plays a crucial role in controlling reservoir quality. However, the multiple phases and types of diagenetic processes throughout geological history make the compaction mechanisms highly complex. This study employed a high-temperature and high-pressure diagenesis simulation system to conduct geological simulation experiments. Typical reservoir samples from the 2nd Member of the Permian Xiashihezi Formation were selected for these simulations. The experiments replicated the diagenetic evolution of the reservoirs under various temperature, pressure, and fluid conditions, successfully reproducing the diagenetic sequences. The diagenetic sequence included early-stage porosity reduction through compaction, early carbonate cementation, quartz overgrowth, chlorite rim formation, feldspar dissolution, and late-stage illite and quartz cementation. Mechanical compaction is the primary factor reducing reservoir porosity, exhibiting a distinct four-stage porosity reduction pattern: (1) continuous burial stage (>4000 m); (2) stagnation stage of burial (3900 m–4100 m); (3) the secondary continuous burial stage (>5000 m); (4) tectonic uplift stage (3600 m). The experiments confirmed that the formation of various authigenic minerals is strictly controlled by temperature, pressure, and fluid chemistry. Chlorite rims formed in an alkaline environment enriched with Fe2+ and Mg2+ (simulated temperatures of 280–295 °C), effectively inhibiting quartz overgrowth. Illite appeared at higher temperatures (>300 °C) in platy or fibrous forms. Feldspar dissolution was noticeable upon injection of acidic fluids (simulated organic acids), providing material for authigenic quartz and kaolinite. The key mineral composition significantly impacts reservoir diagenesis. The dissolution released Mg2+ and Fe2+ ions, crucial for forming early chlorite rims in the overlying sandstones, confirming the importance of inter-strata interactions in “source-facies coupling.” Through physical simulation methods, this study deepened the understanding of the diagenetic evolution and compaction mechanisms of tight sandstones. This provides significant experimental evidence and theoretical support for predicting “sweet spot” reservoirs in the area.

1. Introduction

Sandstone is composed of particles such as quartz and feldspar. Tight sandstone is a special rock mass formed after the transformation of sandstone by diagenesis, and is widely distributed in oil and gas basins around the world. Tight sandstone reservoirs are a critical focus of global oil and gas exploration due to their significant resource potential [1,2]. The United States is the earliest and most successful country in the development and utilization of tight sandstone gas. Tight sandstone gas has been discovered in 23 basins across the country, primarily concentrated in the Rocky Mountain region and along the Gulf Coast. The remaining proven recoverable reserves of tight sandstone gas in the U.S. exceed 5 × 10¹² cubic meters. As of 2010, production from tight sandstone gas accounted for 26% of the total natural gas output. In recent years, significant tight sandstone gas reserves have been found in China’s Ordos Basin, Sichuan Basin, Tarim Basin, and Bohai Bay Basin [3]. The favorable exploration area is approximately 320,000 square kilometers, with recoverable resources estimated between 8 and 11 × 1012 cubic meters [3]. Currently, the exploration and development technology for tight sandstone gas in China is well established and has the potential for accelerated growth, indicating that it will play a crucial role in the future development of natural gas in the country [4,5,6,7]. The formation process of tight sandstone and the timing of hydrocarbon charging are key issues affecting the selection of sweet-spots [5,6,7,8,9].
The Upper Triassic Permian Xiashihezi Formation in the Ordos Basin, China, is a prime example of a thick tight sandstone gas reservoir [10,11,12]. However, its poor reservoir properties and strong heterogeneity severely constrain efficient oil and gas exploration and development [13]. The spatial variation in reservoir quality is primarily controlled by both depositional and diagenetic processes [10]. Depositional processes determine the initial material composition and structural characteristics of the reservoir. Conversely, diagenetic processes continuously modify the reservoir during burial, ultimately determining its final quality [14,15]. The Permian Xiashihezi Formation has undergone complex tectonic evolution and burial history, experiencing intense compaction [16], multiple phases of carbonate and siliceous cementation [17], complex clay mineral transformations, and dissolution processes [18]. As a result, it has developed diverse diagenetic mineral assemblages and pore structures [19,20,21]. The intensity of these diagenetic processes varies across different regions and layers, leading to distinct compaction patterns [22]. For instance, the western Ordos region exhibits strong compaction, the northwestern Ordos Basin shows intense calcareous cementation, and central Ordos Basin has a composite compaction pattern [22,23,24]. However, these understandings are primarily based on static observations and analyses of current geological samples [25,26,27,28]. The overlapping and interdependent nature of various diagenetic processes makes it challenging to precisely determine the specific contributions and control mechanisms of individual diagenetic events on reservoir pore evolution [29]. Diagenetic physical simulation experiments offer an effective way to disentangle these complex diagenetic processes. By replicating subsurface temperature, pressure, and fluid conditions in the laboratory, we can forward-simulate the entire diagenetic evolution of sandstone from deposition to deep burial [26,27,28,29]. This enables dynamic observation of changes in pore structure, the formation and dissolution of authigenic minerals, and reveals the mechanisms of different diagenetic processes and their impact on reservoir properties [21,22,23].
This study aimed to achieve the following key scientific objectives through high-temperature and high-pressure diagenetic physical simulation experiments: (1) systematically recreate the critical diagenetic evolution sequence of typical sandstone reservoirs in the Permian Xiashihezi Formation of the Ordos Basin; (2) quantitatively evaluate the relative contributions of compaction, cementation, and dissolution to reservoir compaction; (3) uncover the ion migration patterns and water-rock interaction mechanisms under different diagenetic environments, particularly the influence of underlying strata on reservoir diagenesis. (4) Develop an experimental-based diagenetic evolution model to provide a theoretical basis for the formation mechanisms of “sweet-spot” tight sandstone reservoirs. The results of this study contribute to understanding the formation process and spatial distribution of sweet-spots in tight sandstone, and provide scientific basis for the selection of sweet-spots in tight sandstone in other regions.

2. Geological Setting

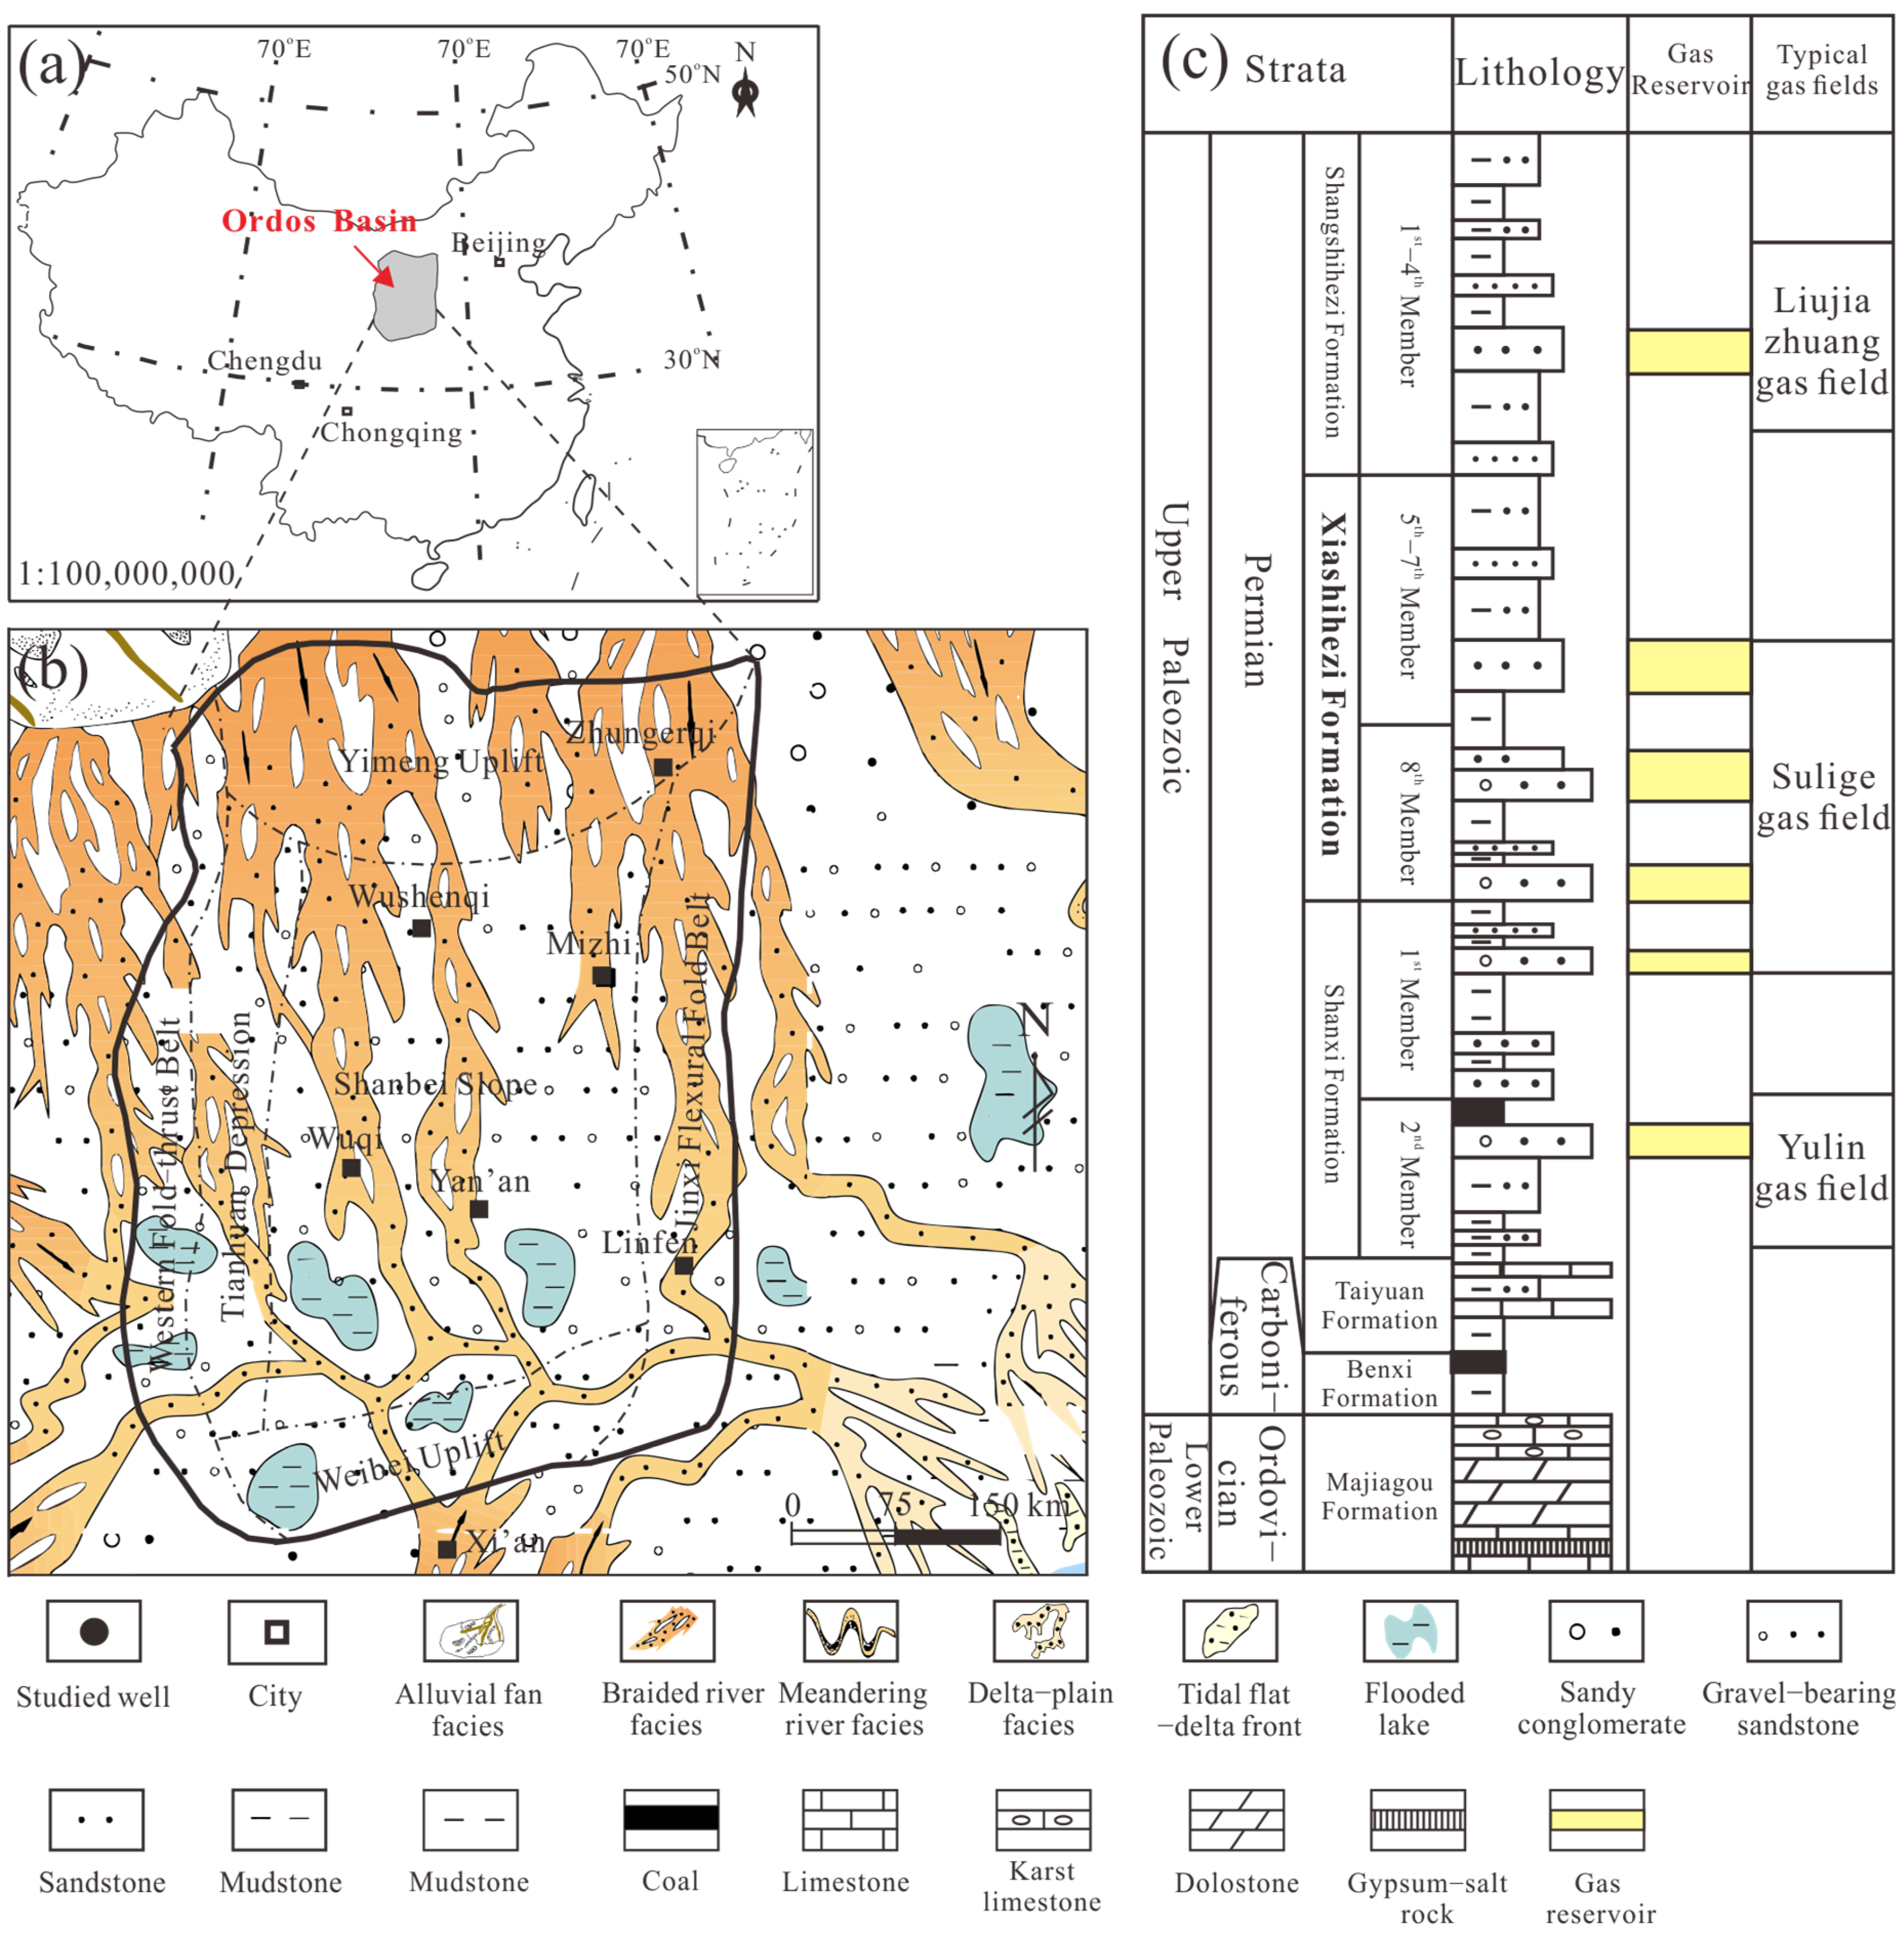
The study area is located in the Ordos Basin of North China (Figure 1a). The Ordos Basin is a large sedimentary basin with weak deformation, a multi-stage tectonic history, and diverse depositional environments. It covers about 250,000 km2 and trends north–south, forming an asymmetric syncline that is gentle to the east and steep to the west [12]. Based on basement characteristics, tectonic evolution, and structural features, the basin is divided into six units: the Yimeng Uplift, Weibei Uplift, Western Shanxi fold belt, Shaanbei Slope, Tianhuan Depression, and the western margin thrust belt. The Sulige Gas-field lies in the northwestern part of the Yishan Slope [17]. In the Late Paleozoic, the Ordos Basin occupied the western part of the North China Platform. During the Carboniferous to early Permian, it formed a transitional setting between marine and terrestrial environments under a humid climate, depositing sand- and mud-rich strata with coal. By the late Permian, conditions shifted to arid continental deposition. Building on this setting, during deposition of the Shanxi and Xiashihezi formations the basin gently tilted from a higher north to a lower south, and sediment supply came mainly from the north. In the study area, most detritus was derived from Proterozoic source rocks north of Hangjinqi area. From north to south, depositional environments graded from alluvial fans to rivers, deltas, and lakes, and repeated lake expansion and contraction produced vertically stacked, multi-cycle successions (Figure 1b). During deposition of the Xiashihezi Formation, the study area was a land-based setting dominated by river deposition (Figure 1c). By the end of the Caledonian event, the Ordos Basin had undergone more than 100 million years of uplift and erosion, leaving no deposits from the Late Ordovician to Early Carboniferous [19]. This process planed the landscape to a broad, low-relief surface that, during the Late Carboniferous to Early Permian, received deposits as conditions shifted from coastal-marine to continental rivers and lakes. By the time the Xiashihezi Formation was deposited, the region had become a vast, low-relief swamp in a humid climate with abundant vegetation, which limited the lateral migration and meandering of river-channels.

3. Materials and Methods

3.1. Experimental Equipment
The physical simulation experiments were conducted using the “Reservoir Diagenesis Simulation System” at the China Petroleum Exploration and Development Research Institute. This system comprises four main components: a reaction chamber, pressure supply, fluid supply, and control assembly. The core of the system consists of six high-temperature, high-pressure reactors connected in parallel. It is capable of achieving a maximum temperature of 300 °C, a maximum static rock pressure of 250 MPa (equivalent to a formation depth of 8000 m), and continuous injection of various fluids (acidic and basic) at pressures up to 100 MPa. By simulating the complete processes of rock compaction, cementation, and dissolution, this system dynamically studies the mechanisms of water-rock interactions and the evolution of reservoir porosity.
Figure 1. (a) Location of the Ordos Basin. (b) Schematic diagram of sedimentary facies during Permian Xiashihezi Formation deposition (modified from [12]). (c) Stratigraphic column of Permian Xiashihezi Formation and other strata.
Processes 13 03191 g001

3.2. Geological Modeling Process

The Xiashihezi Formation in the northern Ordos Basin was deposited approximately 270 Ma years ago, and its stratigraphic subsidence and uplift can be categorized into four stages: (1) The continuous burial stage, which lasted from 270 to 200 Ma ago, during which the Xiashihezi Formation gradually subsided to about 4100 m. (2) The stagnation stage of burial, occurring from 200 to 140 Ma ago, during which the depth of the Xiashihezi Formation stabilized between 3900 m and 4100 m. (3) The secondary continuous burial stage, from 140 to 100 Ma ago, when the burial depth rapidly increased to approximately 5600 m. (4) The tectonic uplift stage, which has persisted from 140 Ma ago to the present, resulting in an uplift of about 3600 m. This diagenetic physical simulation experiment aims to replicate the unique burial processes of the Ordos Basin. However, the significant differences between the duration of the experiment and actual geological time make it impossible for the simulation to perfectly mirror real geological conditions. Therefore, when compensating for geological time using experimental temperatures and pressures, the simulation primarily considers actual burial history while also taking into account the feasibility of the available experimental equipment.

3.3. Experimental Process

The core samples of the Xiashihezi Formation were obtained from CNPC’s drilling wells in the northern part of the Ordos Basin. Based on the thin-section identification and X-ray diffraction results of core samples from the Permian Xiashihezi Formation (Table 1), artificial sandstone samples were prepared according to the mineral mass percentages (total weight 100 g). The artificial sandstone samples mainly comprised quartz (52%), potassium feldspar (12%), plagioclase (8%), debris (14%), and matrix (9%). These materials come from China University of Geosciences (Wuhan).
The physical simulation experiments utilized six reactors to replicate various stages from shallow to deep burial. The maximum simulated temperature was 360 °C, with a maximum formation pressure of 170 MPa, simulating a depth of approximately 5500 m. In order to simulate the diagenetic environment dominated by formation water to the greatest extent possible (Table 2). During the experiments, different fluids were injected in stages to simulate various diagenetic environments. The fluid types included distilled water (to simulate early compaction), a CaCl2-MgCl2-Na2CO3 solution (for early carbonate cementation), an FeCl2-MgCl2 solution (for chlorite precipitation), and dilute acetic acid (to simulate organic acid dissolution) [30,31]. Considering the volcanic rock debris and biotite significantly impacts the development of chlorite in the Permian Xiashihezi Formation. To simulate real geological conditions, the samples were composed of three parts. The bottom of the sample was 3 cm thick mixture composed of volcanic rock debris and biotite, the middle was 5 cm thick Permian Xiashihezi mudstone, and the top was 5 cm thick Permian Xiashihezi sandstone (Table 3).

3.4. Supporting Testing Methods

After the physical simulation experiments, we conducted a systematic analysis of the extracted solid and liquid samples from different diagenetic simulation stages. The solid samples (diagenetic altered cores) were subjected to macroscopic description, thin section preparation, microscopic identification, scanning electron microscopy (SEM), and energy-dispersive spectroscopy (EDS) analysis to determine compaction levels, pore structure, and the morphology and composition of authigenic minerals. Microscopic identification is carried out using a Carl Zeiss ScopeA1 microscope (Oberkochen, Baden-Württemberg, Germany). For SEM and EDS, the samples were first prepared into cubes measuring 20 mm × 20 mm × 10 mm, and then mechanical polishing, argon ion polishing, and short-time gold spraying were carried out successively. The experimental instrument used was an FEI Quanta 650 FEG SEM (FEI Corporation, Hillsboro, OR, USA). The liquid samples (reaction fluids collected at different diagenetic simulation stages) were analyzed using inductively coupled plasma optical emission spectrometry (ICP-OES) to measure major and trace ion concentrations, aiding in the analysis of ion migration patterns during diagenesis. ICP-OES is produced by Thermo Fisher Scientific, headquartered in Waltham, MA, USA. The clay mineral content of drilling well is obtained from the X-ray diffraction (XRD) results of core samples. The XRD measurements were carried out using a MRD X-ray diffractometer (model X’Pert3, Malvern Panalytical Corporation, Amsterdam, The Netherlands).

4. Results of Physical Simulation

4.1. Diagenesis Type

4.1.1. Compaction Effect

The physical simulation experiments successfully produced cylindrical rock samples with varying degrees of consolidation and burial stages. As the simulated temperature and pressure increased (Figure 2), the samples’ consolidation and density significantly increased. Microscopic observations showed that with increased simulated burial depth, compaction effects intensified (Figure 2a). In the shallow burial stage (Reactor 6, simulated depth <2000 m), grains exhibited point contacts (Figure 2a), with primary porosity well-developed. Moving to the intermediate burial stage (Reactor 4, simulated depth 2800 m) (Figure 2b), grain contacts shifted to point-line contacts, and rigid grains (quartz) began to show fractures (Figure 2c). In the deep burial stage (Reactor 2, simulated depth 4200 m), line and concave–convex contacts dominated (Figure 2d,e), with plastic grains deforming and rigid grains commonly fracturing (Figure 2f).
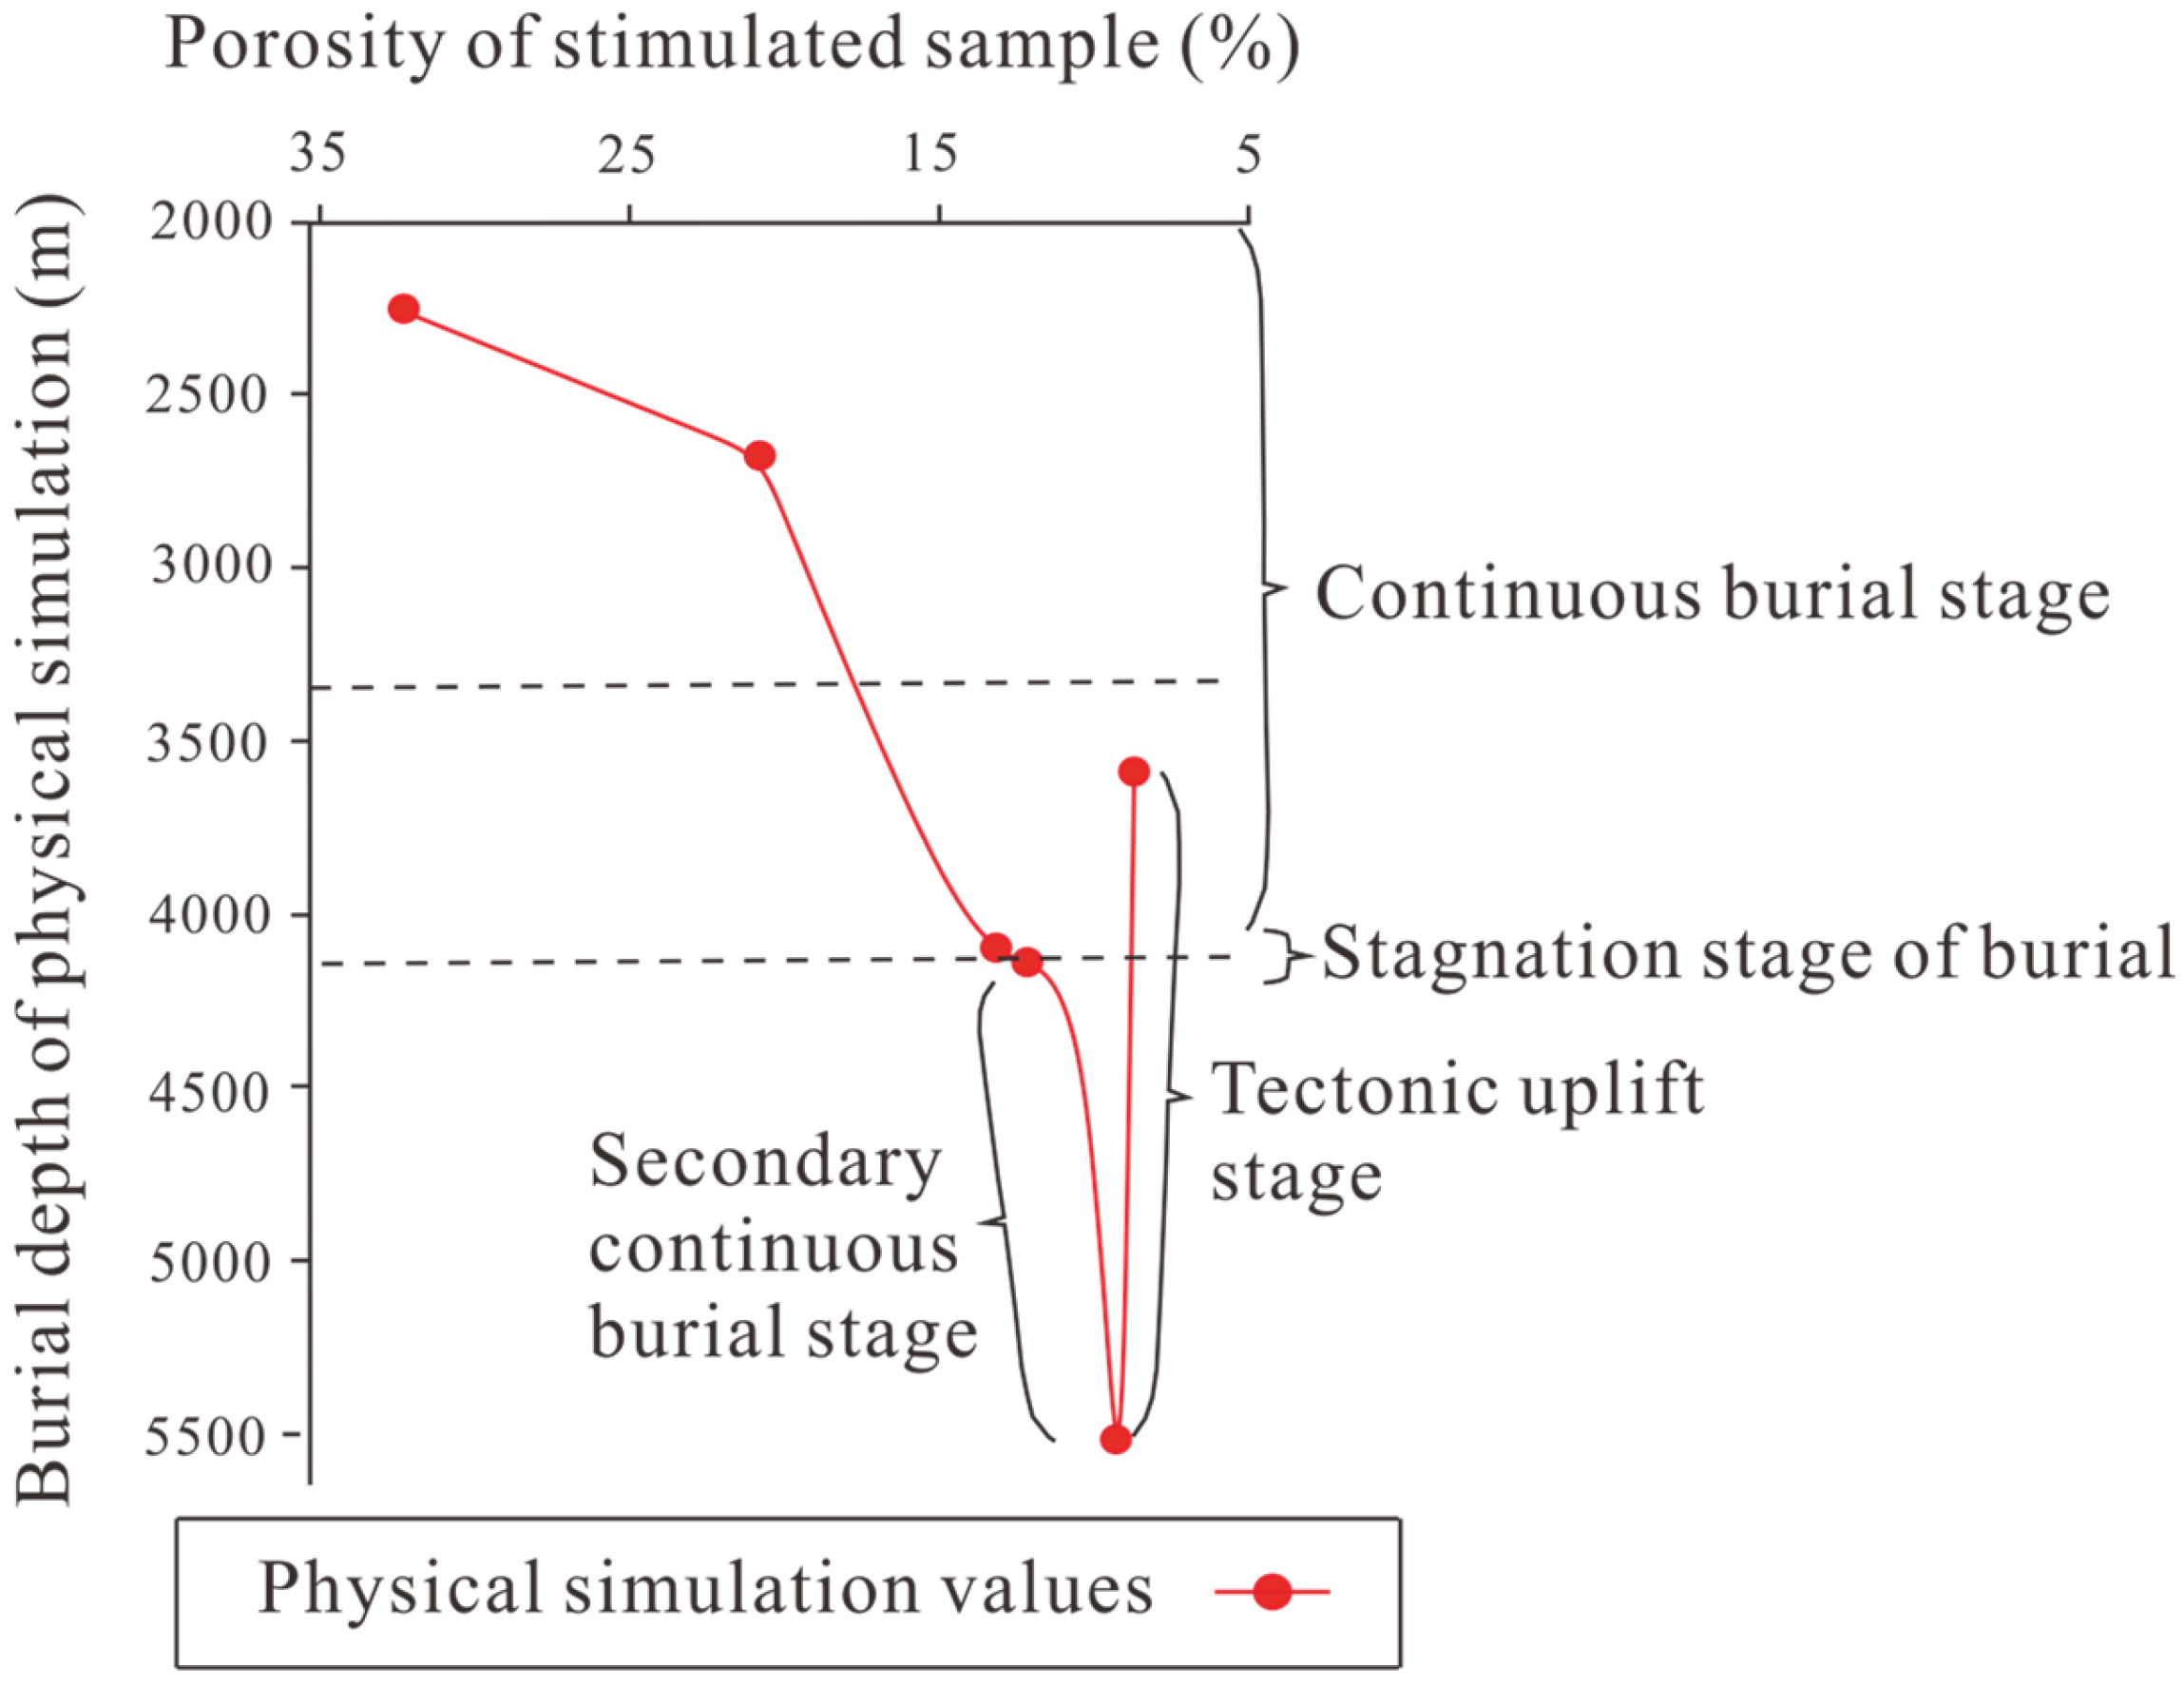
Quantitative analysis of the simulation samples through image analysis revealed that porosity decreased in three distinct stages with increasing simulated depth (Figure 3). The first stage is the rapid porosity reduction stage (<2700 m), where grain rearrangement and mechanical compaction quickly reduced porosity from an initial 32.25% to about 18%. In the porosity preservation stage (2700–4100 m), the rate of porosity reduction slowed, decreasing from 10.83% to 8.89%. This indicates that the grain framework had stabilized, and the efficiency of porosity reduction due to compaction alone had decreased. In the slow porosity reduction stage (>4100 m), porosity further decreased to 5.7%. During this stage, grain fracturing intensified, with the resulting small fragments filling residual pores, thereby further reducing porosity.

4.1.2. Mineral Cementation

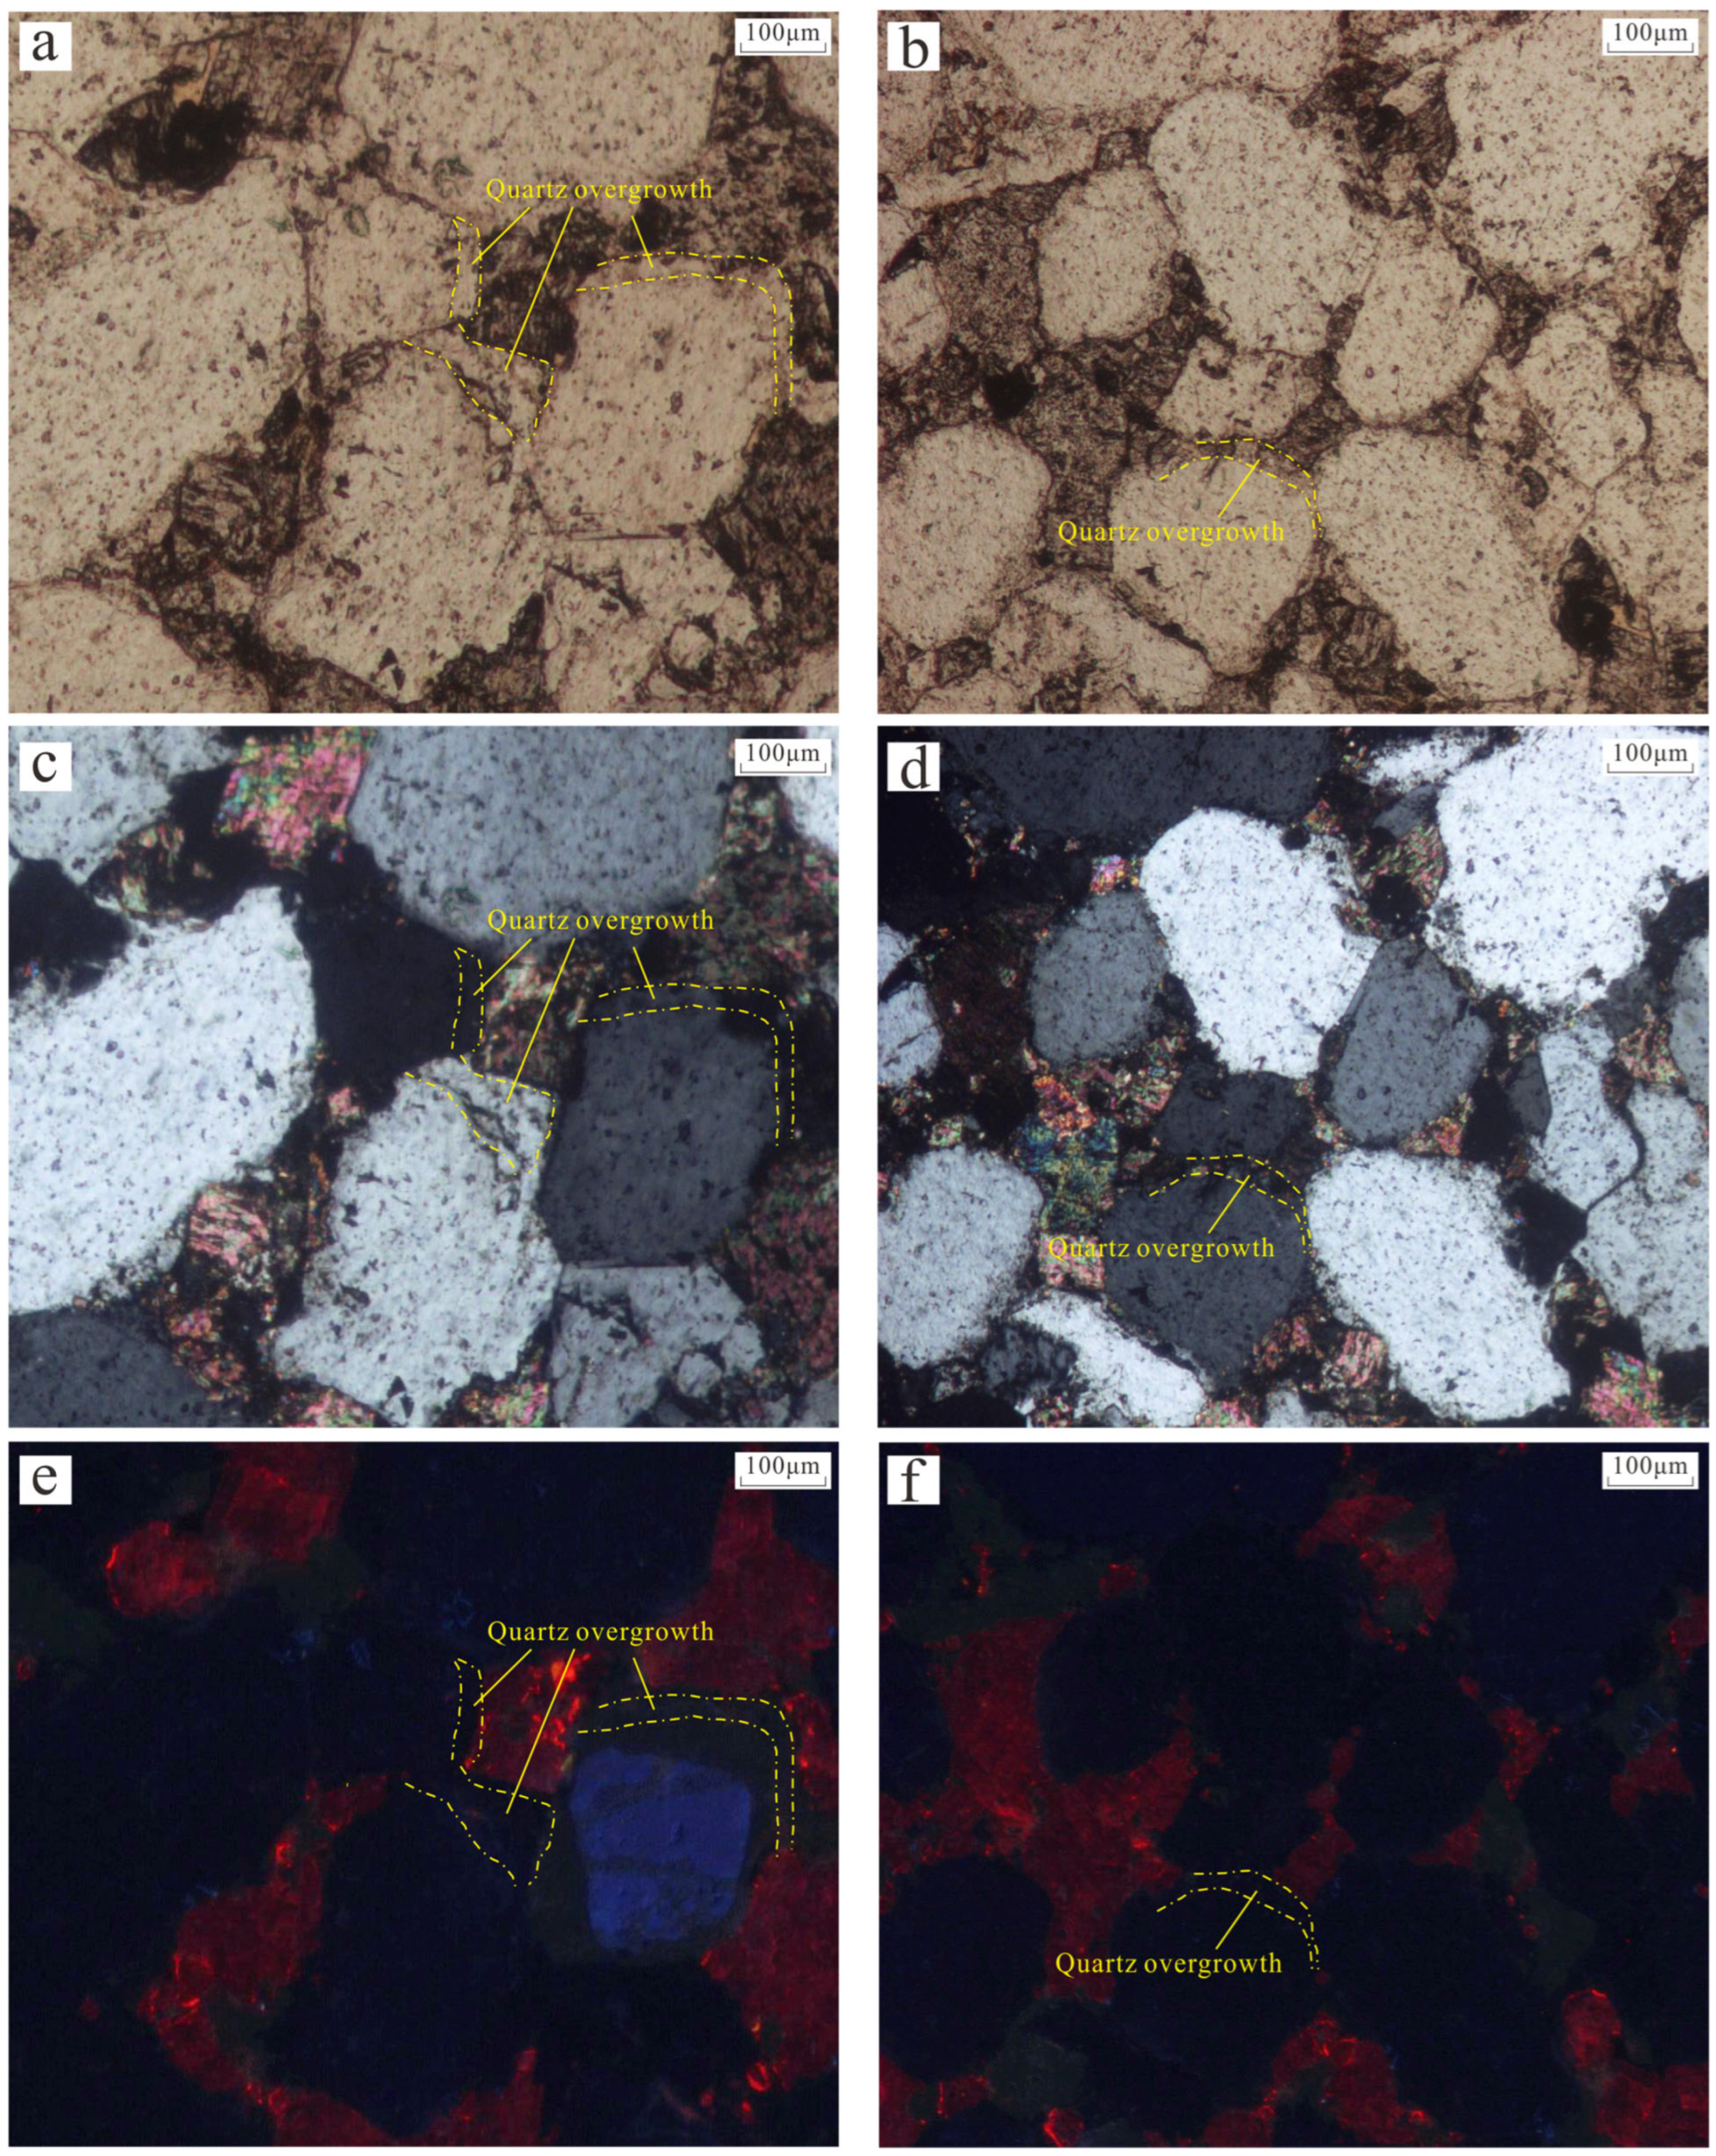
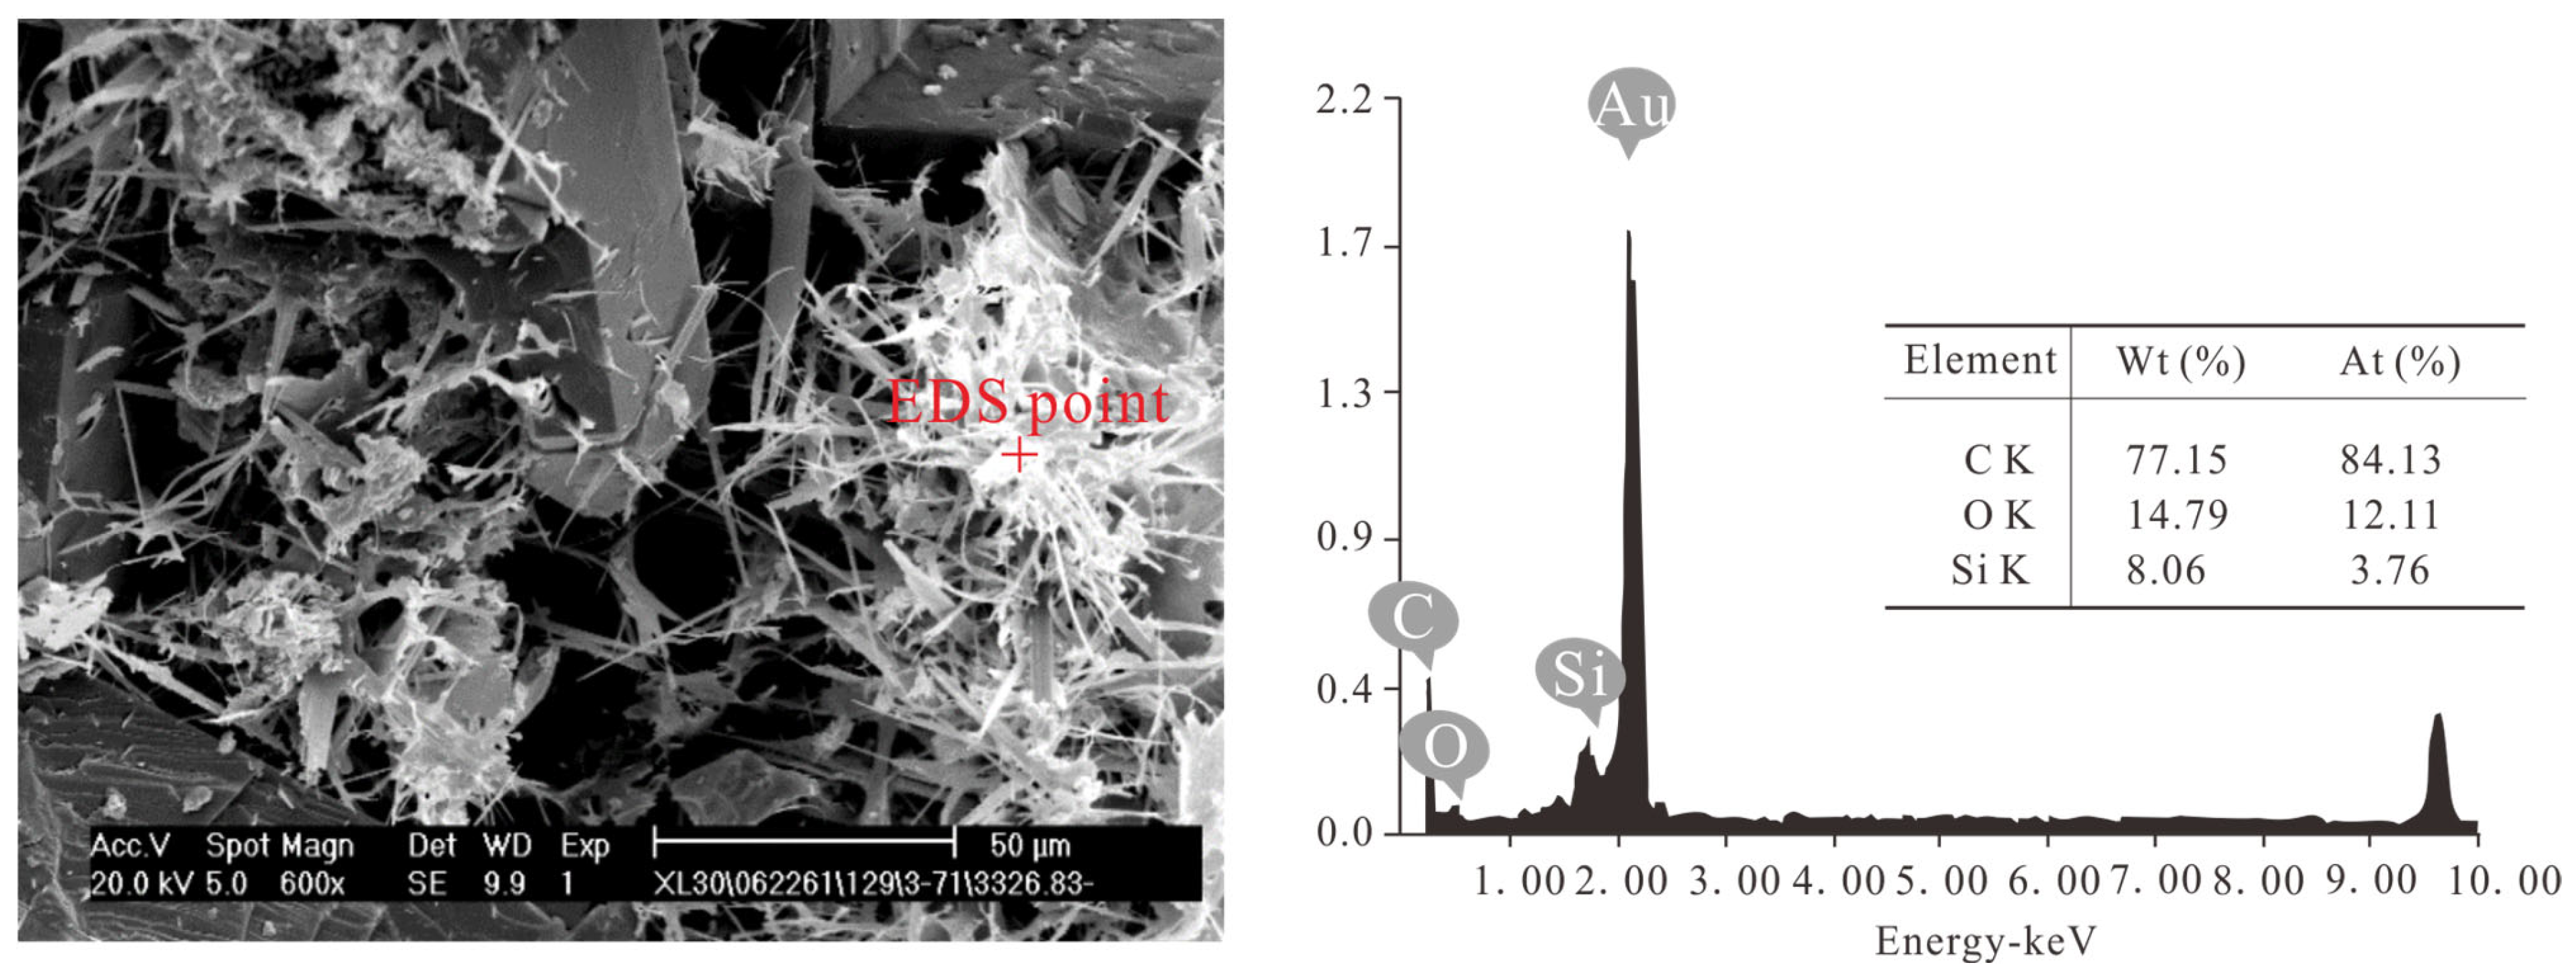
In this study, the physical simulation experiments successfully replicated the formation of various mineral cements, including secondary quartz overgrowth, calcite cement, authigenic siliceous minerals, authigenic chlorite, and authigenic illite. When the simulated temperature exceeded 280 °C and the pressure topped 92 MPa, noticeable quartz overgrowths with distinct dust lines began to appear in the samples (Figure 4). At higher temperatures (>300 °C), we also observed authigenic microcrystalline quartz filling dissolution pores, with both its morphology and energy-dispersive spectroscopy (EDS) confirming it as an authigenic siliceous mineral (Figure 5). A plotted relationship between the silica cement content and the porosity of tight sandstone reservoirs in the Permian Xiashihezi Formation of the Ordos Basin shows a clear negative correlation between the amount of silica cement and the porosity of tight sandstones (Figure 6).
Carbonate cements are among the most significant types of cements found in sandstones within many oil and gas basins. They are characterized by their widespread distribution, multi-phase formation, and diverse origins [7,8,9,10]. The presence of carbonate cements can severely impact reservoir quality. Primarily, they occupy pore spaces within the reservoir, reducing sandstone porosity and degrading reservoir quality [11,12,13]. Sandstones that are heavily cemented with carbonates often form tight zones, which divide thick reservoirs into several thinner ones, thereby increasing internal heterogeneity [15,16,17]. The content, distribution, and dissolution of carbonate cements directly influence the quality of the reservoir [19,20,21,22,23].
Carbonate cements are more developed in western Ordos Basin compared to central Ordos Basin. In central Ordos Basin, calcite cements are sporadically distributed among the quartz and feldspar grains in the sandstone (Figure 7a). Under the microscope, calcite cements appear as spotty or intergrown crystals (Figure 7b). The content of spotty calcite typically does not exceed 7.5% (Figure 7c). Intergrown calcite can completely densify the sandstone reservoir (Figure 7d). Well-formed dolomite crystals are also observed in some thin-sections. After injecting a CaCl2-MgCl2-Na2CO3 solution into the simulated samples and reaching temperatures of 250–260 °C, newly formed euhedral calcite crystals were observed (Figure 7e). These euhedral calcite cements exhibit pressure twinning, indicating they are products of the compaction process (Figure 7f).
Cement composed of clay minerals typically includes kaolinite, illite, and chlorite. Generally, the porosity of sandstone decreases with increasing burial depth [8,9,10,11]. However, in many practical oil and gas explorations, numerous deeply buried high-quality reservoir sandstones with unusually high porosity have been discovered [13,14,15]. For instance, Miocene sandstones at depths greater than 4000 m on the Texas coast have porosities as high as 22%. In the Sawan gas field in Pakistan, Cretaceous volcaniclastic sandstones at depths greater than 3300 m can have porosities up to 27%. In China’s Xinjiang Tarim Basin, Donghe sandstones buried nearly 6000 m deep still exhibit porosities around 20%. Previous studies defined statistically anomalous high porosity or permeability as being higher than that of typical sandstone reservoirs with similar lithology, age, burial history, and thermal evolution. Such anomalies often exceed the maximum porosity or permeability of comparable typical sandstones.
In deeply buried conditions, the potential mechanisms for sandstone exhibiting unusually high porosity and permeability primarily include grain coating, early hydrocarbon emplacement, shallow overpressure, and secondary porosity. Among these, grain coating cementation is one of the main reasons for the preservation of primary porosity. Generally, grain coatings are products of the burial diagenetic process following deposition, forming by outward growth from the surfaces of detrital grains (excluding points of grain contact). Depending on their occurrence, grain coatings can be described in two slightly different ways. When authigenic cement grows outward from the surface of detrital grains, encasing the entire grain like a thin film, it is referred to as a grain coating. When authigenic cement does not fully encase the detrital grains but is present on the grain surfaces at the pore edges, excluding points of grain contact, it is typically called a pore lining.
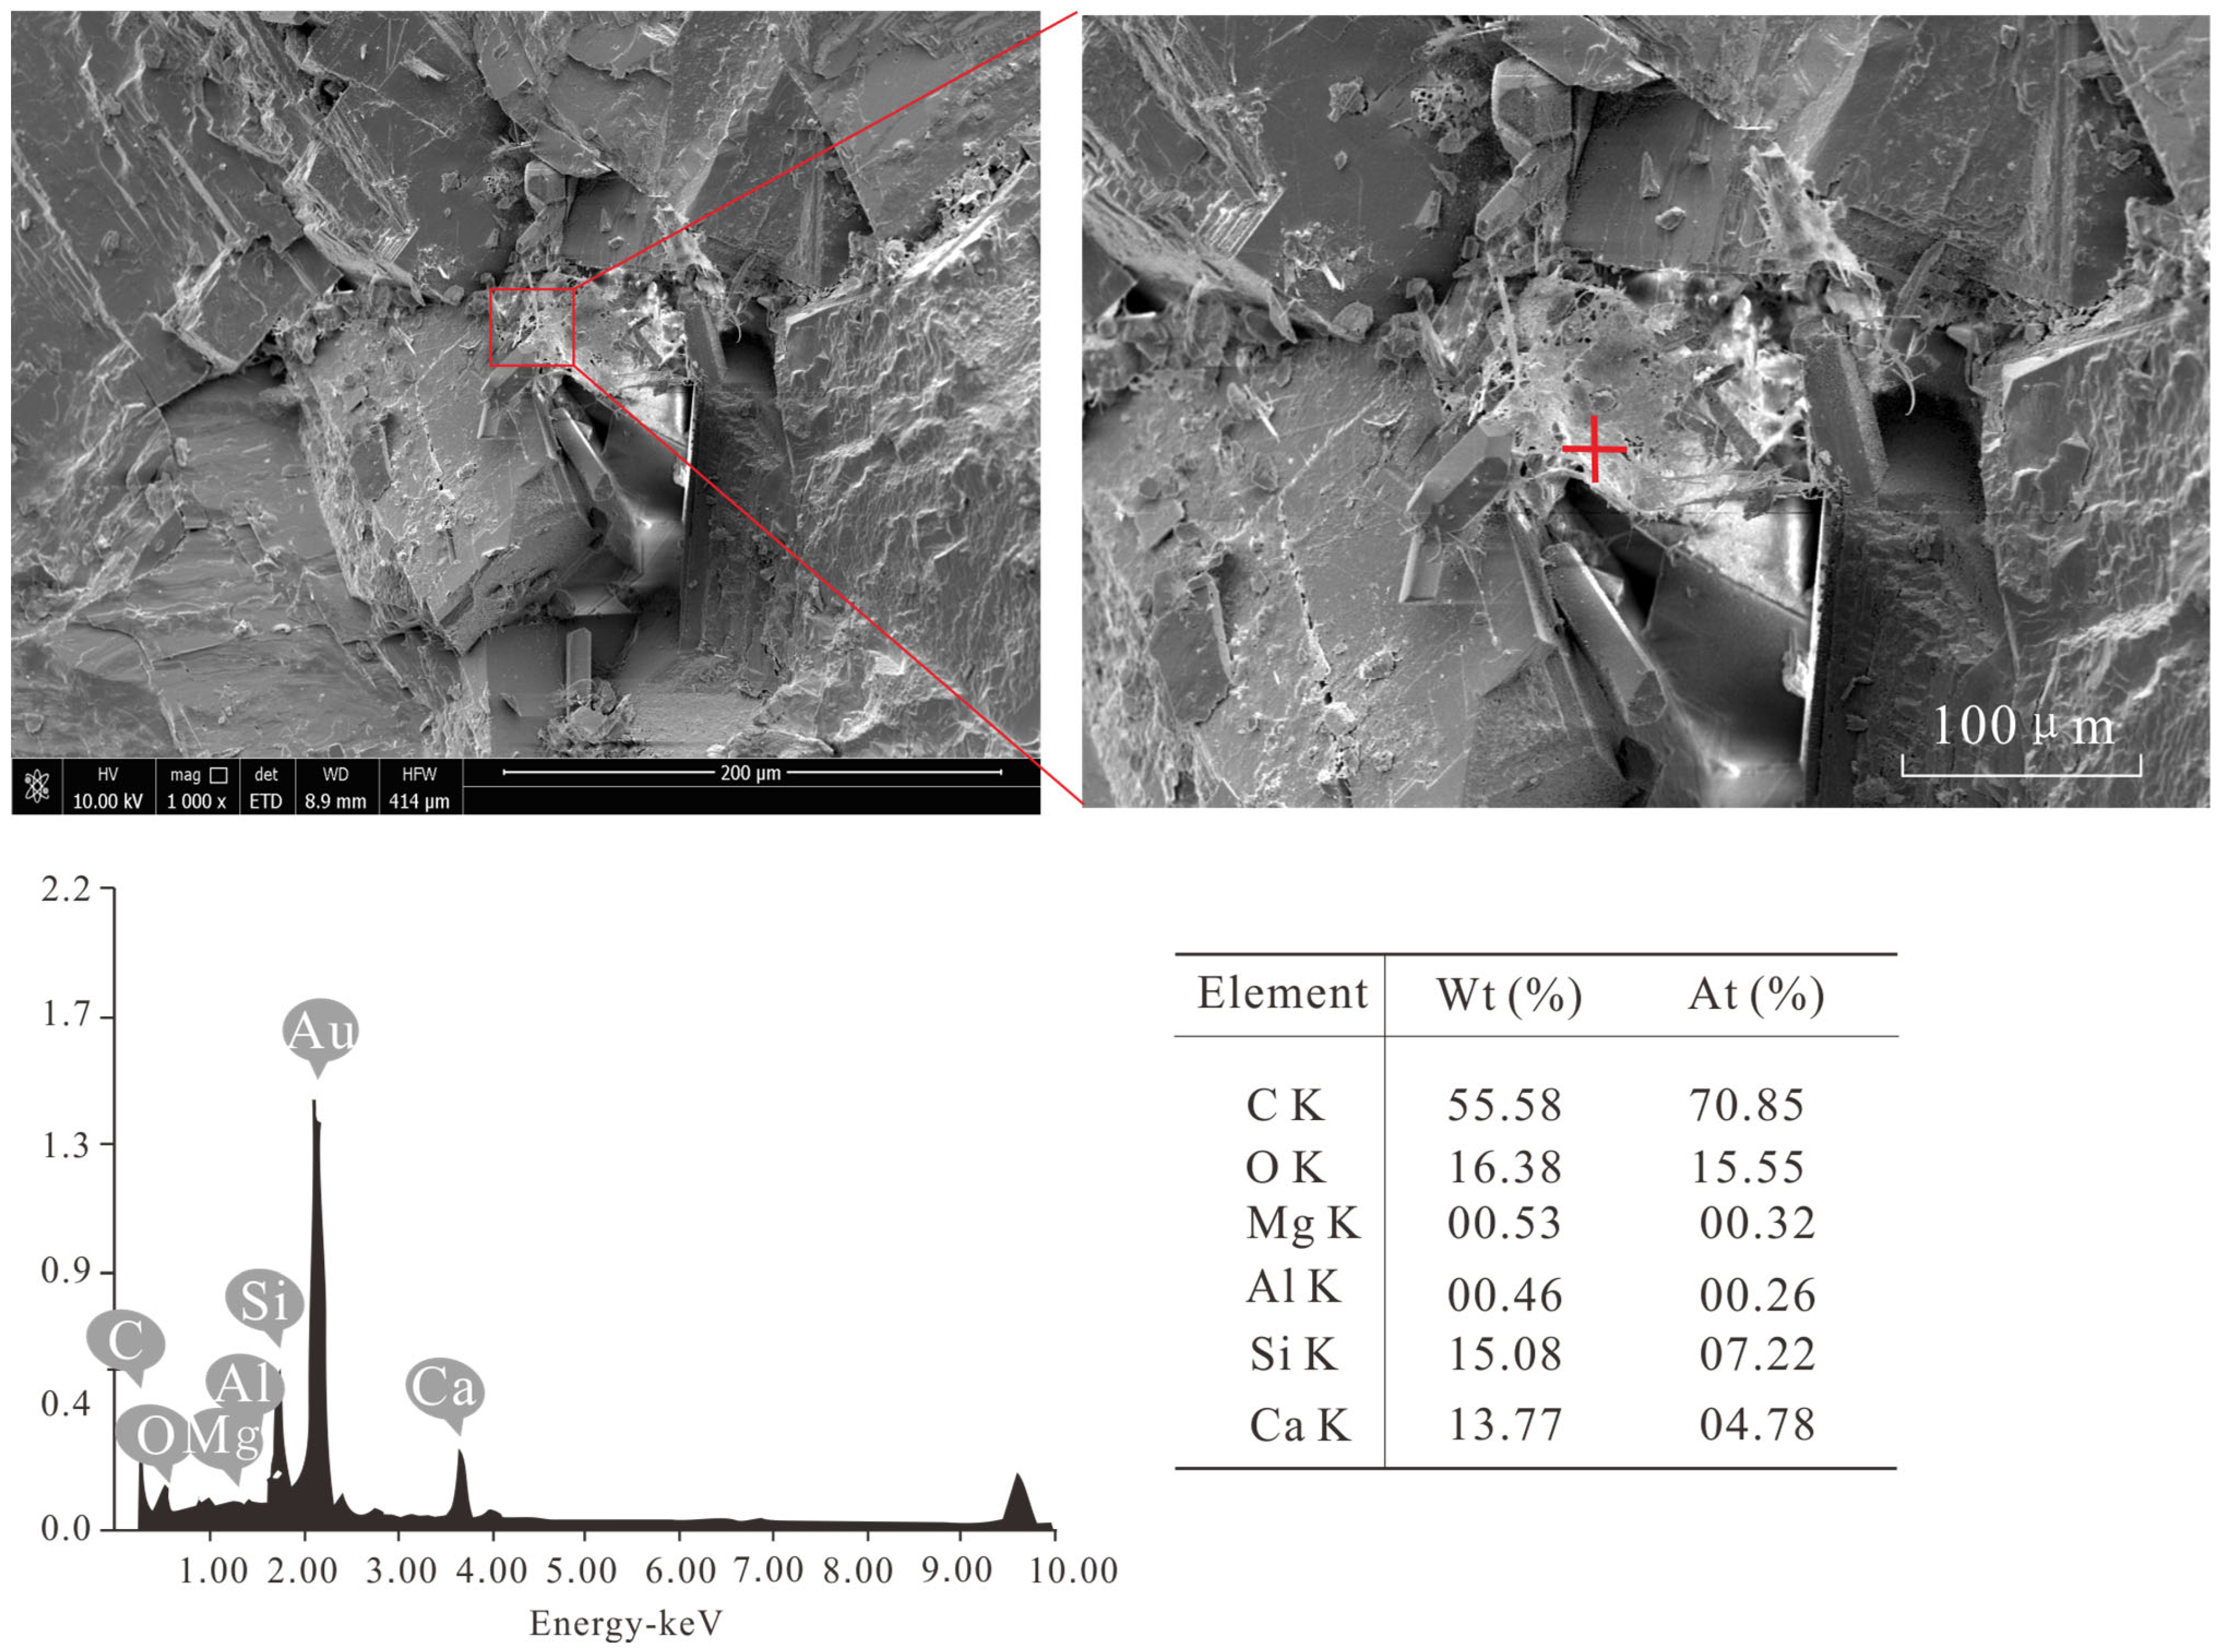
After injecting fluids rich in Fe2+ and Mg2+, chlorite rim cementation commonly forms on grain surfaces when the simulated temperature reaches 280–295 °C (Figure 8). Under SEM, chlorite appears as typical “rose petal” clusters (Figure 8), and energy-dispersive spectroscopy confirms its high iron and magnesium content (Figure 8). At higher temperatures (>300 °C), flaky, fibrous, or needle-like illite appears in the samples, often coexisting with chlorite or filling pore throats (Figure 9).
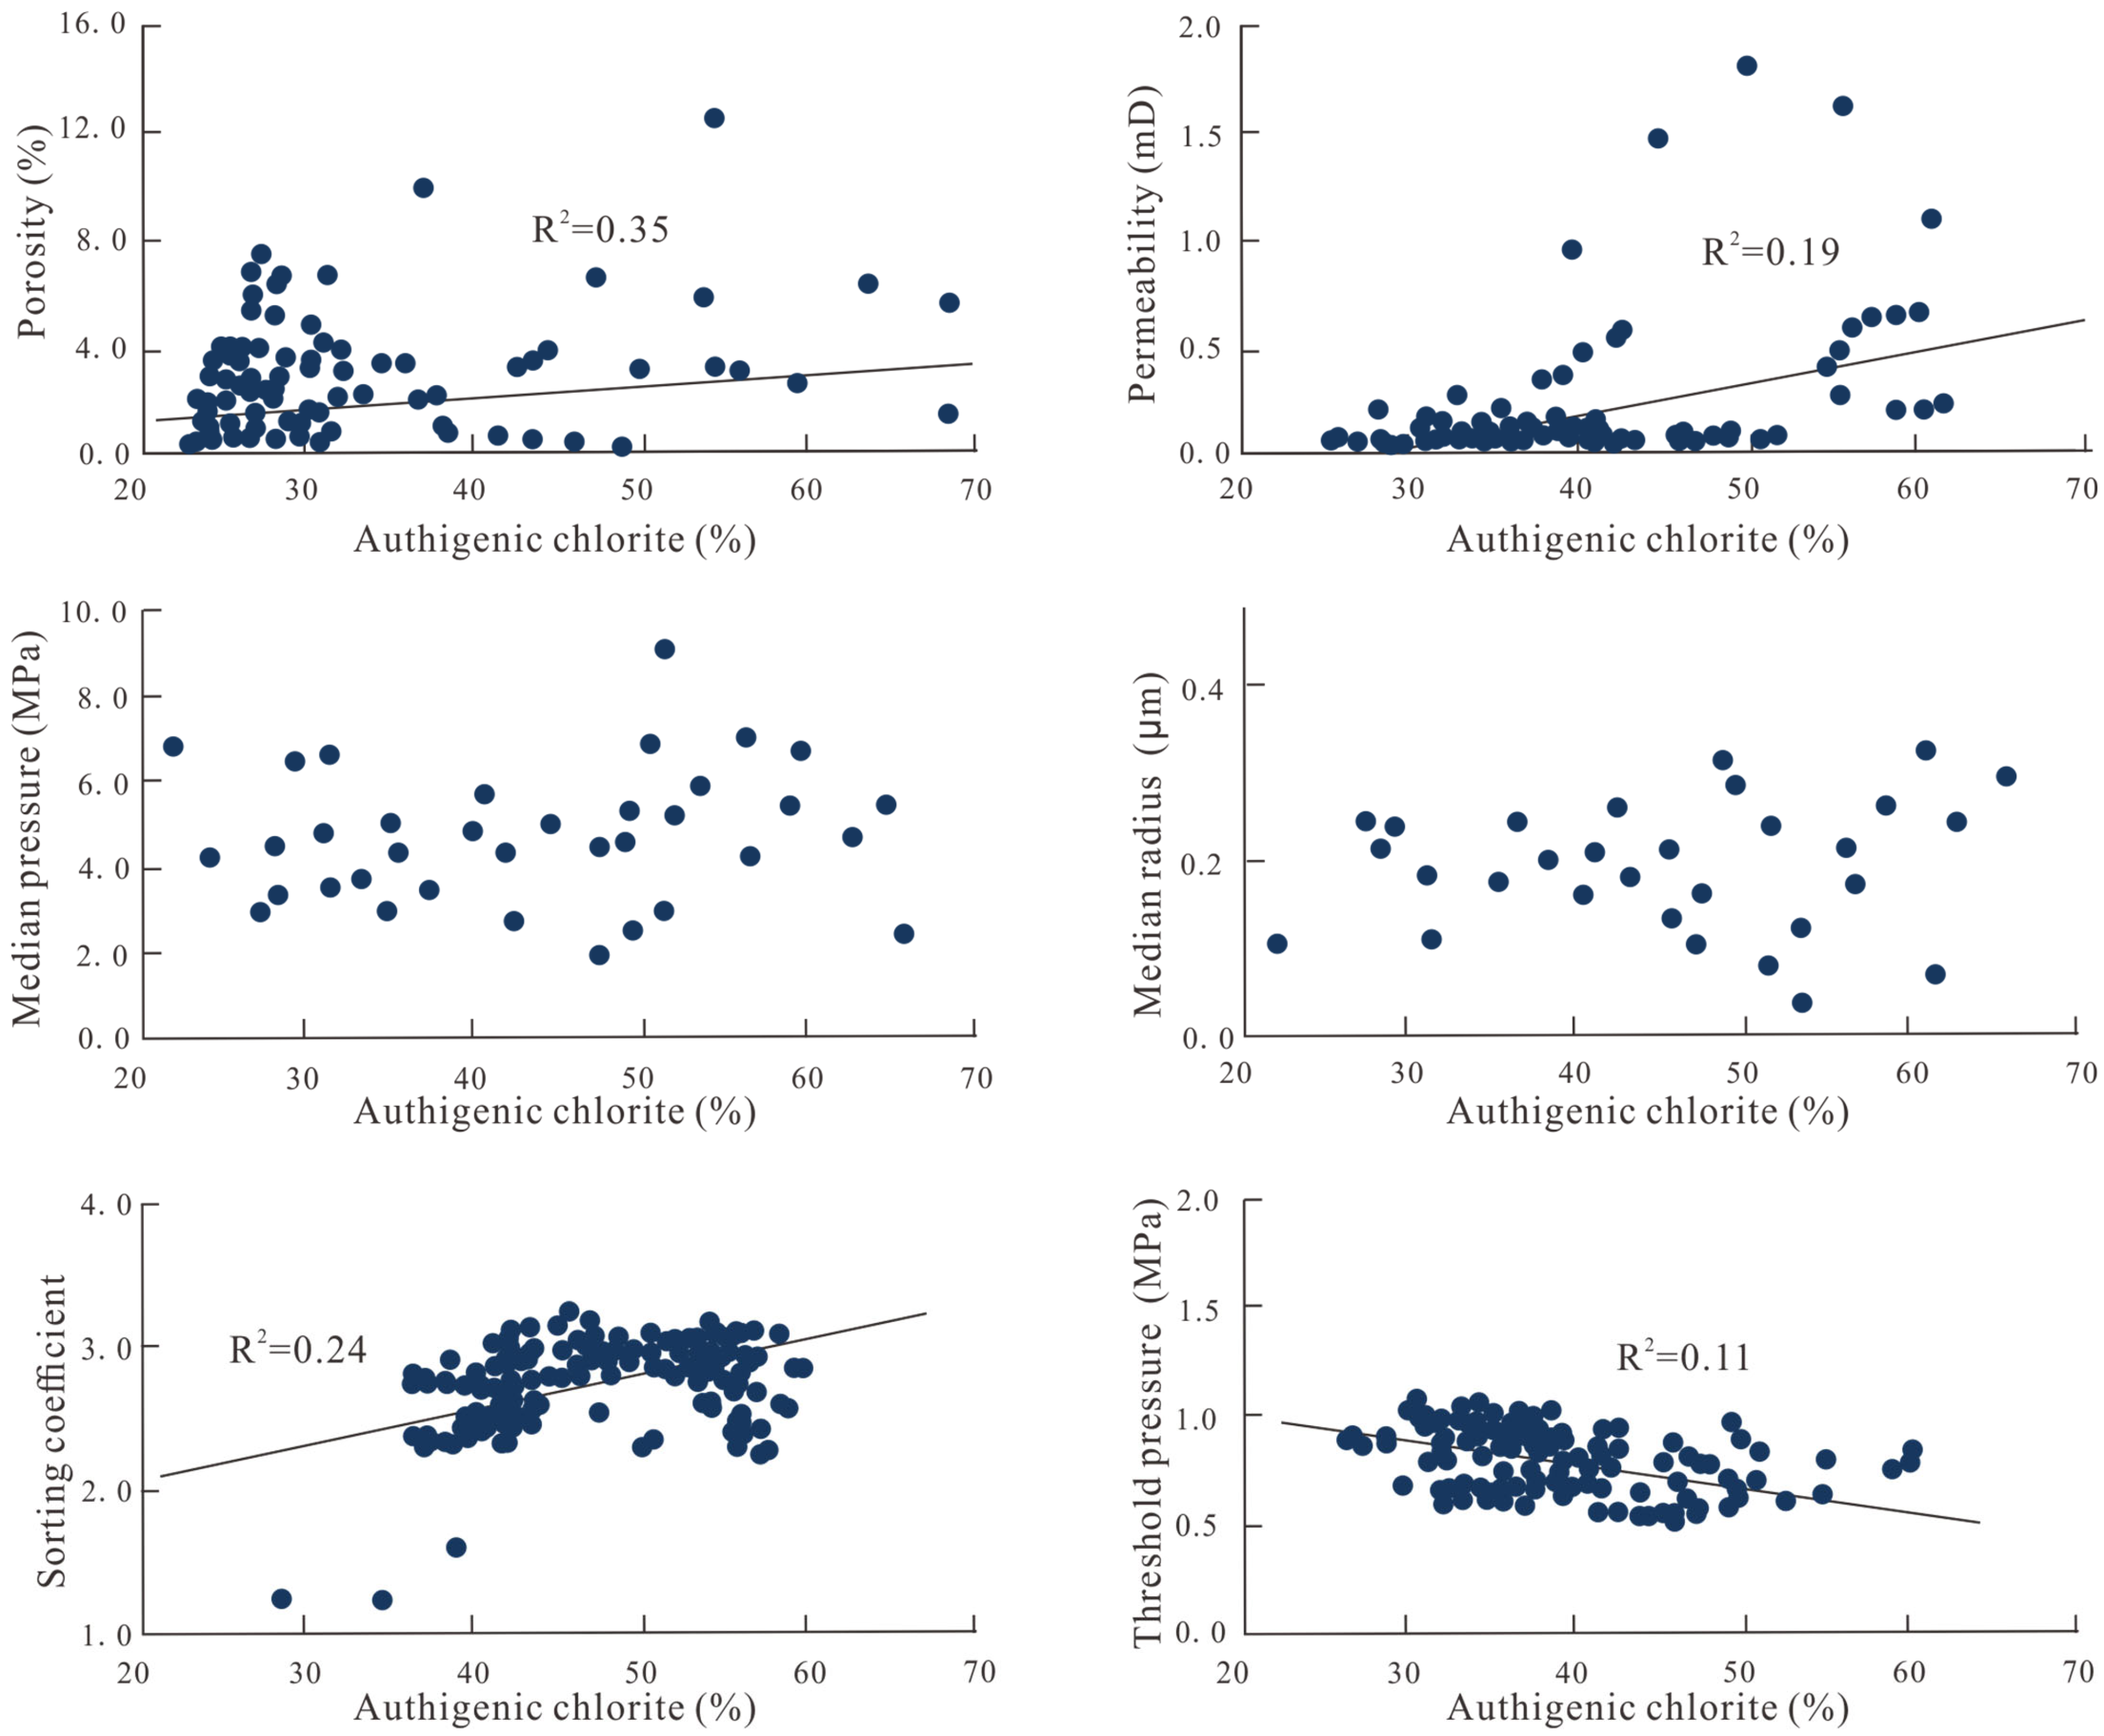
Analysis indicates that the linear relationship between chlorite content and porosity is not evident. When the content of authigenic chlorite accounts for 22% of the total clay minerals, the porosity of the tight sandstone reservoir can reach a maximum value of 10.57%. As the chlorite content increases, the porosity of the tight sandstone reservoir shows a decreasing trend. However, at a porosity of 47%, the porosity trend further decreases. The relationship between authigenic chlorite content and permeability shows that permeability is very low when chlorite content is low. When chlorite content is 22%, permeability is 0.177 mD. As chlorite content increases, permeability tends to increase. When chlorite content reaches 56%, permeability reaches a maximum value of 1.52 mD. After this point, permeability shows a weak negative correlation with chlorite content (Figure 10).
The reason for the extremely low permeability when chlorite content is low is that, despite high chlorite levels, there are numerous crystal pores between the authigenic chlorite coatings. The pore fluids and detrital quartz particles are not completely separated, leading to the coexistence of chlorite and illite. This effect blocks pore spaces and reduces permeability. However, once chlorite content reaches a certain level, the crystal pores are insufficient for illite growth, resulting in an increase in permeability. As chlorite content increases, although illite content decreases, the bridging of chlorite particles creates small spaces that further reduce sandstone permeability. Analysis shows that as chlorite content increases, the median radius of pore throats initially increases and then decreases, reflecting changes in porosity. Although the threshold pressure of samples shows a decreasing trend, experimental data reveal that at chlorite contents of 59% and 62%, despite high porosity, the median radius of pore throats is nearly minimal at 0.071 μm and 0.11 μm, respectively. The sorting coefficient and variation coefficient of pore throats also decrease with increasing chlorite content.
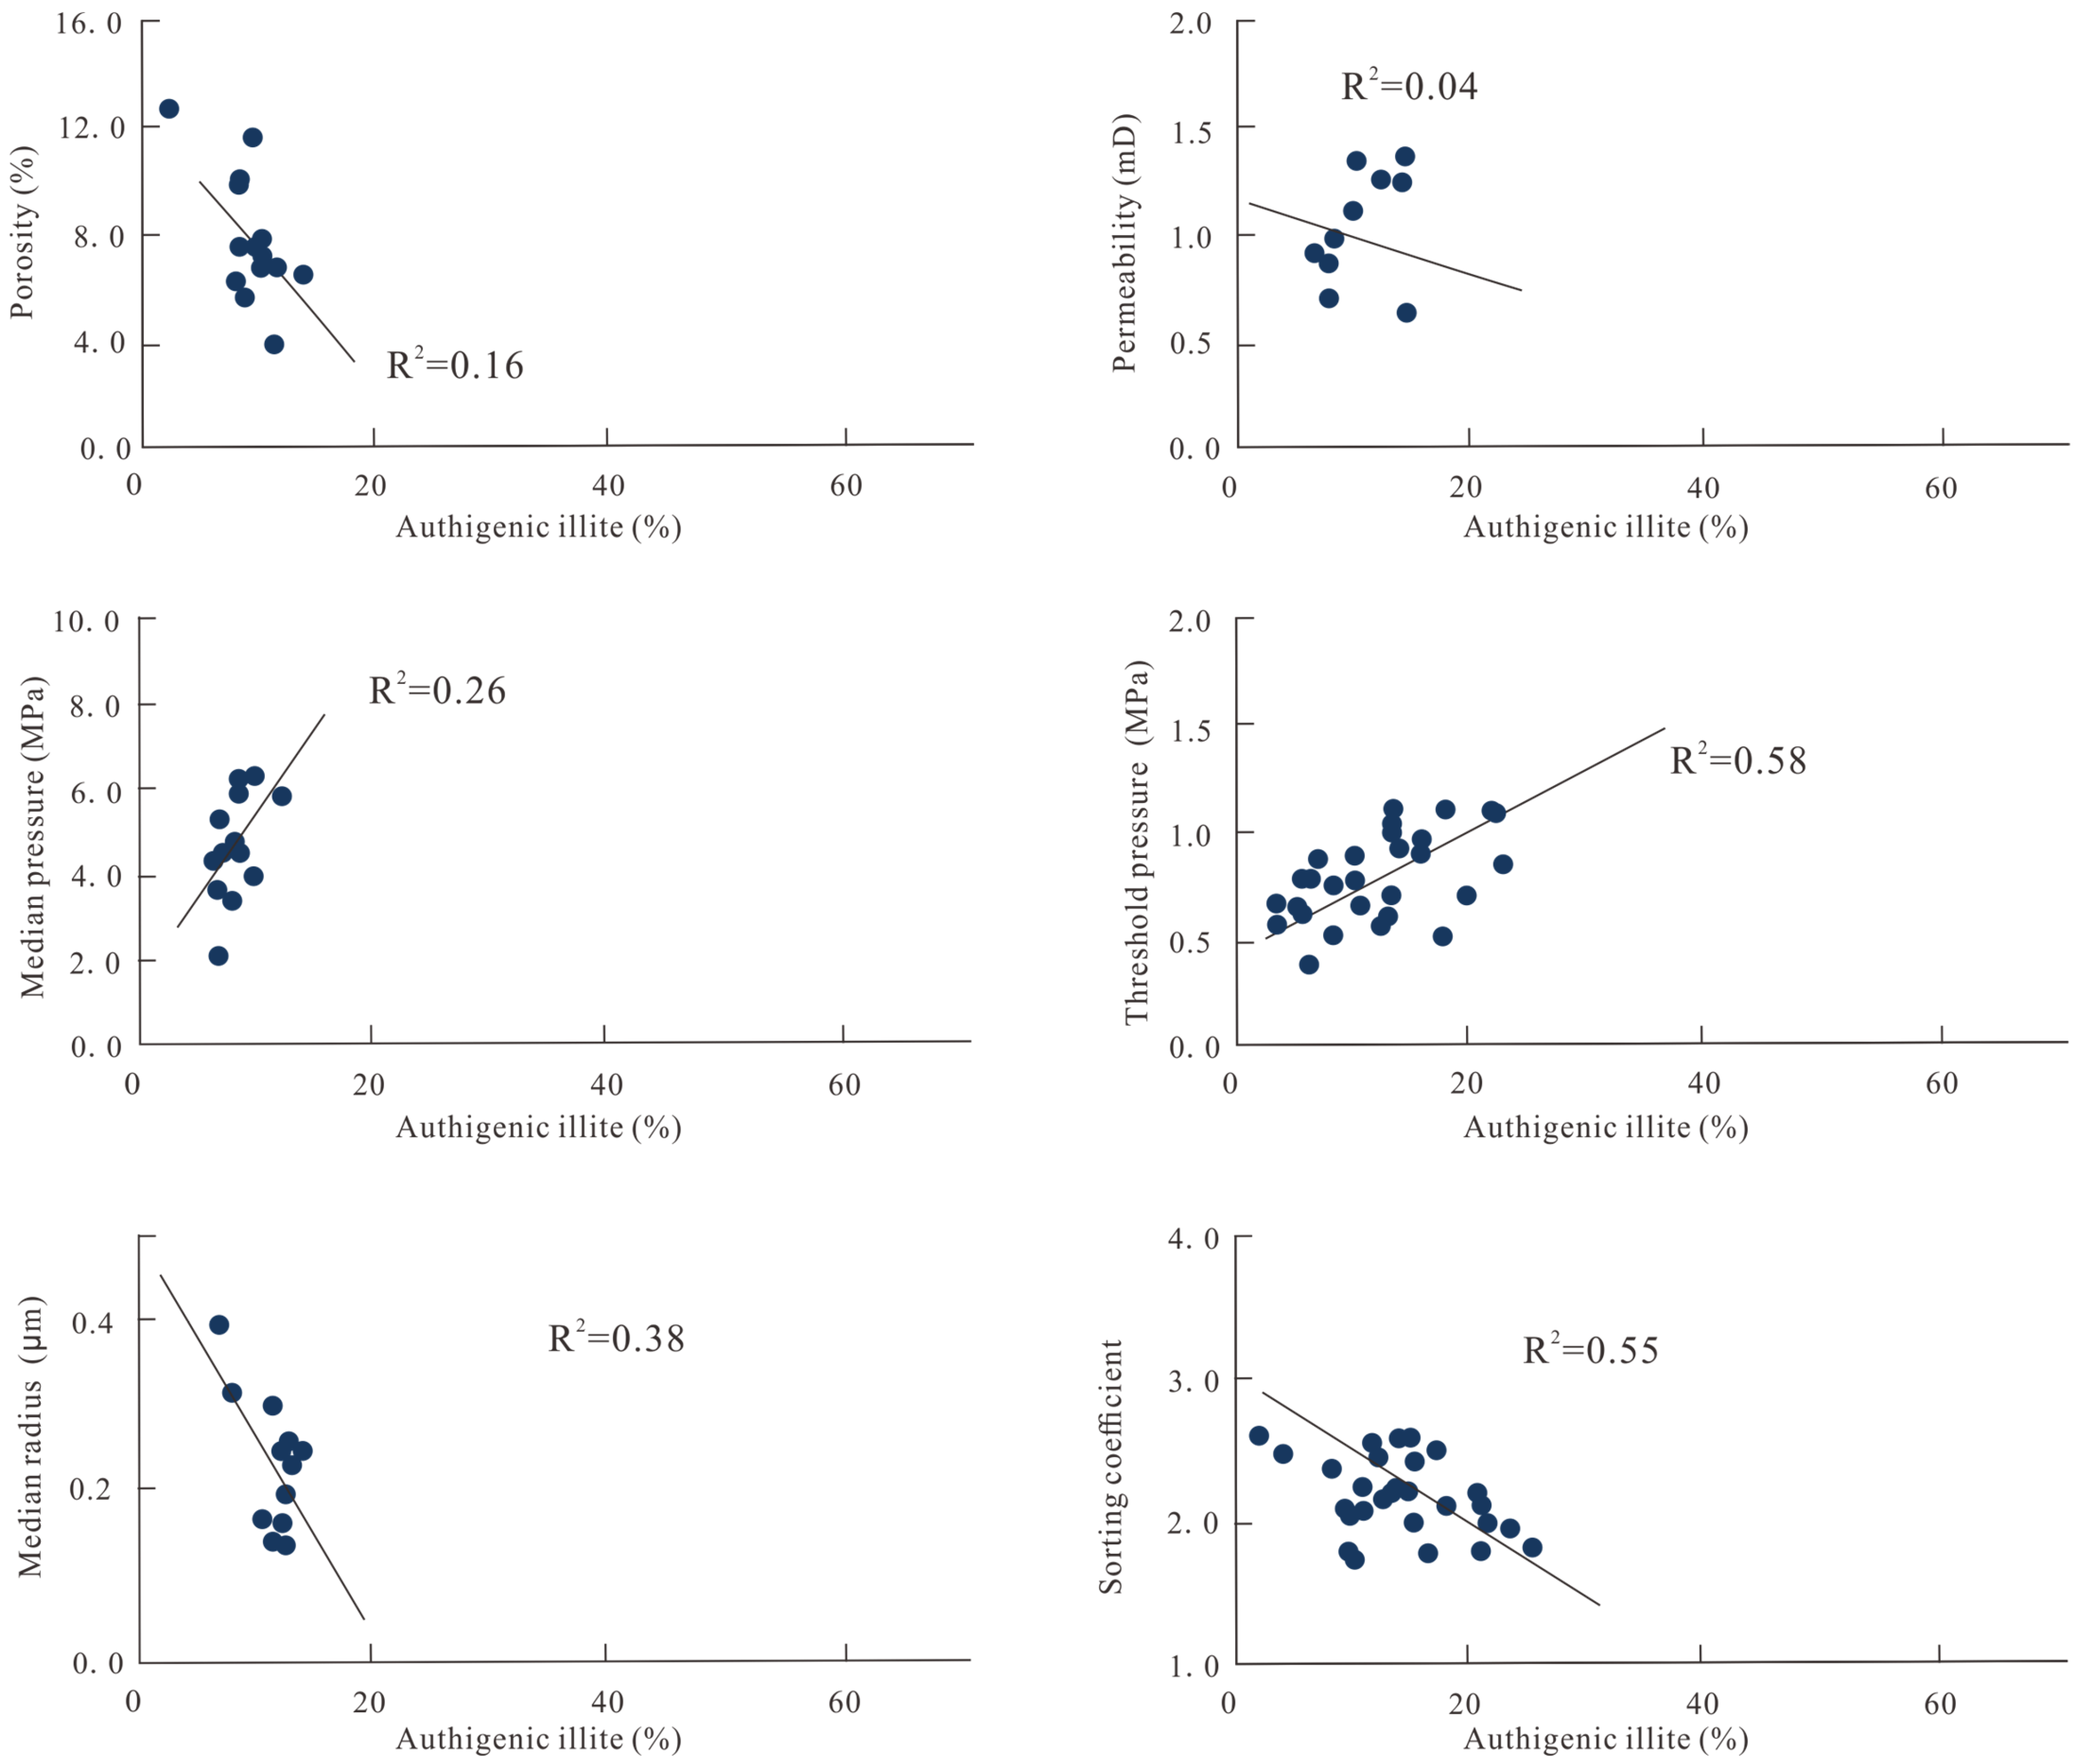
The scatter plot of illite content versus porosity shows no clear relationship (Figure 11), indicating that changes in porosity are relatively unaffected by illite cementation. Even with illite content as high as 53%, porosity can still reach 15.73%. Unlike porosity, there is a generally clear negative correlation between illite content and permeability. With minimal changes in porosity, as the observed illite content increases, the median radius of the pore throats decreases. The threshold pressure increases significantly, while the pore throat radius corresponding to this pressure decreases markedly. The pore throat radius corresponding to the median pressure (median radius) also decreases significantly. Samples with high illite content consistently have smaller median radii, indicating that illite cementation within the pores damages the pore throats.

4.1.3. Dissolution Effect

After injecting low-concentration acetic acid into the reaction vessel to simulate the dissolution effect of organic acids (at temperatures >295 °C), significant dissolution features were observed under thin-section analysis (Figure 12a). This stage simulated the formation temperature of 120–175 °C and the burial depth of 3600–4100 m (Figure 12b). The dissolution primarily targeted feldspar grains, occurring along cleavage planes (Figure 12c). This process created embayed edges, honeycomb-like intragranular pores, and even moldic pores (Figure 12d). The matrix and some unstable rock fragments also experienced varying degrees of dissolution (Figure 12b).

4.2. Variations in Ion Concentration of Diagenetic Fluids

Ion concentration analysis of fluid samples obtained from different simulation stages reveals the geochemical evolution during water-rock interactions. The pH value reflects the chemical conditions of the diagenetic environment. The pH values of initially injected fluids (including distilled water and acidic solutions) generally increase after reacting with rock samples. Ultimately, the diagenetic environment tends toward alkalinity (Figure 13). This indicates that the dissolution of minerals such as feldspar and carbonates involves the consumption of hydrogen ions. In a closed system, the dissolution capacity of acidic fluids diminishes rapidly as the reaction progresses.
The concentrations of major ions exhibit systematic changes with simulated burial depth (temperature and pressure) (Figure 13). Concentrations of ions such as Si4+, K+, Na+, and Ca2+ peak at simulated burial depths of 1700–3000 m (corresponding to the early diagenetic B stage to the middle diagenetic A stage), indicating intense dissolution of feldspar and clay minerals. At greater depths, the concentrations of these ions decrease, suggesting that the precipitation of authigenic quartz and illite consumes these ions. The consumption of Fe2+ and Mg2+ ions is closely associated with the formation of chlorite.

5. Discussions

5.1. Experimental Verification of Sandstone Compaction Mechanism

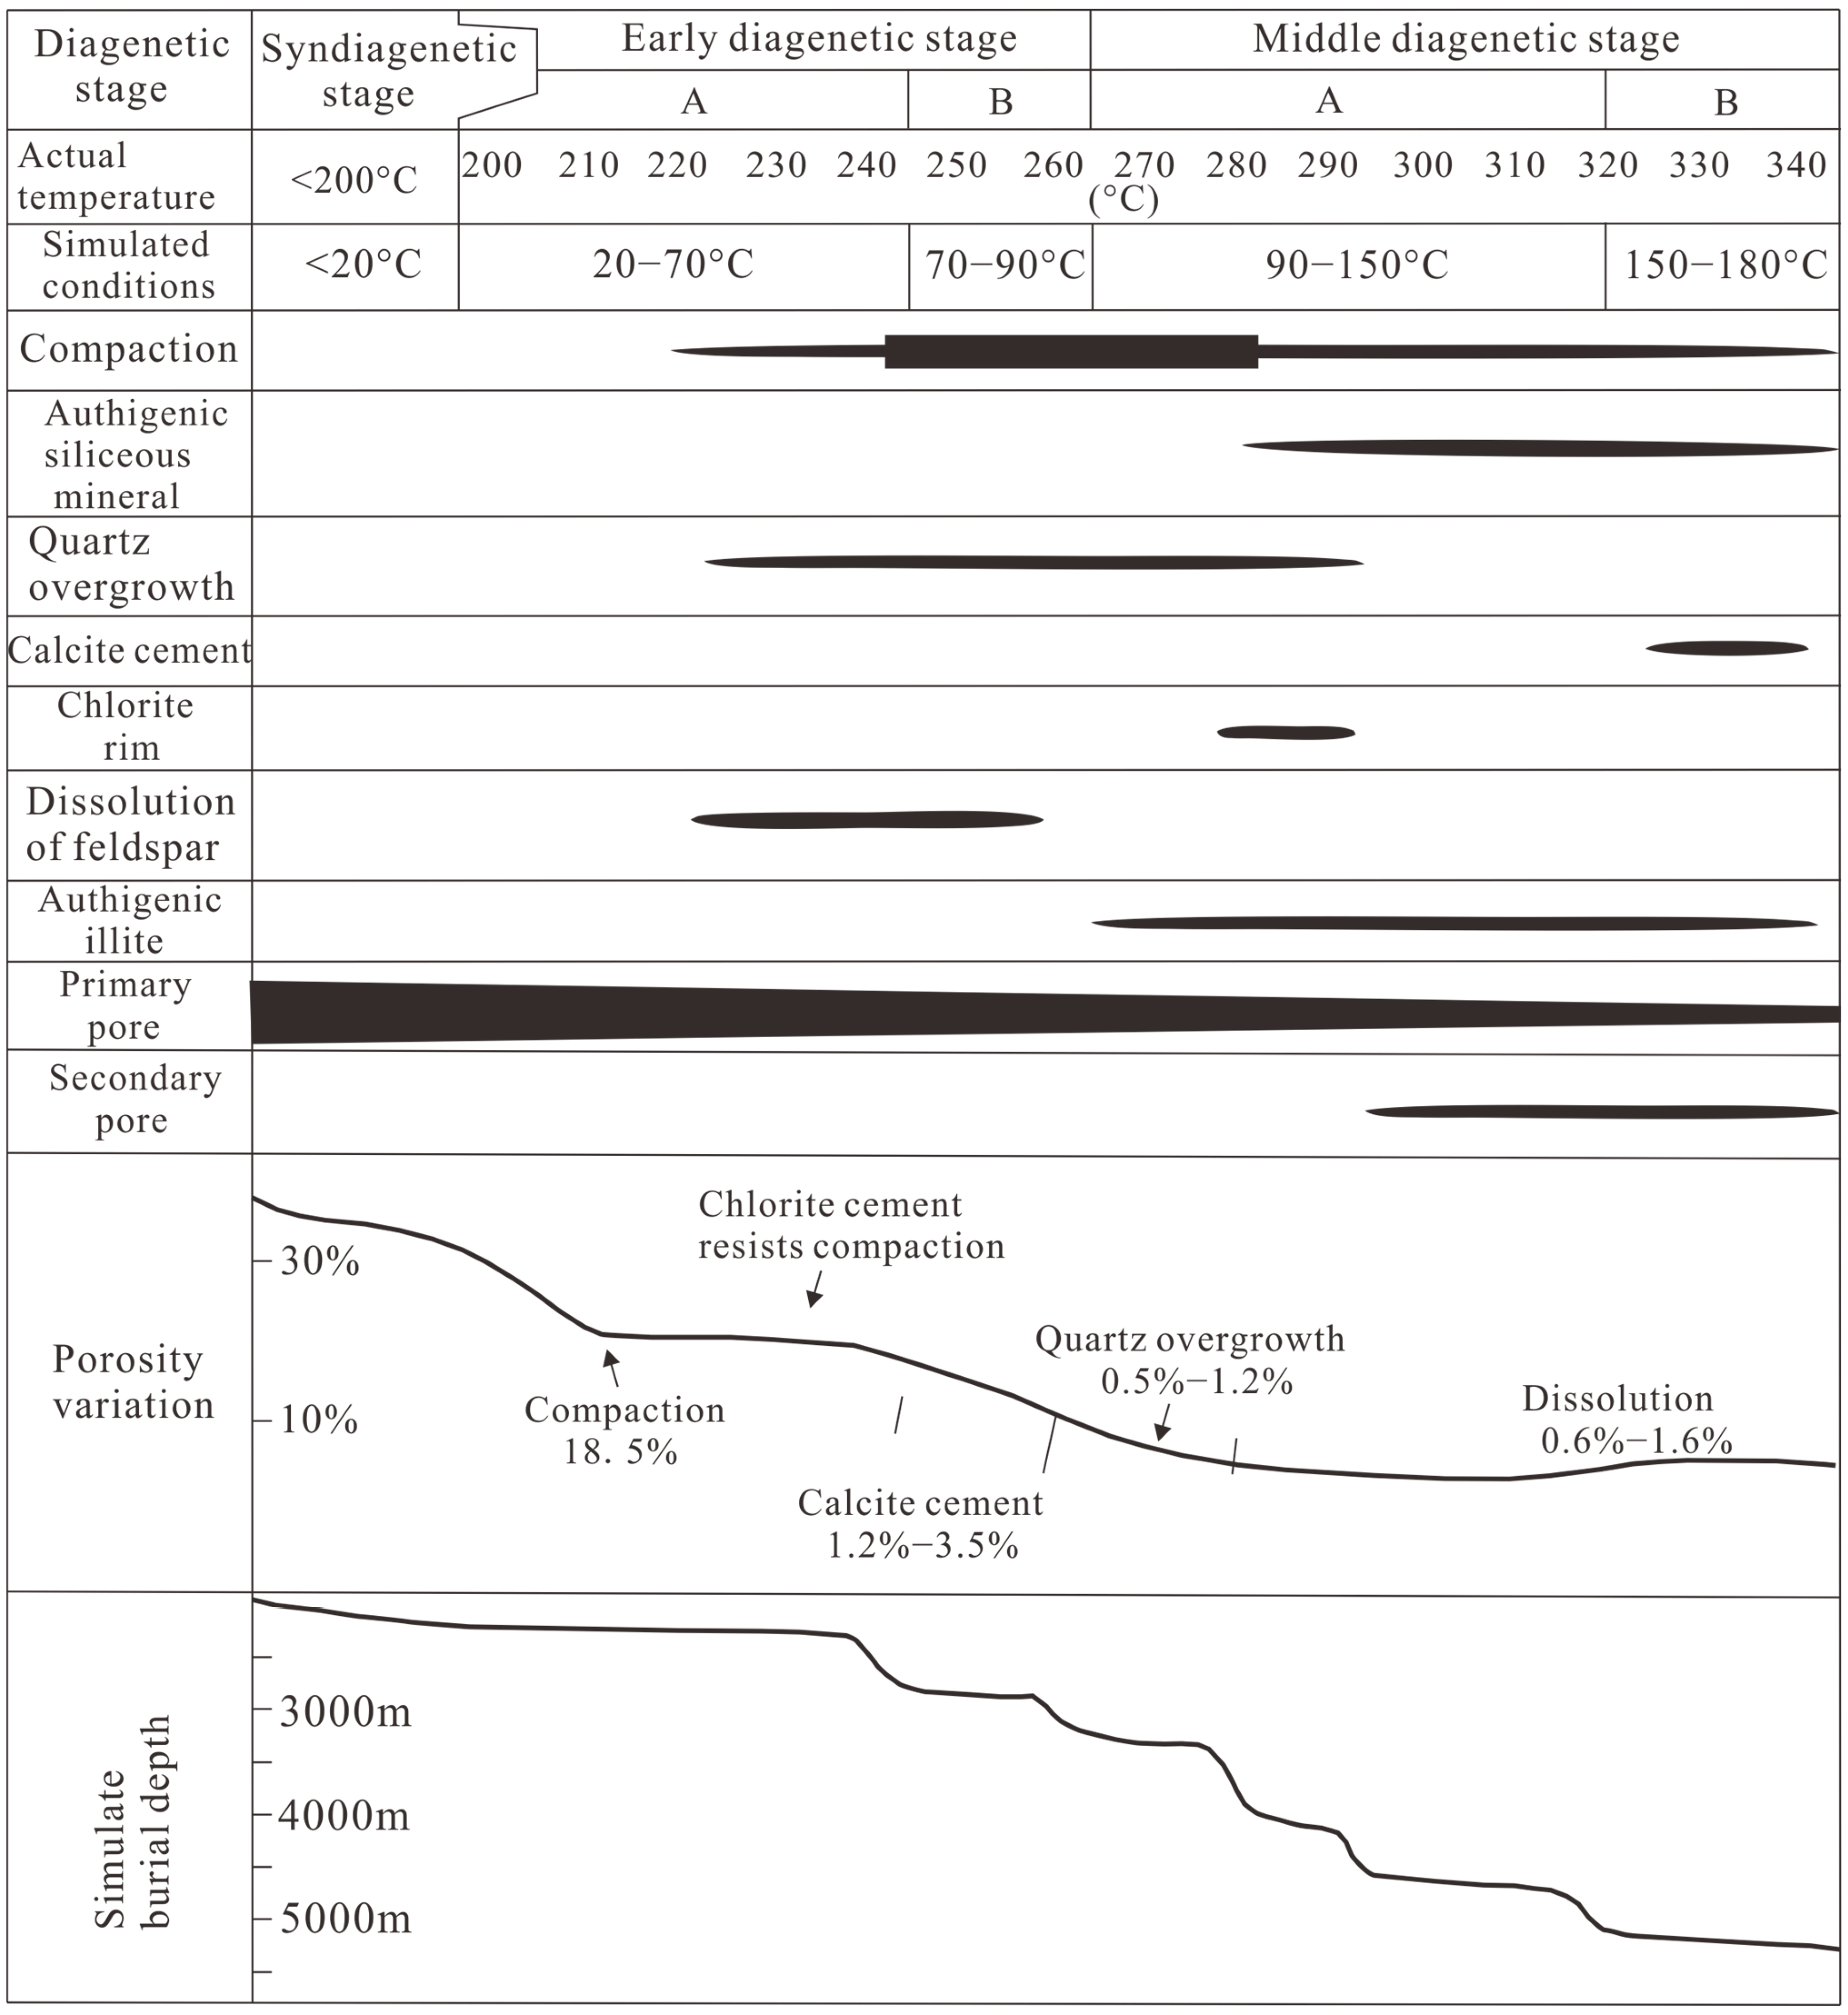
This simulation experiment has dynamically validated the complex compaction mechanisms of the Permian Xiashihezi Formation sandstones in the Ordos Basin. The compaction of the sandstones is primarily driven by compaction, with cementation playing a secondary role (Figure 14). The porosity evolution curves clearly indicate that early mechanical compaction is the main cause of porosity loss, accounting for over 50% of the total porosity reduction. Cementation, including siliceous and carbonate cementation, is crucial for further reservoir compaction, especially during the intermediate to deep burial stages when compaction decreases. The cement fills the remaining primary and secondary pores, leading to the final compaction of the reservoir. Differences in the evolution of diagenetic facies. The physical simulation experiment modeled the diagenetic evolution path. The results show that in the absence of early chlorite protection, secondary pores generated by dissolution are easily filled by late-stage illite and quartz, leading to limited reservoir quality improvement. The hydrolysis of volcanic rock debris and biotite in tight sandstone provides a source of Mg2+ and Fe2+ ions, promoting the formation of early chlorite rims. The experiment observed that chlorite coatings effectively inhibit quartz overgrowth, preserving primary porosity, which corresponds to the relatively better physical properties observed in core samples from chlorite-rich intervals.

5.2. Formation Mechanism of Key Diagenetic Minerals

The formation mechanism of chlorite rims has been revealed. This simulation experiment strongly confirms the influence of volcanic rock debris and biotite on the development of chlorite. In the experiment, these mineral compositions are first hydrolyzed at high temperatures. The fluids carrying Mg2+ and Fe2+ ions flow into the overlying sandstone. At approximately 265 °C (corresponding to the early diagenesis B stage), this resulted in the formation of chlorite rims. Chlorite rims (or coatings) typically form in alkaline fluids rich in Fe2+ and Mg2+ [32,33]. In the Xiashihezi Formation, abundant volcanic lithic fragments and biotite release substantial Fe2+ and Mg2+ during hydrolysis, supplying the ions required for chlorite growth. The fluvial depositional setting further favored these coatings by maintaining slightly alkaline pore waters during deposition and early diagenesis. These chlorite films develop on grain surfaces and locally extend into pore space. Formed early in diagenesis, they protect grain contacts, enhance diffusion and fluid pathways that remove products of pressure solution (chemical compaction), and thereby facilitate that process while increasing resistance to mechanical compaction. As a result, primary intergranular porosity is better preserved.
The experimental results provide direct evidence of this diagenetic phenomenon, revealing a model of “high-quality reservoirs beneath compaction barriers” spanning multiple strata. The occurrence and destructive effects of illite have also been revealed in this study. In the experiment, illite began to appear in large quantities at temperatures above 300 °C, filling pore throats in fibrous and bridging forms. This finding is entirely consistent with SEM observations of core samples (Figure 9). The experiment confirms that although the volume of illite cement is small, its unique morphology critically impairs reservoir permeability, which is a key reason for the “high porosity, low permeability” characteristic of the Permian Xiashihezi Formation reservoirs.

5.3. Implication for Sweet-Spot Prediction

This simulation study indicates that the formation of “sweet-spot” reservoirs in the tight sandstones of the Permian Xiashihezi Formation requires the following key conditions (Figure 14). 1. Favorable depositional facies: Beach bars and subaqueous distributary channels form in relatively high-energy depositional environments. The coarse-grained, well-sorted sandstones in these microfacies possess high initial porosity and compaction resistance, which are essential for creating high-quality reservoirs. 2. Early chlorite rims: Early-formed chlorite rims can effectively inhibit destructive quartz overgrowth, thereby preserving primary porosity on a large scale. Hence, identifying areas adjacent to underlying magnesium- and iron-rich mineral composition is crucial for predicting the distribution of chlorite rims. 3. Effective dissolution: The charging of organic acids during the middle diagenetic stage is critical for creating secondary porosity. Therefore, areas near hydrocarbon source rocks and conduit faults, where dissolution processes are more pronounced, are more likely to form secondary porosity “sweet-spots.” 4. Avoidance of late-stage destructive cementation: Late-stage illite and iron carbonate cements can severely impair reservoir permeability. Understanding the fluid dynamics and thermal evolution that control the distribution of these late-stage cements helps in avoiding areas where porosity is severely compromised.
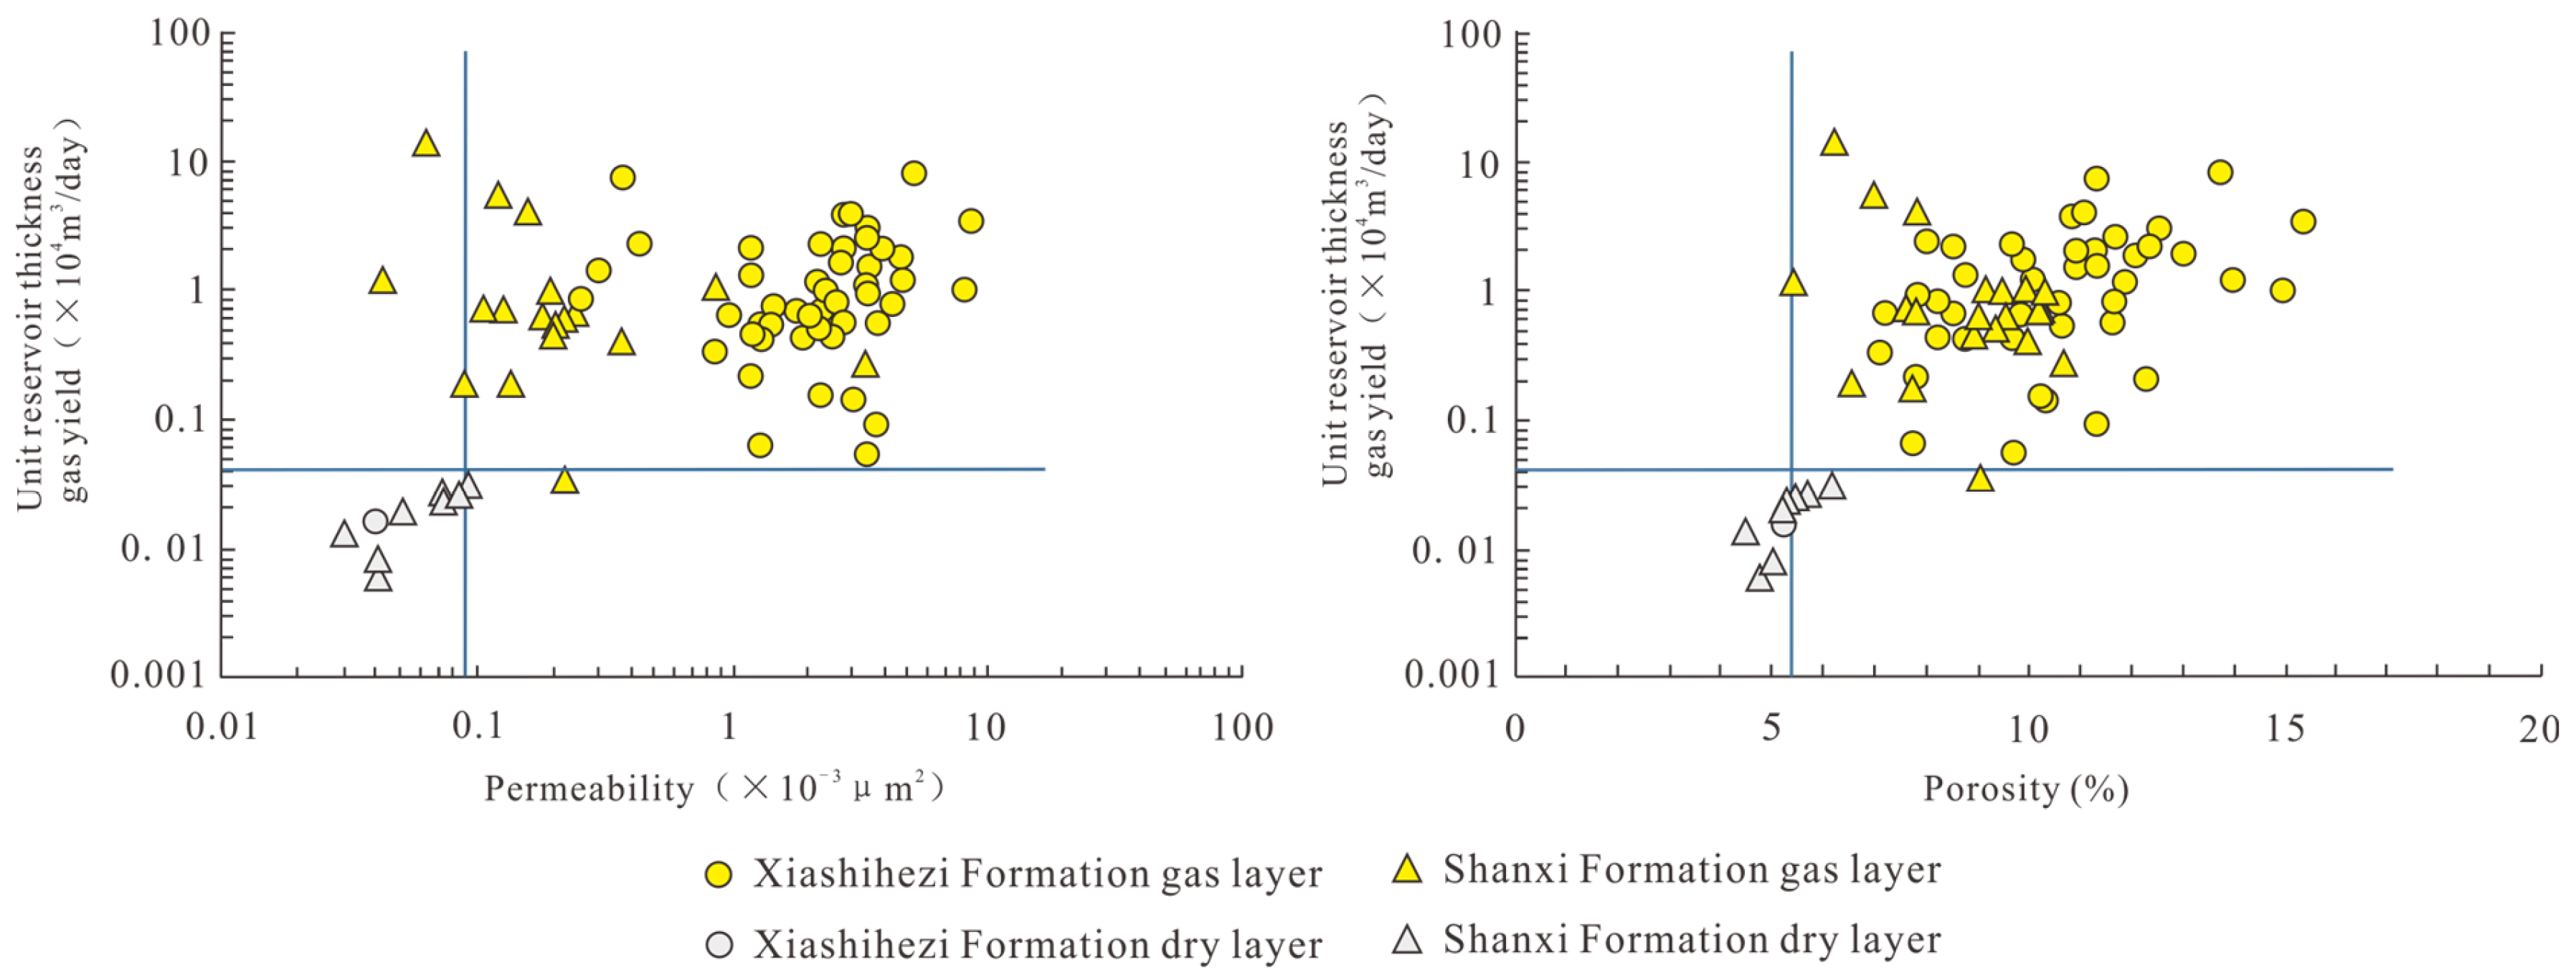
Given chlorite’s ability to preserve porosity during compaction, the selection of favorable intervals can be guided by the vertical trend in chlorite content (Figure 15). Specifically, at burial depths of about 3560 m, higher chlorite content most effectively limits further loss of sandstone porosity. Moreover, within this burial-depth range, reservoir intervals with porosity above 5% and permeability above 0.1 yield higher daily gas production (Figure 16). Beyond about 3560 m and toward 4000 m, further porosity loss is minimal (Figure 14). In parallel, the negative effect of compaction on porosity declines rapidly. At this stage, chemical dissolution can modestly increase porosity in the tight sandstones. Nevertheless, intervals with porosity above about 5% are thin and limited in extent, and wells generally require hydraulic fracturing to achieve sustainable flow.

6. Conclusions

(1)
The physical simulation experiments successfully replicated the complex diagenetic evolution sequence of the Permian Xiashihezi Formation sandstone. This sequence includes mechanical compaction, early calcite and chlorite cementation, feldspar dissolution, quartz overgrowth, and late-stage illite and ferroan calcite cementation. These results validate the diagenetic model established from geological sample analysis.
(2)
Mechanical compaction is the primary factor driving reservoir compaction, characterized by a three-stage process: rapid early-stage, stable mid-stage, and slow late-stage porosity reduction. Chemical cementation further densifies the reservoir, with early calcite and late-stage silica and illite cementation having the most detrimental impacts on reservoir quality.
(3)
The formation of key diagenetic minerals is governed by specific temperature, pressure, and geochemical conditions. Experiments confirm that underlying magnesium-rich strata can supply diagenetic materials to overlying sandstones through fluid migration, which is crucial for the early development of chlorite rims in the Permian Xiashihezi Formation. Chlorite rims help inhibit quartz overgrowth and preserve primary porosity, while the “bridging” infill of illite contributes to the development of “high-porosity, low-permeability” reservoirs. The burial depth of 3560 m is the most favorable range for maintaining porosity of chlorite.
(4)
The effectiveness of dissolution processes depends on the supply and retention of acidic fluids. In a closed experimental system, “acid consumption” reactions limit the impact of acidic fluids. This suggests that, under natural geological conditions, continuous supply of acidic fluids (such as those adjacent to hydrocarbon kitchens and fractures) is a prerequisite for forming large-scale secondary porosity “sweet-spot” reservoirs. The diagenetic evolution model, based on physical simulation, provides a dynamic basis for understanding the mechanisms of differential compaction in tight sandstones from various provenance and structural backgrounds. This study offers significant theoretical guidance for predicting “sweet-spot” reservoirs in the Ordos Basin and similar basins. The porosity of the sweet spot should be greater than 5% in order to acquire natural production.

Author Contributions

Conceptualization, H.J. and F.W.; methodology, C.H.; validation, C.W.; formal analysis, Y.H.; investigation, H.J. and F.W.; data curation, C.H.; writing—Original draft preparation, H.J. and F.W.; writing—Review and editing, C.H. and C.W.; visualization, Y.W.; supervision, Y.H.; project administration, Y.H. All authors have read and agreed to the published version of the manuscript.

Funding

The research was supported by the National Natural Science Foundation of China (No. 42272171), and the National Natural Science Foundation of China (No. 42302166).

Data Availability Statement

The original contributions presented in this study are included in the article. Further inquiries can be directed to the corresponding author.

Conflicts of Interest

Authors Hongxiang Jin, Feiyang Wang, Chong Han, Chunpu Wang, Yi Wu and Yang Hu were employed by the Chuanqing Drilling Engineering Co., Ltd. All the authors declare that the research was conducted in the absence of any commercial or financial relationships that could be construed as potential conflicts of interest.

References

  1. Chi, Y.; Liu, B.; Chen, Y.; Wang, B.; Bai, L.; Wang, L.; Xu, Y. Geochemical characteristics and mechanisms of densification of pre-Jurassic crude oil in the Tainan Sag, Turpan-Hami Basin, China. Unconv. Resour. 2022, 2, 183–191. [Google Scholar] [CrossRef]
  2. Ahmadi, S.; Khormali, A.; Kazemzadeh, Y. A critical review of the phenomenon of inhibiting asphaltene precipitation in the petroleum industry. Processes 2025, 13, 212. [Google Scholar] [CrossRef]
  3. Li, J.; Guo, B.; Zheng, M.; Yang, T. Main types, geological features and re-source potential of tight sandstone gas in China. Nat. Gas Geosci. 2012, 23, 607–615. [Google Scholar]
  4. Zhou, H.; Li, D.; Liu, X.; Du, Y.; Gong, W. Sweet spot prediction in tight sandstone reservoir based on well-bore rock physical simulation. Pet. Sci. 2019, 16, 1285–1300. [Google Scholar] [CrossRef]
  5. Wang, E.; Liu, G.; Pang, X.; Wu, Z.; Li, C.; Bai, H.; Zhang, Z. Sedimentology, diagenetic evolution, and sweet spot prediction of tight sandstone reservoirs: A case study of the third member of the Upper Paleogene Shahejie Formation, Nanpu Sag, Bohai Bay Basin, China. J. Pet. Sci. Eng. 2020, 186, 106718. [Google Scholar] [CrossRef]
  6. Wu, W.; Zhao, J.; Wei, X.; Wang, Y.; Zhang, J.; Wu, H.; Li, J. Evaluation of gas-rich “sweet-spot” and controlling factors of gas-water distribution in tight sandstone gas provinces: An example from the Permian He8 Member in Sulige Gas Province, central Ordos Basin, Northern China. J. Asian Earth Sci. 2022, 227, 105098. [Google Scholar] [CrossRef]
  7. Wang, W.; Lin, C.; Zhang, X.; Dong, C.; Ren, L.; Lin, J. Diagenesis, diagenetic facies and their relationship with reservoir sweet spot in low-permeability and tight sandstone: Jiaxing Area of the Xihu Sag, East China Sea Basin. Minerals 2023, 13, 404. [Google Scholar] [CrossRef]
  8. Wang, W.; Lin, C.; Zhang, X. Fractal Characteristics of Pore Throat and Throat of Tight Sandstone Sweet Spot: A Case Study in the East China Sea Basin. Fractal Fract. 2024, 8, 684. [Google Scholar] [CrossRef]
  9. Ma, C.; Song, H.; Wu, Y.; Cao, X.; Liu, H.; Zhang, H.; Fu, Y.; Wang, W.; Huang, C.; Fang, X. Differential diagenetic controls on petrophysical heterogeneity of lacustrine beach-bar tight sandstones: Insights from the Boxing Sag, eastern China. Mar. Pet. Geol. 2025, 181, 107537. [Google Scholar] [CrossRef]
  10. Tang, Y.; Jiang, W.; Tan, X.; Luo, L.; Garzanti, E.; Gluyas, J.; Yan, X.; Liu, J.; Lei, T.; Qu, X.; et al. Diagenetic processes controlled by volcanic detritus of the lower-middle permian shanxi and shihezi sandstone formations, north ordos basin, China. Depos. Rec. 2025, 1–24. [Google Scholar] [CrossRef]
  11. Cao, T.; Tan, X.; Luo, L.; Tian, J.; Tan, D.; Zhou, H.; Zha, X.; Wang, J.; Gao, X.; Zhu, C.; et al. Evolution mechanism of differential diagenesis combination and its effect on the reservoir quality in the tights and stone: A case from the Lower Shihezi Formation in the Hangjinqi area of Ordos Basin, China. Lithosphere 2021, 2021, 6832767. [Google Scholar] [CrossRef]
  12. Xiao, H.; Liu, R.; Zhang, F.; Lin, C.; Zhang, M. Sedimentary model reconstruction and exploration significance of Permian He 8 Member in Ordos Basin, NW China. Pet. Explor. Dev. 2019, 46, 268–280. [Google Scholar] [CrossRef]
  13. Jiang, Y.; Tao, Y.; Shen, Y.; Jiang, C.; Wang, Z.; Zhang, B.; Li, S.; Zhang, G. A new understanding of sedimentary facies of sandstones in the 2nd, 4th, and 6th members of the Upper Triassic Xu-jiahe Formation in the Large-Scale Middle Sichuan Basin. Nat. Gas Ind. 2011, 31, 39–50. [Google Scholar]
  14. Jiang, Y.; Zhang, C.; Zhang, B.; Xu, C.; Wang, M.; Fang, L.; Hu, C. Characteristics and identification of lithofacies in complex siliceous clastic reservoirs: A case study from Northwestern Sichuan Basin. Nat. Gas Ind. 2013, 33, 31–36. [Google Scholar]
  15. Jiang, Y.; Zhang, C.; Deng, H.; Wang, M.; Luo, M. Influences of clay minerals on physical properties of low permeability and tight sandstones. J. Southwest Pet. Univ. Sci. Technol. Ed. 2013, 35, 39–47. [Google Scholar]
  16. Cheng, B.; Liao, Z.; Lü, Z.; Xie, C.; Cai, Y.; Liu, S.; Li, F.; Zhang, S. Pore evolution characteristics and “sweet spot” reservoir development model in deep ultra-tight sandstones: A case study of the second member of Xujiahe Formation in eastern slope of western Sichuan Depression. Pet. Reserv. Eval. Dev. 2025, 15, 394–405. [Google Scholar]
  17. Meng, D.; Jia, A.; Ji, G.; He, D. Water and gas distribution and its controlling factors of large scale tight sand gas: A case study of western Sulige gas field, Ordos Basin, NW China. Pet. Explor. Dev. 2016, 43, 607–614. [Google Scholar] [CrossRef]
  18. Liu, J.; Zhang, C.; Jiang, Y.; Bai, G. Overpressure and gas charging in tight sandstone: Permian Xujiahe Formation, northeastern Sichuan Basin. Pet. Sci. 2022, 19, 2583–2600. [Google Scholar] [CrossRef]
  19. Xia, L.; Liu, Z.; Li, W.; Lu, C.; Yang, X.; Liu, M. Ternary analytic porosity-reduction model of sandstone compaction trend and its significance in petroleum geology: A case study of tight sandstones in Permian Lower Shihezi Formation of Shilijiahan area, Ordos Basin, China. Pet. Explor. Dev. 2018, 45, 275–286. [Google Scholar] [CrossRef]
  20. Zheng, J.; Lin, L.; Yu, Y.; Yuan, Q.; Wen, L.; Deng, X.; Huang, Y.; Qiu, Y.; Wei, J.; Zheng, C.; et al. Chronology and geofluids characteristics of calcite cement in the Upper Triassic Xujiahe Formation tight sandstone reservoir, Western Sichuan Basin, SW China. Mar. Pet. Geol. 2024, 170, 107148. [Google Scholar] [CrossRef]
  21. Zhao, J.; Yang, Y.; Chen, G.; Zheng, X.; Yin, S.; Tian, L. Controls of Multi-Scale Fractures in Tight Sandstones: A Case Study in the Second Member of Xujiahe Formation in Xinchang Area, Western Sichuan Depression. Lithosphere 2024, 343, 25. [Google Scholar] [CrossRef]
  22. Cai, W.; Xie, R.; Li, H.; Dou, S.; Li, S.; Deng, S.; Ma, T. Developmental characteristics of fractures in deep tight sandstone reservoirs in the second Member of the Xujiahe Formation of Zhongjiang Gas Field. Unconvention. Resour. 2024, 4, 100073. [Google Scholar] [CrossRef]
  23. Xia, X.; Han, B.; Xie, B.; Lai, Q.; Wang, Y.; Zhu, S. Estimation of water saturation based on optimized models in tight gas sandstone reservoirs: A case study of Triassic Xujiahe Formation in northwestern Sichuan Basin. Acta Geophys. 2025, 73, 407–419. [Google Scholar] [CrossRef]
  24. Guan, X.; Xiao, D.; Jin, H.; Cui, J.; Wang, M.; Shao, H.; Zheng, L.; Wang, R. Classification and Controlling Factors of Different Types of Pore Throat in Tight Sandstone Reservoirs Based on Fractal Features—A Case Study of Xujiahe Formation in Western Sichuan Depression. Minerals 2025, 15, 18. [Google Scholar] [CrossRef]
  25. Wang, Y.; Wang, X.; Chen, X.; Li, X.; Wu, J.; Gao, X.; Peng, J.; Wang, B.; Xie, Y.; Wu, H. Classification and origin of pore-throat systems in tight sandstone reservoirs: A case study of the Xujiahe Formation in the Northeastern Sichuan Basin, China. Front. Earth Sci. 2025, 13, 1572136. [Google Scholar] [CrossRef]
  26. Zhang, M.; Liu, M.; Cao, B.; Huang, P.; Wang, Z. Genesis of differential cementation by authigenic kaolinite in deep-buried tight sandstone reservoirs for the upper Triassic Xujiahe Formation, western Sichuan foreland basin, China. Mar. Pet. Geol. 2025, 181, 107526. [Google Scholar] [CrossRef]
  27. Gao, J.; Sun, N.; Hao, B.; Zhong, J.; Chen, Z.; Cao, Z. Lithologic characteristics and reservoir evolution of tight sandstones in the upper Triassic Xujiahe formation, northeast Sichuan Basin, China. Unconvention. Resour. 2025, 6, 100162. [Google Scholar] [CrossRef]
  28. Yang, J.; Jiang, Y.; Tang, B.; Pan, H.; Ye, J.; Zhou, Y.; Wang, J.; Wang, T.; Wang, Z. The classification evaluation of a tight sandstone reservoir and the controlling factors of the desert reservoir in the fourth member of the Xujiahe Formation in the Tianfu area, central Sichuan Basin, China. Interpretation 2025, 13, T277–T289. [Google Scholar] [CrossRef]
  29. Jiang, L.; Sun, X.; Chen, D.; Lei, W.; Yang, H.; Deng, Y.; Wang, Z.; Li, C.; Liu, T.; Geng, C.; et al. Tight sandstone gas reservoir types and formation mechanisms in the second member of the Xujiahe Formation in the Anyue Area, Sichuan Basin. Energies 2025, 18, 3009. [Google Scholar] [CrossRef]
  30. Gao, Z.; Feng, J.; Cui, J.; Wang, X.; Zhou, C.; Shi, Y. Physical simulation and quantitative calculation of increased feldspar dissolution pores in deep reservoirs. Pet. Explor. Dev. 2017, 44, 359–369. [Google Scholar] [CrossRef]
  31. Gao, Z.; Ma, J.; Cui, J.; Feng, J.; Zhou, C.; Wu, H. Deep reservoir pore evolution model of a geological process from burial compaction to lateral extrusion. Acta Sedimentol. Sin. 2018, 36, 176–187. [Google Scholar]
  32. Cui, H.; Zhu, S.; Tan, M.; Tong, H. Depositional and diagenetic processes in volcanic matrix—Rich sandstones from the shanxi and shihezi formations, ordos basin, china: Implication for volcano—Sedimentary systems. Basin Res. 2022, 34, 1859–1893. [Google Scholar] [CrossRef]
  33. Gao, J.; Ma, B.; Lu, Y.; Zhang, W.; Cao, Q. Origin of authigenic kaolinite with implications for permian tight gas sandstone reservoirs in the northern ordos basin, central china. J. Nat. Gas Sci. Eng. 2022, 99, 104429. [Google Scholar] [CrossRef]
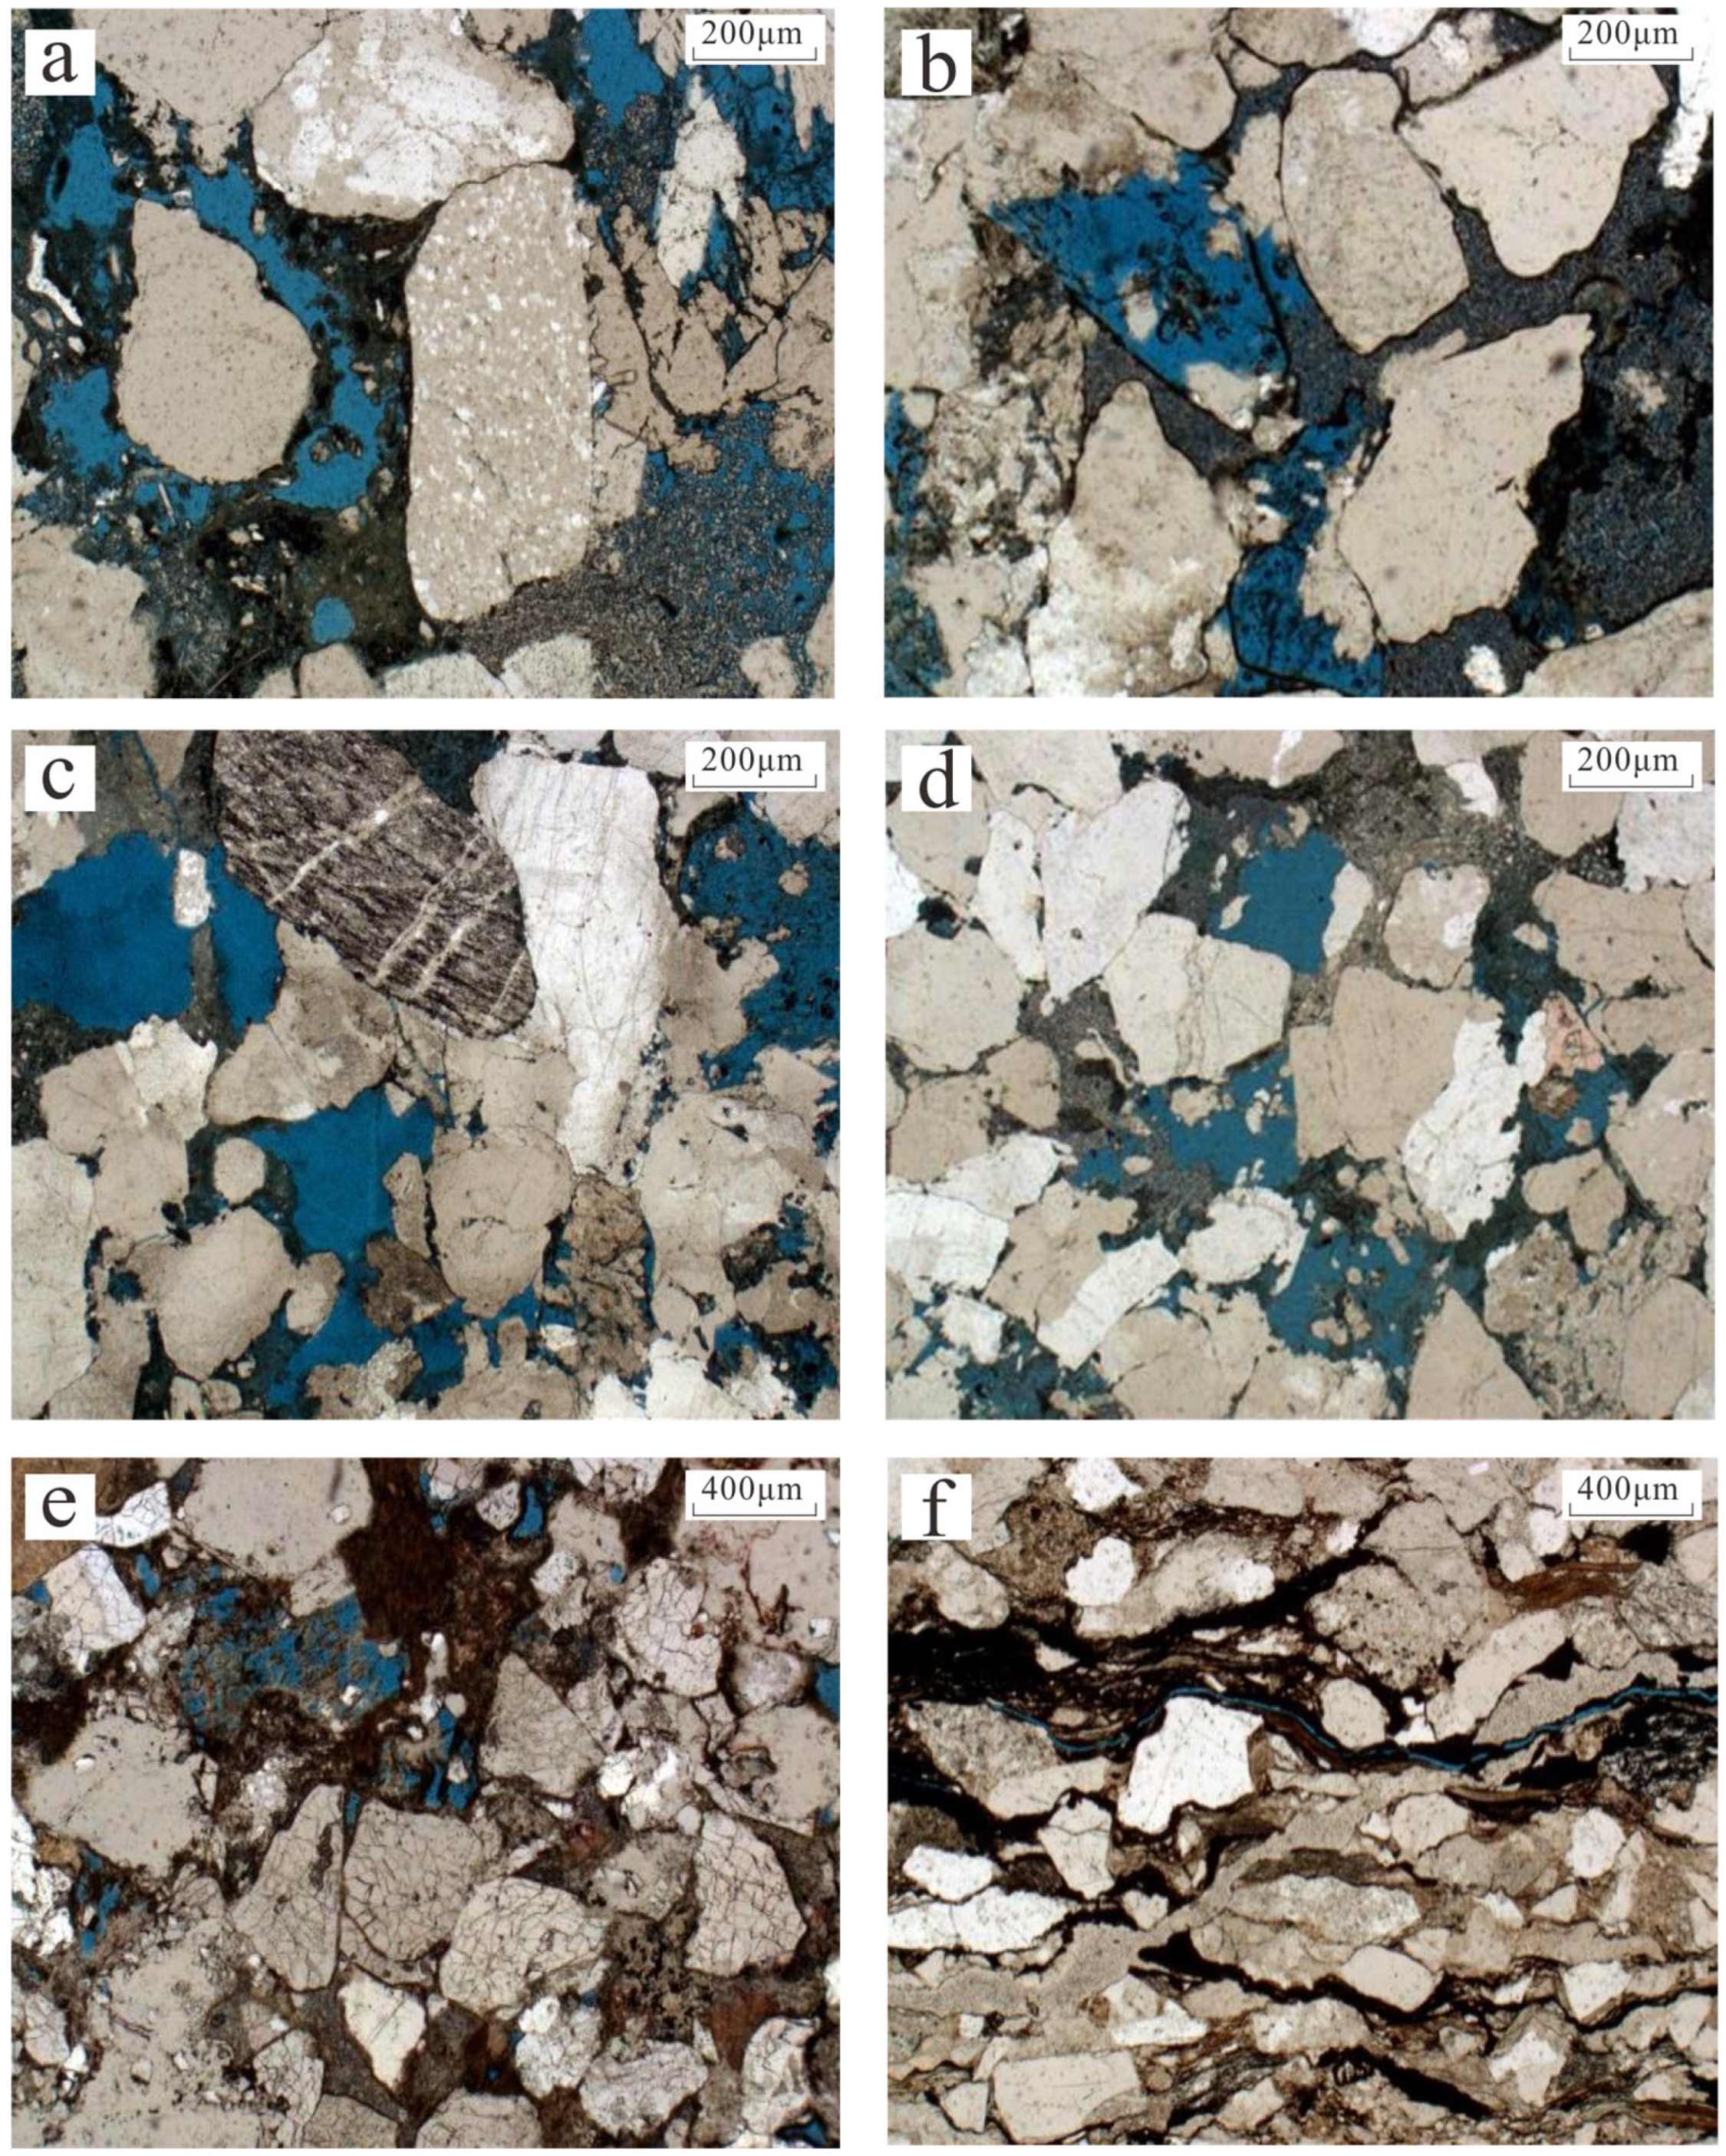
Figure 2. Petrographic characteristics of sandstone at different stages of physical simulation. (a) The particles under the thin sheet are dispersed and in point contact, and the sheet-like minerals are not compressed. (b) The minerals under the thin section exhibit point contacts, with occasional line contacts. (c) The minerals under the thin section exhibit point line contact, and the proportion of line contact increases. (d) Under the thin section, minerals are mostly in linear contact, and the sheet-like minerals are fractured. Mica shows a knee bending phenomenon, and rigid minerals such as quartz and feldspar exhibit varying degrees of fracturing. (e) The mineral contact under the thin section is tighter, and the particle line contact increases. (f) The minerals under the thin section are basically in line contact, and the porosity decreases.
Processes 13 03191 g002
Figure 3. Tight sandstone sample porosity variation curve with simulated burial depth.
Processes 13 03191 g003
Figure 4. The petrological characteristics of quartz overgrowth in simulated sandstone sample. (a) Simulated burial depth of 4200 m (plane-polarized light). (b) Simulated burial depth of 3100 m (plane-polarized light). (c) Simulated burial depth of 4200 m (cross-polarized light). (d) Simulated burial depth of 3100 m (cross-polarized light). (e) Simulated burial depth of 4200 m (cathodoluminescence). (f) Simulated burial depth of 3100 m (cathodoluminescence).
Processes 13 03191 g004
Figure 5. SEM-EDS characteristics and energy spectrum test results of authigenic siliceous minerals in simulated sample.
Processes 13 03191 g005
Figure 6. Cross-plot of cement content and porosity in tight sandstone reservoirs of Xiashihezi Formation. (a) Cross-plot of siliceous cement content and porosity in tight sandstone reservoirs in North Ordos Basin. (b) Cross-plot of siliceous cement content and porosity in tight sandstone reservoirs in South Ordos Basin. (c) Cross-plot of calcite cement content and porosity in tight sandstone reservoirs in North Ordos Basin. (d) Cross-plot of calcite cement content and porosity in tight sandstone reservoirs in South Ordos Basin.
Processes 13 03191 g006
Figure 7. The petrological characteristics of calcite cement in simulated sandstone sample. (a) Simulate temperature between 65–85 °C, simulate burial depth of 1800 m (plane-polarized light). (b) Simulate temperature between 65–85 °C, simulate burial depth of 1800 m (plane-polarized light). (c) Simulate temperature between 65–85 °C, simulate burial depth of 1800 m (cross-polarized light). (d) Simulate temperature between 65–85 °C, simulate burial depth of 1800 m (cross-polarized light). (e) Simulate temperature between 65–85 °C, simulate burial depth of 1800 m (cathodoluminescence). (f) Simulate temperature between 65–85 °C, simulate burial depth of 1800 m (cathodoluminescence).
Processes 13 03191 g007
Figure 8. SEM-EDS characteristics and energy spectrum test results of authigenic chlorite cement in simulated sample (The red cross represents the position of EDS).
Processes 13 03191 g008
Figure 9. SEM-EDS characteristics and energy spectrum test results of authigenic illite cement in simulated sample (The red cross represents the position of EDS).
Processes 13 03191 g009
Figure 10. Cross-plot of authigenic chlorite and reservoir parameters in tight sandstone reservoirs of Permian Xiashihezi Formation.
Processes 13 03191 g010
Figure 11. Cross-plot of authigenic illite and reservoir parameters in tight sandstone reservoirs of Permian Xiashihezi Formation.
Processes 13 03191 g011
Figure 12. Petrological characteristics of dissolution effect in simulated sandstone sample. (a) Simulate temperature between 150 °C, simulate burial depth of 3800 m (plane-polarized light). (b) Simulate temperature between 150 °C, simulate burial depth of 3800 m (cathodoluminescence). (c) Simulate temperature between 175 °C, simulate burial depth of 4100 m (plane-polarized light). (d) Simulate temperature between 175 °C, simulate burial depth of 4100 m (cathodoluminescence).
Processes 13 03191 g012
Figure 13. Variations in ion/element concentration of diagenetic fluids during physical simulation of tight sandstone reservoir.
Processes 13 03191 g013
Figure 14. Comprehensive schematic diagram of diagenetic evolution and porosity variation of tight sandstone in Permian Xiashihezi Formation.
Processes 13 03191 g014
Figure 15. Longitudinal variation of clay mineral content in Permian Xiashihezi Formation tight sandstone.
Processes 13 03191 g015
Figure 16. The correlation between natural gas production, porosity, and permeability in tight sandstone reservoirs of Xiashihezi Formation and Shanxi Formation.
Processes 13 03191 g016
Table 1. Mineral components of tight sandstone core samples from the Permian Xiashihezi Formation.
Well No.Depth (m)StrataDetrital TypeCompositionContent (%)Interstitial MaterialCompositionContent (%)
A13300Permian Xiashihezi Formation QuartzQuartz52Matrixargillaceous9
FeldsparK-feldspar12CementCalcite0
Plagioclase8Dolomite0
DebrisBiotite3Chlorite2
Volcanic rock8Quartz overgrowth2
Quartzite0Authigenic siliceous mineral0
Schist1Illite1
Siltstone1
Slate1
Total content (%) 86 14
Table 2. Statistical analysis of water properties in the Permian Xiashihezi Formation.
Water TypeValue TypeIon Concentration (mg/L)Total Mineralization Degree
(g/L)
PH Value
K++Na+Ca2+Mg2+ClHCO3
CaCl2minimum value28,56615,02972558,920881095
Maximum value59,32819,53612,361123,5605382557
average value45,625 15,255 5869 105,690 160 2826
Table 3. Composition ratio of sandstone samples used in simulation experiment.
UnitDetrital CompositionInterstitial MaterialTotal
QuartzK-FeldsparBasaltBiotiteSchistSiltstoneGraniteMudstoneArgillaceousSiliceous
%551874323152100
g70.223.496.67.86.65.46.695.4150
Disclaimer/Publisher’s Note: The statements, opinions and data contained in all publications are solely those of the individual author(s) and contributor(s) and not of MDPI and/or the editor(s). MDPI and/or the editor(s) disclaim responsibility for any injury to people or property resulting from any ideas, methods, instructions or products referred to in the content.