Abstract
Corona treatment is commonly used in industry to enhance the surface-free energy of plastic films. However, corona treatment may cause some undesirable effects affecting further processing, such as sealing. In this paper, we deeply analyze the corona treatment effect on selected properties of various polymer films commonly used in packaging applications. The films were treated at two power levels (100 W and 300 W), and the experimental design included surface characterization and mechanical testing to assess changes in wettability, chemical structure, and seal strength. The Owens–Wendt approach confirmed the corona treatment effect by static contact angle measurement and surface free energy calculation. Next, their seal strength was evaluated in relation to surface energy and chemical structure changes. FTIR spectroscopy was used to identify functional groups potentially affected by corona treatment. The results indicate that the impact of corona treatment is material-dependent. In general, corona treatment at a lower level increases the seal strength, while corona treatment at a higher power level is related to a decrease in seal strength. The study highlights the importance of optimizing corona treatment parameters for specific materials to enhance seal performance without compromising surface integrity.
1. Introduction
Plastic films based on fossil resources are commonly used for packaging purposes. At the same time, food packaging represents the fastest-growing segment of the synthetic plastic packaging market [1]. Despite their non-degradability, they are still the best material for food packaging due to their permeability, lightness, processing simplicity, and packaging forming [2,3,4]. However, plastic films require some technological operation before they hit store shelves in the form of packaging. Many common polymers, such as polyethylene (PE) and polypropylene (PP), inherently possess low surface free energy [5], rendering them chemically inert and difficult to bond with inks, coatings, and adhesives. Phenomena occurring on the surface, values of surface free energy, and wettability are critical for some applications involving adhesion, coating, or printing processes, and may be crucial to achieve proper coating. For example, a proper bonding between the ink and the polymer substrate requires that the substrate surface free energy exceeds ink surface tension by 2–10 mN·m−1 [6]. This fundamental challenge in wettability and adhesion requires surface modification techniques to enable effective further processing. To achieve proper wetting, either the surface tension of the liquid must be decreased, or the surface free energy of the polymer substrate must be increased [7]. Therefore, polymer films must be activated by corona, flame, or plasma treatment before printing. Among them, the most popular technological operation is corona treatment, which allows for the increase in surface free energy of films, surface roughness, and the removal of impurities [8]. Corona treatment is found to be a highly effective, widely adopted, and industrially scalable method for enhancing the surface properties of plastic films. As a result of the corona treatment, during which the plastic film passes through plasma, high-energy electrons bombard its surface, creating new polar groups [9] and etching the surface [10]. This process significantly increases the surface free energy, hydrophilicity, and surface roughness of the plastic film, making it far more susceptible to various liquid-based applications. Corona discharge has found applications in various processes, i.e., air pollution control [11], natural fiber and raw materials modification [10,11], and sterilization [12].
The primary objective of the corona treatment of polymer films is to enhance the surface free energy of films for improved adhesion. Due to the treatment, novel polar groups, such as hydroxyl, carbonyl, and ester, appear on the film surface [13,14], resulting in a higher surface polarity. However, it must be mentioned that higher corona treatment can result in so-called “overtreatment,” causing surface degradation, bumps, and consequently lower adhesion and wettability [15]. Another problem is the disappearance of the corona treatment effect with time, so-called aging [16]. Finally, corona treatment may cause unintentional and undesirable treatment of the film’s other (bottom) side.
Understanding how the corona treatment process affects properties like mechanical strength, sealability, and aging behavior is paramount for optimizing manufacturing processes and ensuring the long-term performance of end products. The problem of the influence of corona treatment on the various properties of plastic films was already reported in the literature [8,10,17,18,19]. The changes in wettability and surface free energy were widely studied in the literature since the 1970s [20]. However, the corona treatment is related to various changes in the surface monolayer. Ding et al. conducted extensive research on the changes occurring during the corona treatment process of biaxially oriented polypropylene [21]. The corona treatment cracks the polymer chains, resulting in novel functional groups, for example, carbonyl C=O, which can be easily observed by ATR FTIR spectroscopy. Furthermore, the changes in surface morphology result in the appearance of uniform and uneven bulges [14,21]. Matsunaga and Whitney analyzed the influence of corona treatment on the ability to colonize low-density polyethylene [22]. The corona treatment promotes the colonization of low-density polyethylene compared to untreated films. Finally, the corona treatment of plastic films changes during storage due to the instability of groups formed during the treatment process [23]. During the aging process, rearrangement between polymer chains and polar groups may occur, resulting in the attack of the polymer chains by the free radicals formed in the monolayer [16].
The interaction of the corona plasma with the polymer surface extends beyond simple chemical modification, leading to complex changes that demand thorough investigation. The corona treatment effect varies for different materials. Müller et al. observed that the adhesion of a barrier SiOx-layer to recycled polypropylene is poorer than to virgin polypropylene [24]. While many studies have focused on changes in surface energy and chemical composition after corona treatment, the impact of treatment intensity on the sealability of different polymer films remains insufficiently explored.
Some researchers reported the negative impact of corona treatment on seal strength [13,25]. This effect may be related to the crosslinking of polymer chains during treatment, which limits the mobility of polymer chains [25].
To address this gap, the present study provides important insights into how varying corona treatment power levels (100 W and 300 W) affect the sealability of commonly used polymer films intended for packaging. In addition to analyzing surface free energy and chemical structure, we evaluate seal strength better to understand the trade-offs between surface activation and heat-sealing performance. To the best of our knowledge, this is one of the first comparative studies to systematically examine the relationship between corona treatment intensity and sealability across multiple polymer substrates.
2. Materials and Methods
2.1. Materials
Six different films were provided by an industrial partner under non-disclosure terms. Due to confidentiality agreements, detailed information about the film production methods could not be disclosed. However, all films were commercially available and commonly used in packaging applications. It is important to note that manufacturing parameters may influence the microstructure and surface behavior of the films, potentially affecting their response to corona treatment. Therefore, while the selected samples reflect typical industrial materials, the findings should be interpreted with consideration of this limitation.
The sample descriptions are summarized in Table 1. The polymer composition of the films was confirmed with ATR-FTIR to compensate for the lack of commercially available information, which stems from the industry’s high level of confidentiality.

Table 1.
Sample description: PE—polyethylene, OPP—oriented polypropylene, BOPP—biaxially oriented polypropylene.
2.2. Methods
2.2.1. Attenuated Total Reflectance Fourier-Transform Infrared Spectroscopy
FTIR spectra were recorded at room temperature, in the 400–4000 cm−1 range with a resolution of 4 cm−1, using a Nicolet iS5 spectrometer (Thermo Scientific, Waltham, MA, USA) equipped with a Platinum single-reflection diamond Attenuated total reflectance, ATR, module and then analyzed with OMNIC Spectra™ software (series 9.12.968).
2.2.2. Corona Treatment
The plastic films were corona-treated using the manual laboratory Corona-Plus equipment (Vetaphone, Kolding, Denmark) designed for the corona treatment of polymer films or paper sheets. The sheets, approx. 320 mm width and 210 mm length of the investigated plastic films were placed in a laboratory corona treatment chamber, and were corona treated using two output powers, 100 W and 300 W, which are approx. 99 and 297 W·min·m−2, respectively. The ceramic electrode passed over the film surface twice (forward and backward), twice at a speed approx. 100 mm·s−1. The selected power levels were based on preliminary tests, as higher intensities caused visible surface degradation.
2.2.3. Surface Free Energy Measurement
The static contact angle was measured with a drop shape analysis system, DSA 30E (Krüss, Hamburg, Germany), approximately 5 s after the drop deposition. A droplet volume of 2 µL was used for both liquids. The measurement of contact angles was repeated six times. For the surface free energy calculation, water was applied as a polar liquid, and diiodomethane as a dispersive liquid. Surface free energy was calculated according to the Owens–Wendt approach [26] using the following equations:
where and are dispersive and and are dispersive and polar components of solid (S) and liquid (L), respectively; is the solid–liquid interfacial energy; and and are the SFE of the solid and liquid, respectively. For the calculation, surface energy used for water was ( and ) and for diiodomethane was ) based on ref. [27].
The surface free energy was determined before and after corona treatment of the plastic sheets.
2.2.4. Heat Sealing
The previously corona-treated sheets were welded with the corona-treated side facing inwards on a heat impulse sealing machine. Heat sealing was performed with a manual impulse heat sealer machine equipped with a 2 mm width sealing bar. The heat welding was performed at 120 °C for PE and 130 °C for polypropylene film, for 5 s. The sealing bar was preheated for 10 min before each series. The heat-sealing parameters—temperature, pressure, and sealing time—were kept constant throughout all experiments to ensure comparability and isolate the effect of surface free energy. The system for controlling the parameters of the welding machine consisted of a CX5240 controller with an implemented program based on a PID (Proportional–Integral–Derivative) algorithm. The temperature of the welding machine’s heating tape was measured using a type K thermocouple connected via the EL3314 module. Power control delivered to the heating tape was carried out using a TC10A module (Eurotherm by Watlow, Worthing, UK) with a 0–10 V control output, which was interfaced with the automation system through the EL4136 module. The CX5240 controller, EL3314, and EL4136 modules were purchased from Beckhoff Automation GmbH & Co. KG (Verl, Germany).
The welded sheets were left in an air-conditioned laboratory at a temperature of 21 °C and 50% RH for 7 days. This period was set at 7 days to eliminate the effect of insufficient bonding of the film layers and to reflect the actual conditions of the product circulation, which was placed in a flexible package that was closed by welding. After 7 days, the sheets were divided into samples 15 mm wide and at least 50 mm long.
2.2.5. Mechanical Properties and T-Peel Test for Bonding Strength
The thickness of the films for the mechanical measurements was measured with a hand-held micrometer with 0.001 mm resolution and an error of ± 0.5 mm.
Mechanical properties of the films before and after corona treatment were analyzed according to ISO 527-1:2019 [28] and ISO 527-3:2018 [29] standards using a Z010 tensiometer (Zwick-Roell, Ulm, Germany). Figure 1 presents schematic representations of the sealed samples placed in the grips of the tensile testing machine. The following settings were applied for the mechanical properties’ determination: the sample dimensions were 15 mm in width and 100 mm in length; the initial distance of the clamps was 50 mm; and the stretching speed was 100 mm·m−1. Tensile strength, elongation at break, and Young’s modulus were determined based on the stress–strain curves. The testing machine was calibrated according to manufacturer specifications prior to each measurement series.
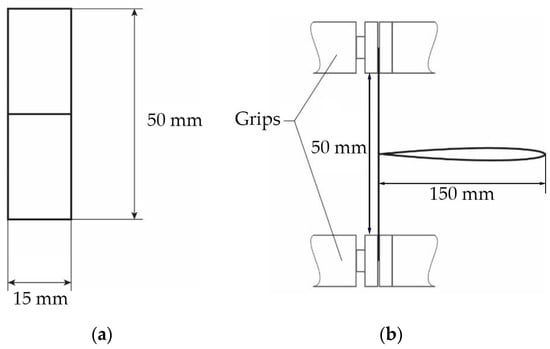
Figure 1.
Schematic representation of a sealed sample for the seal strength test: (a) after cutting, (b) placed in the jaws of the stripper.
The bonding strength was determined using the T-peel test according to the ISO 11339:2022 standard [30] using a Z010 ZwickRoell (Zwick-Roell, Ulm, Germany) tensile testing machine with a crosshead speed of 300 mm/min for a 50 mm grip distance. The peak load was recorded for each specimen. The bonding strength for each sample was determined using the average peeling force divided by the specimen width (Equation (2)):
where F is the pealing force (peak load) and b is the specimen width (15 mm).
All measurements, i.e., SFE and mechanical properties, were performed at controlled conditions (23 ± 0.5 °C; 50 ± 1%RH).
2.2.6. Statistical Analysis
The data were analyzed by one-way analysis of variance (ANOVA) using Statgraphics Centurion 19 (v.19.1.3, StatPoint®, Inc., Warrenton, VA, USA) with means comparison by Tukey’s test (at 95% confidence interval). The correlation between surface free energy, mechanical properties, and seal strength was analyzed through the Pearson product-moment coefficient.
3. Results and Discussion
3.1. Infrared Spectroscopy
Figure 2 shows an FT-IR spectrum of the PE and BOPP samples. In PE spectra, four typical bands, which can be assigned to methylene groups, are present. Those bands can be assigned to asymmetric (at 2915 cm−1) and symmetric stretching vibration (2847 cm−1), bending (1459 cm−1), and rocking vibration (719 cm−1) of the C–H bond in the methylene group [31]. Furthermore, in PP spectra, typical bands are present: at 2925, 2919, 2835 cm−1, which can be assigned to –CH3 and –CH2 asymmetric and –CH2 symmetric stretching, respectively [32]. The peaks at 1462 and 1375 cm−1 are attributed to –CH2 and –CH3 symmetric bending. The low intensity peak at 1148 cm−1 is attributed to C–C asymmetric stretching, the peaks at 975 and 969 cm−1 are related to –CH3 asymmetric rocking vibration, while the absorption peaks at 837 and 803 cm−1 are associated with CH2 rocking vibration [33].
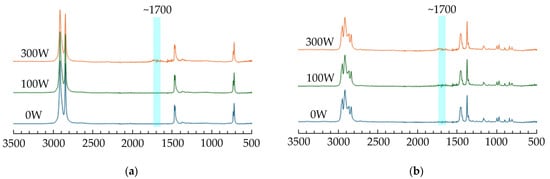
Figure 2.
FTIR spectra of PE (a) and BOPP (b) for various treatment corona power levels.
At approx. 1700 cm−1 at a higher corona treatment level (300 W), a typical band indicating formation of –C=O groups can be observed. However, this band is extremely faint, even at higher corona power levels. A typical broadband at 3700~3000 cm−1 related to the hydroxyl stretching vibration was not observed by us.
3.2. Surface Free Energy
The results of water contact angle (WCA), together with surface free energy (γS) and its dispersive () and polar () components are summarized in Table 2. As expected, corona treatment significantly affected the surface properties of the tested samples. Increasing the discharge power from 0 (untreated) to 100 and 300 W led to a substantially reduced water contact angle (WCA), indicating improved surface wettability. This effect is related to the appearance of polar groups, such as –C=O, –OH, and –COOH, on the film’s surface upon corona treatment [18,19,34]. Despite the lack of appearance of typical bands in FTIR spectra confirming the formation of hydroxyl groups, the changes in WCA are visible (see Figure 3). For PE film, WCA decreased from 93.9 ± 3.14° for the untreated sample to 62.01 ± 4.45° and 55.70 ± 2.21° at 100 and 300 W, respectively. These differences were statistically significant according to one-way ANOVA (F(2,29) = 384.22, p < 0.0001), and confirmed by Tukey’s post-hoc test, which indicated significant pairwise differences between all groups. The decrease in the WCA values with increased power level of corona treatment for the PE film was previously reported [13,22].
Table 2.
Water contact angle (WCA) and surface free energy (γS) and its dispersive () and polar () component at different power levels (0, 100, and 300 W).
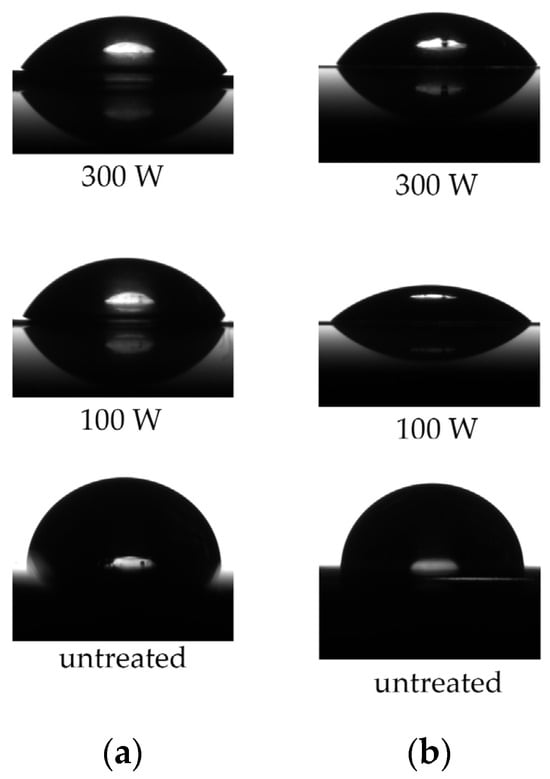
Figure 3.
WCA changes for PE (a) and BOPP (b) for various treatment corona power levels.
A similar tendency of WCA changes upon corona treatment was observed for OPP1 film. ANOVA results confirmed the differences to be highly significant (F(2,30) = 914.00, p < 0.0001), with Tukey’s test indicating significance across all pairs.
On the other hand, for other film samples investigated in this study, a slight minimum for the WCA value was observed at the corona treatment level of 100 W, and an increase in the WCA value at the value of 300 W. For example, for OPP film, the WCA values decreased notably from 100.66 ± 2.23 to 53.08 ± 3.38 and 56.78 ± 2.56° for untreated and corona-treated at 100 and 300 W power levels, respectively. These differences were statistically significant (ANOVA: F(2,31) = 1022.06, p < 0.0001), with all pairwise comparisons significant according to Tukey’s HSD test (p < 0.05). Furthermore, the same tendency was reported for other polypropylene films: OPP2 (F(2,29) = 449.52, p < 0.0001), BOPP (F(2,29) = 657.51, p < 0.0001), as well as polyethylene terephthalate, BOPP2, film (F(2,30) = 793.15, p < 0.0001).
The polar component of surface free energy changes is strongly related to the changes in WCA. For the OPP1 film, the increase in dependence on the corona treatment level is linear. The value for untreated film is 0.42 ± 0.25 mJ·m−2, while after corona treatment, it increases up to 6.92 ± 1.19 and 11.30 ± 1.01 mJ·m−2 at 100 and 300 W corona treatment level, respectively. The dispersive component grows from 28.81 ± 2.15 m to 40.51 ± 0.94 and 40.92 ± 0.82 mJ·m−2, respectively. Consequently, total SFE increased nearly 80% from 29.23 ± 1.99 for the untreated film to over 52.22 ± 1.10 mJ·m−2 after treatment at 300 W corona treatment level. These effects were confirmed by one-way ANOVA (: F(2,30) = 395.96; : F(2,30) = 252.97; γS: F(2,30) = 592.58; all p < 0.0001). Finally, for other investigated films, a noticeable increase in total SFE and its polar and dispersive components was observed after corona treatment, with slightly higher values at 100 W. ANOVA showed a highly significant effect of corona power on , and γS for all investigated films (PE, : F(2,29) = 293.92; : F(2,29) = 236.25; γS: F(2,29) = 218.21; OPP2 : F(2,29) = 190.93; : F(2,29) = 112.58; γS: F(2,29) = 482.88; OPP: : F(2,31) = 479.30; : F(2,31) = 39.14; γS: F(2,31) = 384.59; BOPP: : F(2,29) = 858.18; : F(2,29) = 139.28; γS: F(2,29) = 323.78, BOPP2: : F(2,30) = 452.37; : F(2,30) = 93.93; γS: F(2,30) = 379.73; all p < 0.0001). The presence of a minimum for WCA and polar component of SFE might be related to overtreatment resulting from the surface degradation upon corona treatment or crosslinking of polymer macromolecules in the upper monolayer [19].
3.3. Mechanical Properties
The mechanical properties of the investigated films are summarized in Table 3. Mechanical properties were assessed based on Young’s modulus (YM), tensile strength (TS), and elongation at break (EaB). ANOVA followed by Tukey’s honest significant difference (HSD) test (α = 0.05) was used to determine the statistical relevance of differences among treatment levels. For all films, except OPP and BOPP2 (in terms of YM), corona treatment significantly influenced mechanical properties (p < 0.05), particularly for TS and EaB. In general, YM, TS, and EaB changes have a nonlinear character with an extremum at 100 W.
Table 3.
Mechanical properties of films after corona treatment at different power levels (0, 100, and 300 W).
A significant effect of corona treatment was observed for the mechanical parameters investigated in this work for PE films. ANOVA results showed F(2,27) = 3.54 (p = 0.0431) for YM, F(2,27) = 29.75 (p < 0.0001) for TS, and F(2,27) = 56.30 (p < 0.0001) for EaB. Tukey’s test indicated that all corona treatment levels differed significantly in both TS and EaB, demonstrating a considerable decrease in tensile strength and an increase in elongation at break with increasing corona treatment power from 407 ± 49 to 782 ± 35% for untreated film and corona-treated at 300 W, respectively. Simultaneously, TS increases from 19 ± 1 to 25 ± 8 MPa for untreated and corona-treated films on the highest power level (300 W), respectively.
OPP1 film showed highly significant changes, with F-ratios of F(2,27) = 22.57, F(2,27) = 89.75, and F(2,27) = 51.45 for YM, TS, and EaB, respectively (all p < 0.0001). Post-hoc comparisons confirmed that each treatment level resulted in considerable changes in mechanical behavior. TS decreases linearly with the corona treatment power level increase, from 164 ± 15 to 82 ± 13 MPa for untreated and corona-treated films at 300 W, respectively. EaB initially dropped to 16 ± 3% at 100 W from 36 ± 9% for the untreated film and then unexpectedly increased to 110 ± 35% at 300 W, suggesting nonlinear structural rearrangements related to oxidation or crosslinking, leading to embrittlement at low level corona tretament. While higher intensity (300 W) corona treatment may cause chain scission and increase amorphous content, resulting in enhanced ductility. In contrast, BOPP revealed an increase in TS (F(2,27) = 25.26; p < 0.0001) and a decrease in EaB (F(2,27) = 437.59; p < 0.0001) with an increasing treatment level.
Post-hoc Tukey tests revealed significant differences between treatment groups for most material-property combinations. For OPP2, corona treatment at 100 W resulted in significantly higher TS (102 ± 8 MPa) compared to both untreated (68 ± 12 MPa) and 300 W (67 ± 8 MPa) treatments (F(2,27) = 42.52; p < 0.001). Furthermore, EaB showed the opposite trend, decreasing at 100 W·min·m−2 to 11 ± 2% from 108% for the untreated film and increased again at 300 W·min·m−2 to 97 ± 18% (F(2,27) = 69.31; p < 0.001). Moreover, OPP film exhibited a minimum of TS and EaB at 100 W power level, with overall lower values of TS and EaB at 300 W power level than the untreated film. All effects were confirmed as statistically significant (TS: F(2,27) = 13.52; p < 0.001; EaB: F(2,27) = 11.77; p < 0.001). Vishnuvarthanan and Rajeswari reported a similar trend for PP film, with tensile strength dropping by about 77% due to polypropylene etching and degradation [35].
3.4. Seal Strength
The seal strength was evaluated after surface treatment at three power levels: 0 (no activation), 100, and 300 W. The results are listed in Table 4. The effect of corona treatment on seal strength was observed, with the response depending strongly on the type of film.
Table 4.
Seal strength results for selected films activated at different corona treatment power levels (0, 100, and 300 W).
For PE film, treatment at 100 W slightly improved seal strength (0.609 ± 0.073 N·mm−1) compared to untreated films (0.549 ± 0.080 N·mm−1). However, a further increase to 300 W caused a decrease in strength (0.513 ± 0.034 N·mm−1). Popelka et al. reported a similar trend for LLDPE/Al (linear low-density PE and Aluminum) adhesion joints [36]. In the case of BOPP2 film, a similar trend was observed: treatment at 100 W slightly improved seal strength from 0.231 ± 0.068 and 0.267 ± 0.041 N·mm−1 for untreated and corona-treated at 100 W power level, while 300 W led to a decrease of 0.202 ± 0.034 N·mm−1 compared to untreated films.
The effect may be potentially related to degradation, surface overtreatment, or chain scission in the surface upper layer [37].
In contrast, all polypropylene-based films (OPP, OPP1, OPP2, and BOPP) exhibited reduced seal strength upon corona treatment, regardless of power level. The most pronounced decrease was observed for BOPP, which showed a 33% drop at 300 W. These results suggest that corona treatment might negatively affect the sealability of polypropylene films, possibly due to oxidation-induced degradation, disruption of the sealing layer, or formation of a brittle oxidized layer that weakens interfacial adhesion. The changes in seal strength for the films investigated are directly related to the changes in SFE. An increase in SFE value (at 100 W power level treatment) corresponds to an increase in seal strength. Conversely, a decrease in SFE is associated with reduced seal strength (see Figure 4).
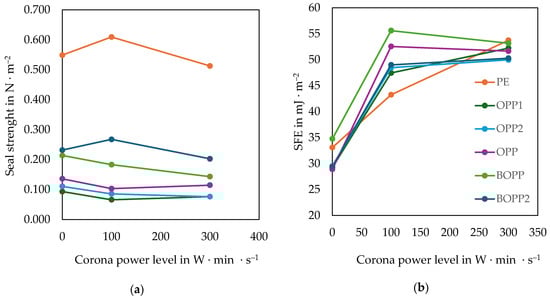
Figure 4.
Comparison of the trend in SFE (a) and seal strength (b) as a function of corona treatment level. Error bars were intentionally omitted.
Among the OPP-type films, OPP1 and OPP2 were especially sensitive to activation: the seal strength dropped by 29% and 23% to 100 W. Interestingly, a slight recovery was noted at 300 W, but the values remained below seal strength for untreated films.
One-way ANOVA revealed statistically significant differences in seal strength between surface activation conditions for PE (F(2,25) = 4.08, p < 0.0293), OPP1 (F(2,26) = 7.18, p < 0.0033), OPP2 (F(2,28) = 4.69, p < 0.0176), and BOPP (F(2,22) = 13.10, p < 0.0002). While observed differences for BOPP2 and OPP were not statistically significant (p > 0.05), suggesting that the variations fall within the natural variability and measurement uncertainty range.
3.5. Correlation Analysis
To investigate the relationships between surface free energy, mechanical properties (elongation at break and tensile strength), and seal strength, Pearson and Spearman correlation coefficients were calculated. Figure 5 shows Pearson’s correlation heatmap.
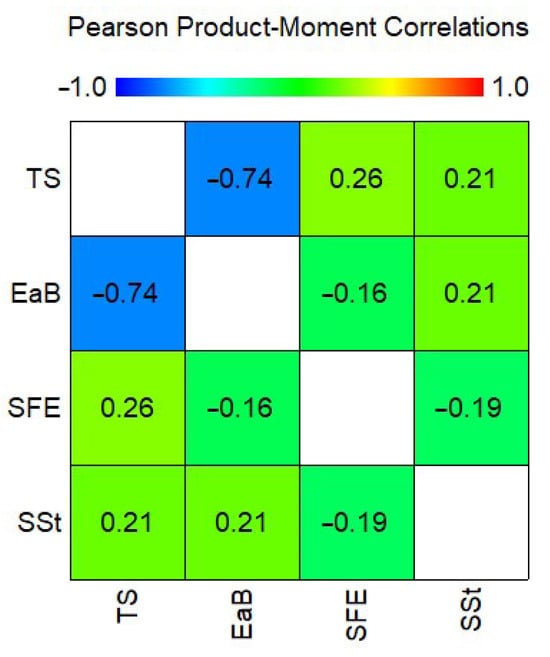
Figure 5.
Pearson product-moment correlation between mechanical properties (TS and EaB), surface free energy, and seal strength (SSt) for corona-treated films at various levels.
The results revealed no statistically significant correlations between SFE and the mechanical properties or seal strength. Pearson’s correlation coefficients between SFE and TS (r = 0.2638), SFE and EaB (r = −0.1610), and SFE and seal strength (r = −0.1860) indicate weak linear relationships. Similarly, Spearman’s rank correlations suggest weak monotonic associations, with values of ρ = 0.0699 (SFE–TS), ρ = −0.3088 (SFE–EaB), and ρ = 0.1086 (SFE–seal strength).
These findings suggest that neither surface free energy nor basic mechanical properties strongly predict seal strength in the tested materials. The lack of significant correlations may indicate that other factors—such as thermal behavior, surface morphology, or process parameters—play a more dominant role in determining seal performance.
4. Conclusions
This paper aimed at a comparative analysis of corona treatment on the mechanical and sealing properties of selected plastic films intended for packaging purposes. As expected, corona treatment increases hydrophilicity, surface free energy, and its polar component, though the influence is material-dependent. FTIR spectra revealed chemical modifications on the film surface after treatment, particularly the formation of polar functional groups, especially –C=O, contributing to improved adhesion.
In addition to enhancing hydrophilicity and surface free energy, corona treatment significantly affected the surface properties and sealability of polymer films. For most tested films, treatment at 100 W increased surface free energy and enhanced seal strength, while higher treatment intensity (300 W) tended to reduce both parameters. The changes in seal strength were proportional to the variations in SFE, indicating a direct relationship between surface activation and interfacial adhesion during sealing. However, the correlation analysis did not reveal any statistically significant relationships between surface free energy, mechanical properties, and seal strength, indicating weak or negligible relationships among these variables. This suggests that other factors beyond basic mechanical or surface energy characteristics likely govern seal strength.
Based on the findings, the following application-oriented recommendations can be made:
- Moderate corona treatment (100 W) is optimal for polar polymers such as BOPP2 and PE, enhancing both surface energy and seal strength without causing surface degradation.
- Excessive treatment (300 W) should be avoided as it may lead to surface damage and reduced sealing performance.
- For non-polar polypropylene films, activation appears to have a negative effect on seal strength, even at relatively low power levels.
These insights can guide industrial applications in packaging, printing, and lamination processes, helping to tailor corona treatment parameters to specific film types for optimal performance.
Author Contributions
Conceptualization, Z.Ż.-T.; methodology, Z.Ż.-T., M.T.; formal analysis, Z.Ż.-T.; investigation, K.C.; resources, K.C.; data curation, Z.Ż.-T.; writing—original draft preparation, Z.Ż.-T.; writing—review and editing, Z.Ż.-T., M.T.; supervision, Z.Ż.-T.; All authors have read and agreed to the published version of the manuscript.
Funding
This research received no external funding.
Data Availability Statement
The data that support the findings of this study are available on request from the corresponding author.
Conflicts of Interest
The authors declare no conflicts of interest.
References
- Ncube, L.K.; Ude, A.U.; Ogunmuyiwa, E.N.; Zulkifli, R.; Beas, I.N. Environmental Impact of Food Packaging Materials: A Review of Contemporary Development from Conventional Plastics to Polylactic Acid Based Materials. Materials 2020, 13, 4994. [Google Scholar] [CrossRef]
- Shoba, H.; Ramappa; Jain, S.K. Food Packaging Technology. In Frontiers in Food Biotechnology; Springer: Singapore, 2024; pp. 121–141. ISBN 978-981-97-3261-6. [Google Scholar] [CrossRef]
- Verma, S.K.; Prasad, A.; Sonika; Katiyar, V. State of Art Review on Sustainable Biodegradable Polymers with a Market Overview for Sustainability Packaging. Mater. Today Sustain. 2024, 26, 100776. [Google Scholar] [CrossRef]
- Ghasemlou, M.; Barrow, C.J.; Adhikari, B. The Future of Bioplastics in Food Packaging: An Industrial Perspective. Food Packag. Shelf Life 2024, 43, 101279. [Google Scholar] [CrossRef]
- Lewin, M.; Mey-Marom, A.; Frank, R. Surface Free Energies of Polymeric Materials, Additives and Minerals. Polym. Adv. Technol. 2005, 16, 429–441. [Google Scholar] [CrossRef]
- Aydemir, C.; Altay, B.N.; Akyol, M. Surface Analysis of Polymer Films for Wettability and Ink Adhesion. Color Res. Appl. 2021, 46, 489–499. [Google Scholar] [CrossRef]
- Altay, B.N.; Fleming, P.D.; Rahman, M.A.; Pekarovicova, A.; Myers, B.; Aydemir, C.; Karademir, A. Controlling Unequal Surface Energy Results Caused by Test Liquids: The Case of UV/O3 Treated PET. Sci. Rep. 2022, 12, 6772. [Google Scholar] [CrossRef] [PubMed]
- Dole, N.; Ahmadi, K.; Solanki, D.; Swaminathan, V.; Keswani, V.; Keswani, M. Corona Treatment of Polymer Surfaces to Enhance Adhesion. In Polymer Surface Modification to Enhance Adhesion: Techniques and Applications; Mittal, K.L., Netravali, A.N., Eds.; Wiley: Hoboken, NJ, USA, 2024; pp. 45–76. ISBN 9781394231034. [Google Scholar]
- Büyükpehlivan, G.A.; Oktav, M. Corona Treatment and Its Importance in Flexo Printing. In Proceedings of the Eleventh International Symposium GRID 2022, Novi Sad, Serbia, 14 April 2022; pp. 357–363. [Google Scholar] [CrossRef]
- Chen, X.; Rossi, D.; Guo, Y.; Wan, Q.G.; Chen, X.; Mohler, C.E.; Kuo, T.C.; Chen, Z. Effect of Corona Treatment on the Adhesion between a Two-Component Polyurethane Adhesive and Polypropylene. Macromolecules 2024, 57, 6646–6656. [Google Scholar] [CrossRef]
- Bunkan, A.J.C.; Hatscher, D. Direct Non-Thermal Corona Plasma Treatment in Air Pollution Control. Plasma Process. Polym. 2025, 22, 70015. [Google Scholar] [CrossRef]
- Stepczyńska, M.; Śpionek, A. Plasma Modification Effects of Thermoplastic Starch (TPS) Surface Layer: Film Wettability and Sterilization. Materials 2025, 18, 2156. [Google Scholar] [CrossRef]
- Das, B.; Chakrabarty, D.; Guha, C.; Bose, S. Effects of Corona Treatment on Surface Properties of Co-Extruded Transparent Polyethylene Film. Polym. Eng. Sci. 2021, 61, 1449–1462. [Google Scholar] [CrossRef]
- Li, J.; Shen, Z.; Tie, L.; Long, T.; Zhong, Q.; Chen, X.; Yin, C.; Liufu, L.; Huang, X.; Xiong, B.; et al. Surface Microstructure Study on Corona Discharge-Treated Polyethylene Using Positron Annihilation Spectroscopy. Molecules 2024, 29, 4147. [Google Scholar] [CrossRef]
- Selvin, M.; Shah, S.; Maria, H.J.; Thomas, S.; Tuladhar, R.; Jacob, M. Review on Recycling of Cross-Linked Polyethylene. Ind. Eng. Chem. Res. 2024, 63, 1200–1214. [Google Scholar] [CrossRef]
- Żołek-Tryznowska, Z.; Prica, M.; Pavlović, Ž.; Cveticanin, L.; Annusik, T. The Influence of Aging on Surface Free Energy of Corona Treated Packaging Films. Polym. Test. 2020, 89, 106629. [Google Scholar] [CrossRef]
- Lindner, M.; Rodler, N.; Jesdinszki, M.; Schmid, M.; Sängerlaub, S. Surface Energy of Corona Treated PP, PE and PET Films, Its Alteration as Function of Storage Time and the Effect of Various Corona Dosages on Their Bond Strength after Lamination. J. Appl. Polym. Sci. 2018, 135, 45842. [Google Scholar] [CrossRef]
- Park, S.J.; Jin, J.S. Effect of Corona Discharge Treatment on the Dyeability of Low-Density Polyethylene Film. J. Colloid Interface Sci. 2001, 236, 155–160. [Google Scholar] [CrossRef]
- O’Hare, L.A.; Leadley, S.; Parbhoo, B. Surface Physicochemistry of Corona-Discharge-Treated Polypropylene Film. Surf. Interface Anal. 2002, 33, 335–342. [Google Scholar] [CrossRef]
- Carley, J.F.; Kitze, P.T. Corona-discharge Treatment of Polyethylene Films. I. Experimental Work and Physical Effects. Polym. Eng. Sci. 1978, 18, 326–334. [Google Scholar] [CrossRef]
- Ding, L.; Zhang, X.; Wang, Y. Study on the Behavior of BOPP Film Treated by Corona Discharge. Coatings 2020, 10, 1195. [Google Scholar] [CrossRef]
- Matsunaga, M.; Whitney, P.J. Surface Changes Brought about by Corona Discharge Treatment of Polyethylene Film and the Effect on Subsequent Microbial Colonisation. Polym. Degrad. Stab. 2000, 70, 325–332. [Google Scholar] [CrossRef]
- Pascual, M.; Balart, R.; Sánchez, L.; Fenollar, O.; Calvo, O. Study of the Aging Process of Corona Discharge Plasma Effects on Low Density Polyethylene Film Surface. J. Mater. Sci. 2008, 43, 4901–4909. [Google Scholar] [CrossRef]
- Müller, H.; Cetin, A.; Dahlmann, R.; de los Arcos, T.; Grundmeier, G. Interface Chemistry and Adhesion of Thin Bilayer Si-Organic PECVD Barrier Films on Post-Consumer Recycled Polypropylene. Surf. Coatings Technol. 2025, 512, 132392. [Google Scholar] [CrossRef]
- Farley, J.M.; Meka, P. Heat Sealing of Semicrystalline Polymer Films. III. Effect of Corona Discharge Treatment of LLDPE. J. Appl. Polym. Sci. 1994, 51, 121–131. [Google Scholar] [CrossRef]
- Owens, D.K.; Wendt, R.C. Estimation of the Surface Free Energy of Polymers. J. Appl. Polym. Sci. 1969, 13, 1741–1747. [Google Scholar] [CrossRef]
- van Oss, C.J. Interfacial Forces in Aqueous Media, Second Edition, 2nd ed.; CRC Press: Boca Raton, FL, USA, 2006; ISBN 9781420015768. [Google Scholar]
- ISO 527-1:2019; Plastics—Determination of Tensile Properties—Part 1: General Principles. ISO: Geneva, Switzerland, 2019. Available online: https://www.iso.org/standard/527-1 (accessed on 14 July 2025).
- ISO 527-3:2018; Plastics—Determination of Tensile Properties—Part 3: Test Conditions for Films and Sheets. ISO: Geneva, Switzerland, 2018.
- ISO 11339:2022; Adhesives—T-Peel Test for Flexible-to-Flexible Bonded Assemblies. ISO: Geneva, Switzerland, 2022.
- Louzi, V.C.; de Carvalho Campos, J.S. Corona Treatment Applied to Synthetic Polymeric Monofilaments (PP, PET, and PA-6). Surf. Interfaces 2019, 14, 98–107. [Google Scholar] [CrossRef]
- Gopanna, A.; Mandapati, R.N.; Thomas, S.P.; Rajan, K.; Chavali, M. Fourier Transform Infrared Spectroscopy (FTIR), Raman Spectroscopy and Wide-Angle X-Ray Scattering (WAXS) of Polypropylene (PP)/Cyclic Olefin Copolymer (COC) Blends for Qualitative and Quantitative Analysis. Polym. Bull. 2019, 76, 4259–4274. [Google Scholar] [CrossRef]
- Segura-Méndez, K.L.; Puente-Córdova, J.G.; Rentería-Baltiérrez, F.Y.; Luna-Martínez, J.F.; Mohamed-Noriega, N. Modeling of Stress Relaxation Behavior in HDPE and PP Using Fractional Derivatives. Polymers 2025, 17, 453. [Google Scholar] [CrossRef]
- Das, B.; Chakrabarty, D.; Mukherjee, A.; Guha, C.; Bose, S. Pattern of Surface Energy (Tension) Change after Coating/Printing on a Pretreated (Low Density /Linear Low Density Poly Ethylene) Co-Extruded Plastic Film Surface and Its Consequences on Lamination and Overprinting. Polym. Eng. Sci. 2025, 65, 560–575. [Google Scholar] [CrossRef]
- Vishnuvarthanan, M.; Rajeswari, N. Effect of Mechanical, Barrier and Adhesion Properties on Oxygen Plasma Surface Modified PP. Innov. Food Sci. Emerg. Technol. 2015, 30, 119–126. [Google Scholar] [CrossRef]
- Popelka, A.; Novák, I.; Al-Maadeed, M.A.S.A.; Ouederni, M.; Krupa, I. Effect of Corona Treatment on Adhesion Enhancement of LLDPE. Surf. Coatings Technol. 2018, 335, 118–125. [Google Scholar] [CrossRef]
- Szramowski, H.; Krzemiński, M.P. Comparative Analysis of Primers and Alternative Polypropylene Pre-Treatment Techniques. J. Adhes. 2024, 100, 867–889. [Google Scholar] [CrossRef]


Disclaimer/Publisher’s Note: The statements, opinions and data contained in all publications are solely those of the individual author(s) and contributor(s) and not of MDPI and/or the editor(s). MDPI and/or the editor(s) disclaim responsibility for any injury to people or property resulting from any ideas, methods, instructions or products referred to in the content. |
© 2025 by the authors. Licensee MDPI, Basel, Switzerland. This article is an open access article distributed under the terms and conditions of the Creative Commons Attribution (CC BY) license (https://creativecommons.org/licenses/by/4.0/).