Article

Numerical Investigation of Combustion and Nitric Oxide Formation in a 130 t/h Pulverized-Coal Boiler Under Lignite–Bituminous Coal Blending

Department of Quality Management and Inspection Testing, Yibin University, Yibin 644000, China
*
Author to whom correspondence should be addressed.
Processes 2025, 13(10), 3187; https://doi.org/10.3390/pr13103187
Submission received: 5 September 2025 / Revised: 30 September 2025 / Accepted: 4 October 2025 / Published: 7 October 2025
(This article belongs to the Section Chemical Processes and Systems)

Abstract

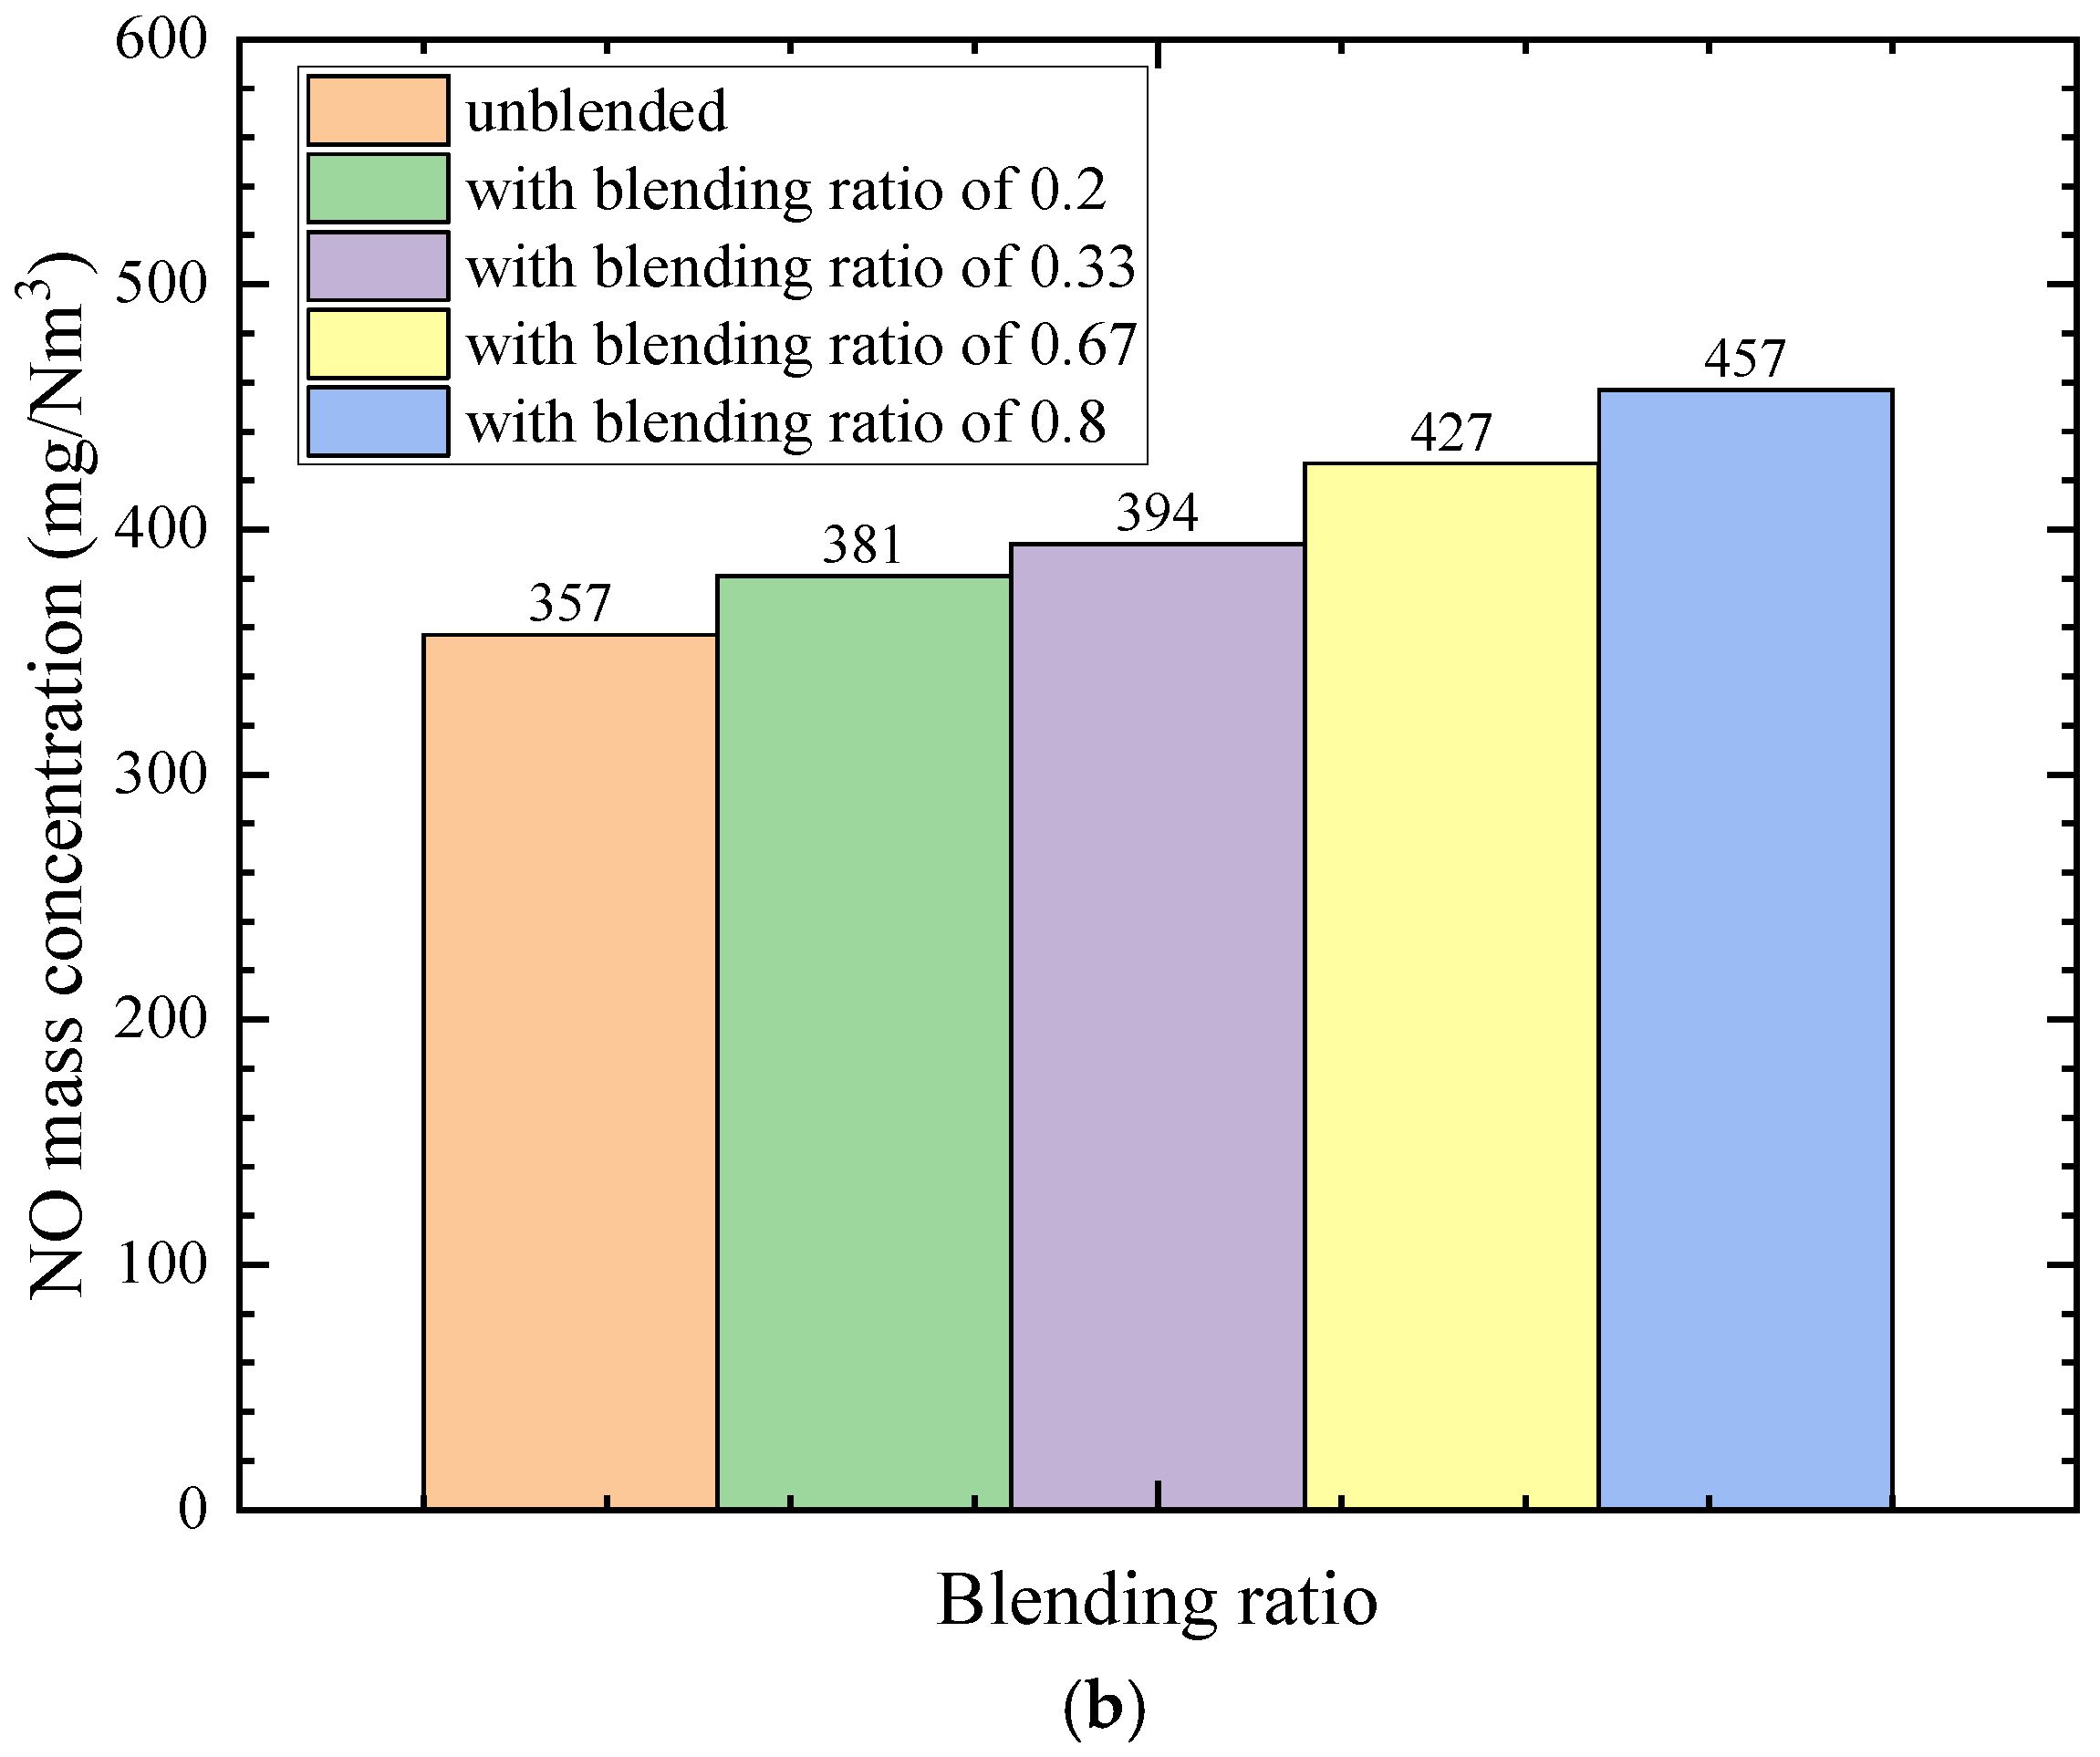
Coal blending has become a common practice in large-scale boilers due to fluctuations in fuel supply, and it has an important impact on combustion and nitric oxide (NO) formation. To clarify these effects, this study numerically investigates the combustion characteristics and NO generation in a 130 t/h tangentially fired pulverized-coal boiler under boiler maximum continuous rating (BMCR) conditions. A three-dimensional furnace model was developed based on the actual boiler geometry, and combustion was simulated using coal combustion sub-models coupled with the discrete phase model (DPM). The results indicate that increasing the proportion of bituminous coal raises the peak furnace temperature from 1856 K under unblended firing to 1959 K at 80% blending and increases the outlet NO concentration from 357 mg/m3 to 457 mg/m3. Furthermore, coal blending shifts flame intensity toward the furnace wall, enhances carbon monoxide (CO) formation in oxygen-deficient near-wall regions, and promotes NO generation in wall-adjacent high-temperature zones. These findings demonstrate that coal blending significantly influences combustion performance and pollutant emissions, highlighting the need for optimized air distribution and blending strategies in tangentially fired boilers.

1. Introduction

Pulverized-coal utility boilers remain a major contributor to global electricity supply. In recent years, owing to the constraints in coal supply, the originally designed coal type could not be reliably ensured, and coal blending has become the prevailing practice in utility boilers [1,2,3]. It is generally known that the boiler furnace is designed based on a specific coal type in order to ensure optimal flame propagation and burnout performance. The introduction of different coals into the furnace inevitably modifies the combustion characteristics, thereby affecting flame stability and burnout efficiency. Consequently, there are changes in the internal temperature field and species concentrations, which may further influence pollutant formation and overall boiler performance [4,5].
In prior works, investigations on the effect of blended coal on the combustion within the boiler furnace were carried out. Hariana et al. [6] studied the effect of coal blending with five different types of coal on the ash emission of the pulverized-coal-fired boilers of 600 MW power plants. The morphology and chemical composition of the ash particles were examined using scanning electron microscopy equipped with energy-dispersive X-ray spectroscopy (SEM-EDX), while the crystalline phases were identified by X-ray diffraction (XRD). Wang et al. [7] investigated the properties and combustion characteristics for the blended coals produced in northwestern China. Results from thermogravimetric experiments demonstrate that the dominant combustion stage of blended coals deviates notably from that of the individual parent coals. The thermogravimetric curves of the blends are positioned between those of the single coals but exhibit distinct non-linear, non-additive features. In addition, increasing the oxygen concentration substantially improves the combustion characteristics of the blends, while the performance of low-reactivity coal remains comparatively insensitive to changes in oxygen availability. A review on coal blending and emission issues was conducted by Zaid et al. [8]. They declared that coal blending practice and emission control techniques will be essential in ensuring sustainable coal plant operation for years to come. Haas et al. [9] illustrated the influence of coal blending on pulverized-coal combustion characteristics by testing six individual coals and fifteen blended samples in an isothermal plug flow reactor. The results suggested that the inorganic fraction of coal plays a critical role in the non-additive behavior of blends, owing to potential interactions between volatile mineral species and the second blending partner.
Because boiler combustion is highly complex, it is difficult to comprehensively characterize the internal combustion process and emission characteristics solely through experimental approaches. To address these limitations, computational fluid dynamics (CFD) has become an indispensable tool in boiler combustion research [10,11,12,13,14]. Numerical simulation based on the gas–solid combustion model was carried out by Bian et al. [12] in order to systematically examine the effects of high-ratio co-firing of low-ash-fusibility bituminous coal on the combustion and slagging behavior of a down-fired boiler. It revealed that, as the blending ratio of bituminous coal increases from 0% to 100%, the temperature level in the primary combustion zone exhibits a downward trend, accompanied by a reduction in the relative area of local high-temperature regions. Concurrently, the carbon monoxide (CO) concentration gradually increases, whereas the nitrogen oxide (NOₓ) concentration decreases, while the burnout rate at the furnace outlet shows little variation. Szufa et al. [10] presented the CFD simulation results for the co-firing of torrefied maize straw with sub-bituminous coal at different mass ratios in an industrial-scale boiler, aiming to identify potential challenges associated with substituting coal with upgraded biomass. The distributions of temperature, carbon dioxide, and carbon monoxide concentration varying with mass ratios were discussed. Wang et al. [14] conducted numerical simulations to study the effect of combustion for hydrochar/coal blends in a blast furnace. In simulations, it was demonstrated that hydrochar with a higher volatile content undergoes faster devolatilization, resulting in elevated carbon dioxide (CO2) levels at the nozzle tip and improved burnout in the raceway. When blended with coal, hydrochar enhances the overall flow dynamics and combustion performance of the mixture.
The chemical pathways for nitric oxide (NO) formation in flames are well established: thermal NO via the Zel’dovich route dominates at high temperatures; fuel NO arises from conversion of fuel-bound nitrogen through volatile-N and char-N oxidation/reduction networks; prompt NO can contribute in rich reaction zones [15,16,17]. In solid-fuel systems, conversion selectivity from fuel-N to NO or nitrogen (N2) is additionally governed by devolatilization timing, heterogeneous char reactions, mixing, and local stoichiometry [18]. These fundamentals provide a mechanistic framework for interpreting furnace-scale NO distributions, which exhibit strong dependence on temperature and gas species formed during coal combustion within the boiler. Building on these mechanisms, numerous studies have systematically analyzed and elucidated the formation pathways of nitric oxide under various coal blending conditions in practical combustion systems, as well as the governing influences of operating parameters on its generation [19,20].
These studies collectively demonstrate that coal blending can profoundly alter furnace temperature fields, species concentration profiles, and NO formation, while the underlying mechanisms vary across different boiler designs and operating conditions. Hence, it is essential to perform system-specific analyses for particular combustion configurations and blending strategies in order to accurately capture the combustion characteristics and pollutant formation pathways.
In the present paper, numerical simulations were conducted to investigate the trends in combustion and nitric oxide formation in a 130 t/h pulverized-coal boiler, which was originally designed for lignite firing. Due to market constraints, the supply of the originally required coal has become unstable, and thus bituminous coal must be procured externally for blending combustion. In order to evaluate the combustion performance and emission characteristics under coal blending conditions, detailed analyses of the in-furnace temperature distribution and species concentration profiles were conducted at different blending ratios.

2. Physical and Mathematical Model

2.1. Physical Model

The three-dimensional model used in the present simulation is based on a 130 t/h natural-circulation, medium-temperature, medium-pressure pulverized-coal boiler designed for lignite combustion. A full-scale model is constructed based on the original design drawings provided by the manufacturer, and the three-dimensional geometry is developed using ANSYS SpaceClaim 2021 (ANSYS Inc., Canonsburg, PA, USA). As is shown in Figure 1a, the furnace measures 7100 mm in width and 7100 mm in depth, and the total height from the bottom of the ash hopper to the boiler top is 23,670 mm. According to the information provided in the Boiler Instruction Manual by the manufacturer, the relevant design details are as follows:
The furnace adopts a tangentially fired configuration with burners arranged at the four corners, forming a rotary combustion flow to enhance flame stability and promote efficient burnout. The boiler system is equipped with primary and secondary air inlets to ensure staged combustion, in which the primary air constitutes approximately 30% of the total airflow at an injection velocity of ~20 m/s, whereas the secondary air accounts for about 70% with an injection velocity of ~50 m/s, at an excess air ratio of 1.2. The pulverized coal is transported by the primary air stream into the furnace. The designed fuel is lignite sourced from the Ordos region, which is characterized by a relatively high moisture content, low calorific value, and high volatile matter compared with bituminous coals. As is introduced above, considering that the supply of the originally designed coal unstable, bituminous coals are needed to blend with the origin coal during boiler combustion. Table 1 presents the proximate and ultimate analysis results of the two coal samples.

2.2. Mathematical Model

(1)
Basic Equations:
Pulverized-coal boiler combustion involves gas-phase flow, volatile matter combustion, chemical reactions, and heat transfer. These fundamental processes can be described by the classical conservation equations of mass, momentum, species transport, and energy [22,23], which have been widely used in CFD modeling of combustion systems. Assuming steady combustion conditions, the equations can be expressed as follows:
Mass conservation equation:
( ρ V ) = 0
where V is the velocity vector and ρ is the density;
Momentum conservation equation:
ρ V V = p + τ ρ g e y
here, p is the pressure; g is the gravitational acceleration; ey is the unit vector in the direction of gravity; τ is the viscous stress tensor, defined as:
τ ij = μ eff ( u i x j + u j x i ) 2 3 μ eff ( d i v V ) δ ij
where μ eff is the effective turbulent viscosity, defined as:
μ eff = μ + μ t
with μ being the dynamic viscosity of flue gas and μ t the turbulent viscosity.
Species transport equation:
ρ V Y i = j i + R i + S i
here, Y i is the mass fraction of species i , j i is the diffusion flux, R i is the reaction source term, and S i is a generalized source term. Under turbulent conditions, the diffusion flux j i is calculated by:
J i = ρ D i , m + μ t S c t Y i D T , i T T
where D i , m is the diffusion coefficient of species, S c t is the turbulent Schmidt number, D T , i is the thermal diffusion coefficient, T is the thermodynamic temperature.
Energy conservation equation:
V ρ E + p = k e f f T h i J i + τ e f f V + S h
where k e f f is the effective thermal conductivity, h i is the enthalpy of species i , τ e f f is the effective viscous stress tensor, and S h includes heat sources such as chemical reaction heat Sr and radiation heat Sp. The thermodynamic energy E is defined as:
E = h P ρ + v 2 2
For ideal gas assumptions, the system enthalpy h is expressed as:
h = i Y i h i
with:
h i = T r e f T c p , i d T
where c p , i is the specific heat at constant pressure of species i and T r e f = 298.15   K .
(2)
Turbulence Model:
In practical engineering, semi-empirical turbulence models are essential for simulating turbulent flows. Based on similar studies, the widely used standard k ε model [24,25] is employed. Assuming the combustion gases and their products are incompressible, the governing equations are:
( ρ k ) t + ( ρ V k ) = [ ( μ + μ t σ k ) k ] + G k + G b ρ ε + S k
( ρ ε ) t + ( ρ V ε ) = [ ( μ + μ t σ s ) ε ] + ε k [ c 1 ε f 1 G k + c 1 ε G b c 2 ε f 2 ρ ε ] + S ε
where Gk is the turbulence kinetic energy generated by velocity gradients:
G k = ρ u i u j ¯ u j u i = μ t S 2
S = 2 S ij S ij
Gb represents the turbulence kinetic energy due to buoyancy:
G b = g μ t ρ S c t ρ
Sk and Sε are custom source terms. Turbulent viscosity μ t is related to k and ε by:
μ t = ρ c μ k 2 ε
The constants in Equations (11)–(16) are commonly adopted from the literature as:
c μ = 0.09 ;   σ k = 1 ;   σ ε = 1 ;   c 1 ε = 1 ;   c 2 ε = 1
In the standard k ε model, damping functions f1 and f2 are set to 1.
(3)
Combustion Reaction Model
The combustion process in a boiler is a typical non-premixed combustion. The finite-rate and eddy-dissipation models are employed to describe the combustion process of pulverized coal, including volatile release and char oxidation in the presence of air. The model assumes chemical reactions occur within small-scale turbulent structures, whose volume fraction is given by [26,27]:
ξ = C ξ ν ε k 2 1 4
where C ξ = 2.1377 and ν is the kinematic viscosity. The reaction time is defined as:
τ = C τ ν ε 1 2
where C τ = 0.4082 . The source term in Equation (5) can then be expressed as:
R i = ρ ξ 2 τ 1 ξ 3 Y i Y i
where Y i is the species mass fraction at the end of the reaction.
The heat release from combustion is incorporated into the generalized source term S h in Equation (7) as:
S r = 1 n h i Y i
(4)
Radiation Model
Radiation within the furnace involves wall radiation and flame radiation, described by the radiative transfer equation (RTE) [28]:
d I r , s d s + a + σ s I r , s = a n 2 σ T 4 π + σ s 4 π 0 4 π I r , s φ s , s d Ω
where I is the radiative intensity, r is the position vector, s is direction vectors, s is the scattering direction vector, a is the absorption coefficient, σs is the scattering coefficient, φ is the phase function, Ω is the solid angle, and σ is the Stefan–Boltzmann constant.
The P-1 radiation model is used. The radiative heat flux q r is expressed as [29]:
q r = 1 3 a + σ s C σ s G
where G is the incident radiation:
Γ = 1 3 a + σ s C σ s
Combining Equations (23) and (24), the governing equation becomes:
q r = Γ G
Γ G a G + 4 a σ T 4 = S G
So the radiation source term becomes:
q r = a G 4 a σ T 4
and it is incorporated into the energy equation (Equation (7)) as part of the generalized source term:
S p = q r
(5)
NOx Formation Model
After obtaining the temperature, concentration, and velocity fields from the furnace simulation, NOx formation is calculated. Since NO is the dominant component of NOx in flue gas, the concentration of NO is used to evaluate NOx levels. The species transport equation for NO is [29]:
ρ V Y N O = ρ D Y N O + S N O
where Y N O and S N O are the mass fraction and source term of NO.
In boilers, thermal NOx is the primary formation mechanism. The main reactions are:
O + N 2 N + N O
N + O 2 O + N O
Under fuel-lean (oxygen-deficient) conditions, the following reaction has a significant impact on the formation of thermal NOx:
N 2 + O H H + N O
The formation rate of NO is given by [30,31]:
d [ N O ] d t = k f , 1 [ O ] [ N 2 ] + k f , 2 [ N ] [ O 2 ] + k f , 3 [ N ] [ O H ] k r , 1 [ N O ] [ N ] k r , 2 [ N O ] [ O ] k r , 3 [ N O ] [ H ]
In this equation, [O], [N2], and [OH] represent the molar concentrations of O, N2, and OH, respectively; k f , 1 , k f , 2 , k f , 3 are the forward reaction rate constants; k r , 1 , k r , 2 , k r , 3 are the reverse reaction rate constants. According to the research of Hanson and Salimian, the rate constants are presented in Table 2.
Thermal NOx formation becomes significant only when the temperature exceeds 1500 °C. According to the Zel’dovich mechanism, the formation rate of NO can be expressed as:
d [ N O ] d t = 2 k f , 1 [ O ] [ N 2 ] 1 k r , 1 k r , 2 [ N O ] 2 k f , 1 [ N 2 ] k f , 2 [ O 2 ] 1 + k r , 1 [ N O ] k f , 2 [ O 2 ] + k f , 3 [ O H ]
When using the partial equilibrium method to solve for the concentrations of O and OH, the following relationships apply:
[ O ] = 36.64 T 0.5 [ O 2 ] 0.5 e 27123 / T
[ O H ] = 2.129 × 10 2 T 0.57 e 4595 / T [ O ] 0.5 [ H 2 O ] 0.5
Based on Equations (30)–(32) through (36), the formation rate of NO can be calculated and introduced as a generalized source term into Equation (29), thereby closing the NO transport equation:
S N O = M w , N O d [ N O ] d t
Here, M w , N O is the molecular weight of NO.

3. Numerical Method and Validation

3.1. Numerical Method

The governing equations for mass, momentum, energy, turbulence, and species transport are discretized using the finite volume method. A second-order upwind scheme is employed for the convective terms, while the Semi-Implicit Method for Pressure-Linked Equations (SIMPLE) algorithm is applied for pressure–velocity coupling. The Pressure-Implicit with Splitting of Operators (PISO) scheme is adopted for the pressure correction equation to enhance accuracy in the prediction of swirling flows. The set of discretized equations is solved using the commercial CFD software ANSYS Fluent 2021 R1 (ANSYS Inc., Canonsburg, PA, USA). Convergence of the numerical solutions is considered achieved when the residuals of all the discretized equations drop below 10−4.
Boundary conditions:
Since this unit is a cogeneration boiler that supplies both electricity and process steam and typically operates under full-load conditions, all simulation parameters are defined on the basis of the boiler maximum continuous rating (BMCR) condition.
(1)
Inlet boundary conditions
The inlets of primary and secondary air are defined as velocity inlets. The velocities at the primary and secondary air inlets are 20 m/s and 50 m/s, respectively. The temperature of the primary air is specified as 388 K, while that of the secondary and tertiary air is set to 628 K. The hydraulic diameter D and turbulence intensity I at the inlet are calculated:
D = 4 A l
l = 0.16 ( R e ) 1 / 8
The pulverized-coal particle size follows the Rosin–Rammler distribution, with a minimum diameter of 0.01 mm, a maximum diameter of 0.15 mm, and a mean diameter of 0.04 mm. Under the BMCR condition, the boiler operates with a coal consumption of 33,080 kg/h, which is injected into the furnace and treated as particles in the discrete phase model.
(2)
Outlet boundary conditions
The furnace outlet is specified as a pressure outlet with a static pressure of −50 Pa. The turbulence intensity is set to 5%, and the hydraulic diameter is determined by Equation (36).
(3)
Wall boundary conditions
All furnace walls are modeled as stationary with no-slip conditions and specified as temperature boundaries. The emissivity is set to 1.0 for the bottom surface of the slag hopper and 0.6 for the other walls. The particle boundary condition for the slag hopper wall is set to the trap condition, in which particles are captured and removed from the flow once they impinge on the wall, whereas for the other walls it is set to the reflect condition, which allows particles to rebound into the flow domain after colliding with the wall. The wall temperatures are specified as 628 K for the ash hopper walls and the main combustion zone and 828 K for the walls above the combustion zone.
All the three-dimensional physical models are discretized by a structured hexahedral grid, where local mesh refinement is applied in the burner zone to better capture the strong velocity and temperature gradients. A mesh independence study is carried out with three different grid densities. Results indicated that, beyond approximately 1.21 million cells, the variation in predicted temperature, oxygen molecules (O2), and NO concentration became negligible (<2%), confirming grid independence. Based on this, the final simulations were performed with around 1.21 million control cells. The detailed results at different numbers of mesh cells are summarized in Table 3, while the corresponding monitoring locations (i.e., Mon-A and Mon-B) are shown in Figure 1c. Mon-A and Mon-B are located at the cross-section of the lower primary air inlets, where flow and combustion are particularly intense and more sensitive to variations in the mesh number.

3.2. Validation of Numerical Method

To ensure the reliability of the numerical simulations, the calculated results were validated against available test results. The validation primarily focuses on two key indicators: temperature and nitric oxide concentration. The comparison between the simulation results and the experimental results is presented in Table 4, and the relevant monitoring locations (i.e., Mon-1, Mon-2, Mon-3, and Mon-4) are shown in Figure 1c. The temperature was measured using an infrared pyrometer (Raynger 3i) inserted through four soot-blowing ports. Measurements were taken at 10 min intervals, repeated four times, and the average value was adopted. The NO concentration was obtained from the monitoring point installed at the economizer outlet and recorded by the distributed control system (DCS), with the simulated results being the average value at the furnace outlet cross-section. In order to ensure comparability with emission standards, the concentration values presented in Table 4 are further normalized to standard conditions (273.15 K, 101.325 kPa) with a reference oxygen content of 6%. Given the complexity of boiler operation, the tests and data acquisition were conducted under conditions where the oxygen concentration was controlled to match that obtained in the simulations (0.032 in volume fraction), corresponding to the BMCR condition, thereby ensuring comparability between experimental and numerical results. As illustrated in Table 4, the predicted temperature and NO concentration are in overall agreement with the measured values. The maximum deviation does not exceed 5%, which is within the acceptable range for CFD simulations of large-scale boilers.

4. Results

4.1. The Original Operating Condition Before Coal Blending

(1)
Fluid flow and particle motion
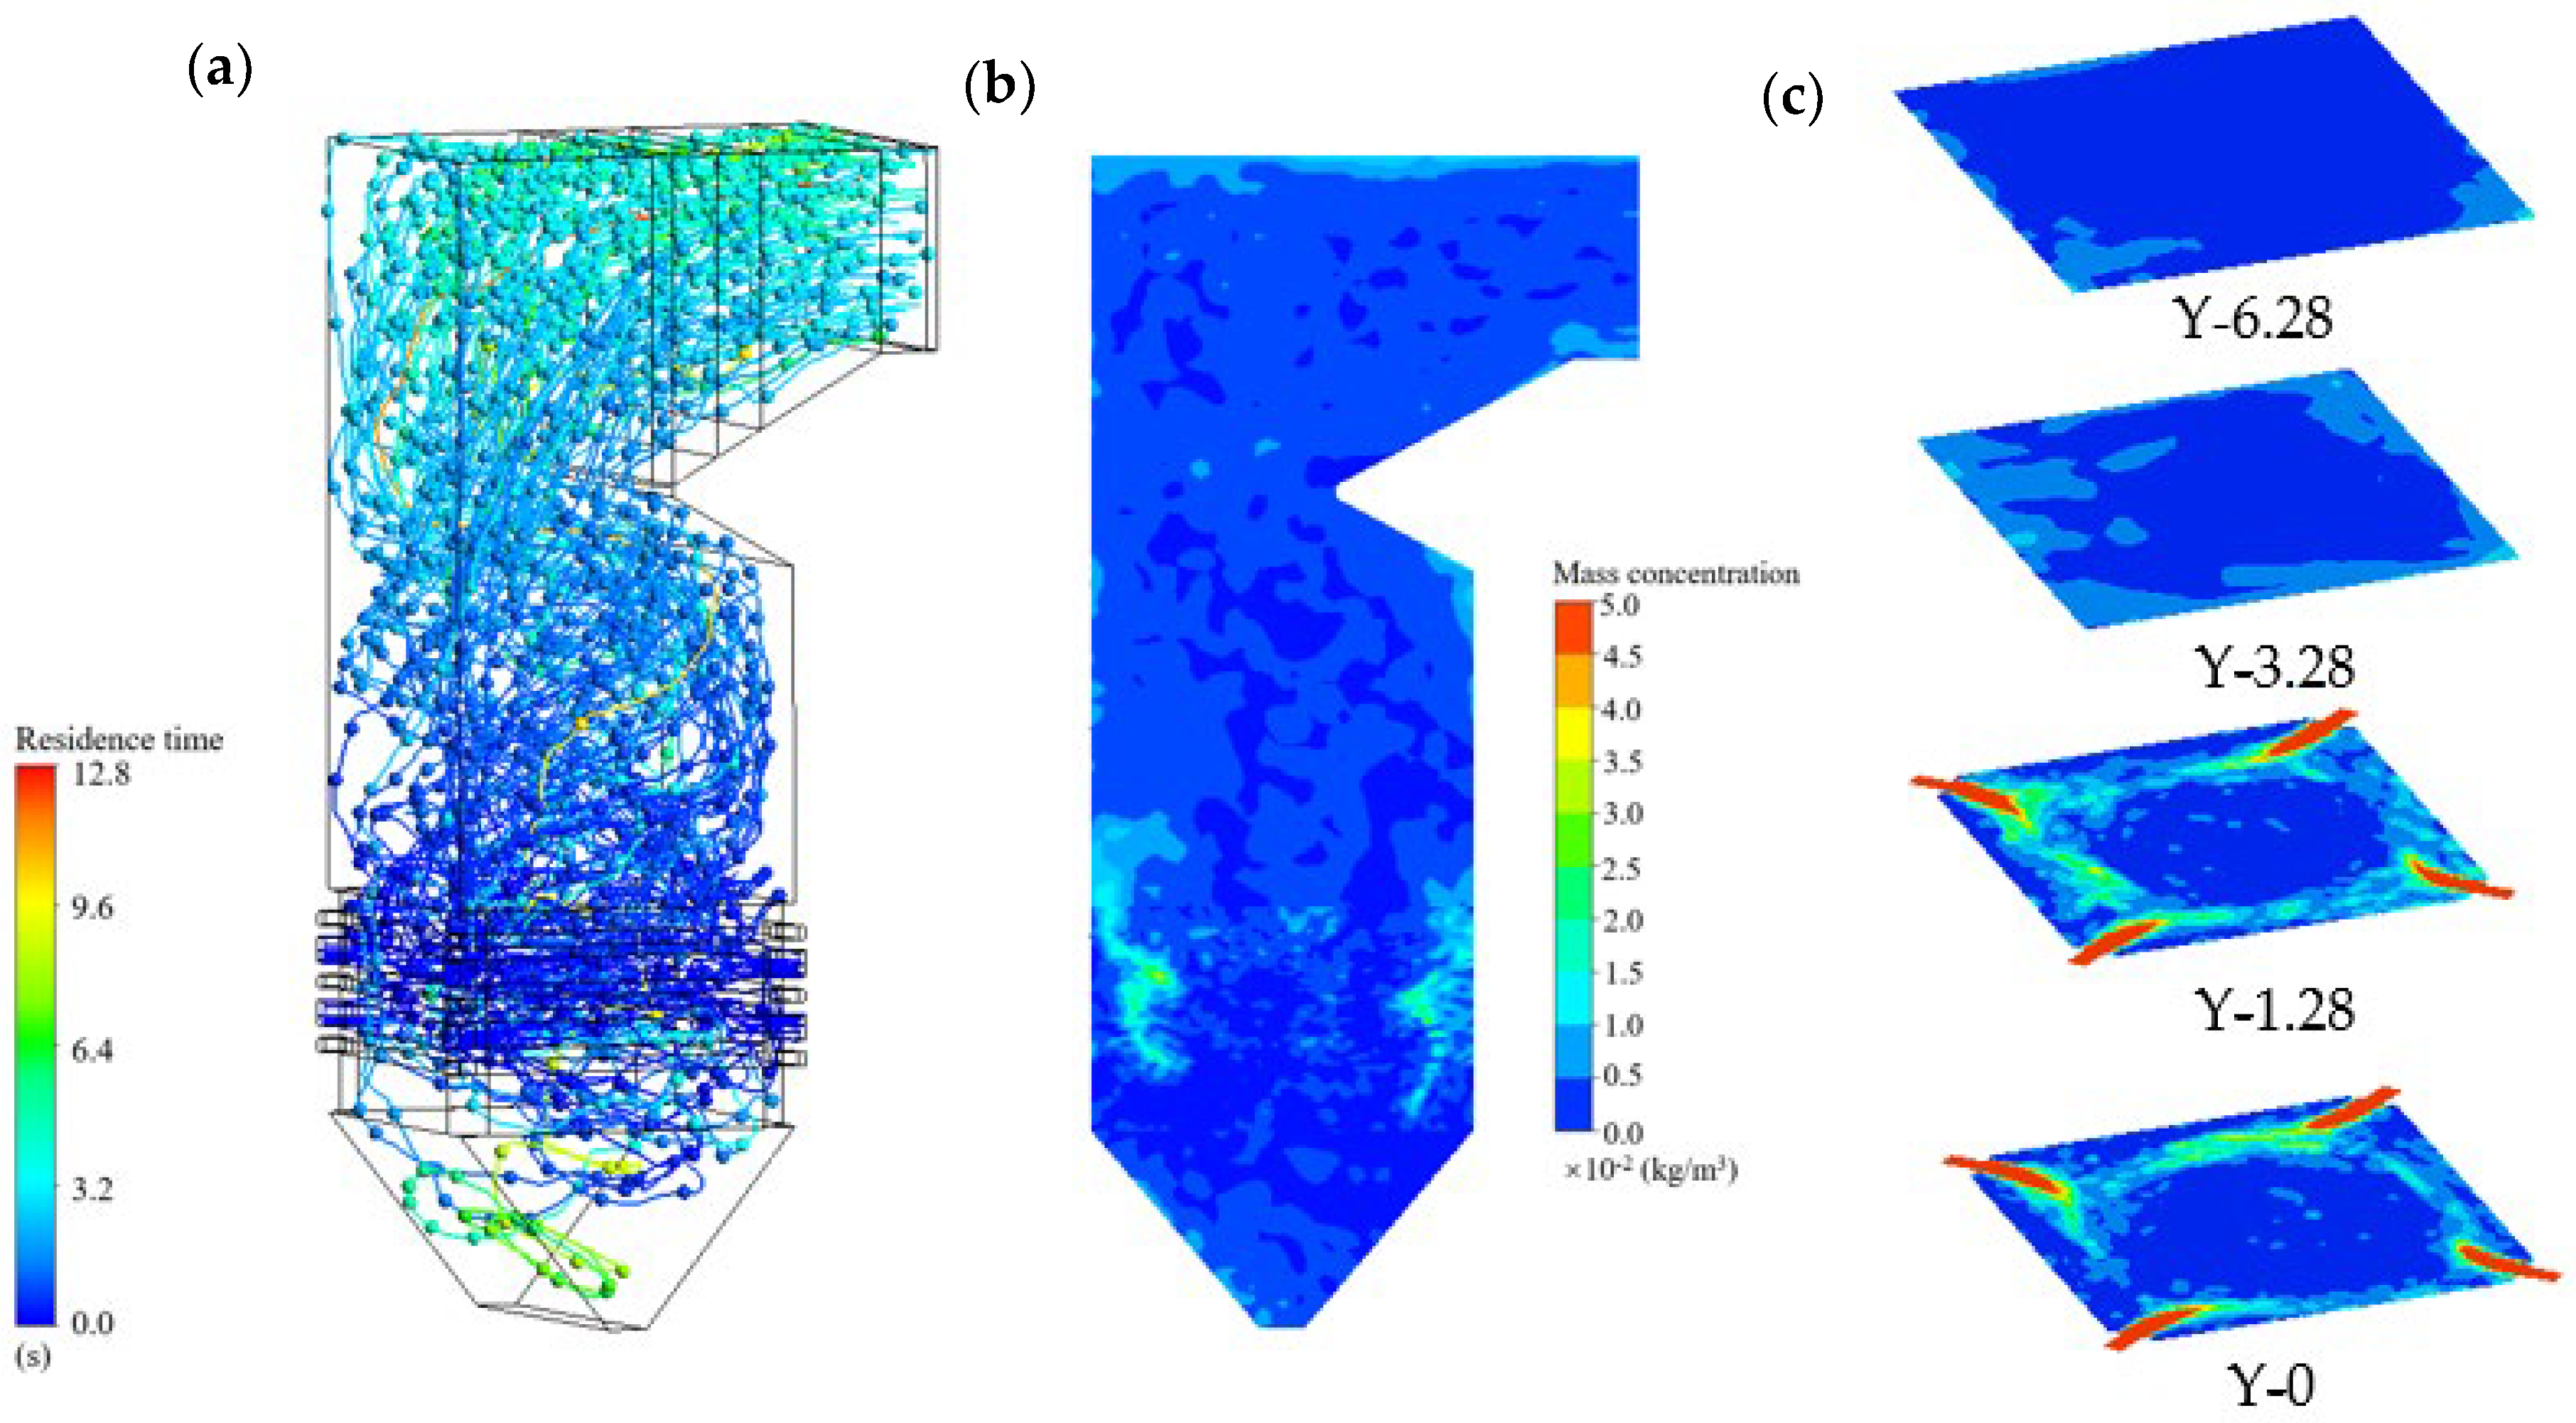
In the process of the boiler working, the first step is coal particle injection into the boiler furnace by the primary air, in which the coal particle diameter generally ranges from a few micrometers to several hundreds of micrometers. As the coal particle is introduced, it is fired and rises spirally driven by airflow. The burnout particles with few combustible components finally escape from the furnace outlet. To intuitively show the above process, the particle trajectories colored by particle residence time are presented in Figure 2a, where it is observed that the maximal residence time from the particle entering the furnace and escaping from the outlet is over ten seconds. Figure 2b,c present the particle mass concentration on the given cross-sections. As the coal particles are injected following the path of an imaginary tangent circle, it is thus observed that the particle distribution is mainly arranged along a specific circle, at the cross-section of the primary air inlet. The fired particles are continuously combusted with spiral movement toward the outlet, resulting in the particle mass being exhausted and the particle concentration dropping with the elevation.
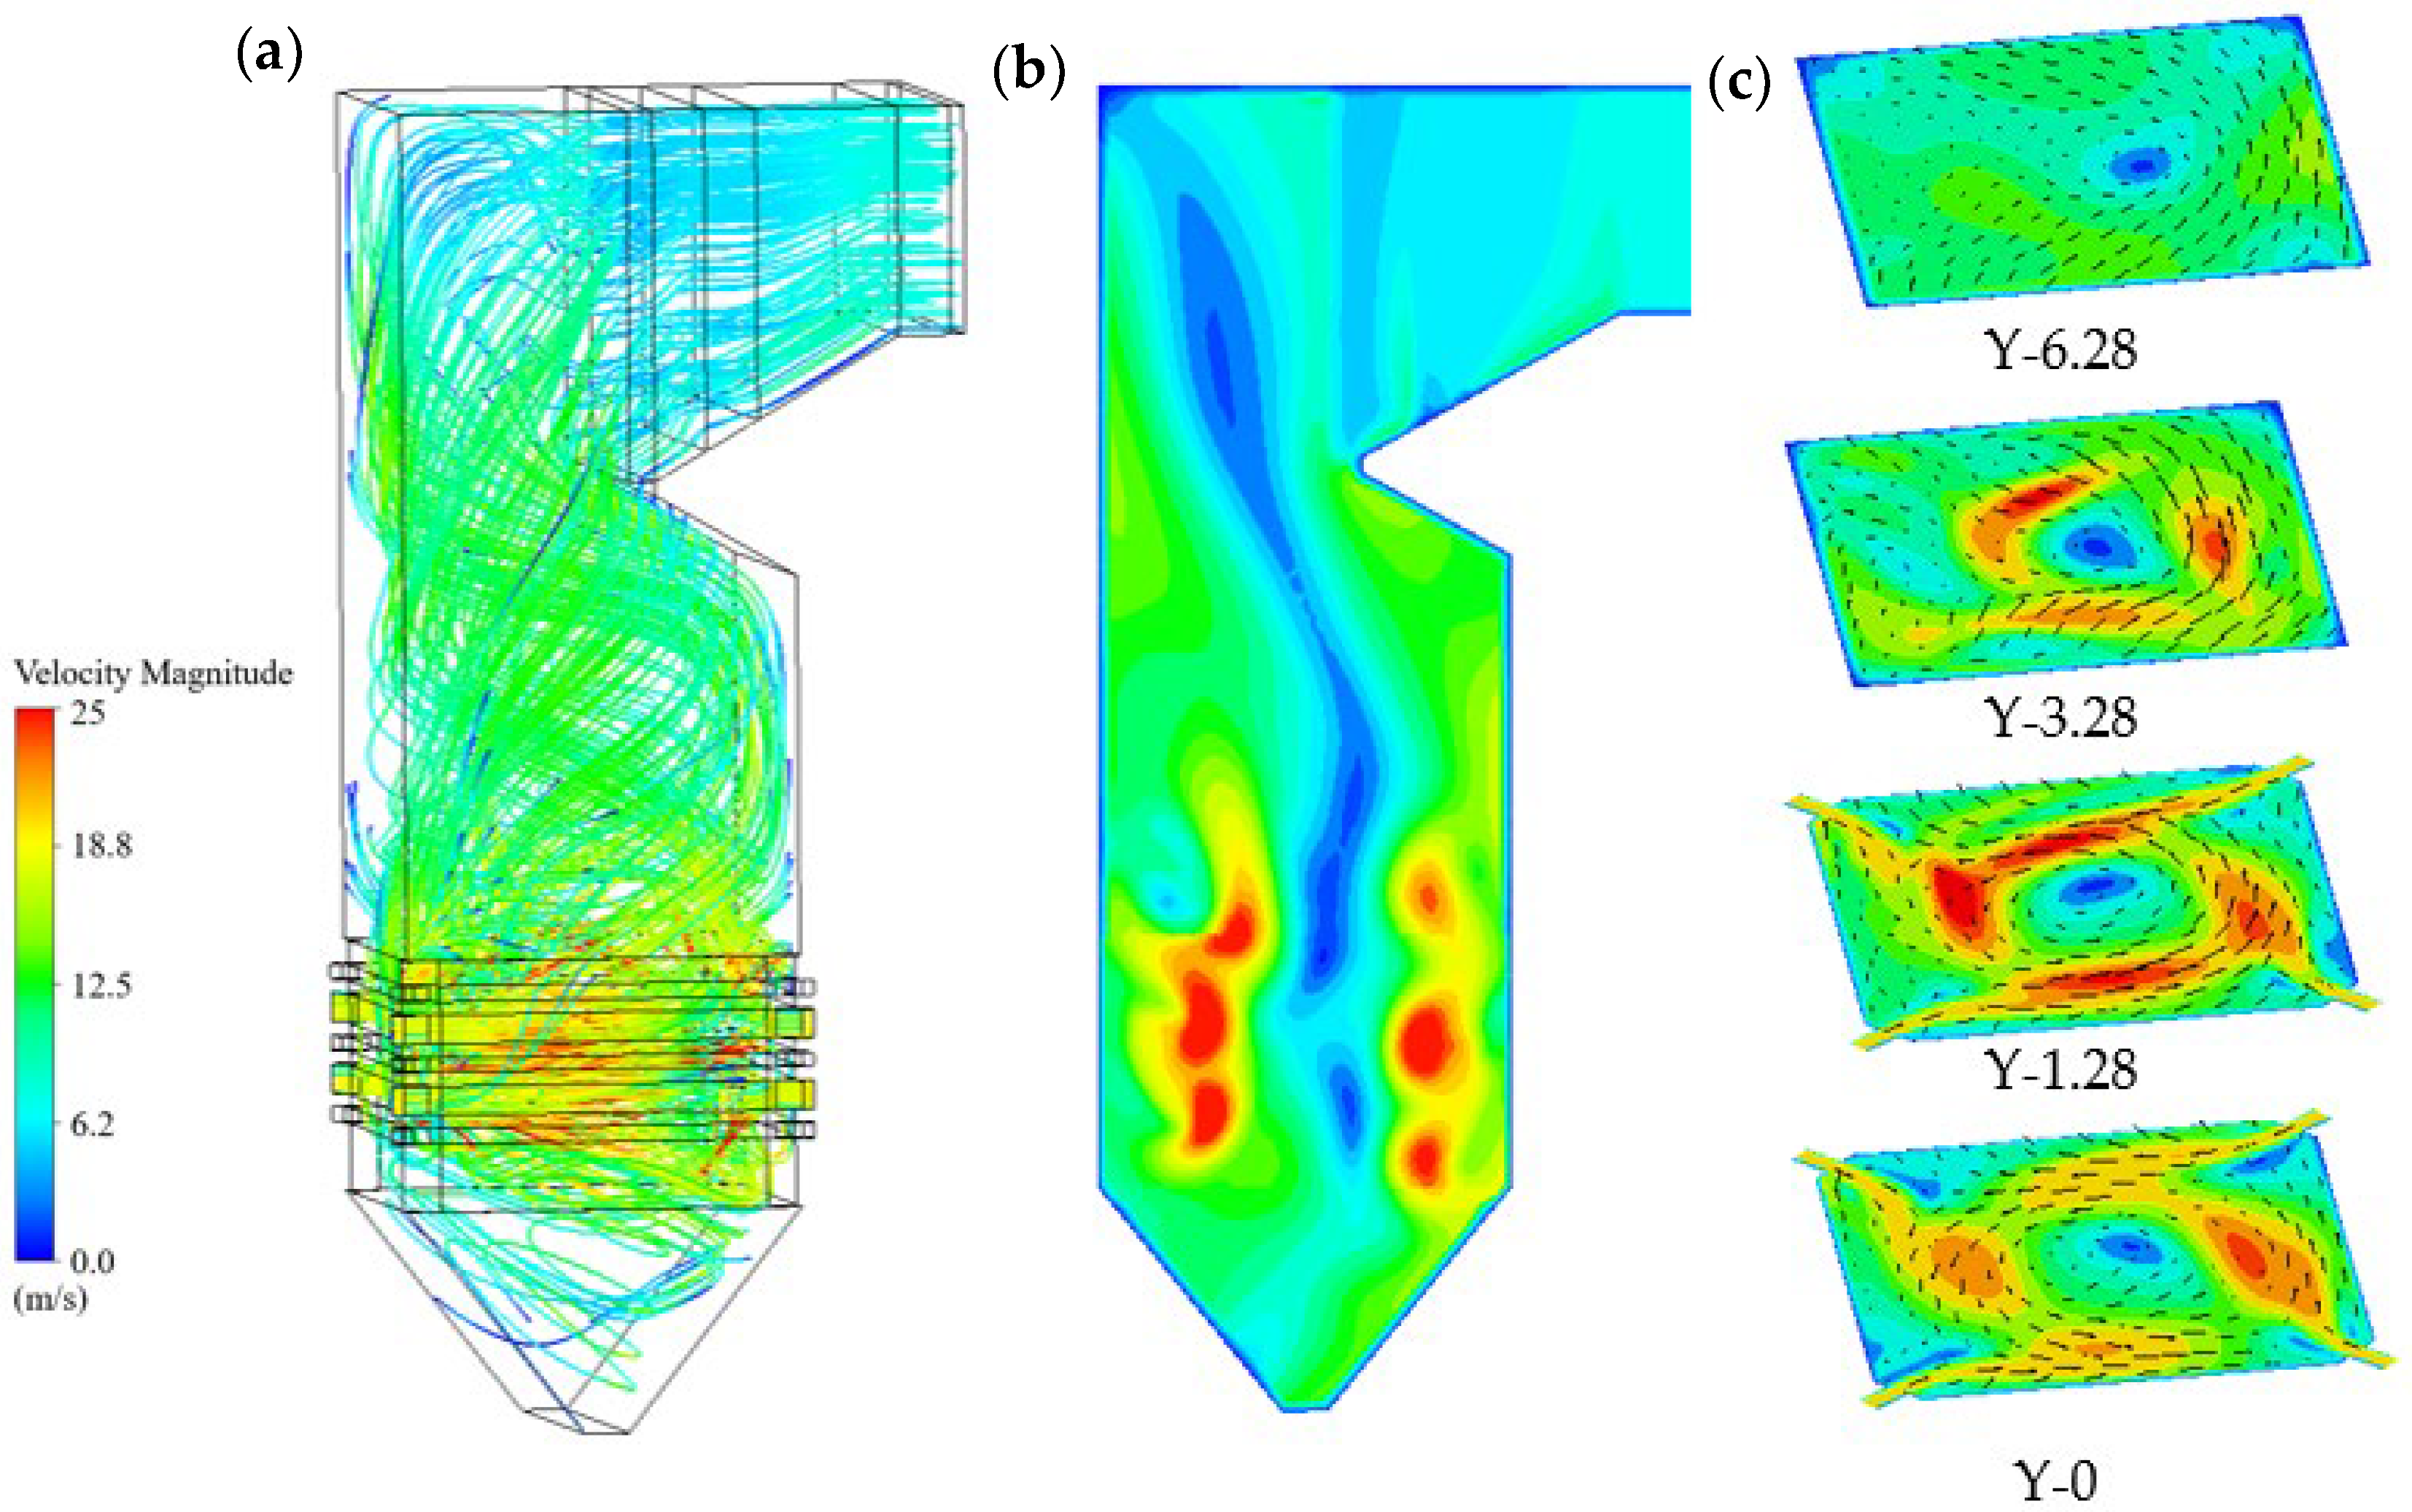
Air is supplied to the furnace through several air inlets during the whole combustion process of the boiler. For a pulverized-coal boiler, at least two types of air inlets are equipped, including primary and secondary air inlets, in which the primary air inlet supplies air to ignite coal particles and the secondary air inlet supplies air to improve internal airflow, ensuring efficient combustion. The boiler investigated in the present paper is a tangentially fired rounded-corner pulverized-coal boiler, and the air flow direction introduced into the furnace is set to tangent an imaginary circle, through the air inlets arranged at four corners of the boiler furnace. Because of the tangent-circle design, the air flow in the furnace is observed to move around the circle initially as is shown in Figure 3, where the flow velocity near the imaginary circle is higher in the cross-section of both up- and downward primary air inlets. With the air rising in a spiral motion, the flow features following the path of an imaginary circle become insignificant.
(2)
Temperature fields
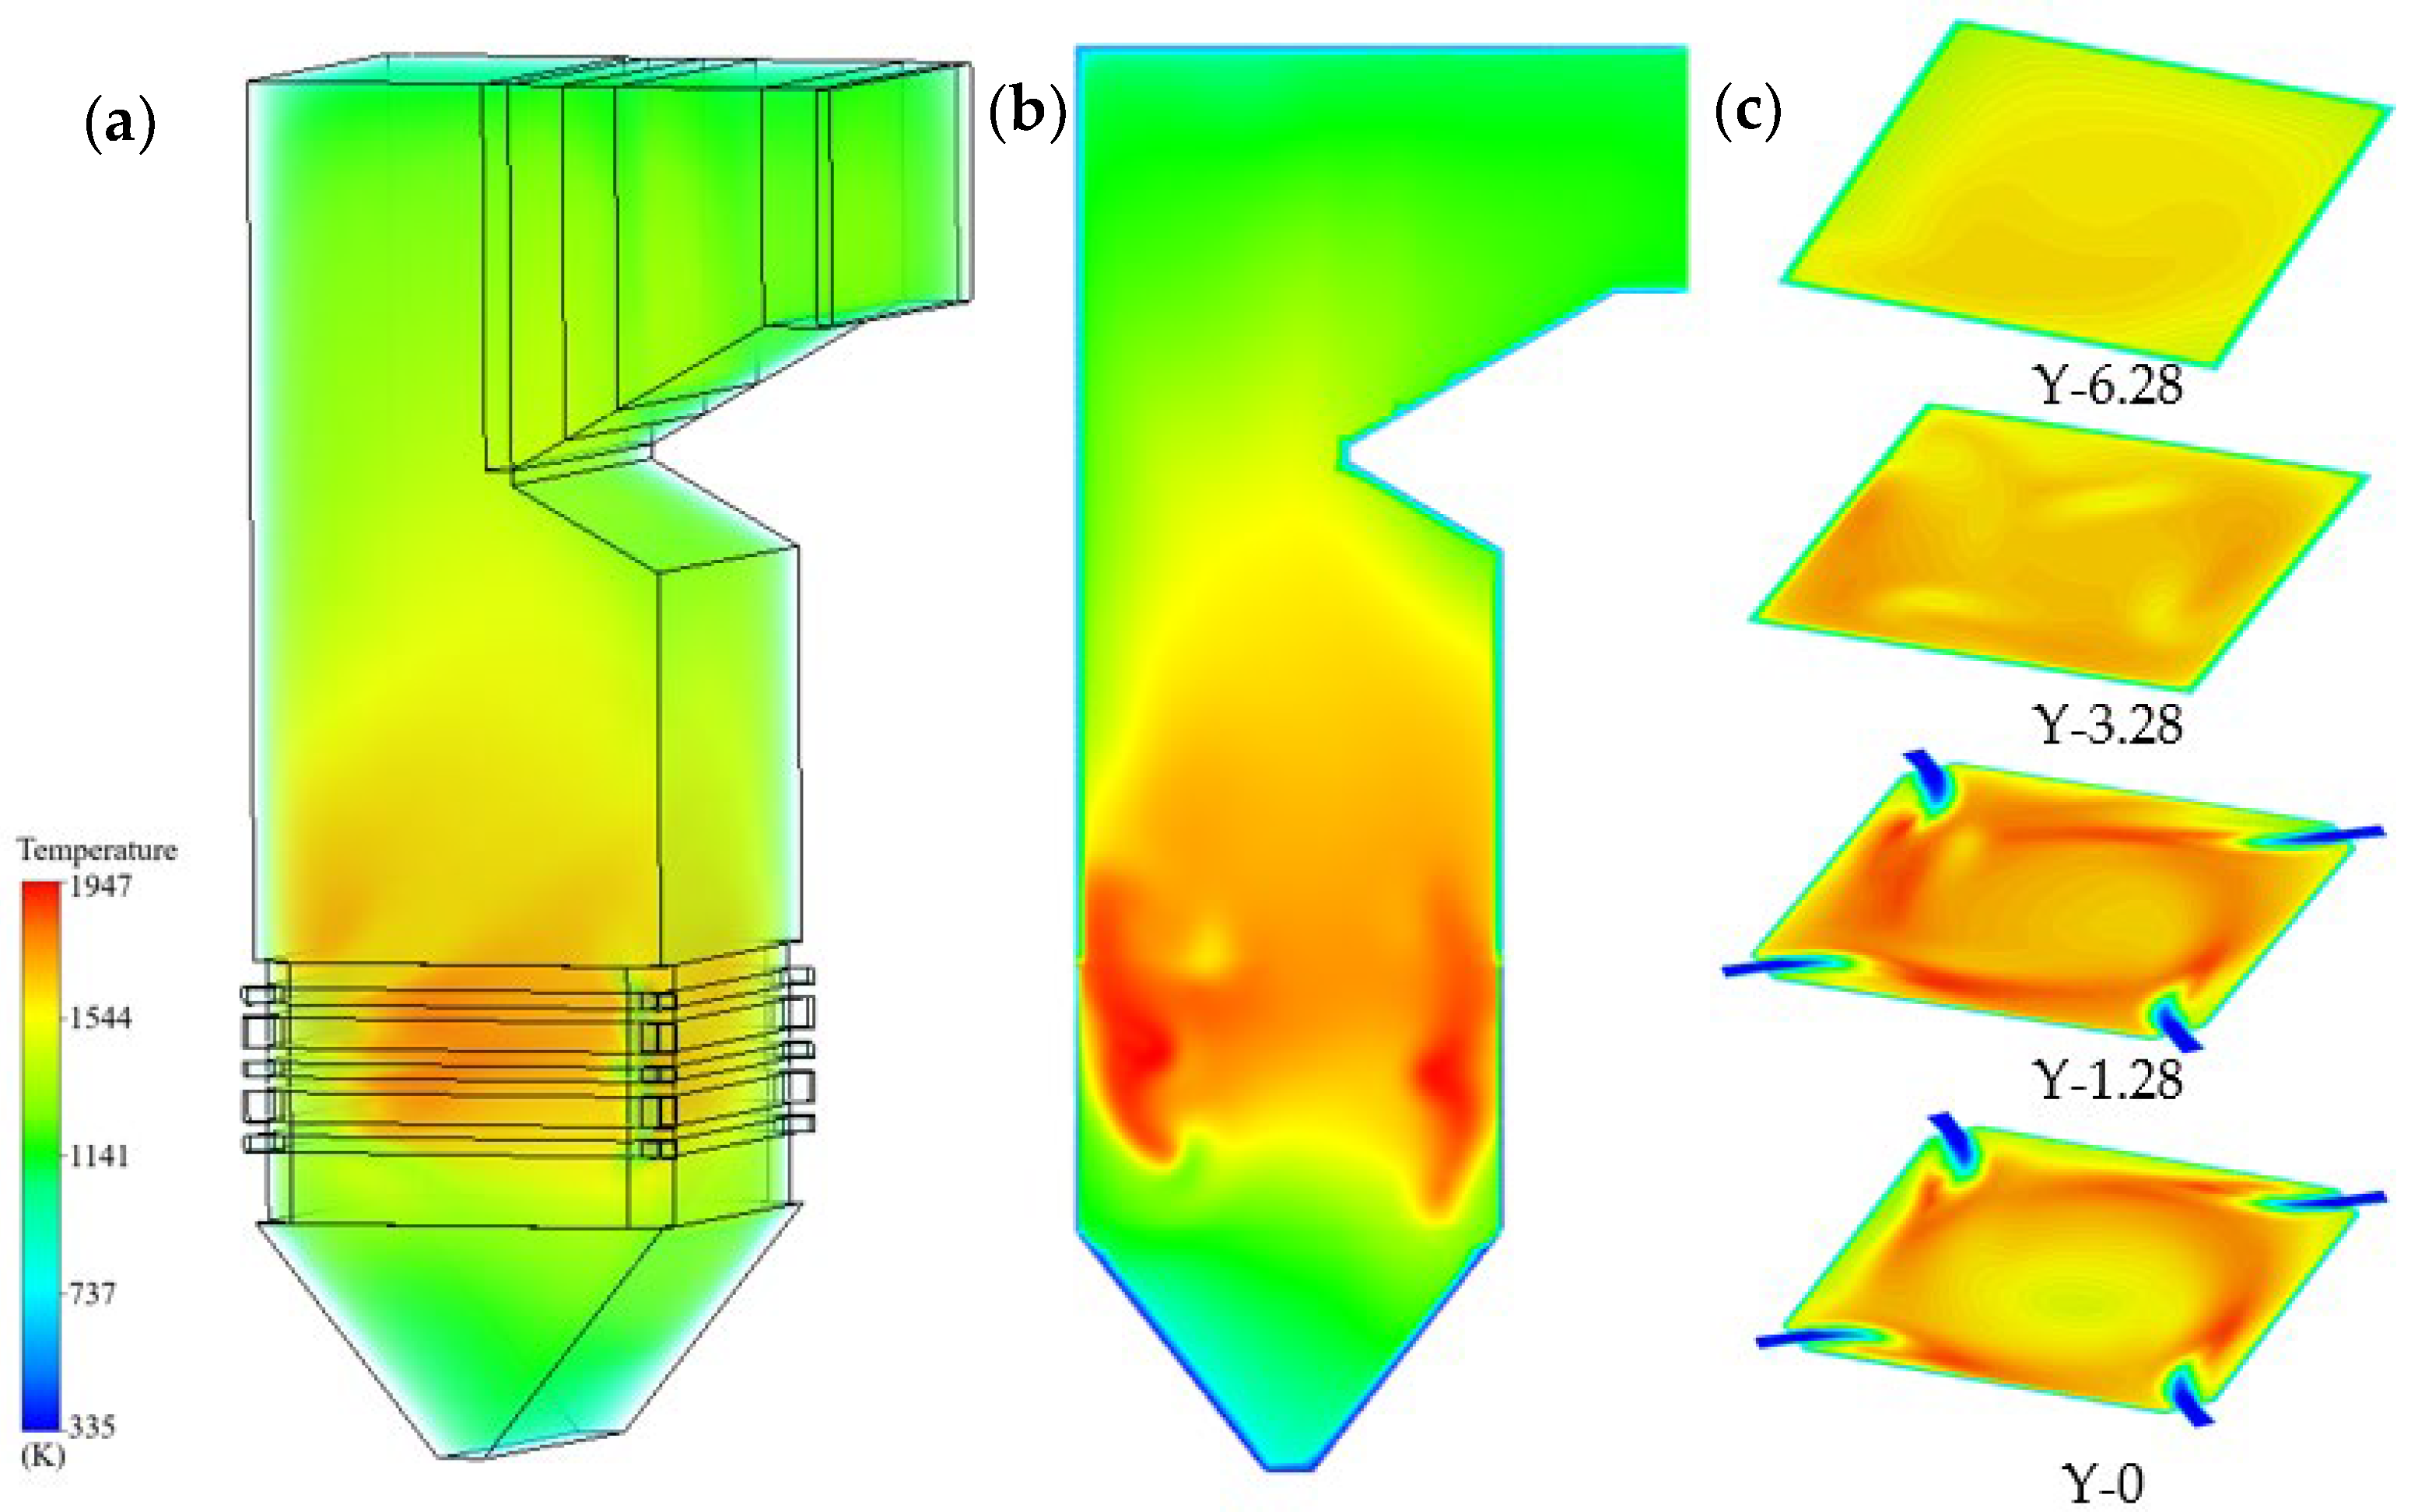
Figure 4 gives the temperature distribution in the furnace and on typical cross-sections when using the designed coal. As the coal particle is injected through the primary air inlet, it is fired and moves with airflow. A large amount of heat is released and sustains flame propagation in the combustion chamber. The unburned components in particles will be progressively burned out in conjunction with the upward flow of gas. As is presented in Figure 4, the highest temperature on the vertical cross-section is 1856 K, adjacent to the wall of the burner zone, where the boiler combustion system is set up. It can also be seen that coal particle combustion is mainly concentrated in the region below the nose arch, where the temperature is relatively high and exhibits significant variation across different zones. After the flue gas passes through the arch, it mixes rapidly, and the temperature becomes overall uniform. Due to the tangential firing, a ring-shaped high-temperature zone is also observed, as is shown in Figure 4c. With the increase in height, the above feature gradually weakens and eventually disappears before the furnace nose.
(3)
Species concentration fields
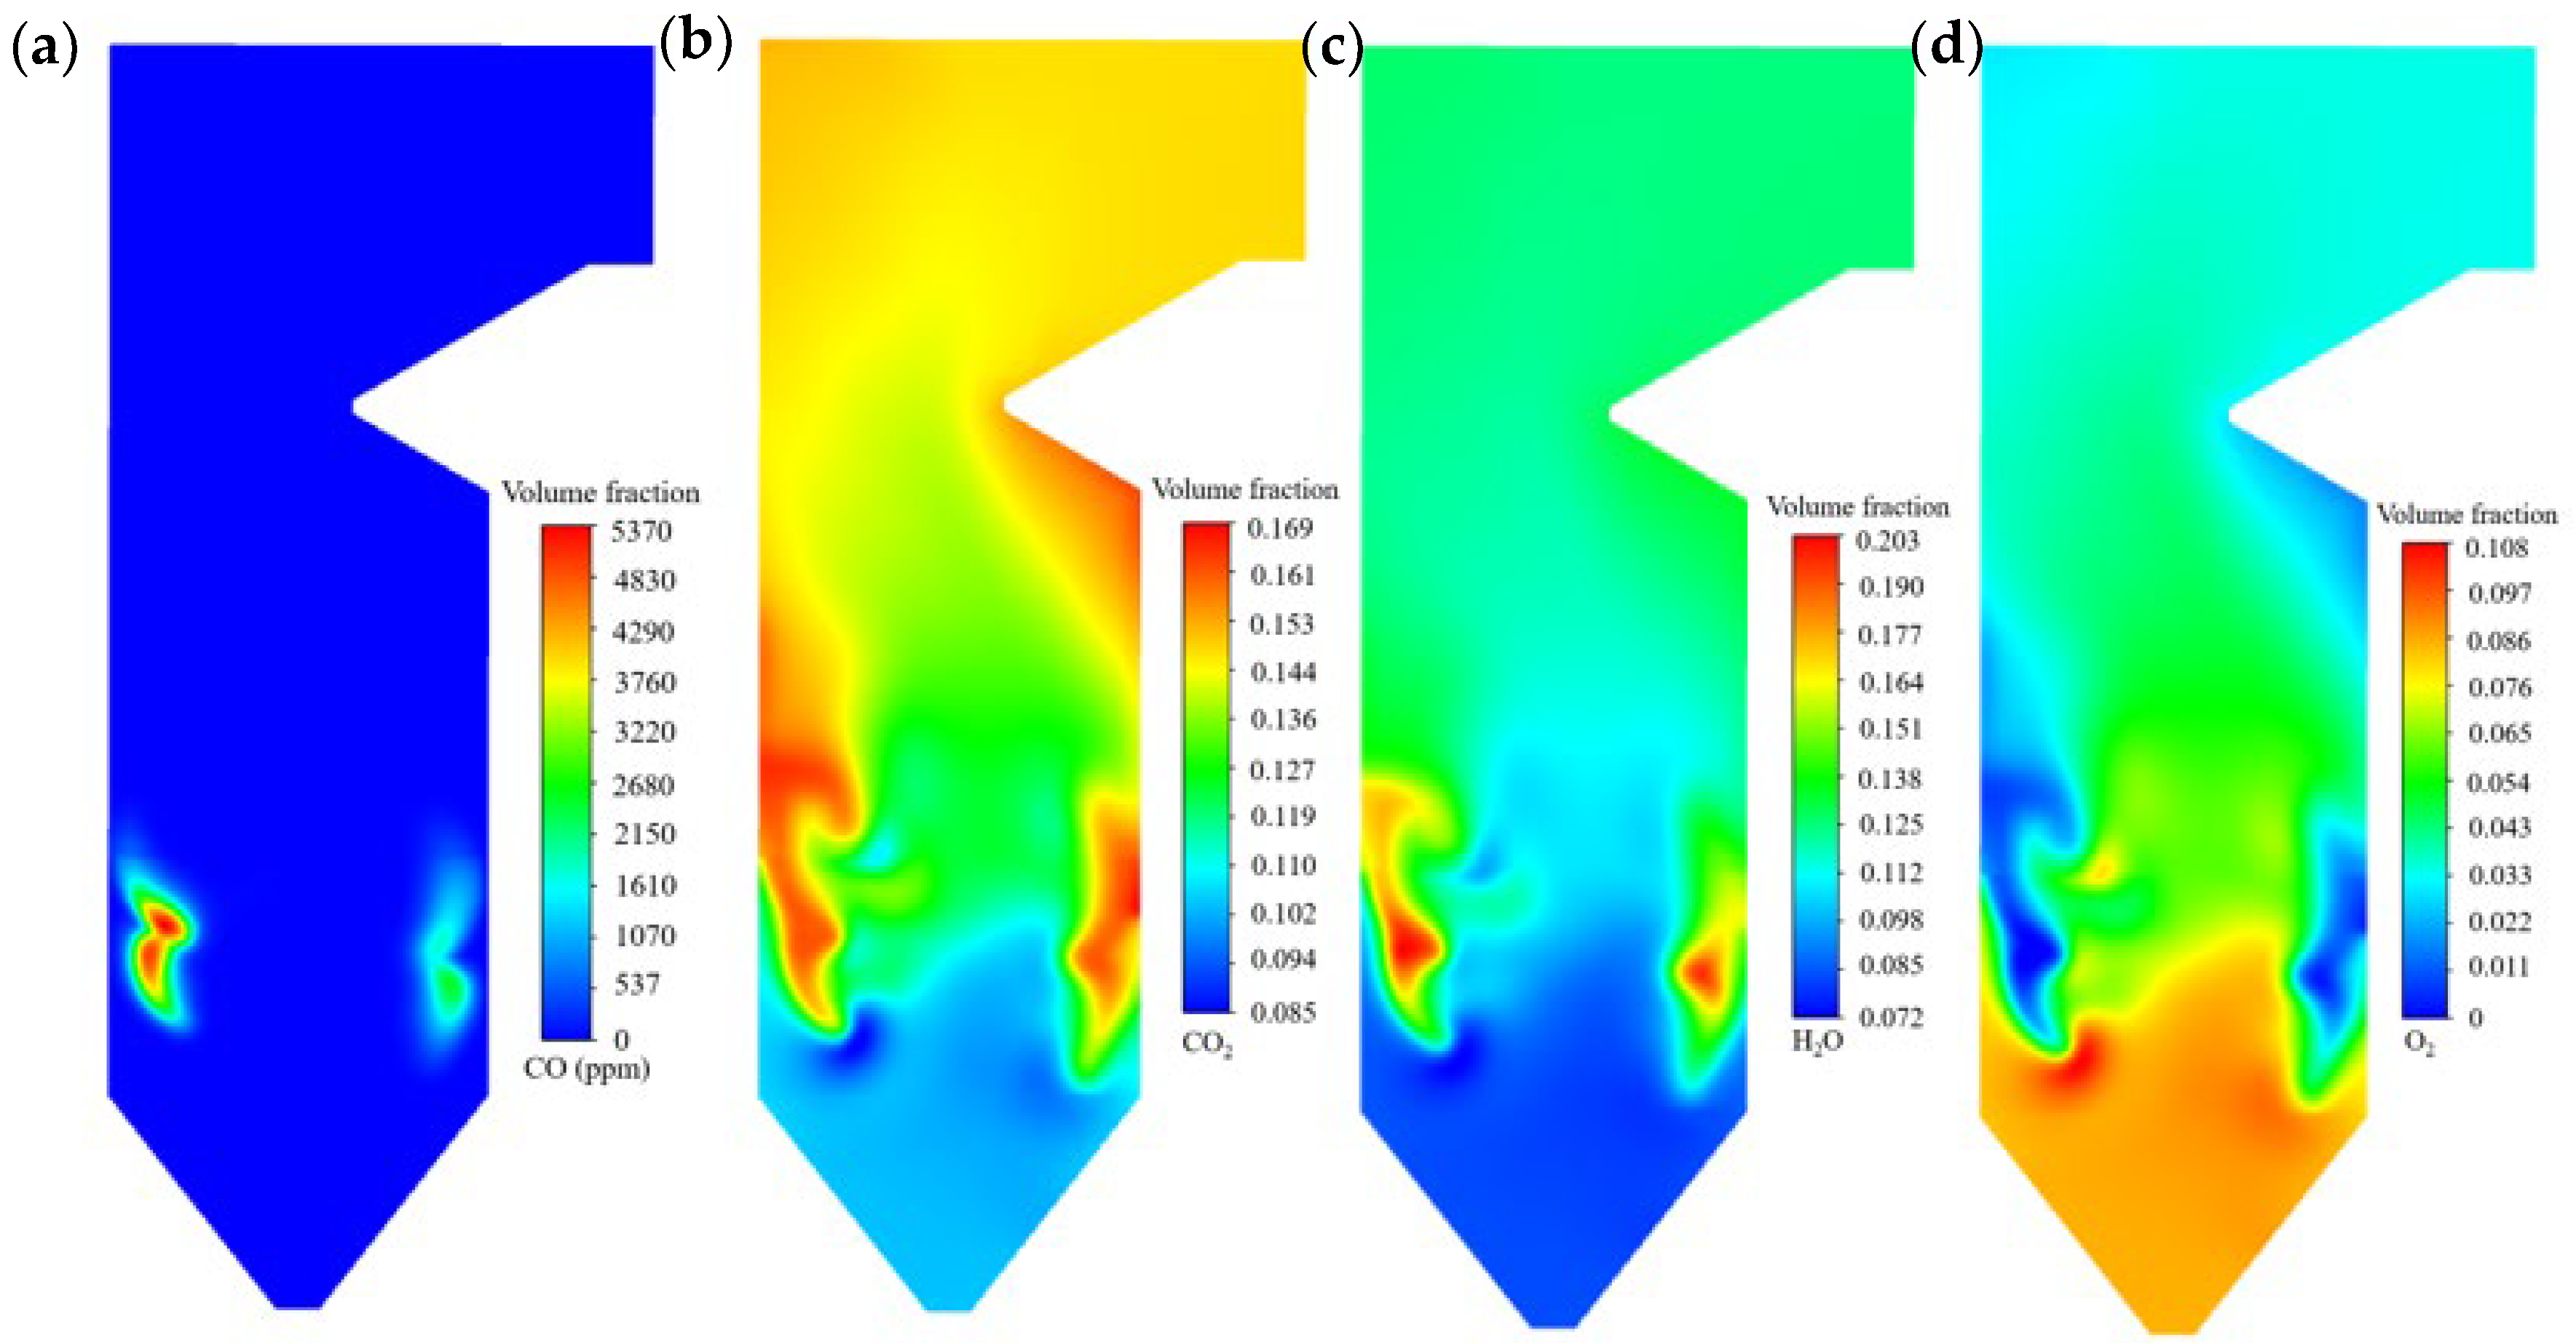
The major gas species considered in the combustion process include CO, CO2, H2O, and O2, which are the principal components reflecting the combustion reaction characteristics and gas-phase composition within the furnace. The mass concentrations of CO, CO2, H2O, and O2 are presented in Figure 5. Under an over-oxygen combustion atmosphere, the formation of CO is minimal. As a result, the CO concentration remains extremely low in most regions of the furnace, as illustrated in Figure 5a. The CO is observed primarily in the vicinity of the primary air inlets, where the fuel is overabundant, leading to the formation of CO. CO2 and H2O are the major combustion products, and their formation is primarily dependent on the elemental composition of the coal. As combustion proceeds to completion, CO2 and H2O accumulate toward the upper region of the boiler, leading to the higher concentrations observed in Figure 5b,c. In the boiler combustion process, the O2 is necessary to ensure the fuel burnout and promotes stable flame propagation, however, excessive O2 can lower furnace temperature and thermal efficiency and may also lead to increased NOₓ formation. Therefore, the O2 concentration in the furnace plays a pivotal role in coal combustion. Because combustion is intensive near the primary air outlets, oxygen consumption is greatest in this region, resulting in a distinct low-oxygen concentration zone adjacent to the burner wall, as shown in Figure 5d. As combustion proceeds, oxygen is continuously consumed, and its concentration gradually decreases with the upward gas flow, dropping to below 4% at the outlet.
(4)
Nitrogen oxides concentration fields.
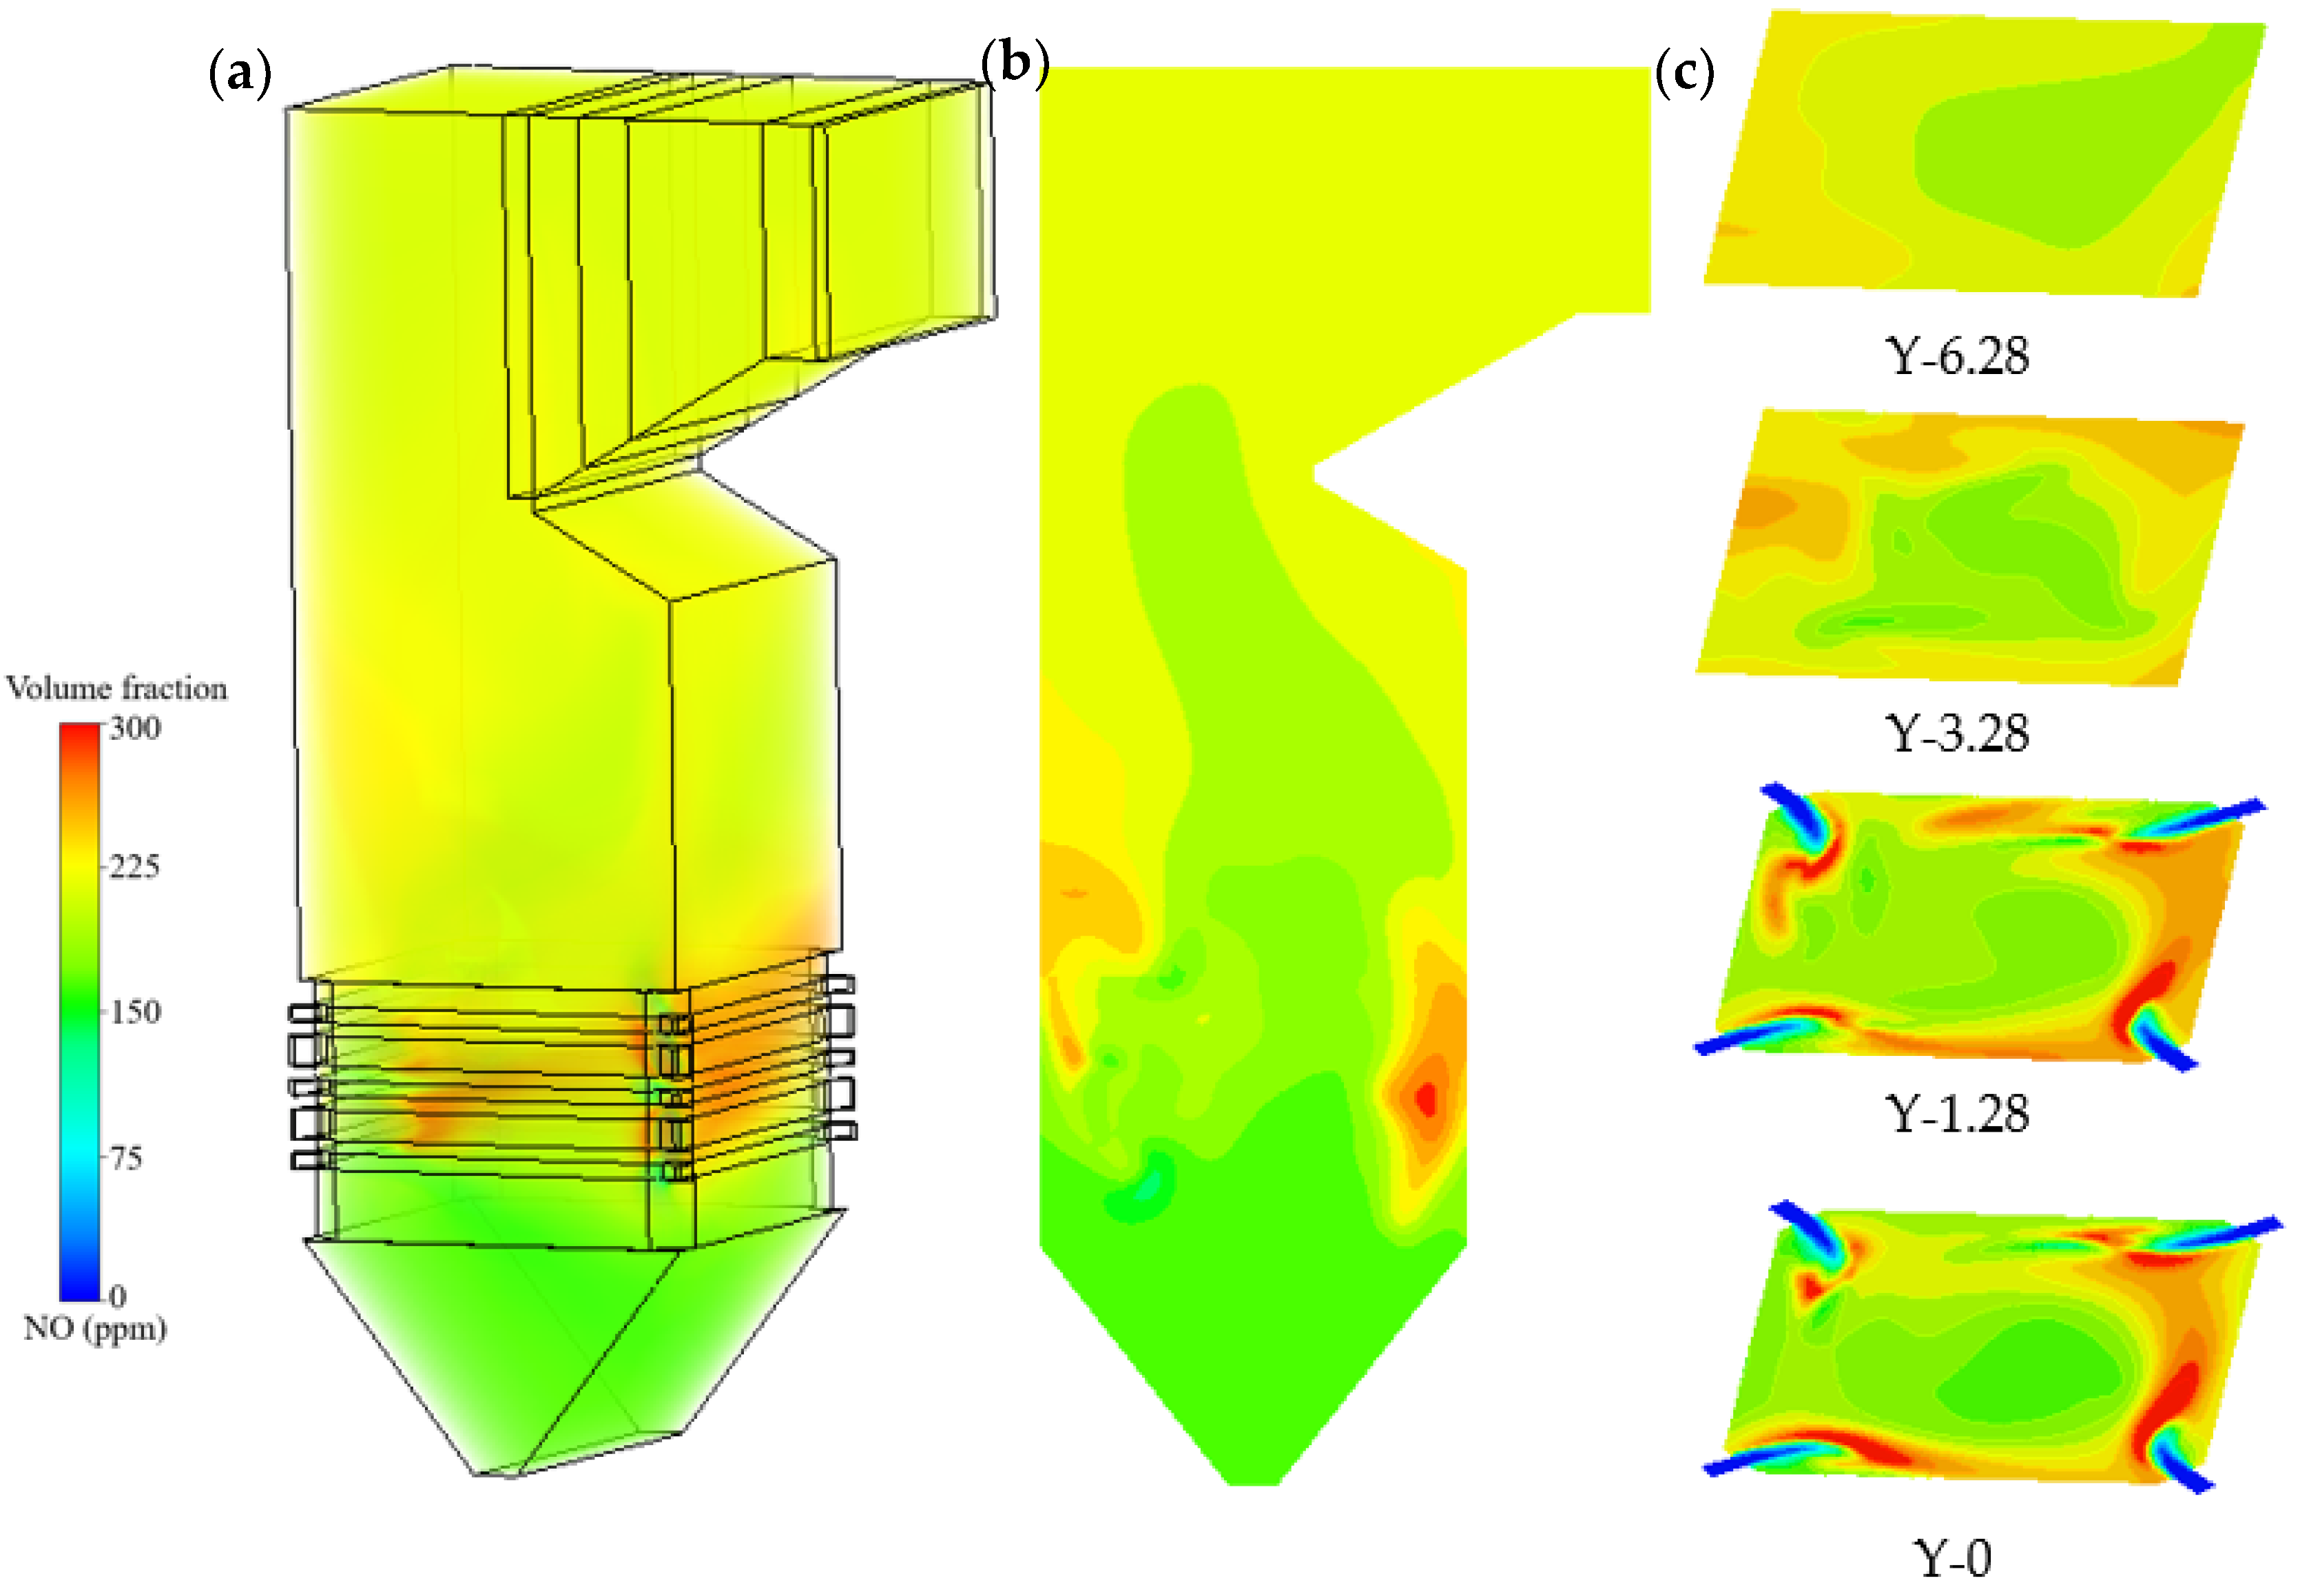
During coal combustion in the furnace, a large amount of nitrogen oxide pollutants are produced, among which nitric oxide (NO) is the predominant species resulting from the characteristics of coal-fired flue gas. Figure 6 illustrates the distribution of nitric oxide concentration within the furnace. According to the formation mechanisms of nitrogen oxides, there are three types of nitric oxide, namely thermal, fuel, and prompt. Among them, the thermal and fuel types are dominant and are taken into account in the present study. The thermal nitric oxide is produced under high-temperature conditions and is strongly temperature-dependent and becomes significant in regions where the furnace temperature exceeds approximately 1500 °C (1773.15K). In contrast, fuel nitric oxide originates from the nitrogen contained in the fuel, which is released during combustion in the form of intermediates such as HCN and NH3 and subsequently oxidized to nitric oxide. As described in the above mechanism, the distribution tendency of nitric oxide in Figure 6 can be clearly interpreted. Given that the combustion is intensive near the primary air inlets with a greater fuel consumption and a higher temperature, the formation of both in fuel and thermal nitric oxide is significant. As a result, the relevant regions present a higher nitric oxide concentration value. Conversely, in the vicinity of the furnace center, the combustion intensity is weaker and the temperature is lower, leading to a reduced formation of nitric oxide. The nitric oxide generated at high concentrations near the furnace wall is then transported upward with the ascending flue gas and accumulates in the upper boiler region. Consequently, the nitric oxide concentration at the top of the furnace is higher than that in the central region below the furnace nose.

4.2. Influence of the Coal Blending Ratio on Temperature

As is well known, due to fluctuations in market supply and price, the originally required coal types are no longer stably available in many regions of China. Coal blending, and even coal substitution, has therefore become a common practice. Since boilers are generally designed for specific coal types, blending inevitably exerts a significant impact on combustion. In this study, the effects of blending on combustion and NOₓ formation are analyzed, ranging from low blending ratios to high ratios approaching complete substitution.
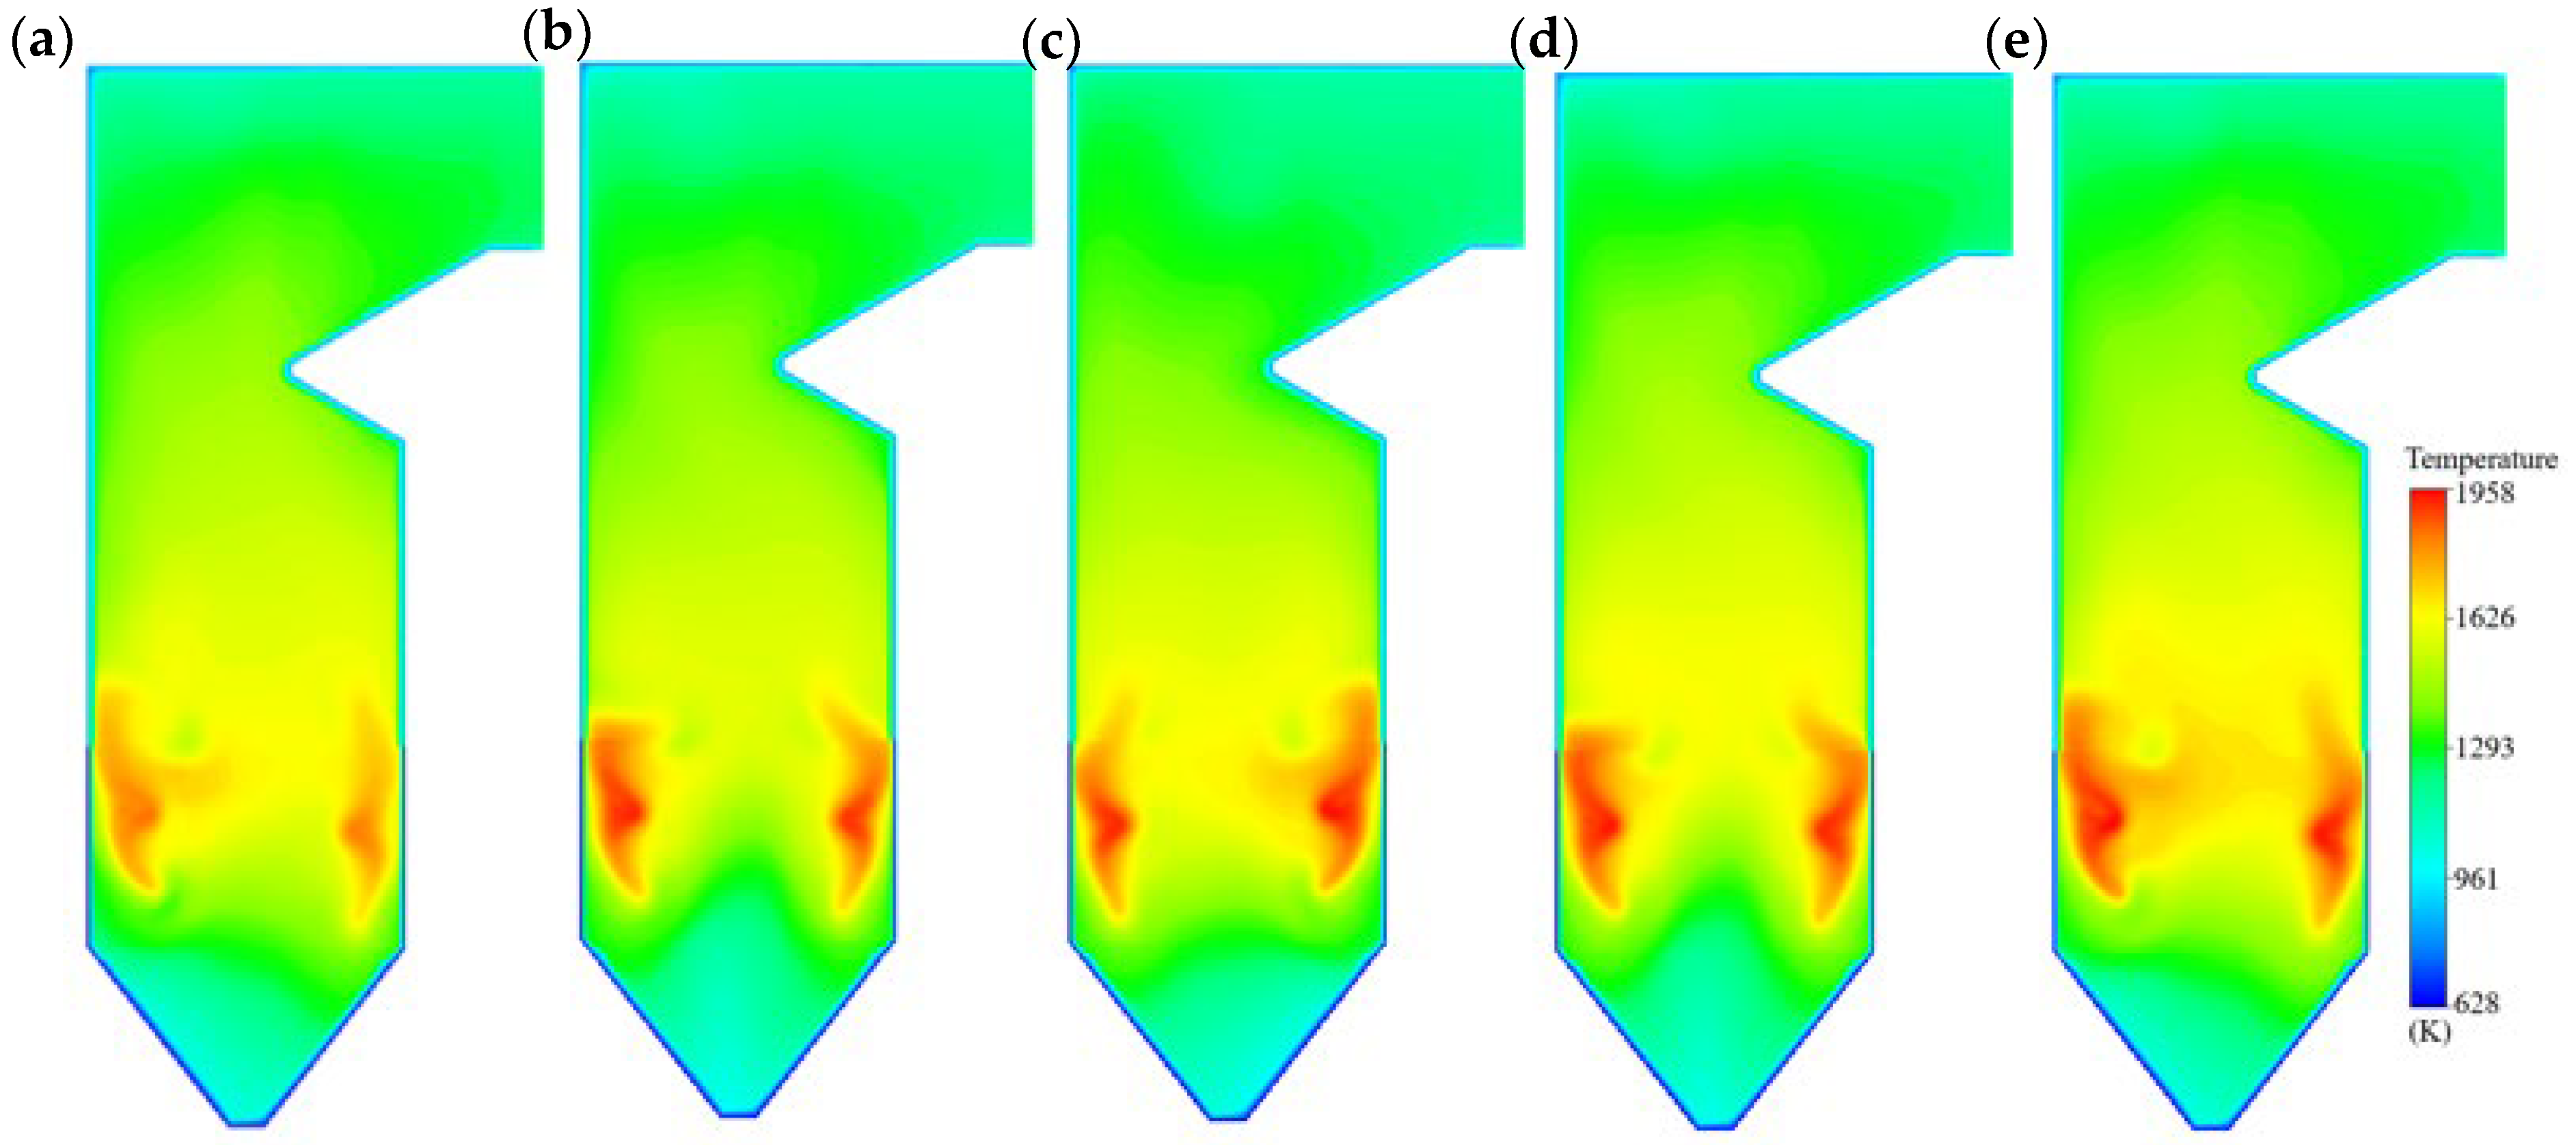
In order to discuss the effect of coal blending on furnace temperature, the distributions of the temperature varying with blending ratio (mass fraction of bituminous coal in the total fuel) are exhibited in Figure 7. It is observed that the changes in temperature distribution are observed as the blending ratio is increased, which is especially obvious in the burner zone. These findings indicate a variation in the internal combustion characteristics. Compared with firing lignite alone, the co-firing of bituminous coal significantly influences the combustion characteristics of the boiler. The higher volatile matter content of bituminous coal enhances ignition and flame stability, while the increased carbon and hydrogen contents, together with the higher calorific value, lead to a higher combustion temperature. As a result, it is observed that the furnace temperature increases with the blending ratio.
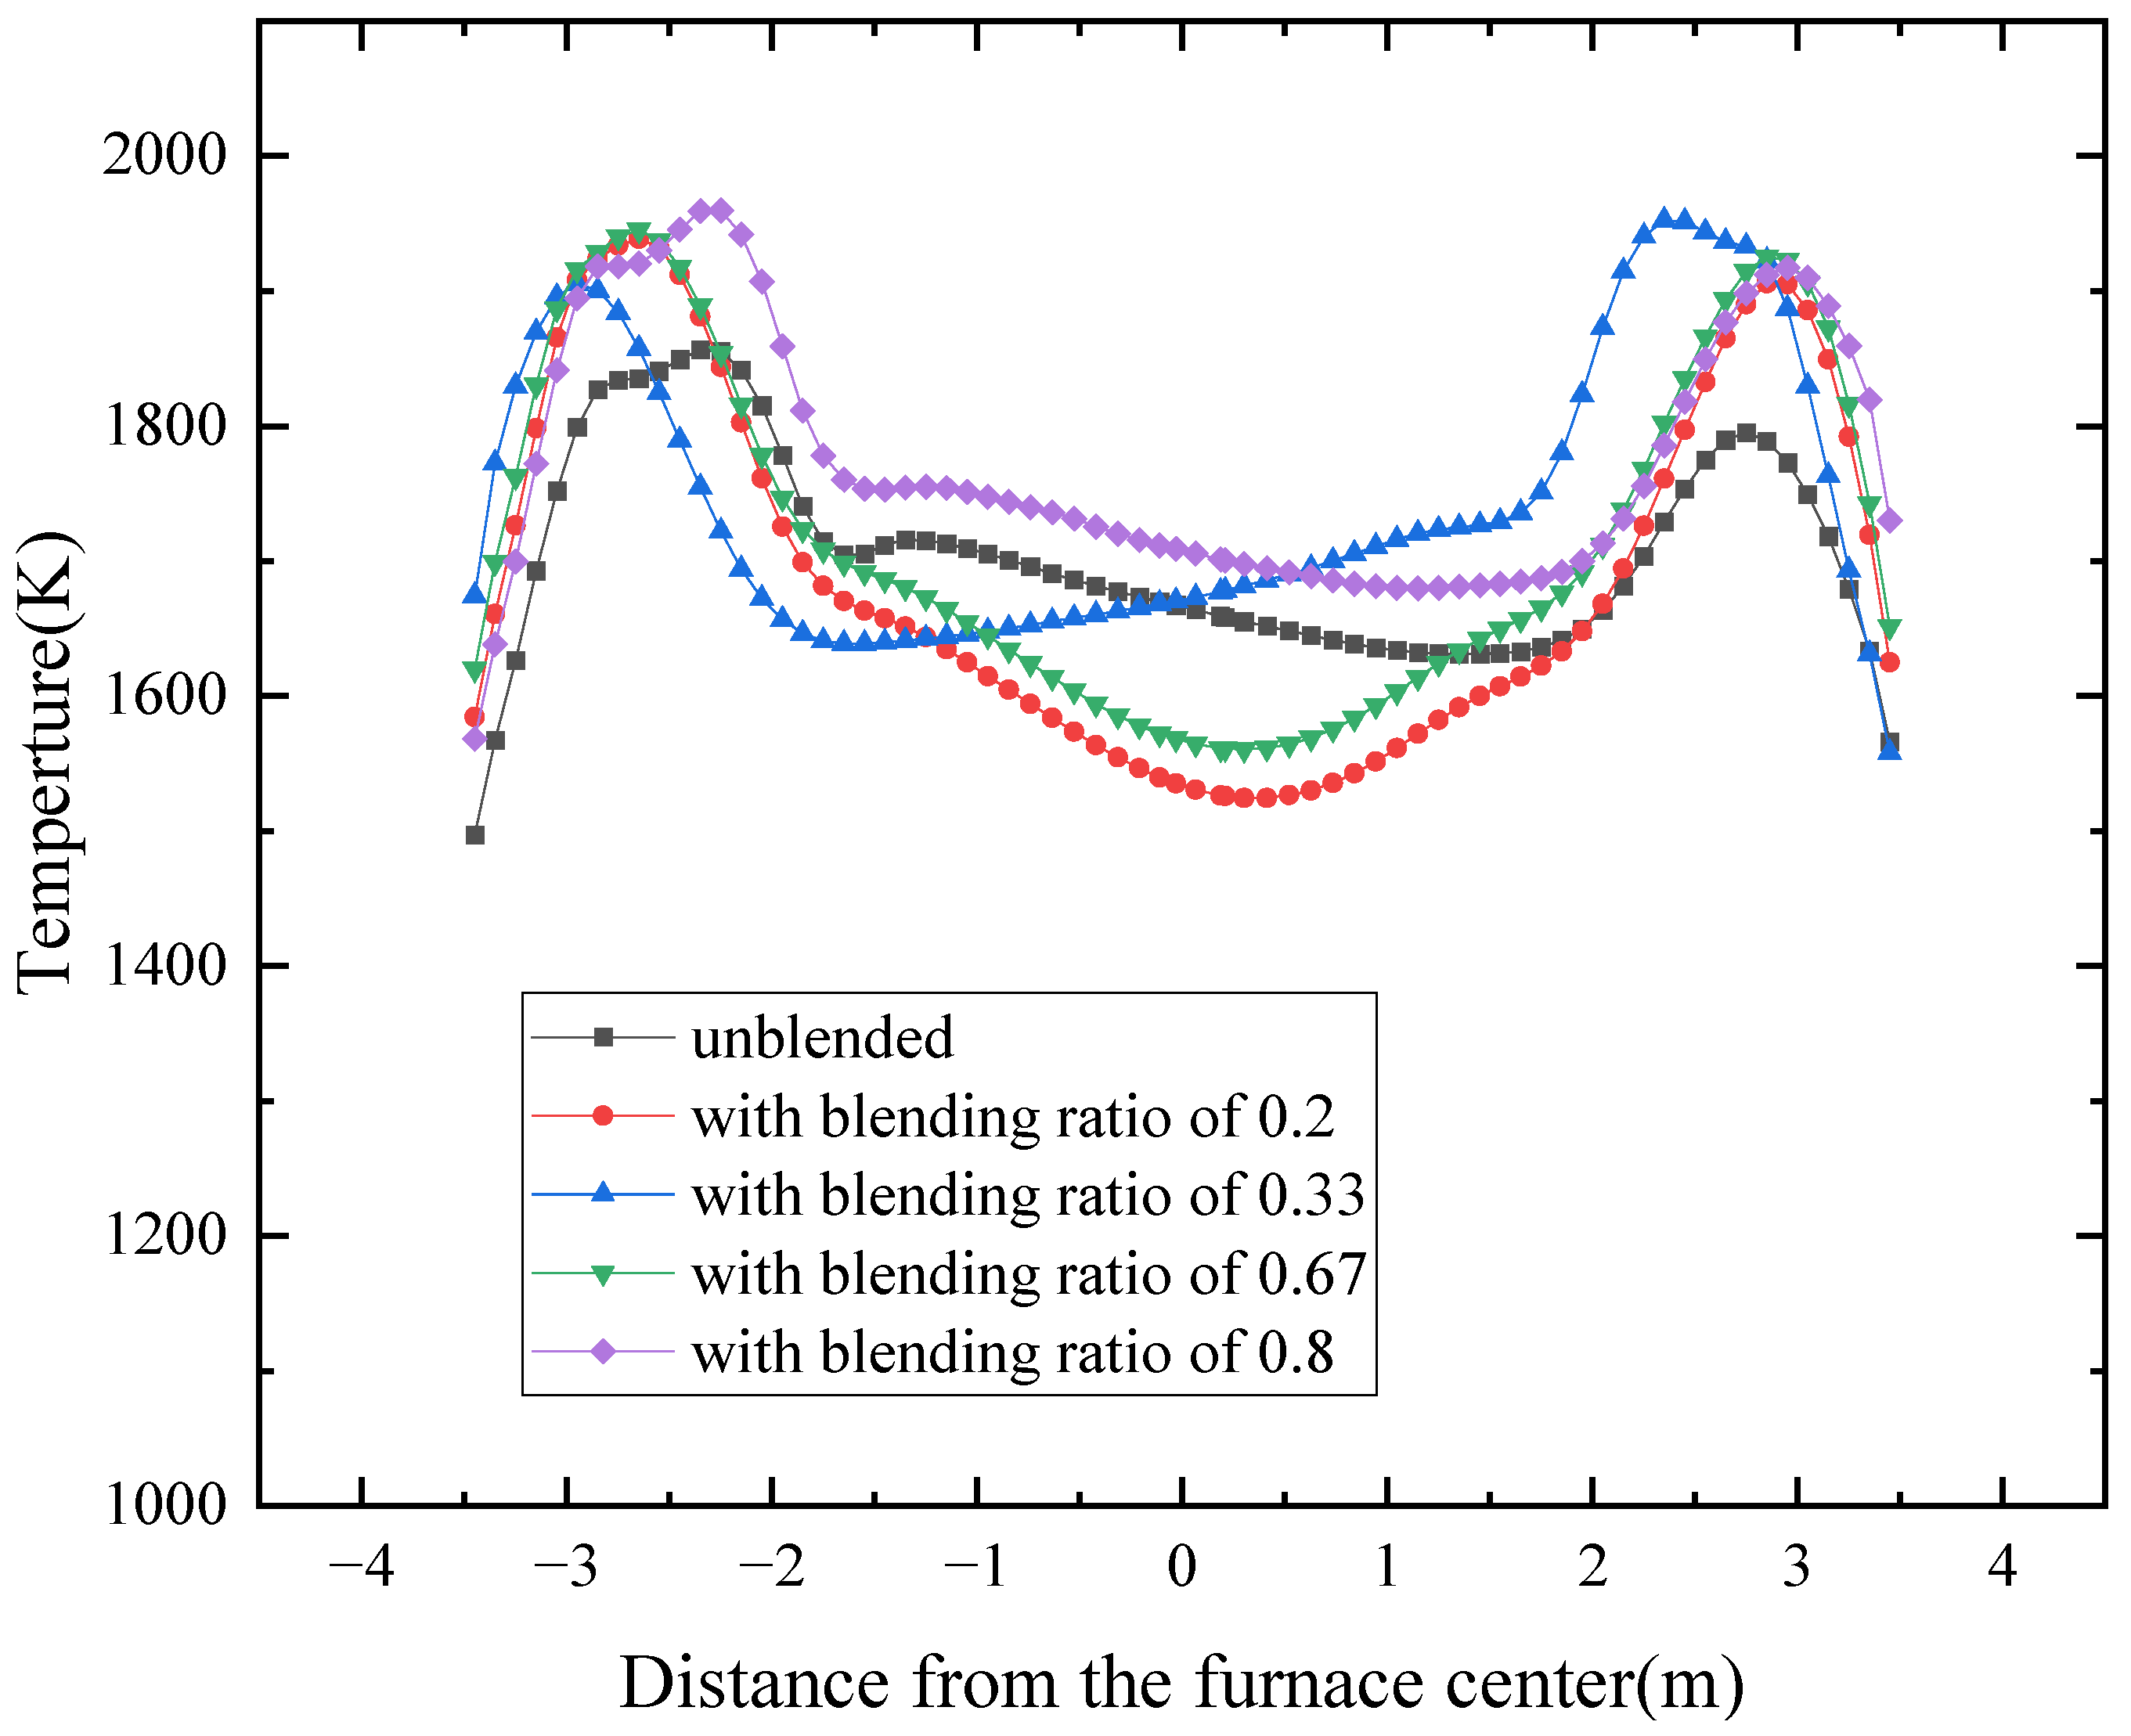
Temperature variation along line AB, which passes through the center of the Y-1.28 cross-section, is presented in Figure 8 to quantitatively evaluate the effect of the coal blending ratio on the furnace temperature. Since the blended coal has a higher net calorific value, it is seen that the maximal temperature is increased as the bituminous coal is added. The maximum temperatures corresponding to blending ratios of 0, 0.2, 0.33, 0.67, and 0.8 are 1856 K, 1938 K, 1952 K, 1945 K, and 1959 K, respectively. As the formation of thermal nitric oxide is acknowledged to strongly depend on a high temperature exceeding 1500 °C, an increase in nitric oxide concentration probably occurs while the bituminous coal is blended. In addition, it is observed that the maximum temperature tends to occur closer to the furnace wall when bituminous coal is blended, suggesting that coal blending increases the tendency for wall-adjacent combustion.

4.3. Influence of the Coal Blending Ratio on Species Concentration

The volume fraction of CO, CO2, H2O, and O2 on line AB under different blended coal ratios is given in Figure 9. As the second coal is blended, the CO on line AB is seen to increase obviously as shown in Figure 9a. When considering the temperature distribution presented in Figure 8 together with the oxygen volume fraction distribution in Figure 9b, the aforementioned phenomenon can be rationalized by the following mechanism. As coal blending deteriorates flame diffusion and induces wall-adjacent combustion, the fuel-rich region at the furnace center tends to expand (as is shown in Figure 9b), while the oxygen consumption in the near-wall region is intensified. This imbalance causes oxygen deficiency adjacent to the wall, ultimately leading to a significant increase in CO concentration in the near-wall area, as observed in the simulation results. The anomalously high CO concentration appearing on the right side of Figure 9a can also be interpreted using the mechanism described above. As illustrated in Figure 8, when the blending ratio is 0.33, a localized high-temperature region with a peak value of up to 1952 K emerges at approximately 2.5 m from the furnace center. This strong combustion activity leads to considerable oxygen consumption, which is reflected in the significant oxygen depletion observed at the corresponding position in Figure 9b. Consequently, this oxygen deficiency results in the marked increase in CO concentration recorded in Figure 9a. As shown in Figure 9a,b, the values in most regions are higher under the unblended coal condition compared to the blended coal cases. This suggests that the incorporation of coal blending may suppress the formation of H2O and CO2.

4.4. Influence of the Coal Blending Ratio on Nitric Oxide Concentration

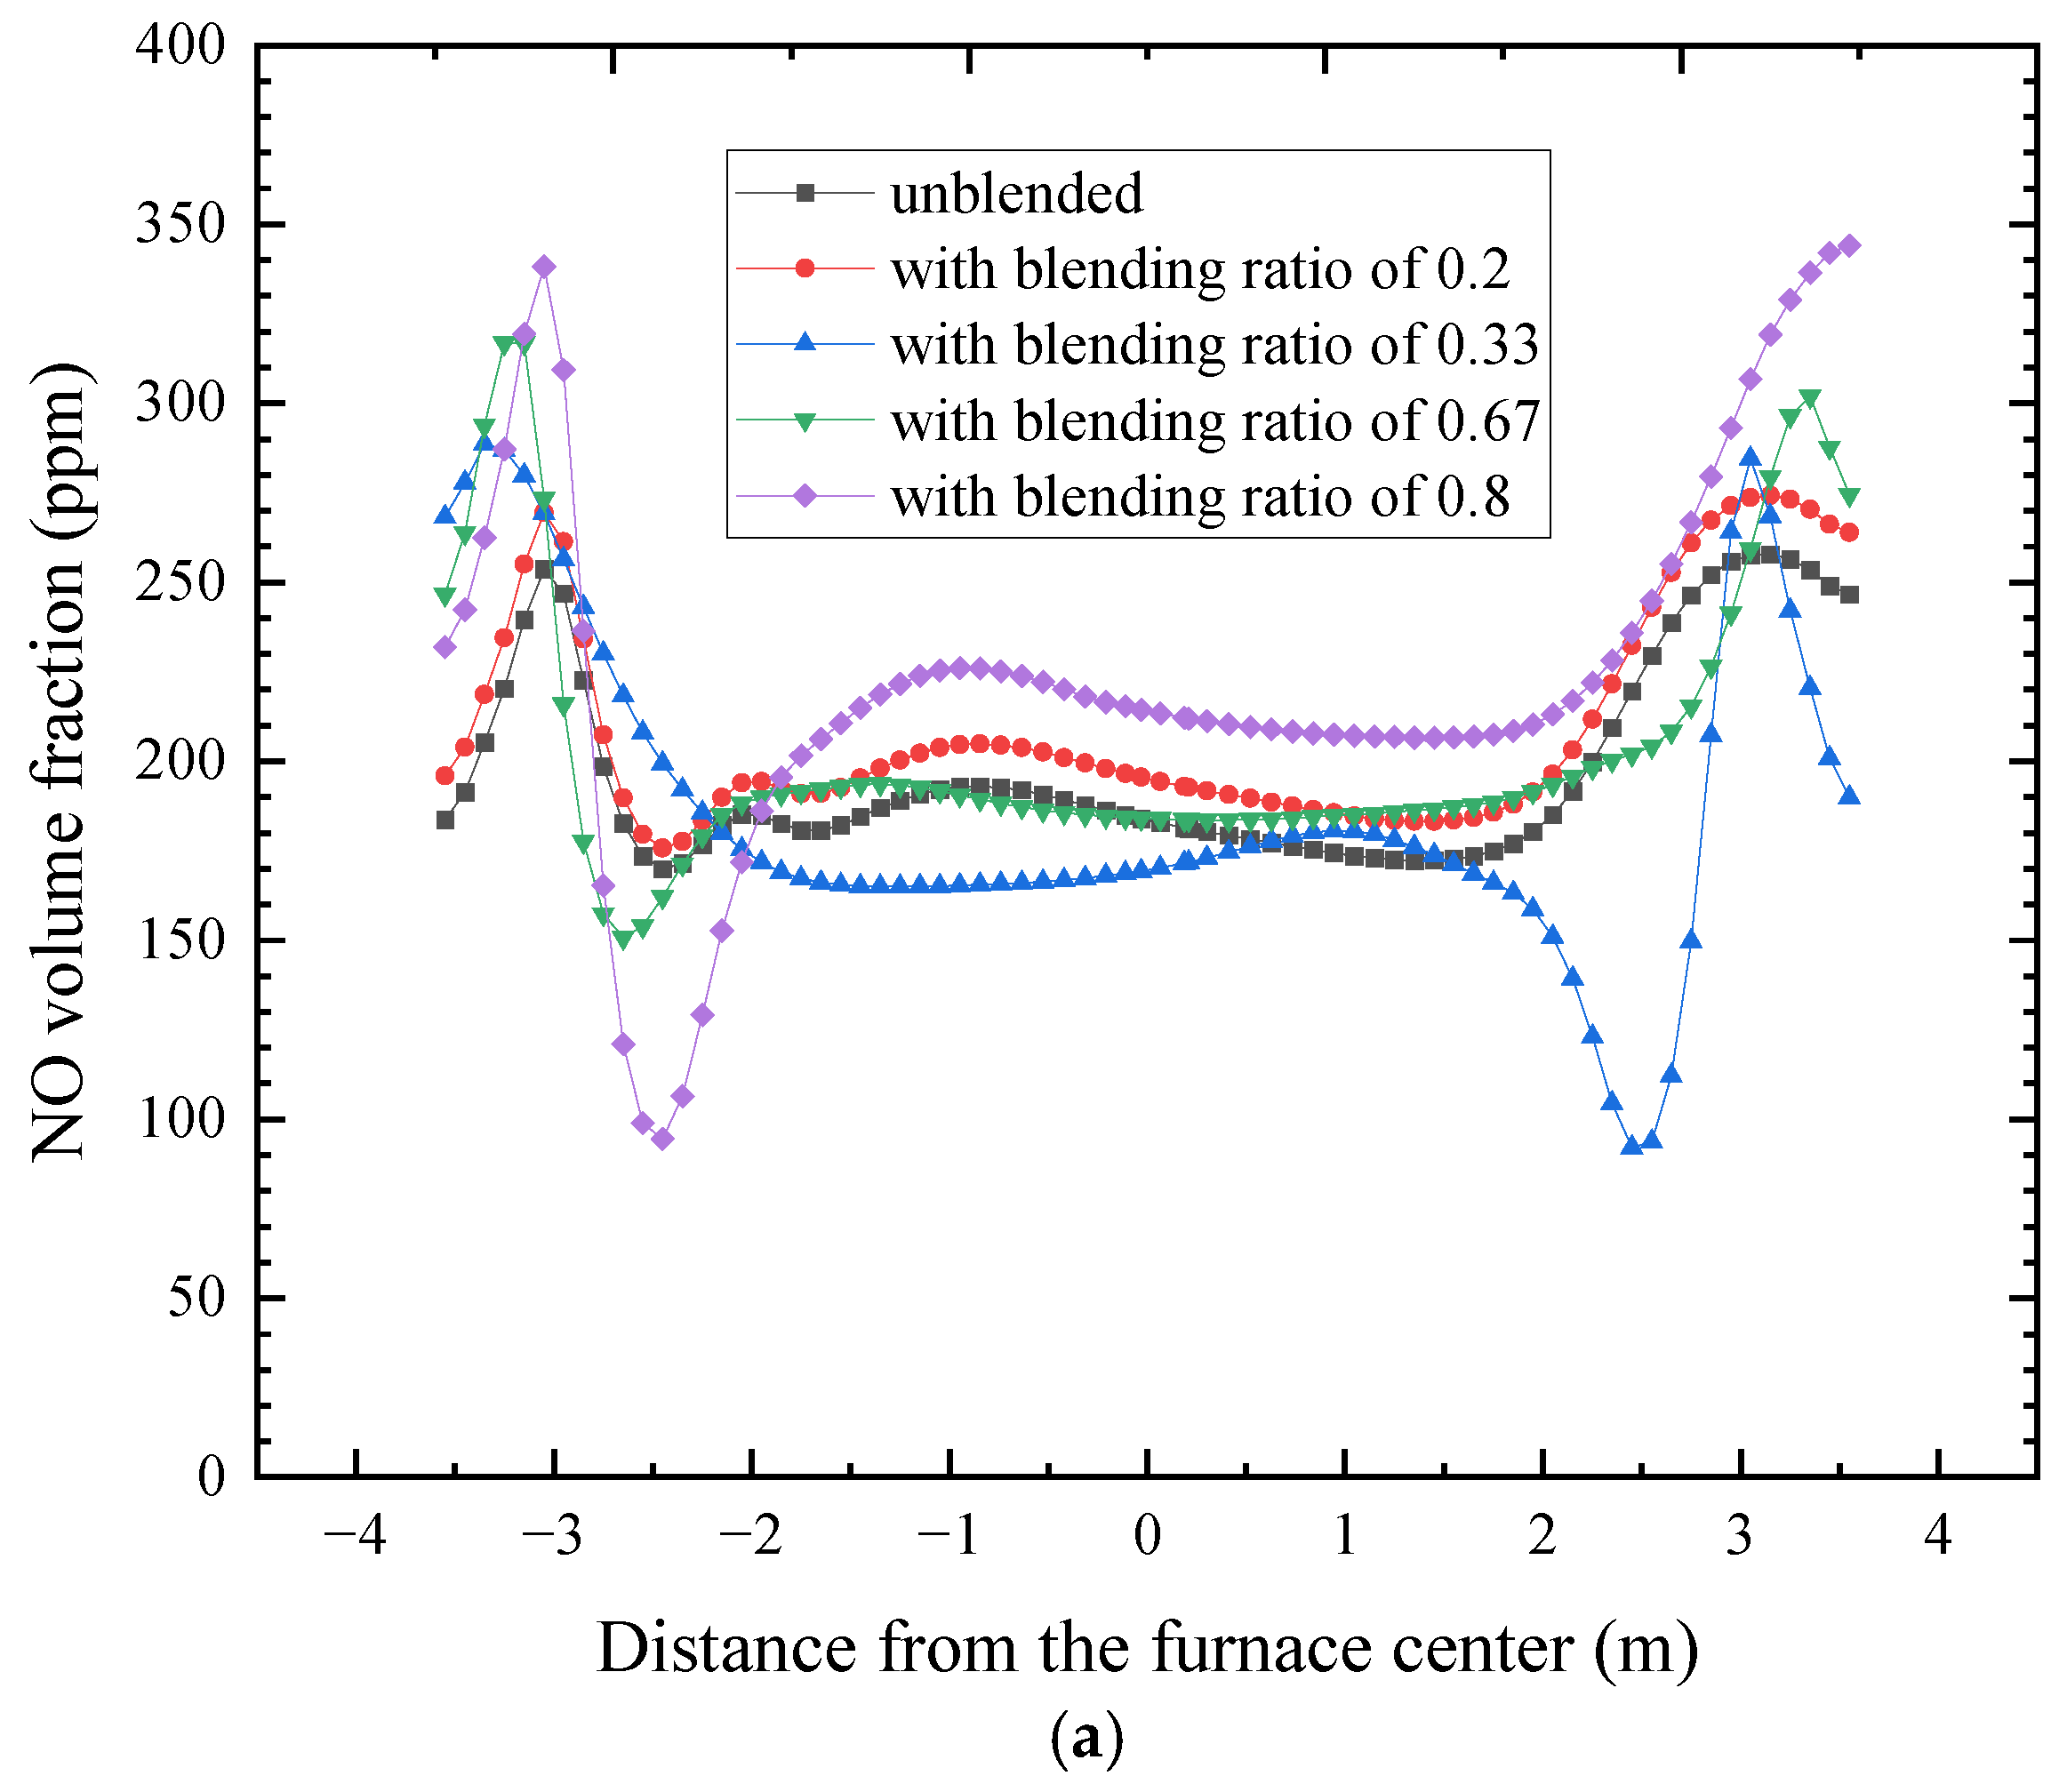
The nitric oxide distributions on line AB with different blending coal ratios are presented in Figure 10a. As shown in Figure 10a, the distribution of NO concentration across the furnace cross-section exhibits clear differences under various blending ratios. In general, the NO volume fraction reaches its maximum near the furnace walls, while remaining relatively low in the central region. This indicates that combustion is more intense near the wall, where the higher temperature promotes thermal NO formation, whereas the central zone is relatively fuel-rich and oxygen-deficient, resulting in lower NO concentrations. With increasing blending ratio, particularly at 0.67 and 0.8, the NO peaks near the wall become more pronounced, suggesting that coal blending enhances wall-adjacent NO formation. In contrast, the unblended and low blending ratio (0.2) cases show lower overall NO levels and smoother distributions. Furthermore, it can be observed in the figure that, at blending ratios of 0.33 and 0.8, two pronounced minima occur around ±2.5 m. This phenomenon is primarily attributed to the relatively high CO concentration in these regions, where the elevated temperatures favor the reaction of CO with NO, thereby reducing NO to N2 (molecular nitrogen).
Figure 10b illustrates the variation of NO mass concentration at the furnace outlet under different blending ratios. In order to ensure comparability with emission standards, the concentration values presented in Figure 10b are further normalized to standard conditions (273.15 K, 101.325 kPa) with a reference oxygen content of 6%. The outlet NO concentration increases progressively with higher blending ratios: 357 mg/m3 for the unblended case, 381 mg/m3 at 0.2, 394 mg/m3 at 0.33, and further rising to 427 mg/m3 and 457 mg/m3 at 0.67 and 0.8, respectively. This trend demonstrates that increasing the proportion of bituminous coal raises both the combustion temperature and the release of fuel-bound nitrogen, thereby promoting the formation of both fuel NO and thermal NO, and ultimately leading to significantly higher NO emissions at the furnace outlet.

5. Conclusions

This study numerically investigated the combustion characteristics and NO formation in a 130 t/h tangentially fired pulverized-coal boiler under designed coal (lignite) and that blended with bituminous coal. The effects of coal blending ratios are discussed thoroughly. The major findings are summarized as follows:
(1)
Coal particles injected by primary air follow spiral trajectories along an imaginary tangent circle, with residence times on the order of tens of seconds. This circulation ensures sufficient burnout before the particles escape from the furnace outlet. The tangentially arranged air inlets establish a circular airflow, which gradually weakens with increasing height.
(2)
Combustion is concentrated below the nose arch, producing a maximum temperature of 1856 K with the designed coal. Above the arch, flue gas mixing leads to more uniform temperature fields, while a ring-shaped high-temperature zone typical of tangential firing gradually disappears with height. Coal blending increases the peak furnace temperature to above 1900 K and shifts the maximum temperature location toward the wall, suggesting a stronger tendency for wall-adjacent combustion.
(3)
CO is generally low under over-oxygen conditions, but blending promotes localized CO enrichment near the wall due to deteriorated flame diffusion and intensified oxygen consumption adjacent to the wall. In contrast, CO2 and H2O concentrations decrease with blending compared to unblended coal firing. O2 consumption is most intense near the primary air inlets, resulting in a distinct low-O2 zone, and its concentration falls below 4% at the outlet.
(4)
Nitric oxide is dominated by thermal and fuel mechanisms, generated mainly in wall-adjacent high-temperature regions. The outlet NO concentration increases progressively with blending ratio, from 357 mg/m3 in the unblended case to 457 mg/m3 at a blending ratio of 0.8.
Overall, the results demonstrate that increasing the proportion of bituminous coal enhances combustion intensity and elevates peak temperatures but also aggravates wall-adjacent combustion, localized CO accumulation, and higher NO emissions. These findings suggest that when blended coal firing is implemented, the primary issue to be addressed is wall-adjacent combustion caused by flame diffusion, which can be effectively improved through adjustments to the air distribution system. In addition, when stringent outlet emission limits are required, it is advisable to maintain the blending ratio below 30%. Under this condition, the increase in outlet concentration does not exceed 10%, and existing environmental control facilities can still ensure that the emission levels remain compliant with regulatory standards.

Author Contributions

Investigation, C.Z., W.Z., B.W. and Z.L.; Writing—original draft, W.Z.; Writing—review and editing, C.Z. All authors have read and agreed to the published version of the manuscript.

Funding

This work is supported by Yibin University Science and Technology Program (No. 2021QH022, 25HXXZJXB050) and College Students Innovation and Entrepreneurship Training Program (No. S202510641089).

Data Availability Statement

The original contributions presented in this study are included in the article. Further inquiries can be directed to the corresponding author.

Conflicts of Interest

The authors declare no conflict of interest.

References

  1. Wang, X.; Chen, Z.; Qi, R.; Li, L. Green supply chain for coal: Models and optimization. Clean. Logist. Supply Chain 2025, 14, 100206. [Google Scholar] [CrossRef]
  2. Dechamps, P. The IEA World Energy Outlook 2022—A brief analysis and implications. Eur. Energy Clim. J. 2023, 11, 100–103. [Google Scholar] [CrossRef]
  3. Tong, C.; Yang, X.; Chen, G.; Zhang, Y.; Chen, L.; Zhou, Y.; He, T.; Jin, B. Experimental investigation for the combustion characteristics of blends of three kinds of coal. Fuel 2021, 300, 120937. [Google Scholar] [CrossRef]
  4. Wang, C.; Fan, G.; Sun, R.; Wang, C.; Chen, W.; Che, D. Effects of coal blending on transformation of alkali and alkaline-earth metals and iron during oxy-fuel co-combustion of Zhundong coal and high-Si/Al coal. J. Energy Inst. 2021, 94, 96–106. [Google Scholar] [CrossRef]
  5. Amini, S.H.; Vass, C.; Shahabi, M.; Noble, A. Optimization of coal blending operations under uncertainty–robust optimization approach. Int. J. Coal Prep. Util. 2022, 42, 30–50. [Google Scholar] [CrossRef]
  6. Hariana, P.A.; Ahmadi, G.A.; Darmawan, A. Ash Evaluation of Indonesian Coal Blending for Pulverized Coal-Fired Boilers. J. Combust. 2021, 2021, 15. [Google Scholar] [CrossRef]
  7. Wang, C.a.; Liu, Y.; Zhang, X.; Che, D. A study on coal properties and combustion characteristics of blended coals in northwestern China. Energy Fuels 2011, 25, 3634–3645. [Google Scholar] [CrossRef]
  8. Zaid, M.Z.S.M.; Wahid, M.A.; Mailah, M.; Mazlan, M.A.; Saat, A. Coal fired power plant: A review on coal blending and emission issues. In AIP Conference Proceedings; American Institute of Physics: College Park, MD, USA, 2019. [Google Scholar]
  9. Haas, J.; Tamura, M.; Weber, R. Characterisation of coal blends for pulverised fuel combustion. Fuel 2001, 80, 1317–1323. [Google Scholar] [CrossRef]
  10. Szufa, S.; Piersa, P.; Junga, R.; Błaszczuk, A.; Modliński, N.; Sobek, S.; Marczak-Grzesik, M.; Dzikuć, M. Numerical modeling of the co-firing process of an in situ steam-torrefied biomass with coal in a 230 MW industrial-scale boiler. Energy 2023, 263, 125918. [Google Scholar] [CrossRef]
  11. Qiao, Y.; Fan, S.; Wu, X.; Chen, Z.; Guan, S.; Li, J.; Yuan, Z.; Hou, J.; Li, Z. Numerical analysis on effect of blend ratio on co-combustion characteristics of semi-coke and bituminous coal in swirl burner. Combust. Sci. Technol. 2024, 196, 504–523. [Google Scholar] [CrossRef]
  12. Bian, L.; Li, Z.; Lu, Y.; Chen, Z.; Li, Z.; Sun, D. Numerical Simulation on Combustion and Slagging Characteristics of a Down-Fired Boiler Under Different Blending Ratios of Anthracite/Bituminous Coal. Combust. Sci. Technol. 2025, 1–29. [Google Scholar] [CrossRef]
  13. Fakourian, S.; Roberts, M.; Dai, J. Numerical prediction of ash deposit growth burning pure coal and its blends with woody biomass in a 1.5 MWTH combustor. Appl. Therm. Eng. 2023, 224, 120110. [Google Scholar] [CrossRef]
  14. Wang, Q.; Wang, E.; Chionoso, O.P. Numerical simulation of the synergistic effect of combustion for the hydrochar/coal blends in a blast furnace. Energy 2022, 238, 121722. [Google Scholar] [CrossRef]
  15. Glarborg, P.; Jensen, A.; Johnsson, J.E. Fuel nitrogen conversion in solid fuel fired systems. Prog. Energy Combust. Sci. 2003, 29, 89–113. [Google Scholar] [CrossRef]
  16. Fenimore, C. Formation of NO in premixed hydrocarbon flames. In Proceedings of the 13th Symposium (International) on Combustion, Salt Lake City, UT, USA, 23–29 August 1970; pp. 373–382. [Google Scholar]
  17. Miller, J.A.; Bowman, C.T. Mechanism and modeling of nitrogen chemistry in combustion. Prog. Energy Combust. Sci. 1989, 15, 287–338. [Google Scholar] [CrossRef]
  18. Maroa, S.; Inambao, F. The NOx formation routes. In Biodiesel, Combustion, Performance and Emissions Characteristics; Springer: Berlin/Heidelberg, Germany, 2020; pp. 7–15. [Google Scholar]
  19. Wang, C.a.; Chen, M.; Zhao, P.; Zhou, L.; Hou, Y.; Zhang, J.; Lyu, Q.; Che, D. Investigation on Co-combustion characteristics and NOx emissions of coal and municipal sludge in a tangentially fired boiler. Fuel 2023, 340, 127608. [Google Scholar] [CrossRef]
  20. Wang, C.a.; Wang, C.; Jia, X.; Zhao, L.; Wang, P.; Che, D. NO formation characteristics and fuel-nitrogen transformation mechanism during co-firing of low-volatile carbon-based solid fuels with bituminous coal. Fuel 2021, 291, 120134. [Google Scholar] [CrossRef]
  21. Lin, J. Experimental Study on the Oxy-Fuel Combustion Characteristics of Lignite. Master’s Thesis, Inner Mongolia University of Technology, Hohhot, China, 2010. [Google Scholar]
  22. Ashgriz, N.; Mostaghimi, J. An introduction to computational fluid dynamics. Fluid Flow Handb. 2002, 1, 1–49. [Google Scholar]
  23. Patankar, S. Numerical Heat Transfer and Fluid Flow; CRC press: Boca Raton, FL, USA, 2018. [Google Scholar]
  24. Markatos, N. The mathematical modelling of turbulent flows. Appl. Math. Model. 1986, 10, 190–220. [Google Scholar] [CrossRef]
  25. Launder, B.E.; Spalding, D.B. The numerical computation of turbulent flows. In Numerical Prediction of Flow, Heat Transfer, Turbulence and Combustion; Elsevier: Amsterdam, The Netherlands, 1983; pp. 96–116. [Google Scholar]
  26. Magnussen, B. On the structure of turbulence and a generalized eddy dissipation concept for chemical reaction in turbulent flow. In Proceedings of the 19th Aerospace Sciences Meeting, St. Louis, MO, USA, 12–15 January 1981. [Google Scholar]
  27. Gran, I.R.; Magnussen, B.F. A numerical study of a bluff-body stabilized diffusion flame. Part 2. Influence of combustion modeling and finite-rate chemistry. Combust. Sci. Technol. 1996, 119, 191–217. [Google Scholar] [CrossRef]
  28. Chandrasekhar, S. Radiative Transfer; Courier Corporation: Chelmsford, MA, USA, 2013. [Google Scholar]
  29. Howell, J.R.; Mengüç, M.P.; Daun, K.; Siegel, R. Thermal Radiation Heat Transfer; CRC press: Boca Raton, FL, USA, 2020. [Google Scholar]
  30. Blauvens, J.; Smets, B.; Peters, J. The 16th Symposium (International) on Combustion; The Combustion Institute: Cambridge, MA, USA, 1977; Volume 1055. [Google Scholar]
  31. Baulch, D.L. Evaluated Kinetic Data for High Temperature Reactions; Butterworths: London, UK, 1972. [Google Scholar]
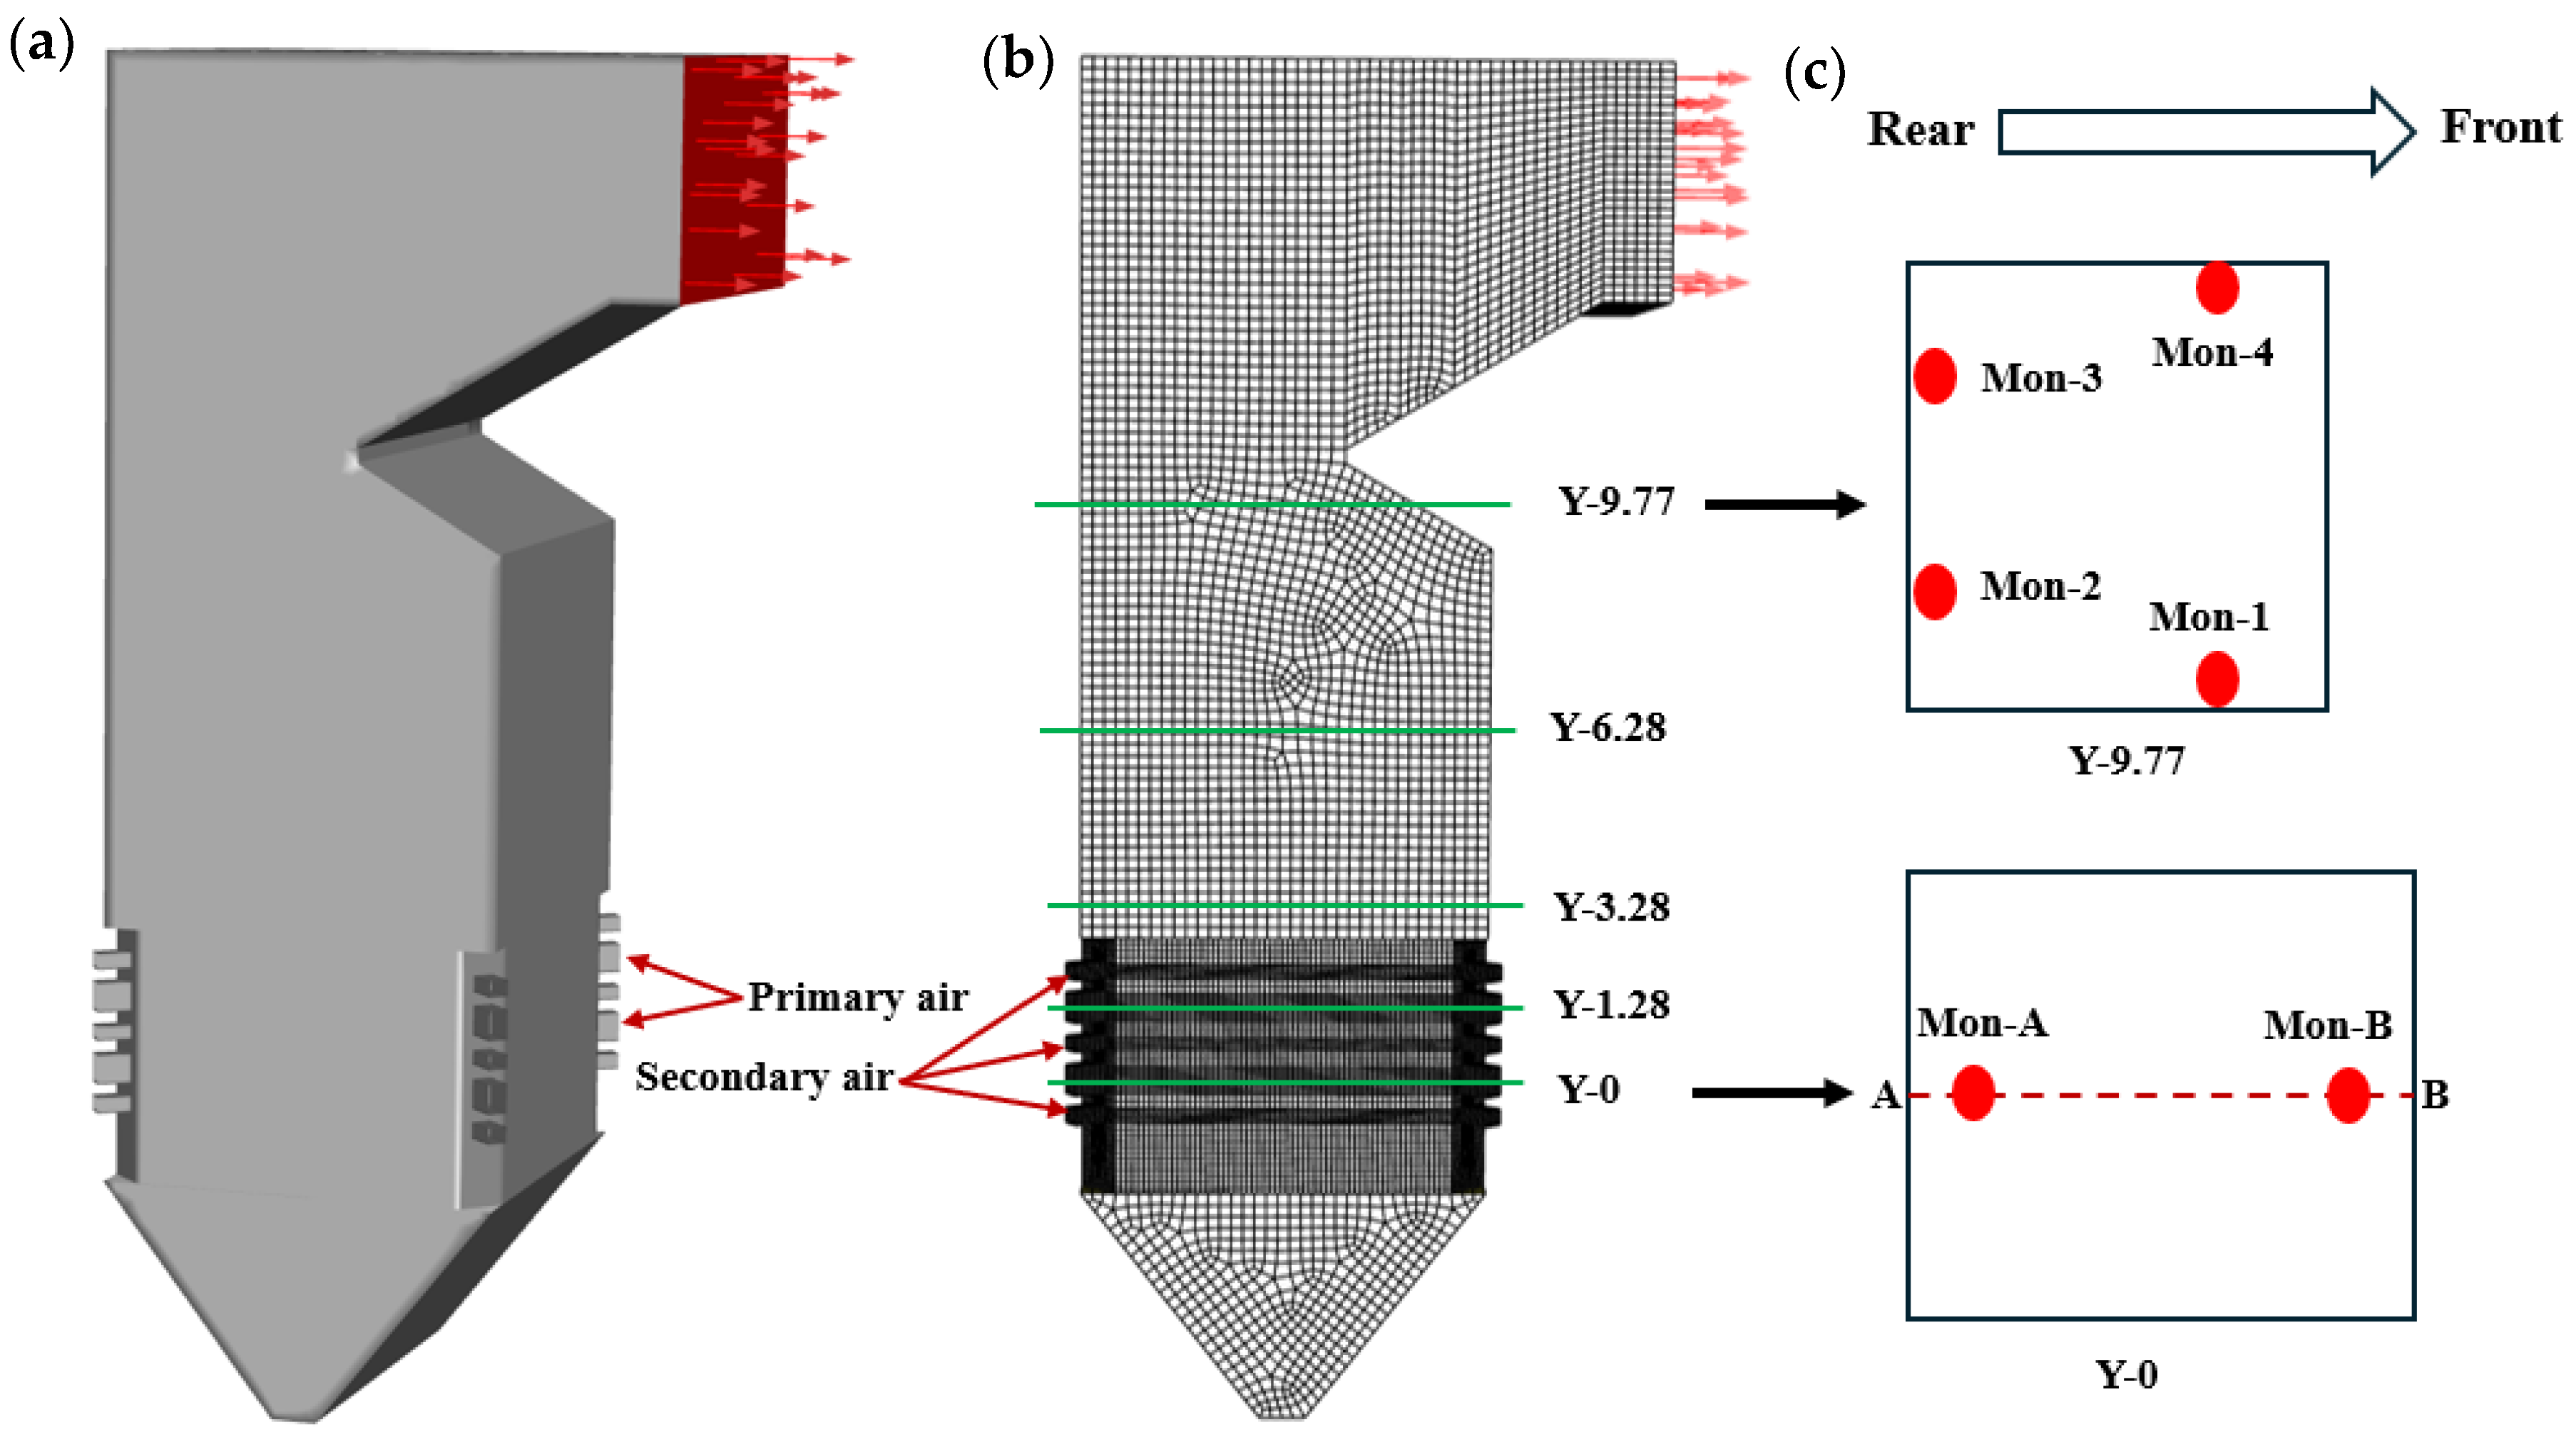
Figure 1. (a) Three-dimensional physical model adopted in the present simulation; (b) meshes of the physical model; (c) The corresponding markers for the monitoring points. Y-0 passes through the center of the lower primary air inlet, while Y-1.28 passes through the center of the upper primary air inlet. Y-3.28, Y-6.28, and Y-9.77 represent cross-sections located 3.28 m, 6.28 m, and 9.77 m above Y-0, respectively. The red dashed line AB passes through the center of the Y-0 cross-section along the flue gas flow direction. The two red dots (Mon-A and Mon-B) in the Y-0 cross-section denote the monitoring points used for mesh-independence testing, positioned 2.5 m from the furnace center. The four red dots (Mon-1, Mon-2, Mon-3, and Mon-4) in the Y-9.77 plane represent the monitoring points used for validation of the numerical simulation, located at the four soot-blower ports.
Processes 13 03187 g001
Figure 2. (a) Trajectories of coal particles, with the colormap indicating their residence time; (b) a vertical cross-section through the furnace center; and (c) horizontal cross-sections of particle concentration, with the colormap indicating mass concentration. Y-0 passes through the center of the lower primary air inlet, while Y-1.28 passes through the center of the upper primary air inlet. Y-3.28 and Y-6.28 denote cross-sections located 3.28 m and 6.28 m above Y-0, respectively.
Processes 13 03187 g002
Figure 3. (a) Air streamlines in the furnace; (b) velocity magnitude distribution on the vertical cross-section; and (c) velocity magnitude distribution on the horizontal cross-section. The black arrows indicate the velocity direction.
Processes 13 03187 g003
Figure 4. Temperature distribution in the (a) three-dimensional region of the furnace, and on the (b) vertical and (c) horizontal cross-sections. The left scale bar shows the temperature distribution range across the entire figure.
Processes 13 03187 g004
Figure 5. Volume fraction distribution of (a) CO, (b) CO2, (c) H2O, and (d) O2 on the vertical cross-sections.
Processes 13 03187 g005
Figure 6. Nitric oxide concentration distribution in the (a) three-dimensional region of the furnace and on the (b) vertical and (c) horizontal cross-sections.
Processes 13 03187 g006
Figure 7. Temperature distribution on the vertical cross-section at blended coal mass fractions of (a) 0, (b) 0.2, (c) 0.33, (d) 0.67, and (e) 0.8.
Processes 13 03187 g007
Figure 8. Temperature distribution along line AB at different coal blending ratios. Line AB is the centerline passing through the center of the Y-1.28 cross-section.
Processes 13 03187 g008
Figure 9. Profiles of the volume fractions of (a) CO, (b) CO2, (c) H2O, and (d) O2 along line AB at different coal blending ratios.
Processes 13 03187 g009
Figure 10. (a) Profile of the NO volume fraction along line AB at different coal blending ratios; (b) NO mass concentration at the furnace outlet under standard conditions for different coal blending ratios.
Processes 13 03187 g010aProcesses 13 03187 g010b
Table 1. The proximate and ultimate analysis of the coal [21].
ComponentUnitOriginal Coal
(Lignite)
Blended Coal
(Bituminous Coal)
C_ar%49.3 52.4
H_ar%2.0 3.7
O_ar%12.7 16.5
N_ar%0.5 0.7
S_ar%0.2 0.4
W_ar%18.2 9.7
A_ar%17.0 16.0
V_daf%33.7 39.4
Q_net,v,arkJ/kg10,460.0 13,397
Table 2. Forward and reverse reaction rate constants.
Forward ConstantsValuesReverse ConstantsValues
k f , 1 1.8 × 10 8 e 38370 / T k r , 1 3.8 × 10 7 e 425 / T
k f , 2 1.8 × 10 4 T e 4680 / T k r , 2 3.81 × 10 3 T e 20820 / T
k f , 3 7.1 × 10 7 e 450 / T k r , 3 1.7 × 10 8 e 24560 / T
Table 3. Monitoring point results for different grid numbers.
Number of Mesh CellsMonitoring Location (Mon-A)Monitoring Location (Mon-B)
Temperature (K)Volume Fraction of O2 Volume
Fraction of NO (ppm)
Temperature
(K)
Volume Fraction of O2 Volume Fraction of NO (ppm)
872,29217920.0031016217710.0418205
1,210,08618490.0032816917530.0435219
1,520,50218560.0032417317610.0434223
Table 4. Comparison between measured and simulated values.
Monitoring
Locations
Measured
Temperature (K)
Simulated
Temperature (K)
Measured Nitric
Oxide Concentration (mg/Nm3)
Simulated Nitric
Oxide Concentration (mg/Nm3)
Mon-113921446340357
Mon-212981332
Mon-312881300
Mon-413491332
Disclaimer/Publisher’s Note: The statements, opinions and data contained in all publications are solely those of the individual author(s) and contributor(s) and not of MDPI and/or the editor(s). MDPI and/or the editor(s) disclaim responsibility for any injury to people or property resulting from any ideas, methods, instructions or products referred to in the content.