Article

Microwave-Assisted Acid Hydrolysis of PA6 Wastes in PA6 Process: Kinetics, Activation Energies, and Monomer Recovery

1
Department of Chemical Engineering and Materials Science, Yuan Ze University, 135 Yuan-Tung Road, Chung-Li, Taoyuan 320315, Taiwan
2
Department of Chemical Engineering, Institut Teknologi Sumatera, Jl. Terusan Ryacudu, Way Huwi, Kec. Jati Agung, Lampung Selatan, Lampung 35365, Indonesia
*
Author to whom correspondence should be addressed.
Processes 2025, 13(10), 3175; https://doi.org/10.3390/pr13103175
Submission received: 22 August 2025 / Revised: 23 September 2025 / Accepted: 30 September 2025 / Published: 6 October 2025
(This article belongs to the Special Issue 1st SUSTENS Meeting: Advances in Sustainable Engineering Systems)

Abstract

Efficient recycling of polyamide 6 (PA6) requires selective depolymerization routes that recover monomers under moderate conditions. This study investigates microwave-assisted acid hydrolysis of four PA6 waste streams, two oligomer-rich residues (WS-13, WS-24), an industrial fiber (C-fiber), and a commercial resin (C-resin) to elucidate degradation kinetics, activation energies, and product yields. Thermogravimetric analysis revealed multi-step solid-state decomposition, while microwave hydrolysis (125–200 °C, 15–60 min, 400 W) demonstrated strong dependence on acid type. HCl achieved complete conversion, whereas phosphoric and formic acids exceeded 95%. Kinetic analysis under H3PO4 followed pseudo-first-order behavior, with rate constants (0.015–0.141 min−1 at 200 °C) and activation energies reflecting feedstock structure: 53.1 kJ mol−1 (WS-13), 56.5 kJ mol−1 (WS-24), 87.1 kJ mol−1 (C-resin), and 99.9 kJ mol−1 (C-fiber). Monomer yields varied by substrate: WS-13 achieved 62.4% at 200 °C and 45 min (ACA 46%, CPL 16%), WS-24 yielded 62.0% (primarily ACA), C-fiber reached 69.7% (ACA-dominant), and C-resin produced 53.8%. These results show that oligomer-rich wastes are kinetically favored for rapid hydrolysis at lower energy cost, while C-fiber maximizes aminocaproic acid recovery. Overall, microwave-assisted hydrolysis provides a selective, energy-efficient pathway for PA6 circularity, offering design parameters for reactor operation and process optimization.

1. Introduction

The global nylon market was valued at USD 31.09 billion in 2023 and is expected to reach USD 48.86 billion by 2032, representing a compound annual growth rate of 5.1%. In 2023, the Asia Pacific region accounted for 61.2% of the total market share. The U.S. nylon market is anticipated to achieve a value of USD 4.84 billion by 2032, primarily driven by increasing demand for activewear and performance apparel [1].
Among various types of nylon, polyamide 6 (PA6 or nylon 6) stands out due to its widespread industrial applications and significant production volume. Two main ways of producing PA6 are described in the literature [2]: The polycondensation of hydroxycarboxylic acid, specifically aminocaproic acid (ACA), and the ring-opening polymerization (ROP) of ε-caprolactam (CPL) are two methods for producing PA6. Polycondensation, a type of step-growth polymerization, forms a polymer by joining two monomer units while releasing a small molecule, typically water, as a by-product (Figure 1). This water release eliminates the need for a catalyst. Though often described briefly, PA6 synthesis via ACA involves reacting under a vacuum to shift the equilibrium toward polymer formation.
However, despite its global demand, the manufacturing process of PA6 still faces technical challenges that affect production efficiency and material recovery [3,4]. Consequently, it is essential to establish efficient and long-term recycling for PA6. Most of today’s plastic recycling technologies depend on mechanical recycling, which involves mechanical processing to convert one type of plastic to another, such as converting plastic bottles into fibers. Mechanical recycling produces low-quality plastic and can only be done a limited number of times. However, when the waste material contains impurities, mechanical recycling often becomes unsuitable, as it leads to uncontrollable product quality. Therefore, finding more selective and stable recycling methods has become a key goal for the industry. Distinct from mechanical recycling, chemical recycling involves the depolymerization of plastic to produce the monomer raw material from which the same virgin plastic can be made [5]. Pyrolysis is the most commonly documented thermochemical recycling technique for PA6; all involve harsh reaction conditions (temperatures between 250 °C and 300 °C) and do not provide effective regeneration of PA6 from damaged polymers [6].
For this reason, chemical recycling is the only way of recycling that closes the loop on plastic manufacture and is also a sustainable model of recycling. Additionally, chemical recycling can help reduce marine and land pollution, promoting the circular economy principle [7,8]. Hydrolysis is a type of chemical recycling that converts waste into new building blocks, such as monomers, oligomers, and functional chemicals, to produce new polymers. The material’s value can be maintained or even increased in some cases.
Several previous investigations have been conducted into the hydrolysis of PA6 using different solvents to produce CPL [9]. The chemical structure of CPL is shown in Figure 1. They investigated the effects of reaction time and type of solvent, including hydrochloric acid, phosphoric acid, and formic acid, on the acidic degradation of PA6 [10]. They found that acid hydrolysis produces monomers such as ACA. The degradation of PA6 using phosphoric acid in different concentrations and reaction times using the microwave method. In various media, the yield of CPL exceeded 55 wt% of the PA6 when it was stirred at 400 °C [11]. In recent years, microwave heating has been considered a promising technique for providing the required energy degradation of polymers due to its volumetric and selective heating nature, which enables rapid heating in cold environments. This result helps preserve product quality by limiting secondary reactions. It can also help to reduce energy consumption [12].
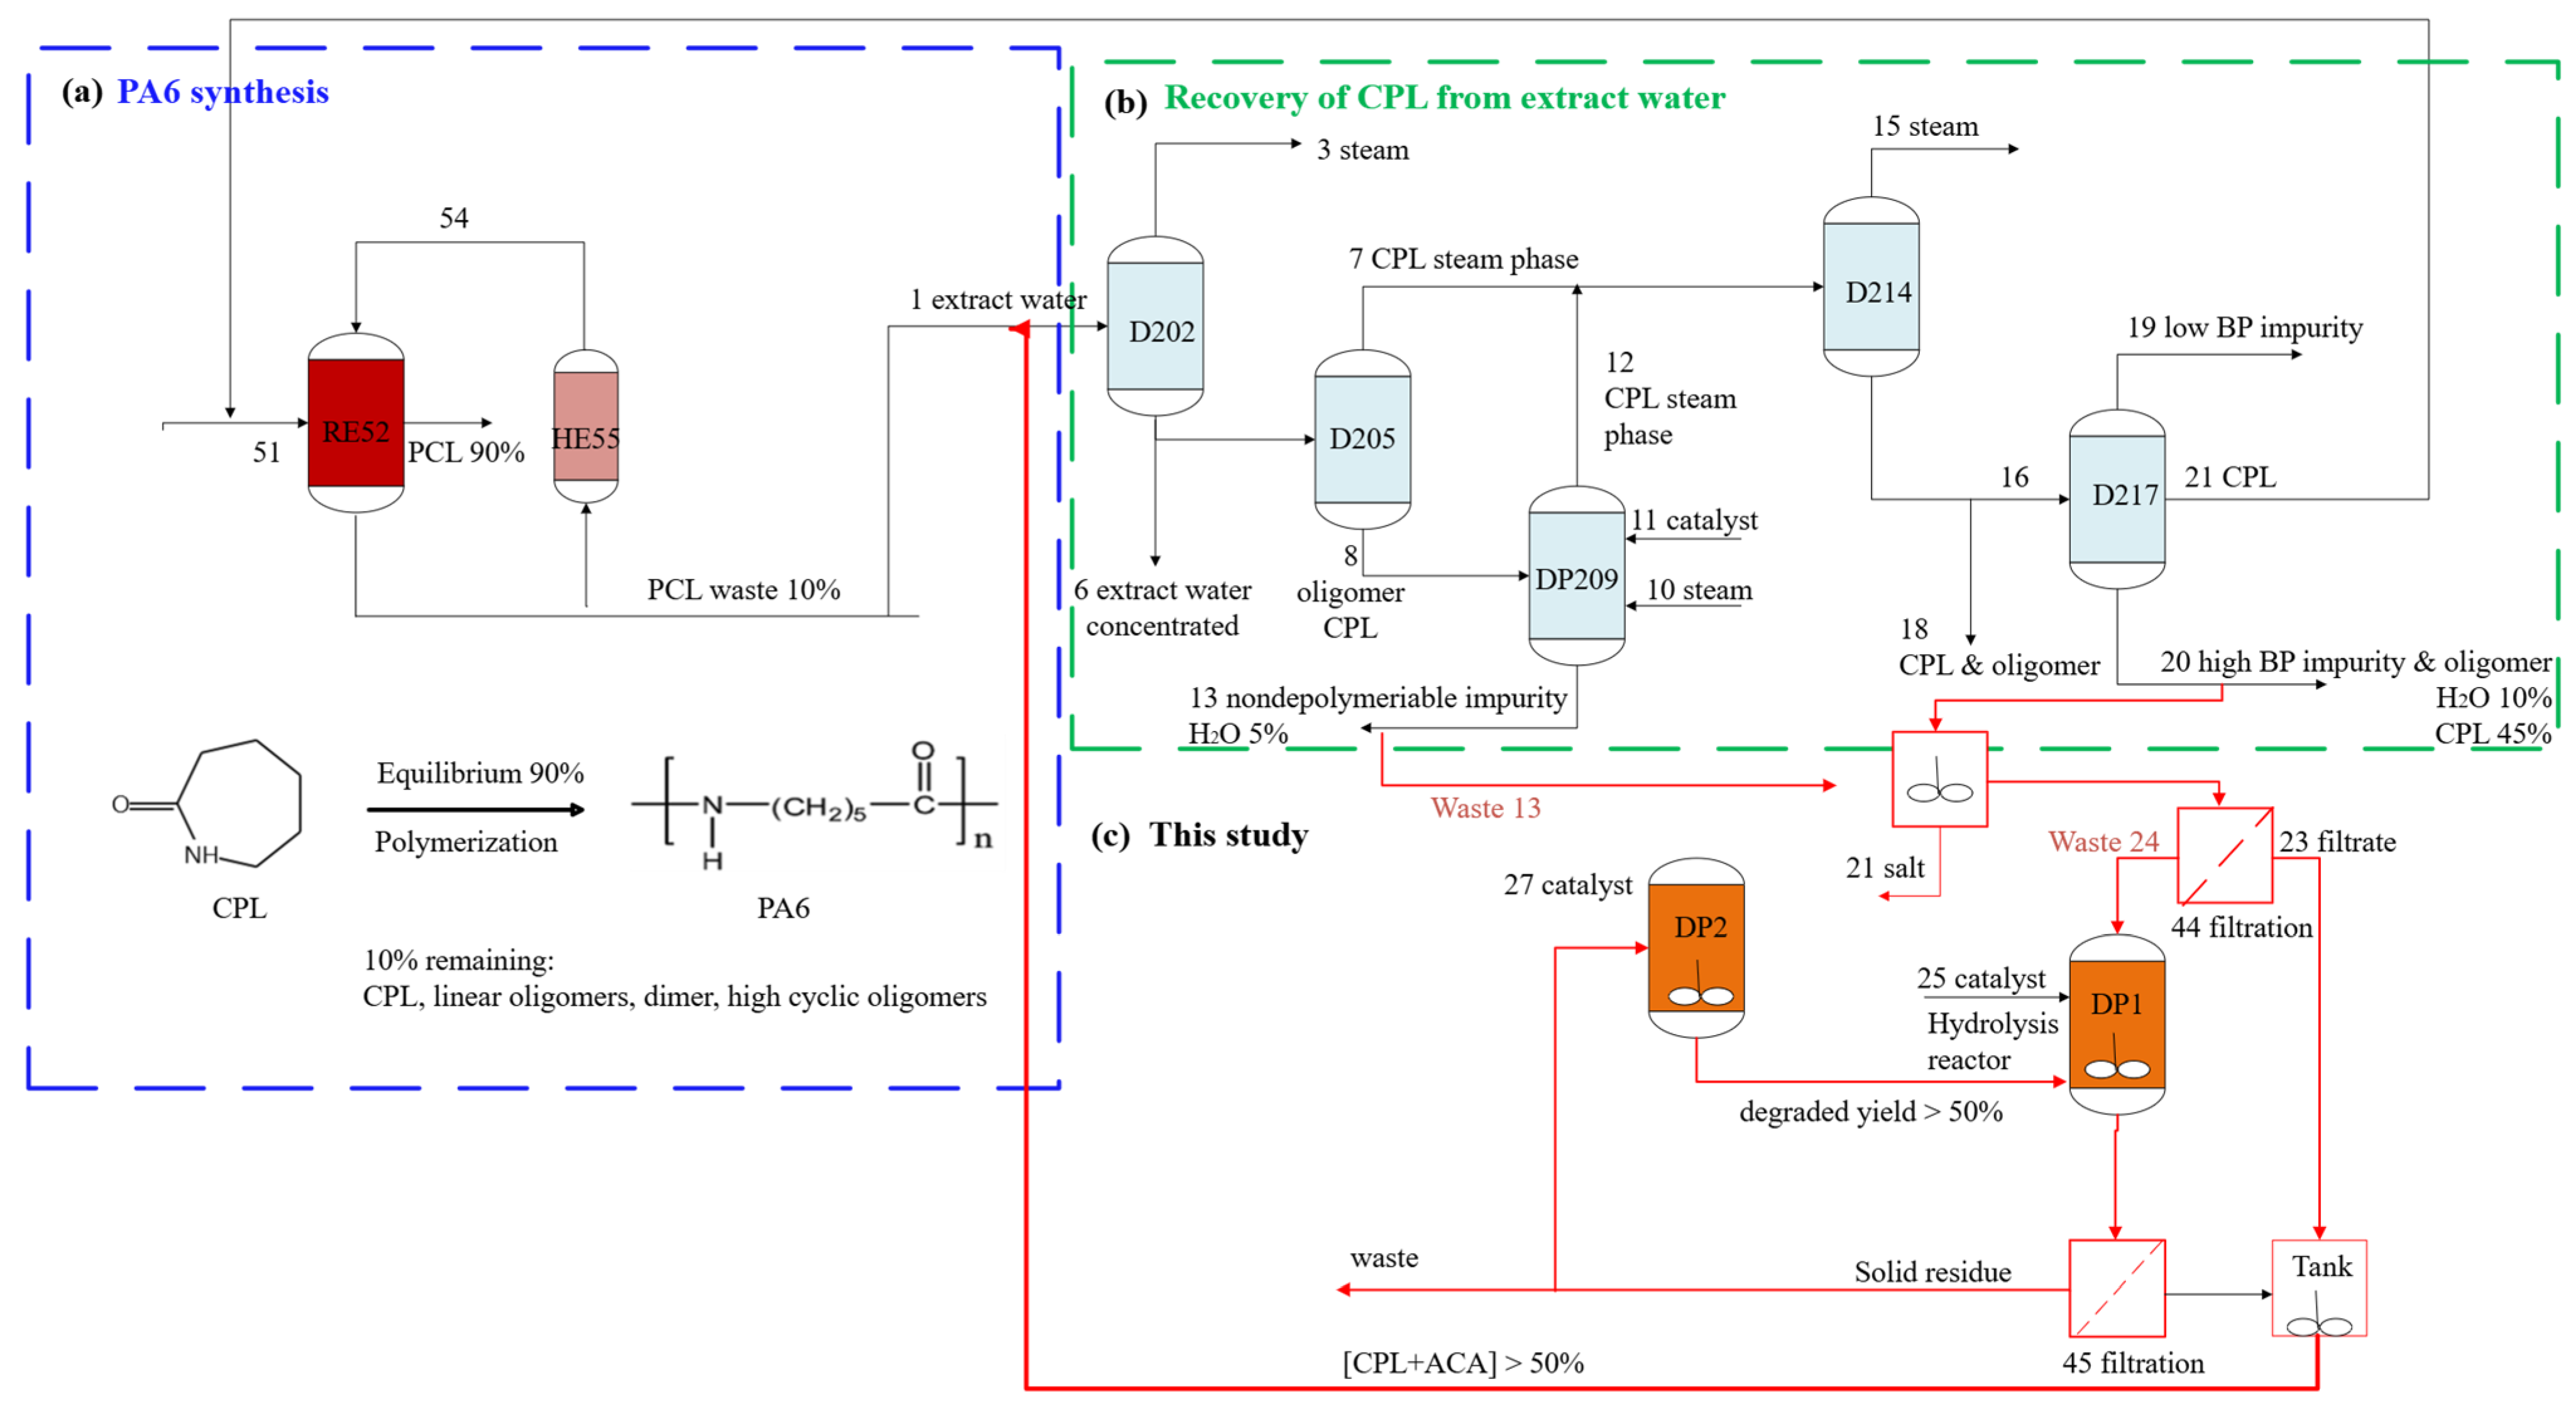
During the manufacture of PA6, the polymerization of CPL to PA6 proceeds until it reaches a reaction equilibrium, where approximately 10% of the reaction remains as a monomer, either CPL or a CPL oligomer, as shown in Figure 2a. This non-polymerized fraction must be removed because it could interfere with further processing into final products, such as yarns, films, or engineering plastics [13]. A block diagram of the CPL re-extraction process is shown in Figure 2b. A distillation unit (D-202) separates the extracted water (1), which is produced during PA6 extraction, as illustrated in Figure 2a. This distillation can be carried out in one or several steps. The extracted water from stream (1) is separated from the water in stream (3) and can be reused after recirculation through the extraction process. The concentrated extract water (4) is obtained as the bottom product and sent to another distillation step (D-205). This distillation separates the concentrated extracted water into a gaseous CPL-steam phase (7) and a liquid oligomer-CPL phase (8). The CPL is then stripped from the oligomer-CPL phase using steam and directed to a subsequent distillation (14), as shown in stream (12). Oligomer-CPL portions that cannot be depolymerized in process (9) are discharged as bottom product (13) (WS-13, the waste sample used in this study) and discarded. Low-boiling contaminants are removed as the top product (19) in the first stage(s), while high-boiling impurities are removed as the bottom product (20) in the final stage. The fully purified CPL product is recovered as the top product (21). The solid waste forms a cake on stream (24) (WS-24, the waste sample used in this study). Both WS-24 and WS-13 residues, approximately 10%, are used as feed for the reactor and are hydrolyzed with an acid. The depolymerized material is filtered and pumped back into the CPL recovery process (Figure 2c).
The primary objective of this study is to elucidate the degradation mechanisms of PA6 waste through microwave-assisted hydrolysis, with a focus on structure–reactivity relationships and kinetic modeling, rather than scale-up or process integration. This research investigates the kinetics involved in the microwave-assisted degradation of PA6 waste and examines the distribution of the resulting liquid product. To improve the process, reaction conditions, including different acids, temperature, and reaction time, were tested under both thermal and microwave heating. The aim is to reduce the temperature and measure the yield of ACA and CPL via acid-catalytic hydrolysis at temperatures below 200 °C. The second goal is to investigate the kinetics of thermal degradation and hydrolytic methods for various types of PA6 under acidic conditions.

2. Materials and Methods

2.1. Materials

ε–Caprolactam was purchased from Across Organic (≥99% purity, Geel, Belgium), aminocaproic acid from Alfa Aesar (≥98% purity, Melbourne, VIC, Australia), and phosphoric acid from Fisher Scientific (85 wt%, Loughborough, UK). They are chemical grade and were used as received without further purification. The raw materials used in the degradation experiments included solid waste of PA6, WS-24, WS-13, C-fiber, and C-resin. WS-24 and WS-13 are produced through distillation and polymerization in the PA6 industry by Li Peng Enterprise Co., Ltd. in Taiwan (Figure 3). They contain impurities such as substances with low and high boiling points, as well as non-depolymerizable impurities. The C-fiber consists of industrial scraps, and C-resin is a virgin resin derived from commercial products, serving as the standard for PA6. Both were sourced from Li Peng Enterprise Co., Ltd. in Taipei City, Taiwan. All solvents used in HPLC analysis (HPLC-grade acetonitrile and water) were purchased from J.T. Baker (Phillipsburg, NJ, USA).

2.2. Determination of PA6 Viscosity [14]

Weigh a sample of 0.150 ± 0.001 g accurately in a 50 mL triangular frosted bottle, then add 50 mL of 96% H2SO4 to the bottle with the cap on. Place the sample in a shaker to dissolve it at 55 °C. For medium-viscosity PA6 granules, shaking takes approximately 1 to 1.5 h; for high-viscosity PA6 granules, 2 to 2.5 h. Make sure the sample particles are completely dissolved; if not, continue shaking until the mixture is fully dissolved. Transfer the dissolved sample into an Ostwald U-tube viscometer (Series PMT 150, PM Tamson Instrument, Rotterdam, The Netherlands) and keep it in a constant-temperature water bath for 15–20 min. Repeat the measurement twice, ensuring the error does not exceed 0.4 s each time.
The calculation equation of relative viscosity (RV) is given:
ɳ rel   = flow   time   for   solution   ( t 1 ) flow   time   for   solvent   ( t 0 )
where t1 is the average flow time of the sample (s), and t0 is the average flow time of the solvent (s). Calculate to 3 decimal places and round to the fourth digit. Each sample must be tested twice to determine the average value. If the measured ηrel difference exceeds 0.02, repeat the process.

2.3. Characterization of Feed Using Analytical Techniques

2.3.1. Functional Group of Feedstock Using FTIR [15]

To analyze the relative abundance of functional groups, samples were analyzed using an FTIR spectrometer (Spectrum 100, PerkinElmer Inc., Waltham, MA, USA). 1 mg of each sample was ground in a mortar with 300 mg of potassium bromide (KBr–FTIR grade). The mixture was then pressed into a pellet and placed inside the instrument chamber. Each sample was scanned 8 times over the range of 650 cm−1 to 4000 cm−1 (resolution of 4 cm−1). The FTIR spectrum was automatically baseline-corrected and normalized using PerkinElmer SpectrumTM 2 software, USA.

2.3.2. Thermal Behavior Using Differential Scanning Calorimetry (DSC)

Using a DSC instrument (TA Instruments Q2000, New Castle, DE, USA), approximately 5–10 mg of PA6 samples were placed on a platinum plate and heated in a nitrogen environment at 30 °C for 3 min to stabilize. Then, the sample was heated from 30 °C to 300 °C at a rate of 10 °C/min under a nitrogen atmosphere at a flow rate of 20 mL/min.

2.3.3. Thermal Behavior Using Thermogravimetric Analysis (TGA) [16]

Using a TGA instrument (TA Q50, New Castle, DE, USA), approximately 10 mg of PA6 waste was placed on a platinum plate and heated in a nitrogen environment with a flow rate of 60 mL/min at 30 °C for 3 min to stabilize. The sample was heated from 30 to 100 °C at a rate of 10 °C/min under a nitrogen flow of 60 mL/min and held at this temperature for 10 min to ensure the removal of moisture content. Then, the sample was heated from 100 °C to 700 °C at varied heating rates of 2, 5, 10, or 20 °C/min under a nitrogen atmosphere at a flow rate of 40 mL/min. To analyze fixed carbon and ash in a special case, we changed the gas carrier from nitrogen to air at 700 °C with a ramping rate of 5 °C/min. The fixed carbon content was calculated from the mass loss between 700 and 900 °C in an air atmosphere, with the final residue at 900 °C representing the ash content. Residue weight was considered ash.

2.3.4. Molecular Weight Analysis Using the End Titration Method

End-group analysis [17] was conducted using 1 g of the precipitate dissolved in 25 mL of a phenol/methanol mixture (70/30 w/w), refluxed for 30 min. The solution was then cooled and titrated with 0.02 N HCl, using thymol blue as the indicator. A blank was also prepared.
[ amino   end   group ]   ( μ equiv / g ) = ( A     B ) × Normality   of   HCl   × 1000 weight   of   the   sample
where A is the volume of 0.02 N HCl required for the titration with the sample, and B is the volume needed in the blank. Mn calculates with the following relationship:
M n =   10 6 ×   n End   groups   ( μ equiv g )  
where n is 1 or 2 according to whether the measured end groups are at one or both ends of the polymer molecule [17].

2.3.5. Morphology of Solid Products Determined Using Scanning Electron Microscope

SEM (JEOL JSM-5600, Tokyo, Japan) was used to analyze the material’s microscopic structure before and after hydrolysis in acidic conditions. The X-ray diffraction pattern was acquired on a D2 diffractometer, scanning 2θ from 10° to 90°, with operating conditions set at 40 kV and 40 mA using 0.1 g of the catalyst.

2.4. Determination of Product Using High-Performance Liquid Chromatography (HPLC)

The liquid products could be determined using an HPLC (Shimadzu LC-20AT, Kyoto, Japan) equipped with a UV detector (210 nm), temperature (40 °C), ratio of mobile phase acetonitrile: water (85:15), and 0.1 v/v of acetic acid, flow rate (0.4 mL/min), with a sample size injection of 50 µL. The analytical HPLC column was a LiChrospher® 100 RP-18 column (5 μm, 4 mm (internal diameter) × 250 mm).

2.5. Hydrolysis of PA6 Using Microwave Irradiation

The microwave experiment was conducted with 10 g of sample suspended in 10 mL of acid (acid-to-solid ratio = 1 mL/g) and 10 mL of distilled water in a 100 mL sealed high-pressure vessel using the Milestone-FlexiWave instrument (Milestone, Sorisole, Bergamo, Italy). The microwave reactor power was set to 400 watts, and then the digestion vessel was placed in the reactor and heated. The reaction temperature was controlled within the range of 125–200 °C, depending on the experimental conditions, consistent with the kinetic studies. Autogenous pressure was not measured during operation. The typical heating process involves two stages: first, a heating stage where the temperature rises from 0 to 200 °C in approximately 10 min, followed by a holding stage at 200 °C for the necessary duration. After the reaction, the digestion tube was cooled to room temperature by air. The solution was neutralized with NaOH (5 M) and diluted with water to reach a total weight of 200 g. After dilution, the mixture was filtered using Advantech No.4 filter paper (Advantec Co., Ltd. in Tokyo, Japan) to separate the solid and liquid phases. The raw product was analyzed using HPLC. The solid residue (unreacted reactant) was weighed after drying in an oven and used to calculate the conversion of degradation waste PA6. The number of replicates was more than three, and the standard deviation was within 5%.

3. Results and Discussion

PA6-based waste generates environmental issues, including microplastic pollution in water resulting from fishing nets and synthetic textile fibers released during washing [18]. This study primarily examines two types of PA6 waste, WS-13 and WS-24, as illustrated in Figure 3. Since WS-13 and WS-24 are waste materials rather than pure substances, their composition and structure can vary significantly. Consequently, multiple analytical techniques were employed to thoroughly characterize these wastes and understand their physical and chemical properties.

3.1. Characterization of Feedstock

3.1.1. FTIR Analysis of Raw Materials

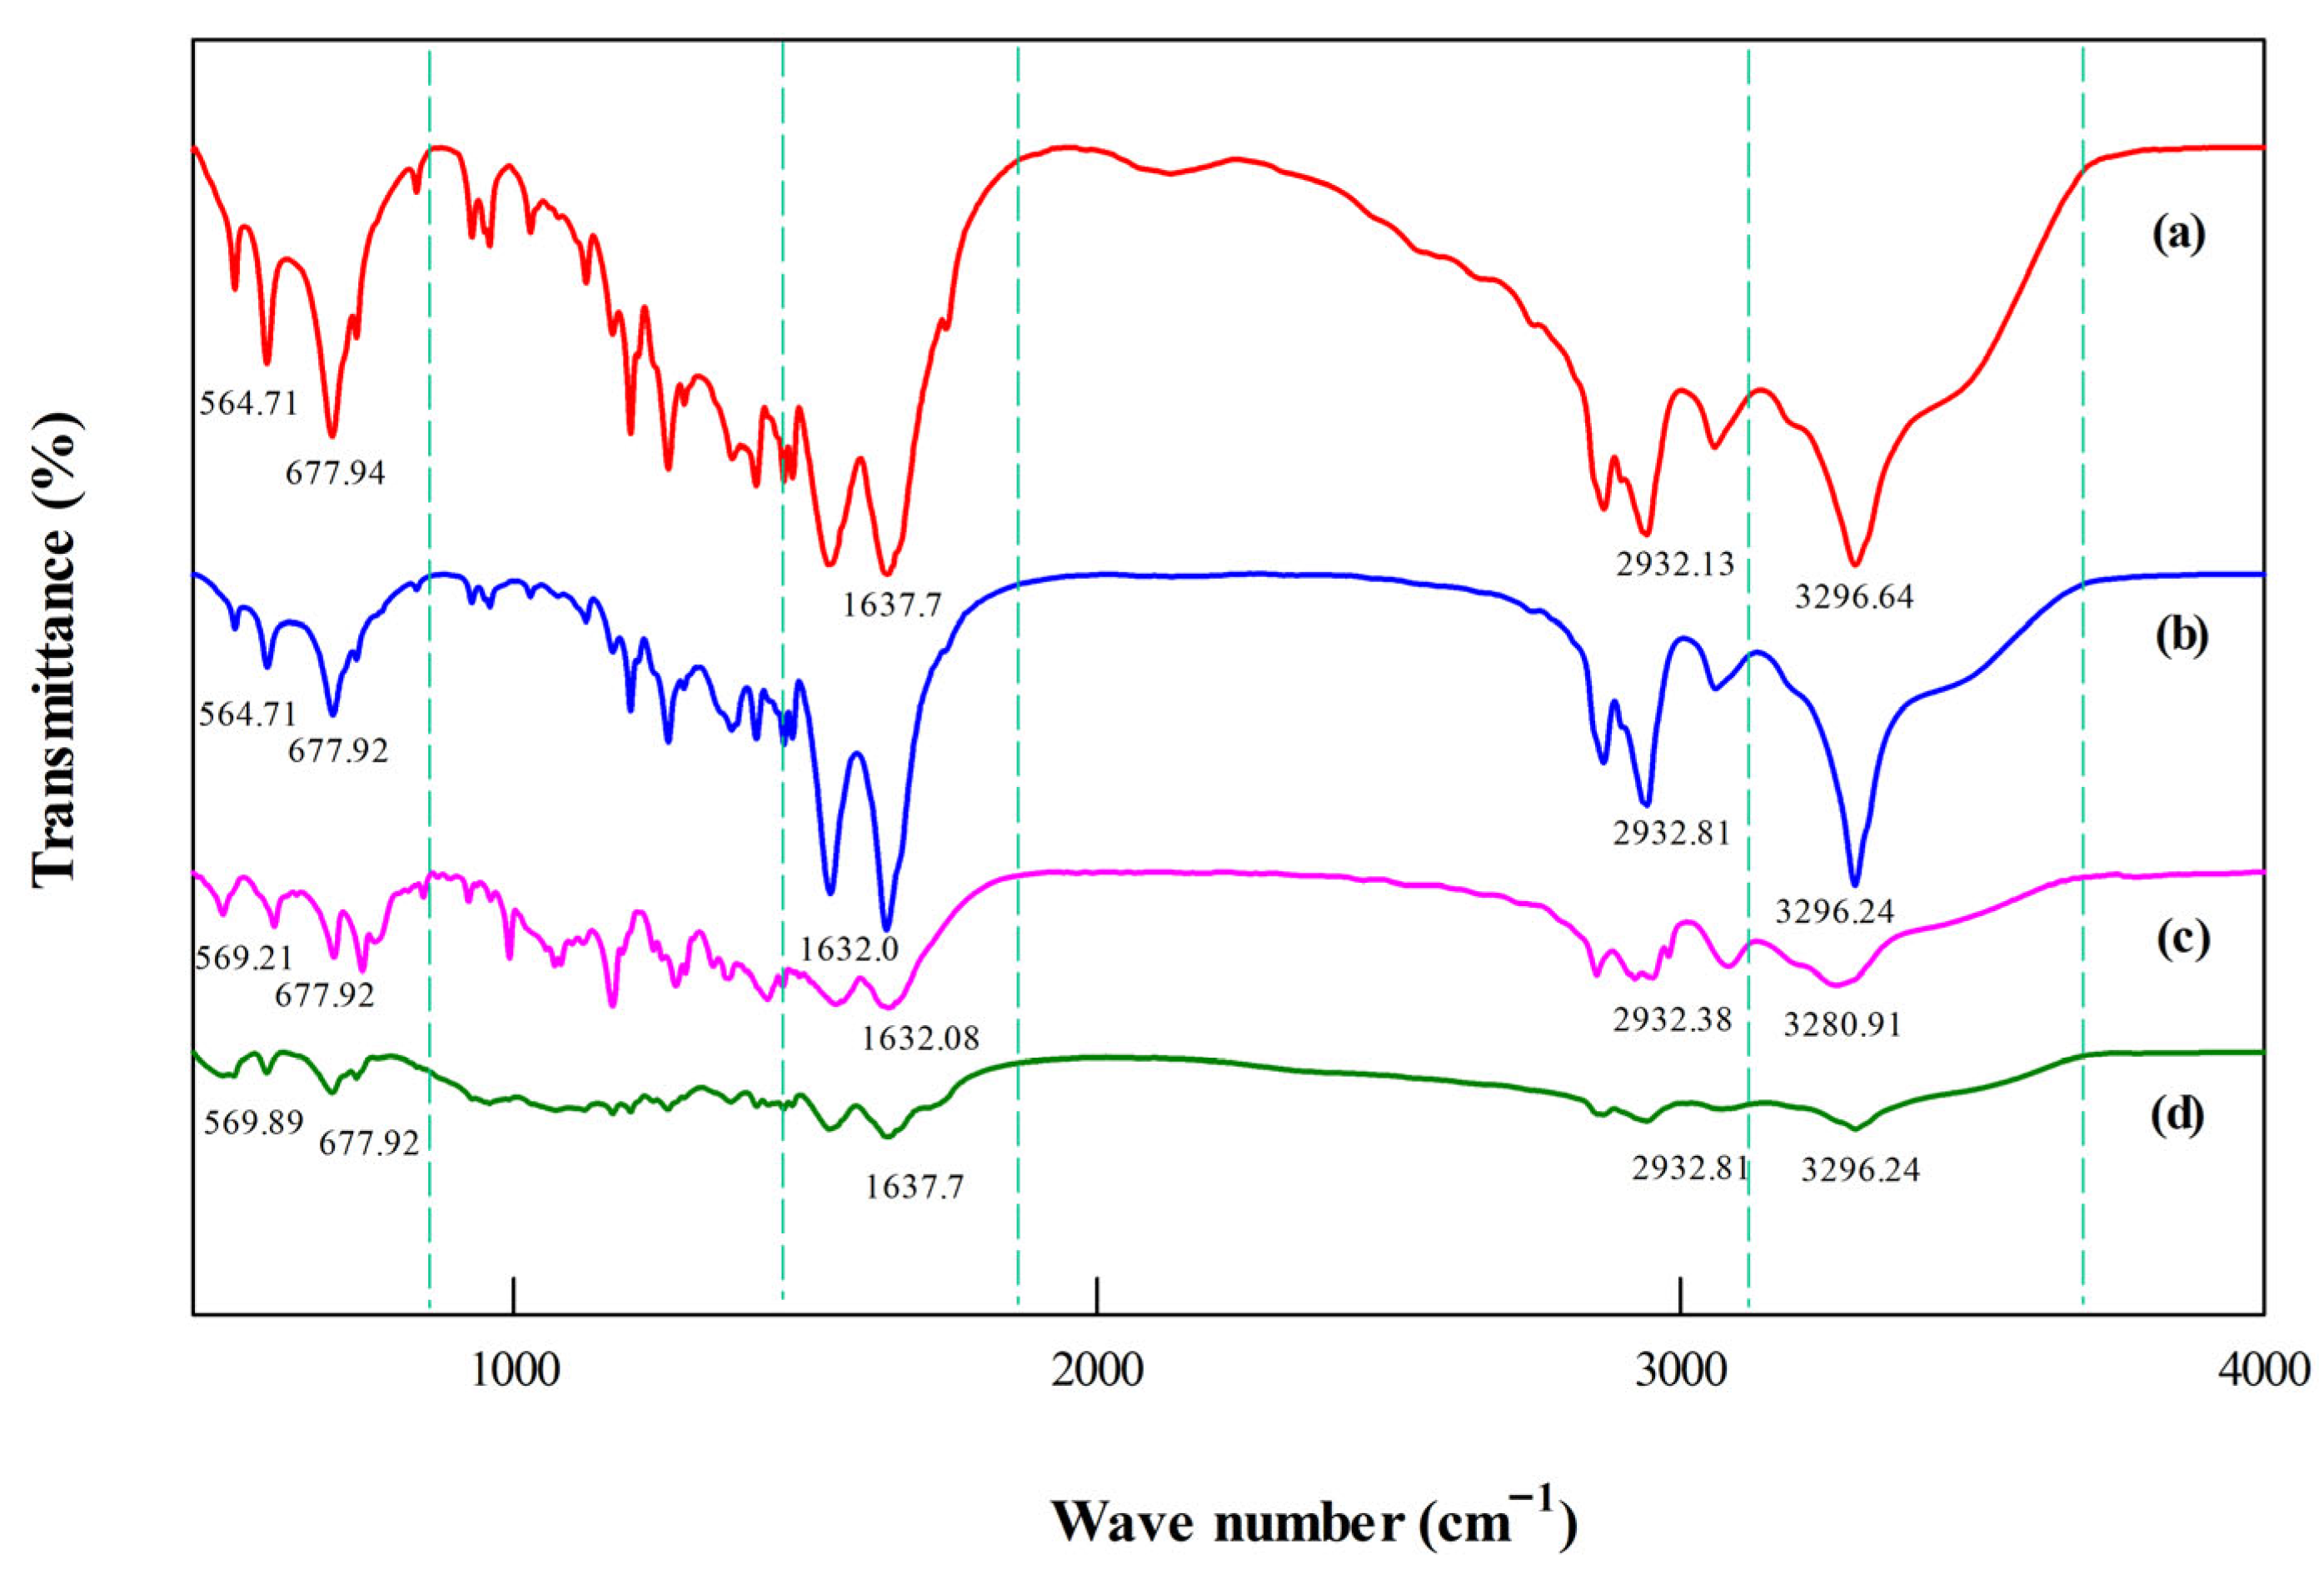
FTIR analysis, performed before the start of hydrolysis, can be used to investigate changes in the structure of PA6 from different sources, as shown in Figure 4. The spectra for C-fiber and C-resin peaks show stronger intensities than those for WS-13 and WS-24. The FTIR spectra exhibited five spectral regions of particular interest. These were the C–C skeletal modes, the carbonyl groups (C=O), and the C–H, N–H, and C–N–C stretches. IR spectra from 450 to 1300 cm−1 show the vibrations of groups with unsaturated bonds, such as vinyl (–C–CH2 and –C–CH–), cis, and trans (–CH–CH) [19]. The absorption band at 564 cm−1 belongs to skeletal deformations of crystalline α-phase [20]. The band at 677 cm−1 was previously assigned to Amid V in the crystalline and β phases, which reported a higher concentration of unsaturated R1–CH–CH–R2 bond types at 675 cm−1. The band at 930 cm−1 corresponds to C-CO stretching in the crystalline phases α and β, and the band at 1124 cm−1 corresponds to the amorphous phase. From Figure 4, the most substantial peak in this region is the C-fiber (red line); the weakest are WS-24 and WS-13.
According to the deformation of the crystalline, the band at 1205 cm−1 was assigned to wagging CH2 vibrations in the crystalline α-phase. Pockett observed this peak at 1201 cm−1 [21], while the characteristic peak of aminocaproic acid formed from the wave number 1731 cm−1 due to the functional group C=O stretching vibration of –COOH and 1580 cm−1 corresponding to deformation vibration of NH3+ appears. Additionally, the band for the stretching vibration of the amino groups transmitting band (N–H) was observed at 3302.47 cm−1, while the C–H stretching bands from methylene segments were observed at 2932.81 and 2867.00 cm−1.

3.1.2. TGA and DTG Analysis of Feedstock

Figure 5 shows the TGA and DTG analyses of the PA6 feedstocks, illustrating both the weight loss profiles and the degradation rates as a function of temperature. The TGA curve indicates the start of thermal degradation for each sample, while the DTG curve highlights the temperature at which the maximum rate of mass loss occurs. Among the tested materials, WS-24 (green line) peaks at 257 °C, suggesting a shorter polymer chain and lower thermal stability compared to the other samples. In contrast, C-fibers’ main degradation occurs at a higher temperature, emphasizing their stronger molecular structure and increased resistance to thermal decomposition.
Table 1 provides a comprehensive overview of the key properties for each PA6 feedstock, including molecular weight (Mw), relative viscosity (RV), moisture content, and results from TGA and DSC analyses. C-fiber, characterized by a fixed carbon content of approximately 0.52 and the highest relative viscosity (RV ≈ 2.47), stands out for its superior thermal and mechanical properties. WS-24, with its lower degradation temperature and presumably lower molecular weight and RV, suggests a shorter polymer chain and greater susceptibility to thermal breakdown. The moisture content of each material also varies, influencing both its thermal behavior and potential suitability for chemical recycling.
The PA6 materials analyzed (C-fiber, C-resin, WS-13, and WS-24) show clear differences in their structural and physical properties. C-fiber has the highest thermal stability and relative viscosity, indicating longer polymer chains and better resistance to degradation. WS-24, on the other hand, displays the lowest degradation temperature and probably the shortest polymer chains, making it less stable under heat. WS-13 and C-resin fall in between, with their properties reflecting varying levels of purity and chain length. These differences are crucial for determining the suitability of each material for recycling and processing. C-fiber’s strength makes it ideal for applications that require more stability, while WS-24 might need special methods to enhance its reuse. Recognizing these differences helps develop targeted approaches for the sustainable recovery and recycling of PA6 waste streams.
Measuring the relative viscosity of PA6 samples is essential because it directly reflects the average chain length and molecular weight of the polymer. A reduction in viscosity indicates chain scission during degradation, providing a simple yet powerful tool to monitor the extent of hydrolysis. Since viscosity strongly influences the strength of polymer melts, their mechanical properties, and recyclability, its determination enables a comparison between different feedstocks (WS-13, WS-24, C-fiber, and C-resin) and an evaluation of their suitability for further processing. The observed variations in relative viscosity among the feedstocks further confirm that chain scission during hydrolysis reduces molecular weight, which correlates with lower crystallinity and enhanced susceptibility to degradation.

3.1.3. Thermal Property of PA6 Feedstocks Using Differential Scanning Calorimetry (DSC)

Figure 6 and Table 2 collectively present the detailed thermal properties of various PA6 feedstocks, including commercial resin (C-resin), waste samples (WS-24 and WS-13), and an additional C-fiber reference. DSC was employed to characterize these materials, focusing on transitions such as melting temperature (Tm), crystallization temperature (Tc), and the associated enthalpy changes (ΔHm for melting and ΔHc for crystallization).
Figure 6 shows the typical deformation peaks for all samples within the 127–235 °C range, representing the main phase transitions in PA6. Notably, samples containing CPL-oligomers (WS-24 and WS-13) display smaller endothermic peaks at lower temperatures—around 127 °C and 192.5 °C. These sub-Tm transitions, seen only in oligomer-containing samples, indicate the presence of additional lower-melting components or less organized crystalline regions, a phenomenon supported by Khanna [22]. This observation means that waste samples with oligomers exhibit more complex thermal behavior compared to the commercial resin.
Table 2 details the key thermal parameters: Tm (the main melting point), Tc (the crystallization temperature upon cooling), ΔHm (enthalpy of melting, indicating crystalline content), and ΔHc (enthalpy of crystallization, related to the reformation of crystalline regions as the polymer cools). Analyzing these values helps clarify the structural differences between commercial and waste PA6.
The Tm is closely related to the crystalline structure and molecular regularity; higher Tm values generally reflect more perfect or stable crystals. A decreased Tm in the waste samples could indicate either the presence of defective crystals or shorter polymer chains, both potential consequences of degradation. Tc provides insight into how readily the polymer chains can reorganize into crystals during cooling. Lower Tc values in waste samples suggest a diminished ability to crystallize, likely due to chain scission or the presence of impurities.
ΔHm and ΔHc are indicators of crystallinity levels. Lower ΔHm in waste samples suggests less crystalline material, which often results in weaker mechanical strength or altered physical properties. Conversely, higher crystallinity, seen in intact commercial samples, enhances strength because of stronger intermolecular bonds within the crystalline structure. Additionally, highly crystalline areas are more resistant to breakdown, while amorphous regions are more prone to degradation and tend to break down first. This explains why less crystalline samples are easier to degrade into low-molecular-weight fragments.
Additionally, the higher crystallinity of the material makes it more difficult to degrade in the same state [23].

3.1.4. Thermal Degradation Kinetics Using TGA

TGA is often used to analyze the thermal breakdown of waste materials and study pyrolysis kinetics. Several models, such as the Kissinger, Flynn-Wall-Ozawa, and Kissinger-Akihira-Sunose isoconventional models, have been used to determine the energy and reaction mechanisms of pyrolysis. These models facilitate an understanding of the basic decomposition behavior of various PA6 feedstocks, which is crucial for designing effective biomass conversion processes.
The activation energy (Ea) and pre-exponential factors of feedstock pyrolysis were determined using three kinetic models: the Kissinger method, the Flynn-Wall-Ozawa (FWO) method, and the Kissinger-Akahira-Sunose (KAS) method [24].
  • Kissinger method
This method evaluates the kinetics without calculating the activation energy in every conversion value [25]. The equation is based on:
ln ( β T m 2 )   =   ln ( AR E a )     E a RT m
where A and Ea are the frequency factor and activation energy, respectively. The activation energy is obtained by plotting ln( β T m 2 ) against 1000/Tm at different heating rates (β), and Tm is the maximum temperature of the DTG curve peak. The activation energy results from the slope of the plot, which is equal to −Ea/R.
2.
Flynn-Wall-Ozawa method (FWO)
This method enables the calculation of the activation energy and the pre-exponential factor without requiring information about the reaction mechanism, which can only be achieved for one-step reaction calculations [26,27].
ln ( β i ) =   ln ( A α R Rg ( α ) ) 5.331 1.052 E α RT α i
where g(α) is constant at a given conversion value. The activation energy is calculated by plotting ln βi against 1000/Tαi, where βi and α represent heating value and conversion, respectively. The activation energy is derived from the slope of the plot, which is equal to −1.052 Eα/R. α is defined as the conversion based on the weight loss of decomposed biomass.
α   = m i m a m i m f
where mi is the initial mass, ma is the actual mass, and mf is the mass after pyrolysis of the sample.
3.
Kissinger-Akihira-Sunose (KAS)
The KAS method [16,28] is a versatile “model-free” integral-based unconventional approach. The KAS method is derived at a constant fractional conversion (α), and the rate of decomposition is given by Equation (7)
d α dt = k ( T ) f ( α )
which t, k(T), and f(α) represent the time, the rate constant, and the reaction model, respectively.
For non-isothermal TGA experiments at a linear heating rate, Equation (6) is given
d α f ( α ) = A β exp ( E a RT ) dT
Equation (6) will be integrated and is based on the approximation of the Coats-Redfern method [29]. This KAS method is based on the equation:
ln ( β i T 2 α i )   =   ln ( A α R E α g ( α ) )     E α RT α i
The activation energy can be obtained by plotting ln β i T 2 α i against 1000/Tαi. The activation energy is calculated from the slope of the plot, which equals −Ea/R.
Ea is calculated for each conversion α in the range of 0.05 to 0.7, determined using techniques to adjust the KAS relationship (Figure 7) and to find the slope of each curve for each sample. It was found that the KAS patches exhibited curves with similar characteristics, which can be described by eleven straight lines, each representing a different segment. The straight-line adjustment correlates with each conversion rate. Additionally, these lines were completely parallel within the 0.3 conversion bands. During this time, some randomness was observed in the lower and upper conversion areas because more volatile radicals joined simultaneously, creating multiple responses [30]. These features became clearer with the addition of the catalyst and all lines.
Figure 8 illustrates the variation in activation energy using different methods. Based on the results obtained, the FWO and KAS models are the most suitable techniques for studying the kinetics of thermal degradation of polycaprolactam. The main conversion region (0.3–0.7) aligns with these findings, which are consistent with results from studying similar and different feedstocks in the literature [30]. We observe that the apparent activation energy for KAS and FWO methods varies at different conversions, indicating a complex multi-step mechanism in the solid state. The apparent activation energies range from approximately 134.3 to 178.5 kJ/mol for the FWO method and 126.5 to 167.3 kJ/mol for KAS. This suggests that the reaction mechanism changes during the decomposition process and that activation energy depends on the level of conversion. Model-free isoconversional methods estimate activation energy as a function of conversion without assuming a specific reaction model, making it easier to identify multi-step kinetics based on changes in activation energy with conversion. This approach differs from the Kissinger method, which provides a single value for the entire process and may not reveal complexity [18]. Overall, FWO best describes the kinetics of polycaprolactam’s thermal degradation.

3.2. Factor Study of PA6 Degradation Using Phosphoric Acid

3.2.1. Effect of Kind of Acid

Many types of acids can speed up the reaction. Figure 9 shows how WS-13 converts under different acid solutions. Based on the results in Table 2, we compared the degradation using formic acid and HCl. The findings indicate that hydrochloric acid is the better choice for degrading PA6, mainly because the degradation process is faster with a strong acid. It is similar to degrading PA6 with hydrochloric acid [10].
On the other hand, when comparing reactions using acid and base-catalyzed catalysts, acid solutions have some advantages over base solutions for PA6 degradation. This is likely due to the higher electron affinity of the hydrogen protons. The carbonyl group in PA6 is a highly reactive site that favors nucleophilic attack by acid solutions. It is essential to note that the ester group (CO2) repeating unit in PA6 is prone to hydrolysis.
Figure 9 compares the efficiency of different acid types in breaking down WS-13 under the same microwave-assisted hydrolysis conditions at 200 °C. Hydrochloric acid (HCl) achieved the highest conversion, nearly 100%, while phosphoric acid (H3PO4) and formic acid (CH2O2) also performed well, with conversion rates over 95%. Weaker acids, such as acetic acid (CH3COOH) and nitric acid (HNO3), showed significantly lower conversion rates below 80%. These results highlight how acid strength and dissociation ability affect the hydrolysis process. Stronger acids promote protonation of the amide bond, which boosts chain scission. Additionally, the ionic environment created by strong acids enhances the solubility of oligomeric degradation products, thereby facilitating depolymerization. The degradation performance ranking is as follows: HCl > H3PO4 > CH2O2 > CH3COOH > HNO3. Although hydrochloric acid displayed the best degradation efficiency in Figure 9, phosphoric acid was selected for further study based on additional factors. As shown in Figure 2b, phosphoric acid has been previously used as a catalyst and has produced good results, indicating its practical effectiveness in similar hydrolysis systems. Moreover, in this study, phosphoric acid exhibited excellent degradation performance on WS-13, nearly matching that of hydrochloric acid. This supports the idea that phosphoric acid, which is milder and more environmentally friendly, remains effective for depolymerizing PA6. Therefore, phosphoric acid was also used as the catalyst in the setup of Figure 2c to maintain consistency and explore its catalytic behavior under different reaction conditions. The following discussion will focus on how various operational factors influence the process using phosphoric acid as the primary catalyst.

3.2.2. Effect of Reaction Time

Figure 9 shows that phosphoric acid can achieve a high conversion rate of over 80% within 15 min of reaction time, except for sample WS-24. C-fiber has the highest conversion because its residue has the lowest percentage (Table 1). When hydrogen molecules in phosphoric acid break the polymer chain, the process becomes more efficient. The water-acid-solid ratio in this experiment is 10:10:10, also confirmed in Figure 10, which illustrates how water influences the hydrolysis process. When the amount of water is reduced, the conversion rate of PA6 decreases significantly. Due to the effective hydrolysis process at this ratio, hydrogen ions quickly attack alkyl bonds in a shorter reaction time.
Figure 10 illustrates the degradation performance of four types of PA6 feedstocks, namely WS-13, C-fiber, C-resin, and WS-24, under the same phosphoric acid hydrolysis conditions with two different reaction times: 30 min and 1 h. The results clearly demonstrate that longer times lead to higher conversion rates for all materials, emphasizing the importance of residence time in the depolymerization process. After 30 min, WS-13 and WS-24 had notably high conversion rates (74.6% and 63.6%, respectively), while C-resin and C-fiber showed lower conversions (48.4% and 47.5%). When extended to 1 h, WS-13 and WS-24 reached nearly complete conversion 100%), C-resin improved to about 51.2%, and C-fiber only reached around 49.7%. This pattern highlights the influence of polymer structure on degradation speed. WS-13 and WS-24, which likely have lower crystallinity and more amorphous content, allow easier acid penetration and bond hydrolysis. Conversely, WS-24’s higher crystallinity or stabilizing additives may slow its reactivity, potentially leading to even longer reactivity times. Overall, the degradation efficiency at 1 h follows the order: WS-13 > WS-24 > C-fiber > C-resin. These results suggest that feedstock properties and reaction time are both crucial factors in optimizing acid-based PA6 recycling.

3.2.3. Effect of Amount of Phosphoric Acid (H3PO4)

Figure 11 displays the conversion of PA6 feedstock compared to the initial PA6 (WS-13, WS-24, C-fiber, C-resin), based on acid addition. The solubility efficiency increases linearly up to 7.5 g of added acid and nearly reaches complete solubilization with 10 g of acid. Additional acid increases do not significantly impact solubilization. The solid waste WS-13 in the blank solution (H3PO4 = 0 g) shows higher solubility than both the commercial PA6 product and the standard (C-fiber & C-resin). Figure 11 shows the relationship between the degradation of PA6 and the amount of phosphoric acid, where longer irradiation times improve the conversion of PA6 (WS-13, C-fiber, and C-resin). The results align with previous reports on PA6 hydrolysis, indicating a strong influence of temperature and solution acidity on monomer yield [31].

3.2.4. Effect of Reaction Temperature

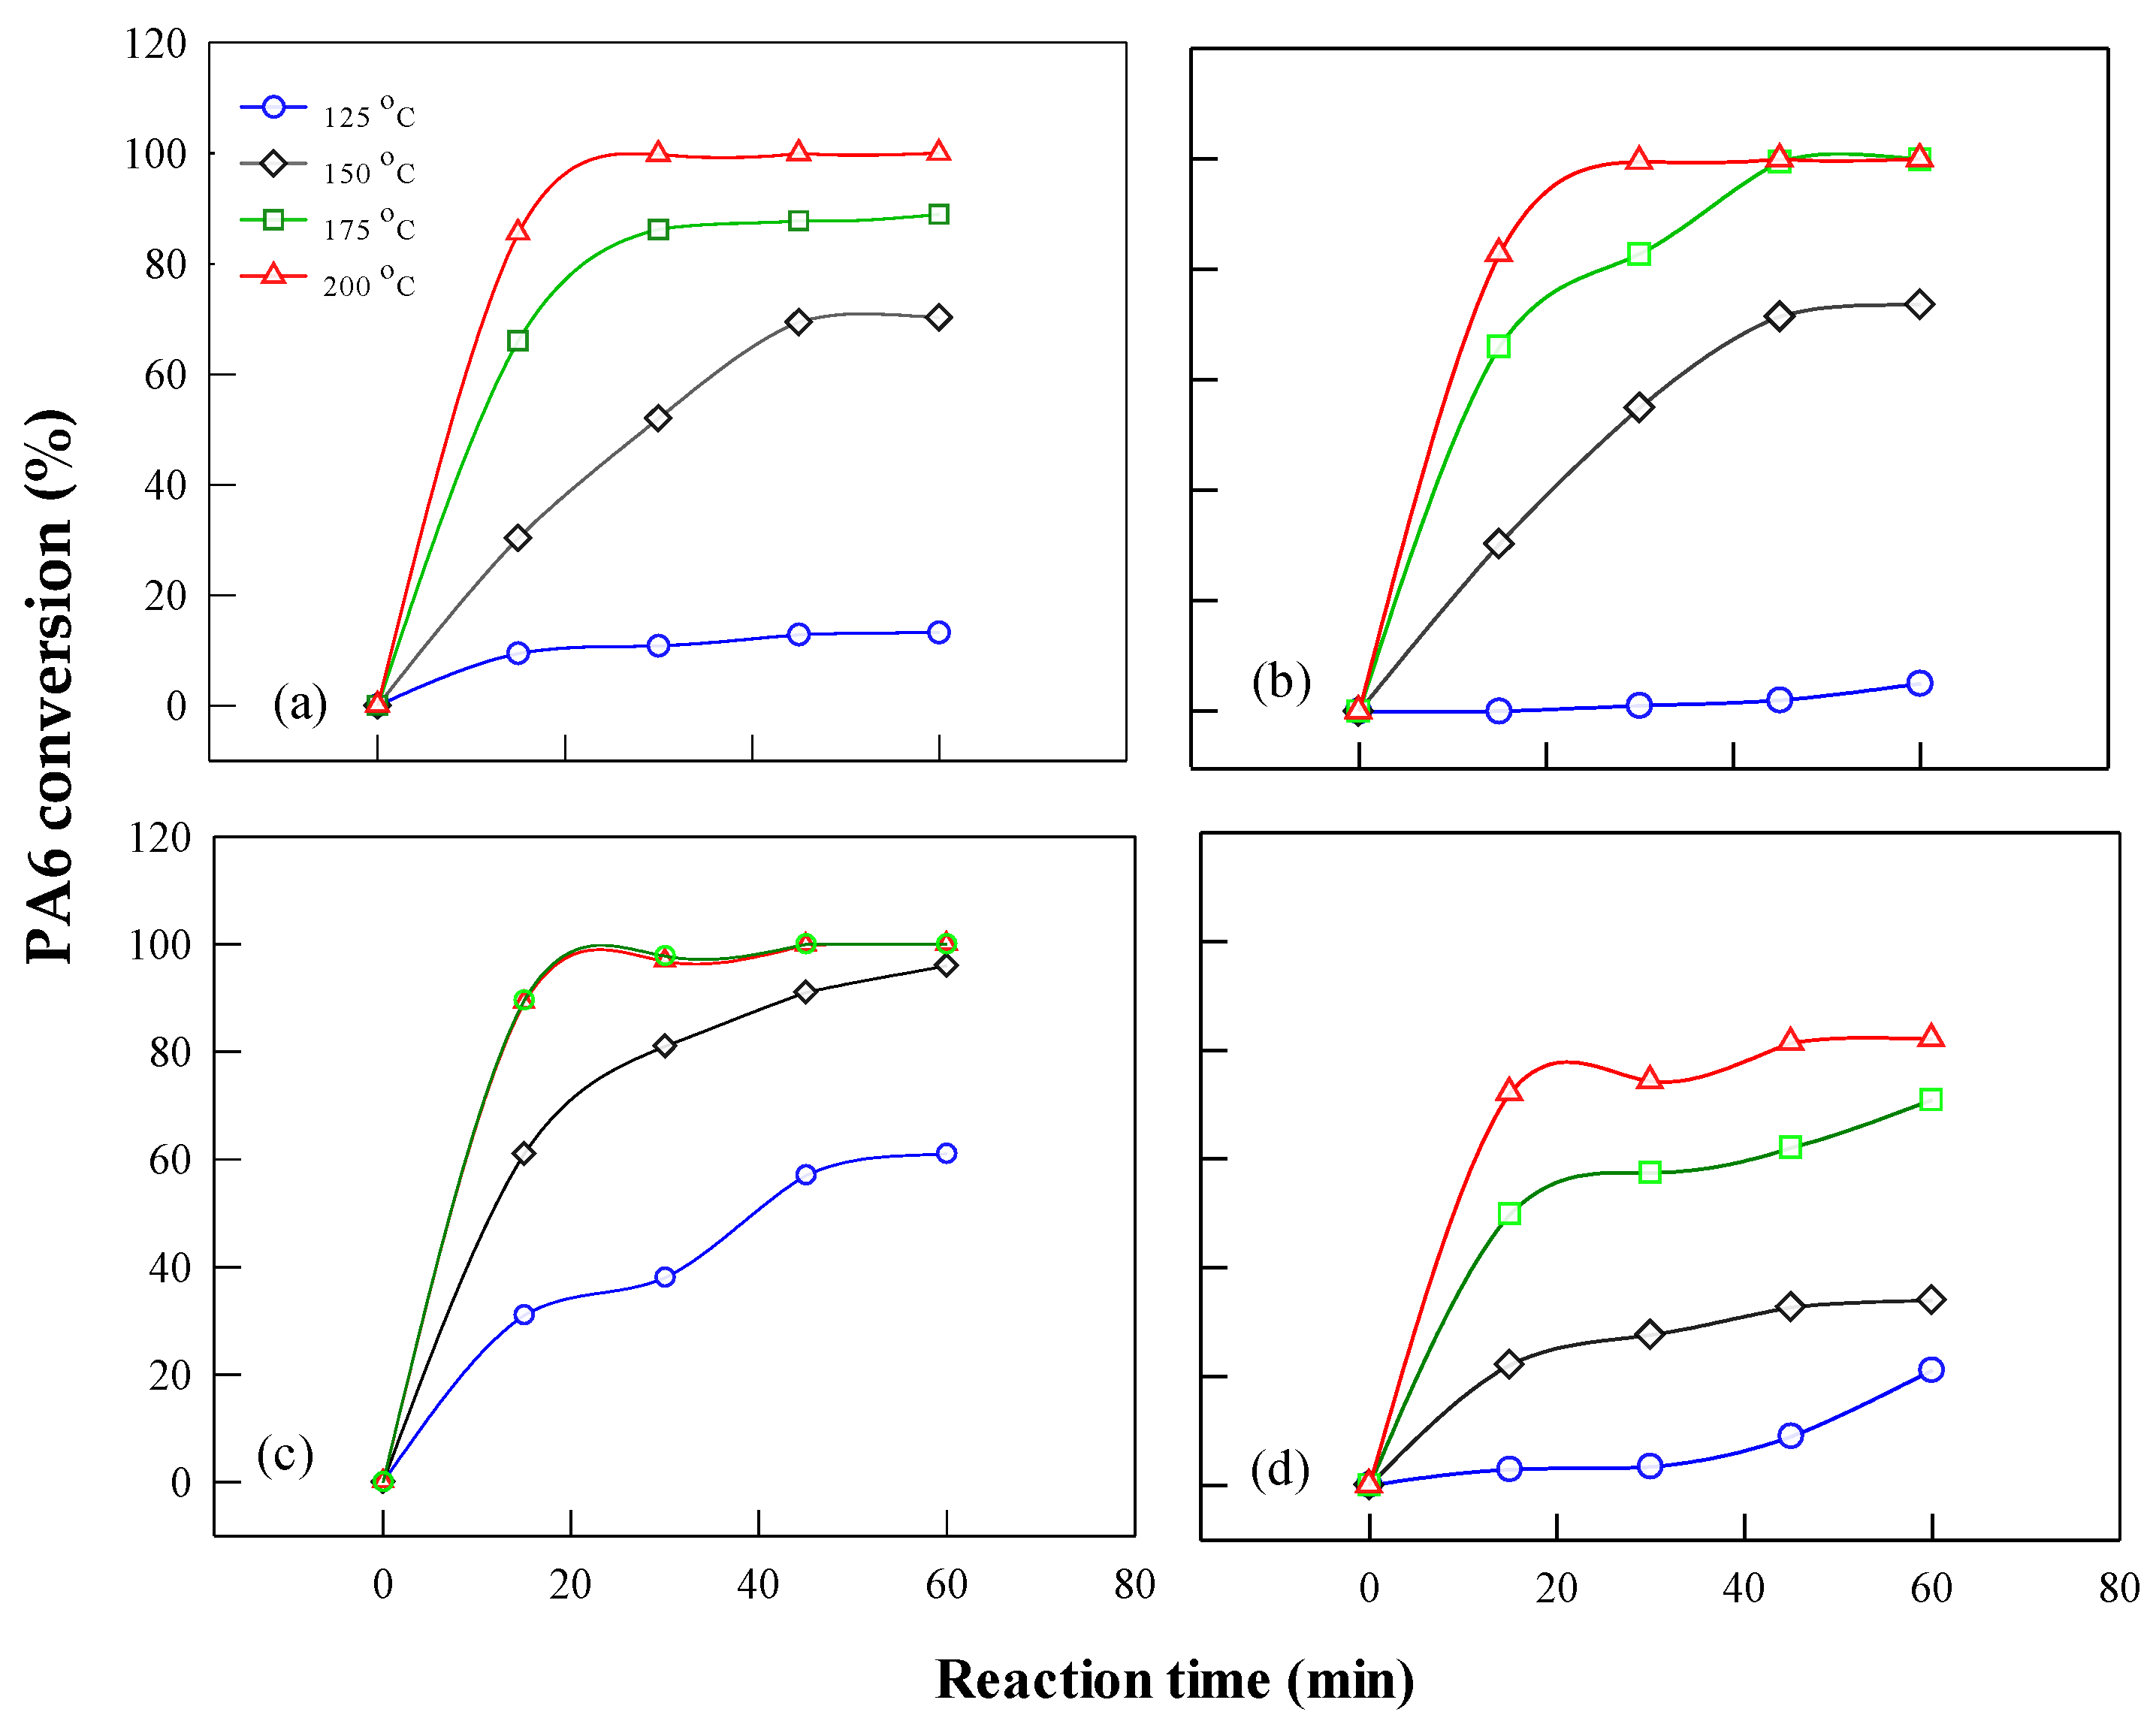
Figure 12 illustrates the conversion profiles of PA6 feedstocks (WS-24, WS-13, C-fiber, and C-resin) during phosphoric acid-catalyzed depolymerization at different temperatures (125–200 °C) and reaction times up to 60 min. The results highlight the strong influence of both temperature and residence time on hydrolysis efficiency. At lower temperatures (125 °C), all samples exhibit minimal conversion (<15%), reflecting insufficient energy to break the stable amide bonds. As the temperature increases to 150 °C and 175 °C, conversion improves significantly; however, differences among the feedstocks become more pronounced. WS-13 and C-fiber demonstrate the fastest increase in conversion, achieving >80% conversion within 45–60 min, while C-resin and WS-24 lag, reaching only 60–70%. At 200 °C, the distinction is most apparent: WS-13 and C-fiber achieve nearly complete conversion (>98%) within 1 h, while C-resin attains around 91% and WS-24 remains the lowest at ~77%.
These differences arise from structural variations. WS-13, having lower crystallinity and shorter polymer chains, is more vulnerable to acid attack, allowing for quick bond cleavage and efficient hydrolysis. C-fiber also reacts strongly due to its porous structure, which promotes acid penetration. Conversely, C-resin, with high crystallinity and dense structure, resists acid diffusion, resulting in slower degradation. WS-24, even as waste material, appears to contain stabilizing additives or impurities that reduce reactivity, which explains its consistently lower conversion.
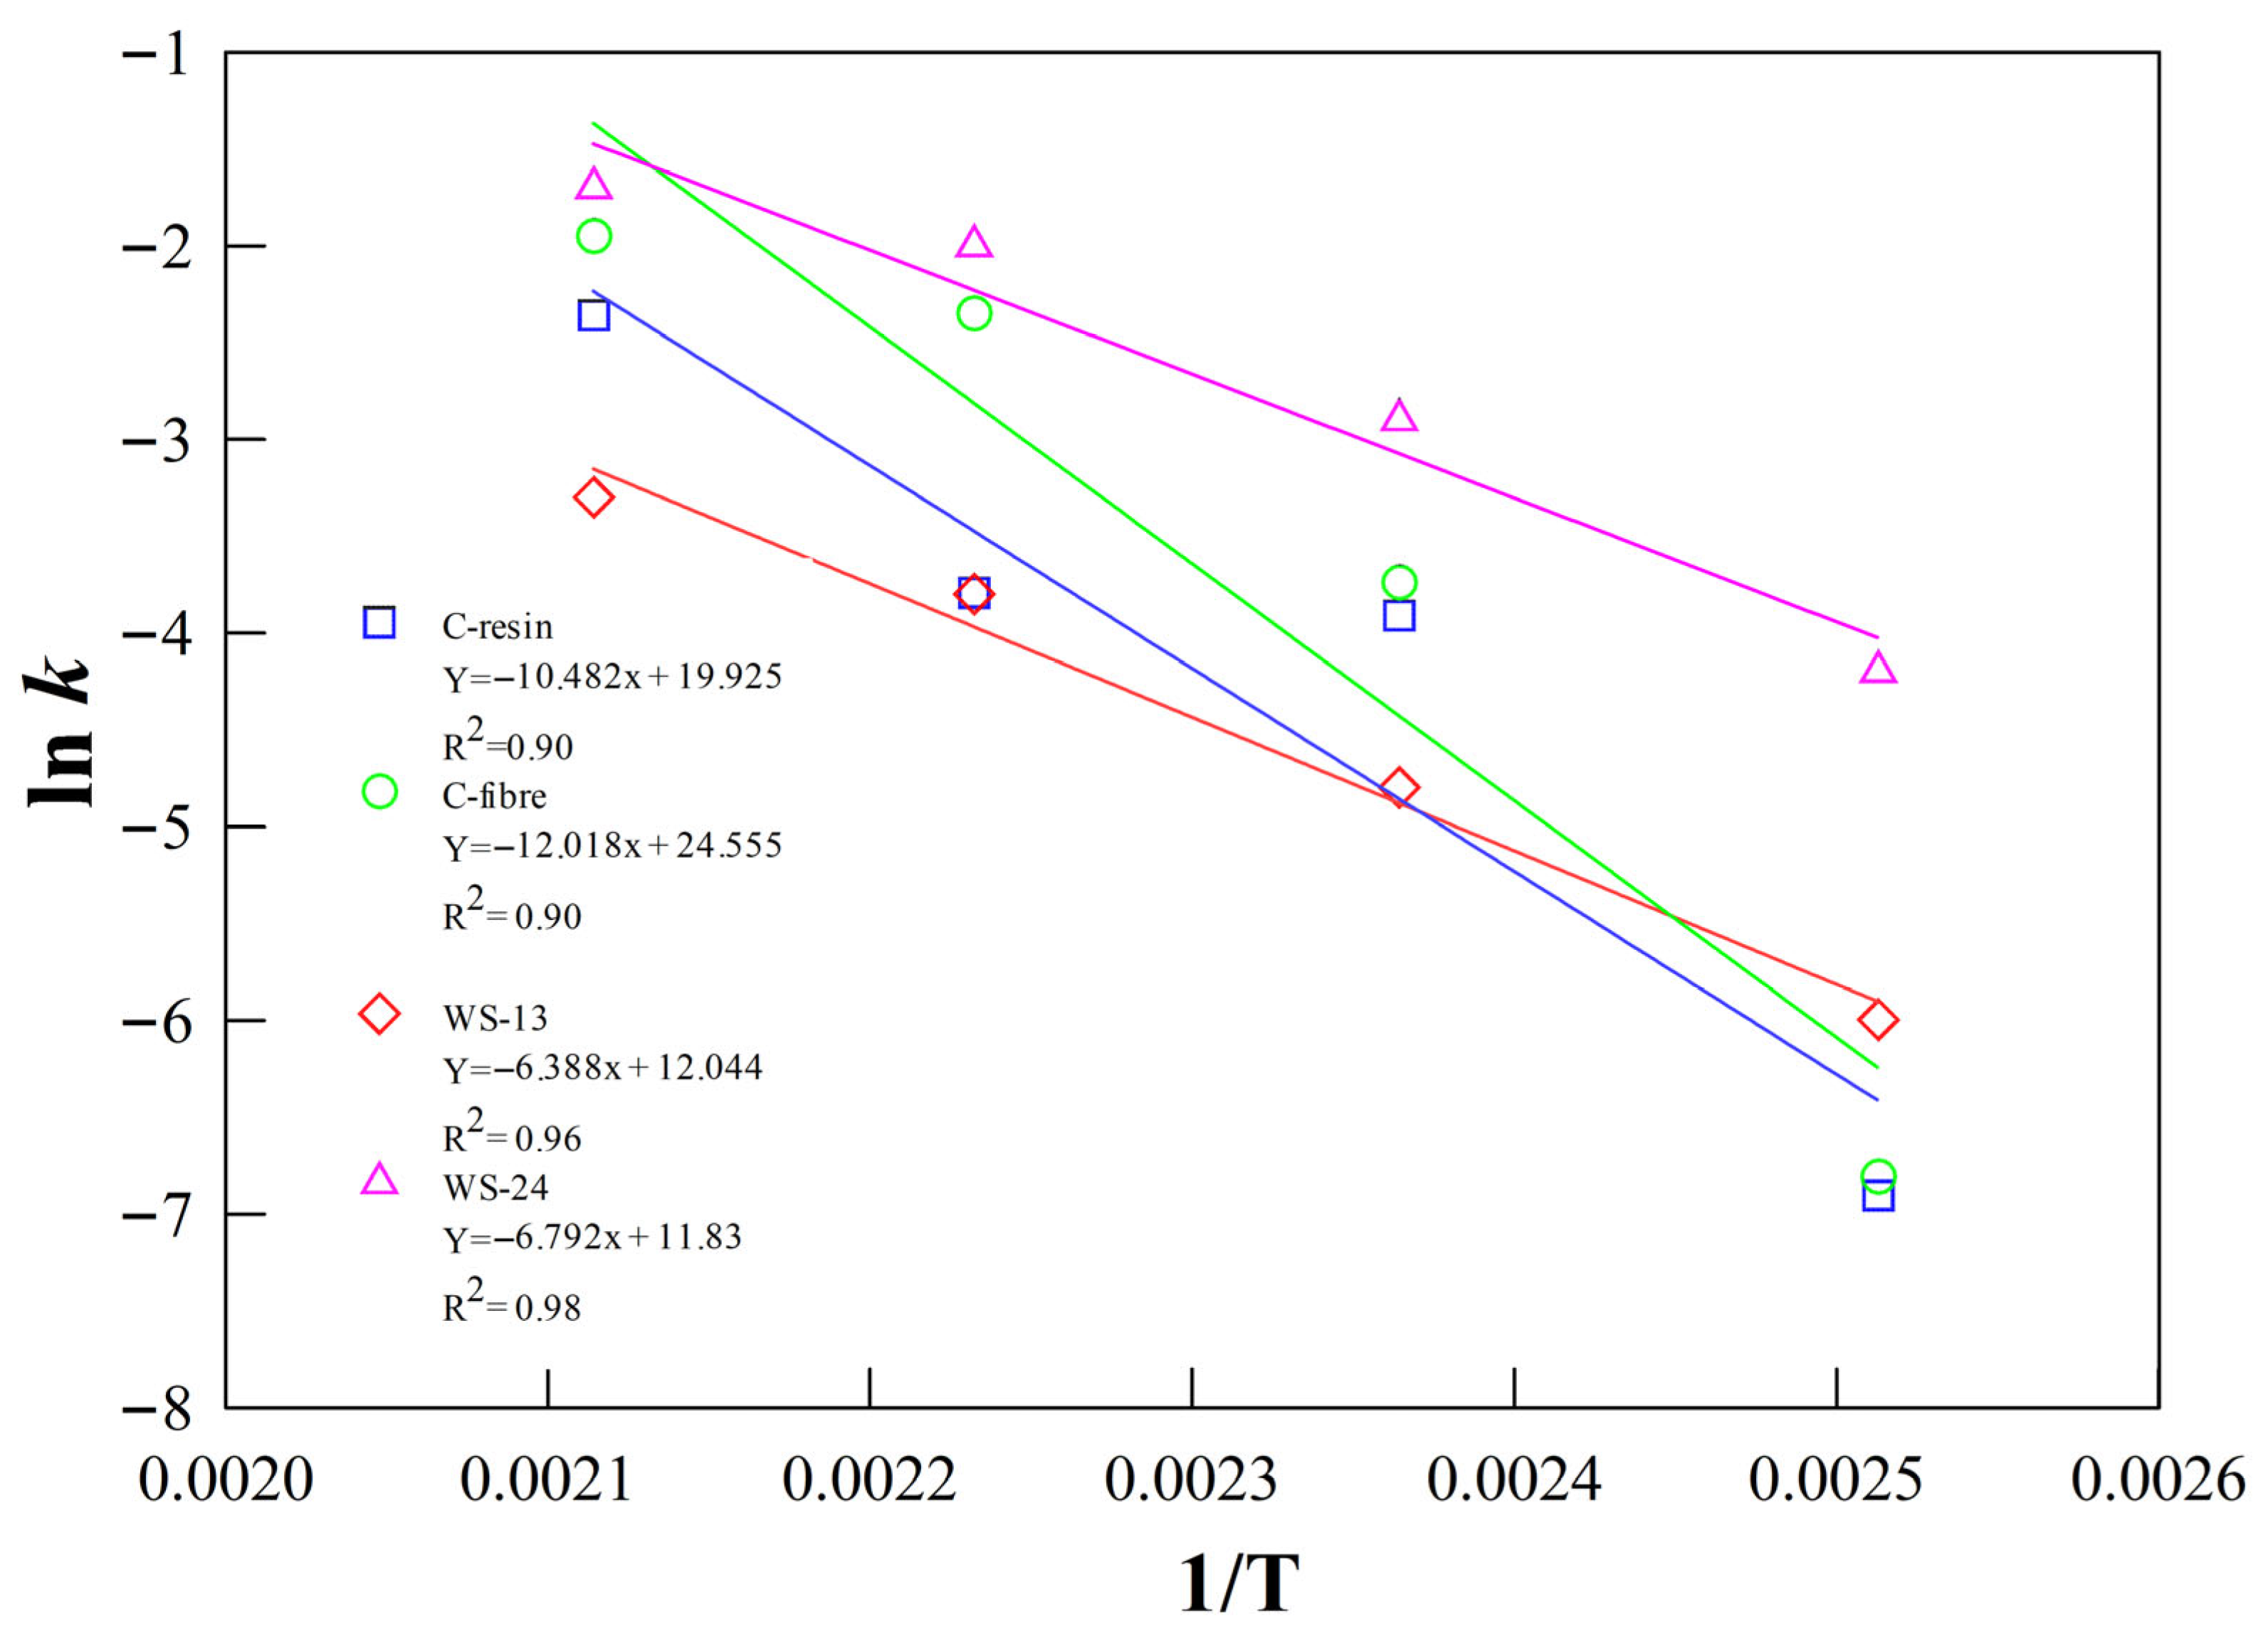
The kinetic behavior shown in Figure 12 follows pseudo-first-order reaction characteristics, as confirmed by the linear Arrhenius analysis in Table 3 and Figure 13. The increasing slopes with temperature indicate higher rate constants, and the calculated activation energies suggest that C-fiber and WS-13 need less energy for depolymerization compared to C-resin. Notably, the reaction trends show that optimizing both temperature and reaction time is essential for maximizing yields. Shorter reaction times at high temperatures are sufficient for WS-13 and C-fiber, while C-resin and WS-24 require longer times and still do not fully depolymerize.
As the temperature increases to 200 °C, the reaction’s rate constant rises to 0.006. The reaction rate constant for the depolymerization of PA6 waste was determined over a temperature range of 125 °C to 200 °C. The Arrhenius equation is used to evaluate activation energy, where k = Aexp(−Ea/RT), and k is the depolymerization rate constant, A is the Arrhenius constant, and Ea is the activation energy. The rate constants for the PA6 hydrolysis are listed in Table 3. The Arrhenius plot can be drawn using the values of ln k versus 1/T. The activation energy obtained from the slope is 82.68 kJ/mol (Table 3 and Figure 13).
Activation energies obtained from Arrhenius plots are shown in Table 4, along with standard deviations (SD) derived from multiple temperature point fittings. For WS-24 and WS-13, Ea values of 56.5 ± 2.1 and 53.1 ± 1.8 kJ mol−1, respectively, confirm their lower energy barriers compared to industrial-grade PA6. C-fiber and C-resin displayed higher values (99.9 ± 3.5 and 87.1 ± 2.9 kJ mol−1), indicating greater crystallinity and morphological resistance. The narrow error ranges demonstrate good reproducibility of the kinetic fits, with all regressions showing coefficients of determination (R2) greater than 0.90. Reporting these uncertainties enhances the reliability of the kinetic parameters and supports the conclusion that WS samples are more susceptible to hydrolysis than industrial PA6. This finding agrees with the peaks observed in the FTIR analysis shown in Figure 4. Conversely, WS-13 and WS-24, with lower activation energies, are more easily hydrolyzed, suggesting that they have shorter chains or structural defects. This explains why WS waste samples produce higher ACA and CPL under acid-catalyzed conditions. Overall, the lower Ea values for WS-13 and WS-24 highlight their greater potential for chemical recycling.
It should be noted that the kinetic modeling approach differs between the thermal degradation (TGA) and the hydrolysis experiments. The isoconversional analysis of TGA clearly revealed a multi-step solid-state decomposition, with activation energies varying as a function of conversion (Figure 8), indicative of overlapping degradation pathways. In contrast, the microwave-assisted hydrolysis experiments were analyzed using a pseudo-first-order kinetic model. This simplification was chosen because hydrolysis in acidic aqueous media is primarily governed by amide bond cleavage, which can be approximated as a single rate-determining step. Furthermore, the available experimental data from HPLC product quantification provide bulk conversion values rather than mechanistic intermediates, making a global kinetic fit more appropriate. Adopting the pseudo-first-order model thus enables the practical estimation of apparent rate constants and activation energies for comparative purposes across various feedstocks (WS-13, WS-24, C-fiber, and C-resin) and operating conditions. Accordingly, while the solid-state decomposition mechanism is multi-step, the hydrolysis kinetics are reasonably described by an overall first-order approximation to support process evaluation and optimization.

3.3. Product of PA6 Degradation Using H3PO4

3.3.1. Yields of ACA and CPL Analyzed Using HPLC

PA6 results from a ring-opening reaction of CPL, and it is prone to degrade at the acyl-amido bond. An acid-catalyzed hydrolysis releases H+ ions, which increase the positive charge on the carbon in the carbonyl group, attracting water (H2O). Then, water attacks the carbonyl group, leading to a nucleophilic reaction.
Table 5 shows that WS-24 exhibits a clear dependency on temperature and time for its hydrolysis performance. At 125 °C, the total ACA + CPL yield is only about 8–9%, indicating insufficient energy for effective depolymerization. As the temperature increases to 150 °C and 175 °C, the yields gradually increase, reaching 34–57%. ACA remains the primary product. At 200 °C and 60 min, the maximum total yield reaches 62% (ACA ≈ 61%, CPL ≈ 1–2%), indicating that higher temperatures and longer reaction times improve monomer recovery. However, the CPL yield consistently stays lower than the ACA yield, suggesting that linear scission to ACA is predominant, while cyclization to CPL is less efficient. The optimal condition for WS-24 is 200 °C for 60 min.
To evaluate process efficiency, CPL and ACA yields were normalized to the initial carbon content of the feedstocks. For WS-24, the example condition (175 °C, 15 min) delivered 34.5% carbon recovery in identified monomers (ACA 33.15%, CPL 1.35%). Solid residue analysis accounted for 34% of the initial carbon, leaving a 31.5% gap (66–34.5%), which is attributed to oligomeric fragments persisting in the aqueous phase.
Table 6 shows that WS-13 exhibits better reactivity compared to WS-24. At 125 °C, total yields are very low (1–5%) with almost no CPL formation. As the temperature increases to 175–200 °C, yields rise markedly. At 200 °C for 45 min, ACA + CPL reaches 62.4%, with ACA about 46% and CPL around 16%, representing the optimal condition for WS-13. At 60 min, the total yield is still high (58%), but CPL decreases, indicating secondary reactions at longer durations. This suggests that WS-13 degrades efficiently and achieves high monomer recovery more quickly than the other samples.
Table 7 shows that C-resin behaves differently from waste samples due to its higher crystallinity and structural stability. At 125 °C, the total yield is only 4%, with almost no CPL. Increasing the temperature to 150–175 °C gradually improves yields but still lags behind WS samples. Under the best conditions at 200 °C for 60 min, the ACA + CPL yield reaches 53.8% (ACA ≈ 51%, CPL ≈ 3%). Compared to WS-13, C-resin produces significantly less CPL, reflecting its limited ability for cyclization. Overall, C-resin shows lower hydrolysis efficiency, confirming that industrial-grade resin is more resistant to acid-catalyzed depolymerization.
Table 8 shows that C-fiber shows the lowest reactivity at low temperatures, with total yields between 0.2 and 4% at 125 °C and no CPL formation. However, at elevated temperatures of 175–200 °C, yields increase substantially. At 200 °C for 45–60 min, the total yield reaches approximately 69–70%, dominated by ACA (>66%) with minimal CPL (0.1–0.2%). Although C-fiber achieves the highest total yield among all samples, its CPL production remains negligible, showing that degradation mainly proceeds via linear scission to ACA. Compared to WS-13, C-fiber excels in ACA recovery but is less effective for CPL production.
Comparing all four samples, the optimal ACA + CPL yields are ranked as C-fiber (~70%) > WS-13 (~62%) > WS-24 (~62%) > C-resin (~54%). WS-13 is notable for its balanced production of both ACA and CPL (especially at 200 °C, 45 min), while WS-24 and C-fiber favor ACA as the dominant product. C-resin, despite achieving over 50% yield, produces the least CPL, indicating limited recycling potential. The variations are attributed to structural differences: waste samples with lower crystallinity and shorter chains degrade more easily, while industrial products with higher crystallinity resist hydrolysis. C-fiber is ideal for ACA recovery, while WS-13 is best suited for combined ACA and CPL production, and WS-24 and C-resin show lower overall potential. The hydrolysis of PA6 to ACA is more accelerated than the cyclodehydration of ACA to CPL [11].

3.3.2. MS Spectrum of Liquid Products

The liquid fraction after microwave-assisted hydrolysis was analyzed by mass spectrometry (MS). The main peaks correspond to cyclic and linear PA6 monomers together with their oligomers. The signals at m/z 114.1 and 132.1 confirm the presence of caprolactam (CPL) and 6-aminocaproic acid (ACA), respectively. Higher mass fragments correspond to their oligomeric homologues: CPL dimer (m/z 227.1), ACA dimer (m/z 245.2), CPL trimer (m/z 340.2), ACA trimer (m/z 358.0), ACA tetramer (m/z 471.4), and ACA pentamer (m/z 584.5). These assignments are consistent with acid-catalyzed cleavage of amide bonds followed by either linear hydrolysis (ACA series) or intramolecular cyclization (CPL series), as previously reported [32].
Besides the two principal monomer pathways, additional compounds were detected depending on the feedstock. For WS-24, possible side products include Bicine and 2,3-dihydroxybenzoic acid, likely arising from additives or impurities in the extract-cake stream. WS-13 showed signals consistent with aluminum chloride residues, along with Bicine and 2,3-dihydroxybenzoic acid, indicating that both metallic contaminants and organic stabilizers survive the industrial distillation sequence. These impurities are consistent with the lower crystallinity but more heterogeneous composition of WS-13 and WS-24, as also reflected in their FTIR and TGA profiles.

3.3.3. Temperature–Time–Acid Windows

The hydrolysis results indicate that PA6 degradation is highly sensitive to the interplay of temperature, reaction time, and acid strength. Under mild conditions (≤150 °C, ≤30 min), conversion is incomplete (<35%) and CPL selectivity is negligible, with ACA as the dominant product. Increasing the temperature to 175–200 °C enhances overall conversion (>80%) but shifts the balance: shorter times (30–45 min) favor CPL formation (up to ~16% yield in WS-13 at 200 °C, 45 min), while prolonged residence (≥60 min) leads to over-hydrolysis, secondary reactions, and reduced CPL selectivity. Stronger acids (HCl, H3PO4) give higher conversions, but HCl raises concerns about corrosion, while H3PO4 provides a more balanced trade-off between conversion and stability. Thus, the optimal operating window for maximizing CPL selectivity below 200 °C is a moderate reaction time (30–45 min) at 175–200 °C using strong acids, where ACA remains the major product, but CPL recovery is significant. Beyond this window, over-hydrolysis favors the formation of ACA almost exclusively, increasing solid residue formation and thereby reducing monomer recovery efficiency.

3.4. Morphology of Product After PA6 Hydrolysis Under H3PO4

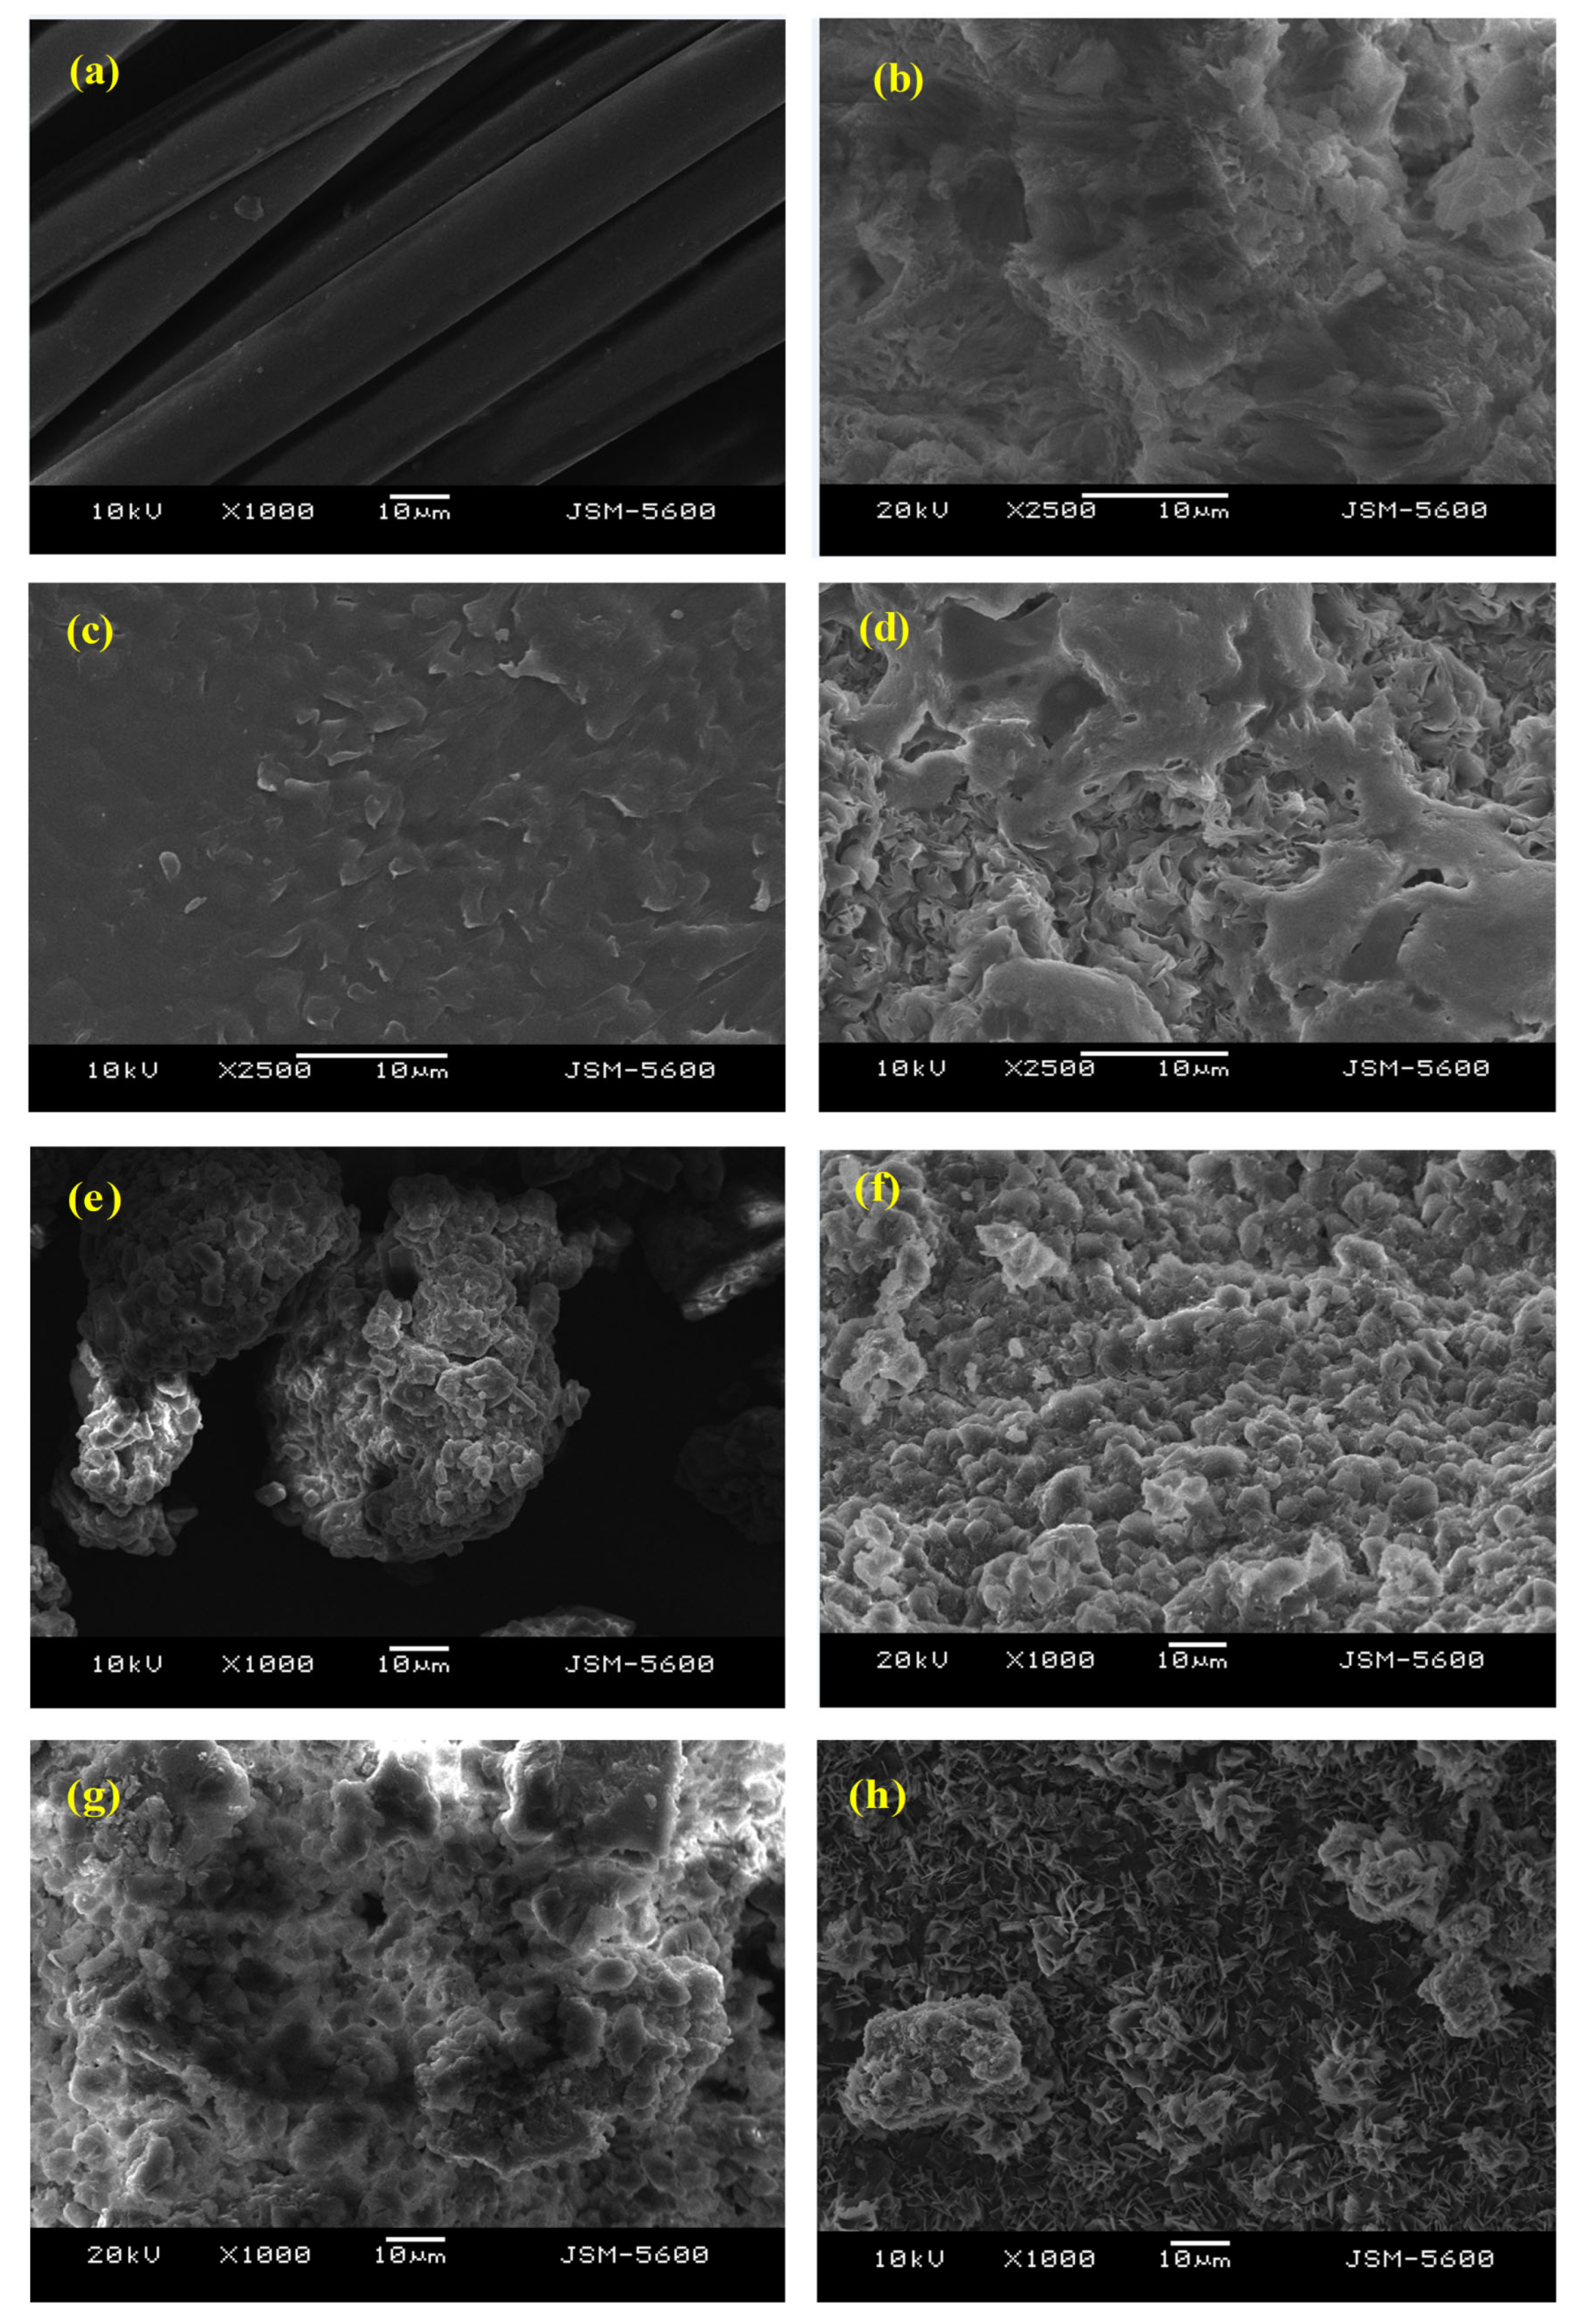
Figure 14 shows scanning electron microscopy (SEM) images of the raw PA6 feedstocks, including WS-13, WS-24, C-fiber, and C-resin. These micrographs reveal notable differences in surface morphology that are closely linked to the degradation of the materials during acid hydrolysis. WS-13 and C-fiber display rough, porous surfaces with irregular textures and visible microvoids, indicating a higher surface area and lower crystallinity. These features facilitate acid diffusion and bond cleavage, resulting in more effective degradation. In contrast, C-resin appears dense and compact with minimal surface roughness, suggesting high crystallinity and limited accessibility for acid penetration. WS-24, although slightly more porous than C-resin, still shows a relatively smooth, continuous surface, which restricts catalytic contact and results in slower degradation rates. The surface texture directly correlates with hydrolysis efficiency, as previously shown, degradation reactivity follows the order WS-13 > C-fiber > C-resin > WS-24. These surface characteristics explain why WS-13 and C-fiber nearly achieved complete depolymerization, while C-resin and WS-24 proved more resistant to breakdown. The SEM analysis visually confirms the structure–reactivity relationship involved in acid-catalyzed PA6 recycling. In the SEM images of the original polycaprolactam (Figure 14), after 1 h of hydrolysis, the C-fibers had vanished, leaving structures resembling rods. After the same treatment, these rod-shaped structures persisted. During degradation, chain division occurs randomly at the chain ends, and side chains can split and cleave. Chain splitting during polymer distribution significantly impacts viscosity and flow rate properties, which in turn affect the quality. Such viscosity and flow properties influence the thermal behavior of the polymer, including glass transition and melting point, which are highly sensitive to molecular weight and its distribution [27]. Several other factors can directly influence the degradation of mechanical properties and the rate of degradation. To monitor the recycling process and identify the solid end-products, spectroscopy, scanning electron microscopy, and thermal analysis (TGA) were used. WS-24, WS-13, C-resin, and C-fiber, all processed with microwaves, were analyzed to determine if the characteristic properties of polycaprolactam change under microwave treatment.
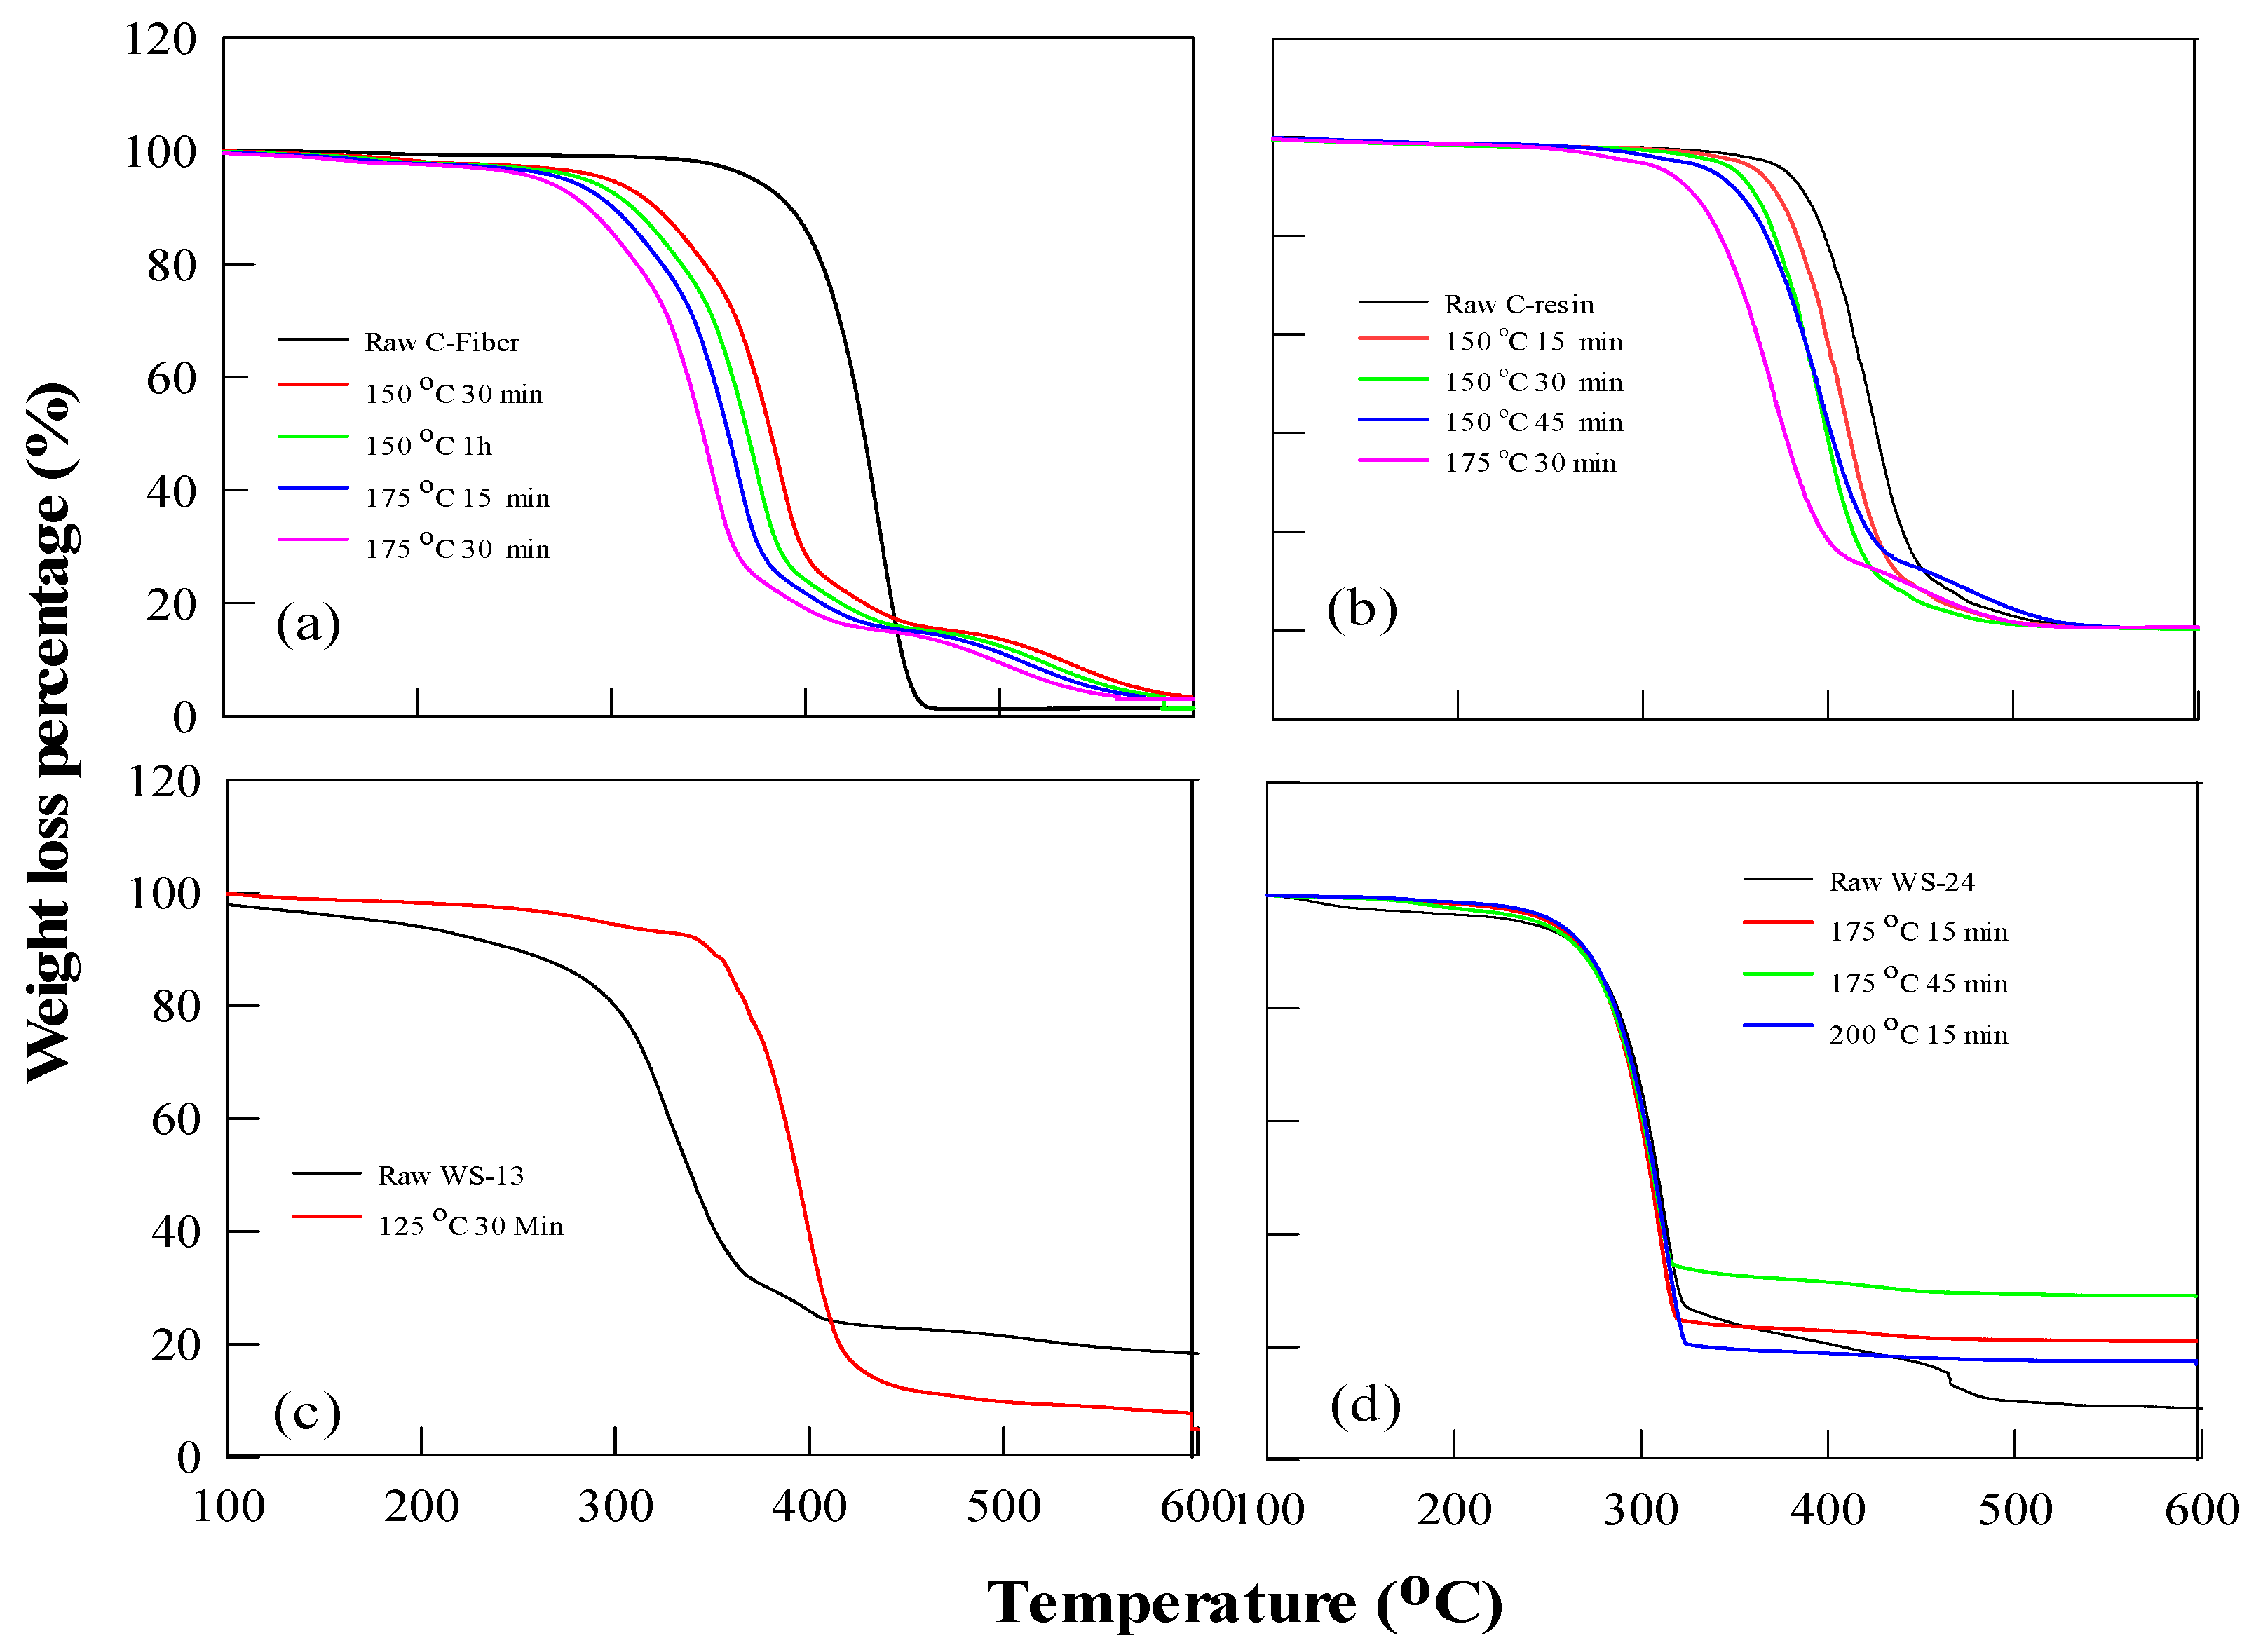
From Figure 14, the PA6 samples before and after hydrolysis show that the remaining solid phase begins to degrade at a lower temperature during TGA, with an apparent change in the slope compared to previous measurements. This change can be explained in several ways. Some solid oligomeric species might develop during microwave treatment. These oligomers degrade later at lower temperatures, or polycaprolactam waste may contain additives that degrade during microwave processing [10].
Figure 15 compares TGA profiles of PA6 feedstocks before and after hydrolysis with phosphoric acid. The thermal stability of each sample reflects its structural characteristics and degree of degradation. For C-fiber, the initial decomposition temperature drops after hydrolysis, indicating reduced chain length and lower thermal stability (Figure 15a). C-resin, however, maintains relatively high stability; its onset degradation temperature remains near 300 °C even after hydrolysis, suggesting that its high crystallinity limits acid attack and preserves stronger bonding (Figure 15b). WS-13 and WS-24 exhibit pronounced shifts: WS-13, originally stable below 300 °C, shows earlier decomposition after hydrolysis, consistent with chain scission and formation of oligomeric residues (Figure 15c). WS-24, in particular, shifts from degradation onset below 300 °C to around 400 °C, indicating incorporation of impurities or formation of secondary oligomers during hydrolysis (Figure 15d). The differences highlight how hydrolysis alters the thermal profile by generating lower molecular weight fractions or introducing catalytic residues (e.g., Al, Cr detected via EDS). Among the four, WS-13 exhibits the most pronounced reduction in thermal stability after hydrolysis, which supports its high reactivity and high ACA + CPL yields. C-resin shows the least change, reinforcing its resistance to acid degradation. Overall, Figure 15 demonstrates that hydrolysis not only reduces molecular weight but also reshapes thermal behavior. The results confirm that lower-crystallinity samples (WS-13, C-fiber) are more susceptible to both hydrolysis and subsequent thermal decomposition, while higher-crystallinity materials (C-resin, WS-24) exhibit greater stability and degrade more slowly. This finding aligns with SEM observations in Figure 14 and provides additional evidence for the structure–reactivity relationship in PA6 recycling.

3.5. Crystallinity vs. Ea, FTIR–Chain Scission, SEM–Acid Transport

The interplay of morphology, chemical structure, and crystallinity significantly influences the response of PA6 waste to hydrolysis. DSC and TGA reveal that oligomeric wastes (WS-13 and WS-24) degrade at lower onset temperatures than industrial resin or fiber, indicating reduced crystallinity and shorter chain lengths. In isoconversional kinetic analysis, their activation energies plateau around 53–57 kJ mol−1, considerably lower than C-fiber (≈100 kJ mol−1) or C-resin (≈87 kJ mol−1). This matches their earlier onset degradation and confirms that amorphous, less ordered regions are more accessible to acid attack.
FTIR analysis further supports this interpretation. WS-13 and WS-24 show weaker crystalline α-phase bands and stronger signatures of disordered phases. During hydrolysis, new absorptions for carboxyl (1730 cm−1) and ammonium (1580 cm−1) groups emerge, consistent with scission of amide bonds. Such spectral changes reflect an abundance of reactive end groups, which lowers the energetic barrier to chain cleavage and explains the reduced Ea values.
SEM offers a morphological explanation for kinetic differences. WS-13 has a rougher, more porous surface with microvoids that promote acid penetration and the distribution of microwave energy. Conversely, WS-24 exhibits smoother, denser regions that limit diffusion. As a result, WS-13 attains higher effective rate constants (k) at the same temperatures and shorter optimal reaction times. For instance, at 200 °C and 45 min, WS-13 yields 62.4% ACA + CPL (46% ACA, 16% CPL), whereas WS-24 requires 60 min to reach approximately 62% yield, primarily ACA with only 1–2% CPL.
The mechanistic distinction lies in pathway selectivity. In WS-24, abundant defects and impurities drive straightforward linear scission to ACA; however, compact morphology and high moisture content suppress intramolecular cyclization, thereby limiting CPL. WS-13, with longer oligomers and better chain mobility, supports both linear scission and partial cyclodehydration, yielding meaningful CPL fractions. The SEM/FTIR evidence of accessible amorphous regions aligns with its lower Ea plateau and faster kinetics.
Thermal stability after hydrolysis also reflects these differences. The TGA results show that WS-13 loses stability post-hydrolysis, consistent with oligomer formation and chain scission. WS-24, however, exhibits unusual shifts toward higher apparent onset temperatures, suggesting the incorporation of impurities or the formation of secondary oligomers that retard further breakdown. Such differences highlight how microstructure not only dictates the initial kinetics but also influences product distribution and residue properties.
In summary, morphology and chemistry directly influence the kinetic behavior of PA6 hydrolysis. Low crystallinity and a porous texture (WS-13) reduce Ea, accelerate depolymerization, and enable the co-recovery of ACA and CPL. Denser morphology and impurity effects (WS-24) increase transport resistance, sustain slightly higher Ea, and bias yields toward ACA. These structure–reactivity relationships emphasize the need to tailor recycling strategies to waste type: WS-13 is suited for balanced ACA/CPL recovery, while WS-24 favors ACA but requires longer residence times. The combined SEM, FTIR, DSC, and TGA evidence provides a coherent framework that links morphology and chemistry to the observed kinetic patterns, offering practical guidance for optimizing the microwave-assisted recycling of PA6 wastes.

3.6. Comparison with Literature: Superior Performance of This Study

As summarized in Table 9, the outcomes of this study clearly surpass many previous reports on the chemical recycling of PA6. These comparisons emphasize that while some literature methods achieve slightly higher peak yields, they come at the expense of harsher conditions, higher costs, or impractically long times. Our study presents a more balanced and feasible solution, featuring high monomer yields (up to 70%), moderate operating temperatures (≤200 °C), short reaction times (≤1 h), and broad applicability to various feedstocks, all achieved using inexpensive mineral acids. This combination of efficiency, practicality, and sustainability positions our approach as superior to prior methods, providing a robust foundation for advancing PA6 chemical recycling within a circular economy framework.
While the kinetic and mechanistic results highlight the feasibility of microwave-assisted hydrolysis for PA6 waste, several considerations remain critical for industrial implementation. First, the large-scale use of strong acids (e.g., HCl, H3PO4) raises concerns about corrosion in reactor materials, necessitating the use of resistant alloys, linings, or alternative catalytic systems. Second, acid recovery and recycling are essential to minimize operational costs and environmental burdens; without these measures, the process could generate substantial liquid effluent that requires neutralization and treatment. Third, the broader ecological footprint of the process, including energy input, waste stream management, and emissions, needs to be balanced against the benefits of monomer recovery. These factors suggest that future work should integrate corrosion-resistant reactor design, closed-loop acid recovery, and life-cycle assessment to ensure that chemical recycling of PA6 becomes not only technically feasible but also economically and environmentally sustainable.

4. Conclusions

This study demonstrates that detailed characterization of PA6 wastes (WS-13, WS-24, C-fiber, and C-resin) is essential for evaluating their recycling potential. By linking compositional variability with hydrolytic behavior, the results provide a foundation for optimized conversion approaches that support sustainable material recovery. This work demonstrates that microwave-assisted acid hydrolysis is an efficient strategy for recycling polyamide 6 (PA6) wastes under moderate operating conditions. Comprehensive characterization of four feedstocks (WS-13, WS-24, C-fiber, and C-resin) revealed strong correlations between crystallinity, morphology, and hydrolytic reactivity. Thermogravimetric and kinetic analyses confirmed multi-step solid-state decomposition, while pseudo-first-order modeling of hydrolysis provided reliable estimates of rate constants and activation energies. Oligomer-rich wastes (WS-13, WS-24) exhibited lower energy barriers (≈53–57 kJ mol−1) and faster depolymerization rates compared to industrial products (C-fiber, C-resin), underscoring their higher recycling potential.
Monomer yield analysis revealed distinct substrate preferences: WS-13 achieved a balanced recovery of aminocaproic acid (ACA) and caprolactam (CPL), while WS-24 produced mainly ACA. C-fiber reached the highest ACA yield (~70%), and C-resin showed limited conversion (~54%) due to its high crystallinity. Morphological and thermal stability studies further supported these trends, confirming that porosity and lower crystallinity promote efficient acid penetration and chain scission.
Overall, the findings establish microwave-assisted hydrolysis as a selective and energy-efficient route for enhancing the circularity of PA6. The quantified kinetics and product selectivity offer actionable parameters for reactor design, acid selection, and residence-time optimization. Future work should focus on acid recovery, corrosion management, and life-cycle assessment to facilitate the sustainable large-scale implementation of PA6 chemical recycling.

Author Contributions

Conceptualization, H.-S.W.; methodology, M.P.; investigation, M.P.; writing—original draft preparation, H.-S.W.; writing—review and editing, D.D.; supervision, H.-S.W. All authors have read and agreed to the published version of the manuscript.

Funding

This research was funded by Ming Shiuan Fine Chemical Co., Ltd., Taiwan.

Data Availability Statement

The original contributions presented in this study are included in the article. Further inquiries can be directed to the corresponding author.

Conflicts of Interest

The authors declare no conflicts of interest.

References

  1. Plastics Polymers & Resins: Nylon Market Size, Share & Industry Analysis, By Type (Nylon 6 (Resin & Fiber), Nylon 6,6 (Resin & Fiber)), By Application (Automotive, Electrical & Electronics, Appliances, Film & Coating, Wire & Cables, Consumer, Industrial & Machinery, and Others), and Regional Forecast, 2024–2032. Available online: https://www.fortunebusinessinsights.com/nylon-market-102007 (accessed on 22 July 2025).
  2. Cohen, J.D.; Fergusson, S.B.; Marchildon, E.K.; Marks, D.N.; Mutel, A.T. Process for the Production of Nylon 6. U.S. Patent 6,437,089, 20 August 2002. [Google Scholar]
  3. Minor, A.-J.; Goldhahn, R.; Rihko-Struckmann, L.; Sundmacher, K. Chemical Recycling Processes of Nylon 6 to Caprolactam: Review and Techno-Economic Assessment. Chem. Eng. J. 2023, 474, 145333. [Google Scholar] [CrossRef]
  4. Zheng, L.; Wang, M.; Li, Y.; Xiong, Y.; Wu, C. Recycling and Degradation of Polyamides. Molecules 2024, 29, 1742. [Google Scholar] [CrossRef]
  5. Ackermann, Y.S.; Li, W.-J.; Op de Hipt, L.; Niehoff, P.-J.; Casey, W.; Polen, T.; Köbbing, S.; Ballerstedt, H.; Wynands, B.; O’Connor, K.; et al. Engineering adipic acid metabolism in Pseudomonas putida. Metab. Eng. 2021, 67, 29–40. [Google Scholar] [CrossRef]
  6. Hu, K.; Tian, W.; Yang, Y.; Nie, G.; Zhou, P.; Wang, Y.; Duan, X.; Wang, S. Microplastics remediation in aqueous systems: Strategies and technologies. Water Res. 2021, 198, 117144. [Google Scholar] [CrossRef]
  7. Dogu, O.; Pelucchi, M.; Van de Vijver, R.; Van Steenberge, P.H.; D’hooge, D.R.; Cuoci, A.; Mehl, M.; Frassoldati, A.; Faravelli, T.; Van Geem, K.M.; et al. The chemistry of chemical recycling of solid plastic waste via pyrolysis and gasification: State-of-the-art, challenges, and future directions. Prog. Energy Combust. Sci. 2021, 84, 100901. [Google Scholar] [CrossRef]
  8. Giordano, V.; Castagnoli, A.; Pecorini, I.; Chiarello, F. Identifying technologies in circular economy paradigm through text mining on scientific literature. PLoS ONE 2024, 19, e0312709. [Google Scholar] [CrossRef]
  9. Fan, S.-P.; Zakaria, S.; Chia, C.-H.; Jamaluddin, F.; Nabihah, S.; Liew, T.-K.; Pua, F.-L. Comparative studies of products obtained from solvolysis liquefaction of oil palm empty fruit bunch fibres using different solvents. Bioresour. Technol. 2011, 102, 3521–3526. [Google Scholar] [CrossRef]
  10. Bäckström, E.; Odelius, K.; Hakkarainen, M. Microwave Assisted Selective Hydrolysis of Polyamides from Multicomponent Carpet Waste. Glob. Chall. 2021, 5, 2000119. [Google Scholar] [CrossRef] [PubMed]
  11. Iwaya, T.; Sasaki, M.; Goto, M. Kinetic analysis for hydrothermal depolymerization of nylon 6. Polym. Degrad. Stab. 2006, 91, 1989–1995. [Google Scholar] [CrossRef]
  12. Silge, J.; Robinson, D. tidytext: Text mining and analysis using tidy data principles in R. J. Open Source Softw. 2016, 1, 37. [Google Scholar] [CrossRef]
  13. Bormann, A.; Albrecht, M.; Samlitschka, F. Process for the Recovery of ε-Caprolactam from Extract Water. U.S. Patent 9562008B2, 2017. [Google Scholar]
  14. ISO307:2019; Plastics—Polyamides—Determination of Viscosity Number. ISO: Geneva, Switzerland, 2019.
  15. Wu, H.-S.; Jone, H.-C. Kinetic Study and Characterization of Poly(acrylic acid) and Metal Oxide. Ind. Eng. Chem. Res. 1997, 36, 2006–2011. [Google Scholar] [CrossRef]
  16. Wahyu, M.E.; Damayanti, D.; Wu, H.S. Production, Characterization, and Application of KOH-Activated Biochar from Rice Straw for Azo Dye Adsorption. Biomass 2025, 5, 40. [Google Scholar] [CrossRef]
  17. Shukla, S.R.; Harad, A.M.; Mahato, D. Depolymerization of nylon 6 waste fibers. J. Appl. Polym. Sci. 2006, 100, 186–190. [Google Scholar] [CrossRef]
  18. Le, K. Textile recycling technologies, colouring and finishing methods. Solid Waste Services. Vancoover 2018, 23–50. [Google Scholar]
  19. Socrates, G. Infrared and Raman Characteristic Group Frequencies: Tables and Charts; John Wiley & Sons: Hoboken, NJ, USA, 2004. [Google Scholar]
  20. Bondarev, D.; Trhlíková, O.; Sedláček, J.; Vohlídal, J. Stability of MEH-PPV: Poly{[2-methoxy-5-(2-ethylhexyloxy)-1,4-phenylene]vinylene} in solutions exposed to air in the dark and at daylight at laboratory temperature. Polym. Degrad. Stab. 2014, 110, 129–136. [Google Scholar] [CrossRef]
  21. Pockett, J. Crystallinity in Linear Polyamides: A Study Using Melt Blending with Small-Molecule Diluents. Ph.D. Thesis, University of South Australia, Mount Gambier, Australian, 2004. [Google Scholar]
  22. Khanna, Y.P. Overview of transition phenomenon in nylon 6. Macromolecules 1992, 25, 3298–3300. [Google Scholar] [CrossRef]
  23. Rae, P.; Brown, E.; Orler, E. The mechanical properties of poly (ether-ether-ketone)(PEEK) with emphasis on the large compressive strain response. Polymer 2007, 48, 598–615. [Google Scholar] [CrossRef]
  24. Slopiecka, K.; Bartocci, P.; Fantozzi, F. Thermogravimetric analysis and kinetic study of poplar wood pyrolysis. Appl. Energy 2012, 97, 491–497. [Google Scholar] [CrossRef]
  25. Kissinger, H.E. Variation of peak temperature with heating rate in differential thermal analysis. J. Res. Natl. Bur. Stand 1956, 57, 217–221. [Google Scholar] [CrossRef]
  26. Hu, S.; Jess, A.; Xu, M. Kinetic study of Chinese biomass slow pyrolysis: Comparison of different kinetic models. Fuel 2007, 86, 2778–2788. [Google Scholar] [CrossRef]
  27. Flynn, J.H.; Wall, L.A. A quick, direct method for the determination of activation energy from thermogravimetric data. J. Polym. Sci. Part B Polym. Lett. 1966, 4, 323–328. [Google Scholar]
  28. Akahira, T. Trans. Joint convention of four electrical institutes. Res. Rep. Chiba Inst. Technol. 1971, 16, 22–31. [Google Scholar]
  29. Lim, A.C.R.; Chin, B.L.F.; Jawad, Z.A.; Hii, K.L. Kinetic analysis of rice husk pyrolysis using Kissinger-Akahira-Sunose (KAS) method. Procedia Eng. 2016, 148, 1247–1251. [Google Scholar] [CrossRef]
  30. Eimontas, J.; Striūgas, N.; Abdelnaby, M.A.; Yousef, S. Catalytic pyrolysis kinetic behavior and TG-FTIR-GC–MS analysis of metallized food packaging plastics with different concentrations of ZSM-5 zeolite catalyst. Polymers 2021, 13, 702. [Google Scholar]
  31. Klun, U.; Kržan, A. Rapid microwave induced depolymerization of polyamide-6. Polymer 2000, 41, 4361–4365. [Google Scholar] [CrossRef]
  32. Sato, O.; Ikushima, Y. Noncatalytic organic synthesis of ε-caprolactam and decomposition of nylon 6 using supercritical water. Kobunshi Ronbunshu 2001, 58, 533–540. [Google Scholar]
  33. Chen, J.; Liu, G.; Jin, L.; Ni, P.; Li, Z.; He, H.; Xu, Y.; Zhang, J.; Dong, J. Catalytic hydrolysis of waste nylon 6 to produce ɛ-caprolactam in sub-critical water. J. Anal. Appl. Pyrolysis 2010, 87, 50–55. [Google Scholar] [CrossRef]
  34. Kumar, A.; von Wolff, N.; Rauch, M.; Zou, Y.-Q.; Shmul, G.; Ben-David, Y.; Leitus, G.; Avram, L.; Milstein, D. Hydrogenative depolymerization of nylons. J. Am. Chem. Soc. 2020, 142, 14267–14275. [Google Scholar] [CrossRef]
  35. Kim, S.; Lee, N.; Lee, J. Pyrolysis for nylon 6 monomer recovery from teabag waste. Polymers 2020, 12, 2695. [Google Scholar] [CrossRef]
  36. Kamimura, A.; Yamamoto, S. An efficient method to depolymerize polyamide plastics: A new use of ionic liquids. Org. Lett. 2007, 9, 2533–2535. [Google Scholar] [CrossRef] [PubMed]
  37. Yuan, X.-X.; Zhou, Q.; Li, X.-Y.; Yang, P.; Yang, K.-K.; Wang, Y.-Z. Degradation of nylon 6 to produce a “pseudo” amino acid ionic liquid. Polym. Degrad. Stab. 2014, 109, 171–174. [Google Scholar] [CrossRef]
  38. Wang, W.; Meng, L.; Leng, K.; Huang, Y. Hydrolysis of waste monomer casting nylon catalyzed by solid acids. Polym. Degrad. Stab. 2017, 136, 112–120. [Google Scholar] [CrossRef]
Figure 1. Pathways for CPL polymerization into PA6 via polycondensation and ring-opening polymerization.
Processes 13 03175 g001
Figure 2. Process overview of (a) PA6 production, (b) CPL recovery from extract water, and (c) hydrolytic degradation of oligomeric wastes in this study.
Processes 13 03175 g002
Figure 3. Representative PA6 waste feedstocks: WS-24, WS-13, C-fiber, and C-resin.
Processes 13 03175 g003
Figure 4. FTIR spectra of PA6 feedstocks showing differences in functional groups. (a) C-fiber, (b) C-resin, (c) WS-13, (d) WS-24.
Processes 13 03175 g004
Figure 5. Thermal decomposition profiles of PA6 feedstocks: (a) TG curves, (b) DTG curves.
Processes 13 03175 g005
Figure 6. DSC thermograms of PA6 feedstocks showing melting and crystallization transitions. (a) WS-24, (b) WS-13, and (c) C-resin (d) C-fiber.
Processes 13 03175 g006
Figure 7. KSA plot of polycaprolactam for different values of conversion.
Processes 13 03175 g007
Figure 8. The apparent activation energy at different conversion rates (a) WS-24, (b) WS-13, (c) C-fiber, (d) C-resin.
Processes 13 03175 g008
Figure 9. Comparison of acid types on PA6 (WS-13) depolymerization efficiency. WS-13 = 10 g; T= 200 °C; t = 1 h; H3PO4 = 10 g; volume of water 10 mL.
Processes 13 03175 g009
Figure 10. Influence of reaction time on the degradation efficiency of different PA6 feedstocks using phosphoric acid. PA6 mass = 10 g; T = 200 °C; t = 1 h; H3PO4 = 5 g; volume of water 5 mL.
Processes 13 03175 g010
Figure 11. Effect of phosphoric acid dosage on the residual fraction of WS-13 after hydrolysis.
Processes 13 03175 g011
Figure 12. Time–temperature dependence of PA6 feedstocks conversion during phosphoric acid-catalyzed depolymerization (a) C-resin (b) C-fiber (c) WS-13 and (d) WS-24 PA6: 10 g; acid = 10 g; power = 400 W; volume of H2O = 10 mL).
Processes 13 03175 g012
Figure 13. Arrhenius plots and activation energy determination for PA6 degradation with phosphoric acid for different kinds of PA6.
Processes 13 03175 g013
Figure 14. Surface Morphology of Raw PA6 Feedstocks Observed via SEM Imaging (a) C-fiber, (c) C-resin, (e) WS-13, and (g) WS-24, and solid residue after phosphoric acid hydrolysis at 150 °C for 15 min (b) C-fiber, (d) C-resin, (f) WS-13, and (h) WS-24.
Processes 13 03175 g014
Figure 15. Thermal stability analysis of PA6 before and after hydrolysis, using TGA (a) C-fiber (b) C-resin (c) WS-13 (d) WS-24.
Processes 13 03175 g015
Table 1. Physicochemical and thermal properties of PA6 feedstocks.
TypeMwRVMoisture Content (%)TGADSC
Ti (°C)Tp (°C)Residue (%)Tm (°C)Tc (°C)
WS-2413631.4721.82573028.90127138
WS-1372681.665.602753234.38192163
C-fiber12,5832.152.563674220.03217166
C-resin16,0552.471.823724360.52235168
Table 2. Thermal transition parameters (Tm, Tc, ΔHm, ΔHc) of PA6 feedstocks determined by DSC.
TypeTm (°C)Tc (°C)ΔHm (J/g)ΔHc (J/g)
WS-24127−1384.17−5.20
WS-13192−16327.3−42.0
C-fiber235−16825.7−52.9
C-resin218−16651.9−52.8
Table 3. First-order rate constants of PA6 feedstocks at different temperatures during acid hydrolysis from Arrhenius plots.
Typek (1/min)ln kT (K)1/T (1/K)R2
WS-240.0011−4.2003980.00250.986
0.0028−2.9004230.00240.917
0.0079−2.0004480.00220.912
0.0151−1.7004730.00210.992
WS-130.0068−6.0003980.00250.962
0.0229−4.8004230.00240.998
0.0609−3.8004480.00220.998
0.0808−3.3004730.00210.971
C-fiber0.0010−6.8103980.00250.667
0.0240−3.7404230.00240.967
0.0950−2.3504480.00220.899
0.1410−1.9504730.00210.591
C-resin0.0010−6.9083980.00250.781
0.0200−3.9124230.00240.932
0.0230−3.7944480.00220.766
0.094−2.3614730.00210.931
Table 4. Activation energies of various PA6 types calculated from Arrhenius plots under H3PO4.
PA6Ea (kJ/mol)R2±SD (kJ mol−1)
WS-2456.50.98±2.1
WS-1353.10.91±1.8
C-fiber99.90.91±3.5
C-resin87.10.90±2.9
Table 5. Hydrolysis yields of WS-24 under various temperature and time conditions.
T (°C)Time (min)Conversion Degradation (%)Yield (ACA + CPL)Yield ACA (%)Yield CPL (%)
1253010.88.698.350.35
4512.88.848.090.75
6013.28.877.611.26
1501530.222.120.81.3
3051.934.132.71.4
4569.457.356.50.8
6070.255.454.70.7
175156634.533.151.35
3086.140.338.841.46
4587.756.255.360.84
6088.95756.190.81
2001586.542.139.652.45
3099.745.442.892.51
4599.958.256.51.7
6099.96261.141.26
Reaction conditions: WS-24 = 10 g; H3PO4 = 10 g; Power = 400 watt; H2O = 10 mL.
Table 6. Hydrolysis product yields of WS-13 at different reaction conditions using Phosphoric Acid.
T (°C)Time (min)Conversion Degradation (%)Yield (ACA + CPL)Yield ACA (%)Yield CPL (%)
125303.41.61.60
453.94.34.30
6021.14.64.60
1501522.275.71.3
3022.77.216.11.1
4532.75.24.90.3
6034.15.044.90.14
1751549.84.97.20
3057.559590
4562.159410
6070.841280.2
2001572.128.227.30.9
3074.362430.01
4581.362.44616.4
6082.358.1562.03
Reaction conditions: WS-13 = 10 g; H3PO4 = 10 g; power = 400 watt; H2O = 10 mL.
Table 7. Degradation Efficiency of C-Resin under Varying Thermal Conditions with Phosphoric Acid.
T (°C)Time (min)Conversion Degradation (%)Yield (ACA + CPL)Yield ACA (%)Yield CPL (%)
1253010.84.34.20.1
4512.84.34.30
6013.24.44.30.1
1501530.25.85.60.2
3051.97.37.20.1
4569.47.77.30.5
6070.27.47.30.1
175156610.310.10.2
3086.139.939.60.3
4587.737.837.60.2
6088.942.842.60.2
2001585.515.314.11.2
3099.445.944.61.3
4599.748.146.71.4
6099.953.850.73.1
Reaction condition: C-Resin = 10 g; H3PO4 = 10 g; Power = 400 watt; H2O = 10 mL.
Table 8. Product yields from phosphoric acid hydrolysis of C-fiber under different conditions.
T (°C)Time (min)Conversion Degradation (%)Yield (ACA + CPL)Yield ACA (%)Yield CPL (%)
1253010.20.20
4520.340.30
6054.534.50
1501530.313.2413.20
305513.01130.01
4571.533330
6073.644.05440.02
175156623.02230
3082.848.05480.05
4599.556.9956.90.12
6099.961.0160.90.12
2001580.260.2960.10.19
3082.866.3766.20.17
4599.569.05690.05
6099.969.769.50.2
Reaction condition: C-Fiber = 10 g; H3PO4 = 10 g; Power = 400 watt; H2O = 10 mL.
Table 9. Summary of chemical recycling of PA6 waste.
MaterialProduct (%)MethodCatalystT (°C)TimeSolid: SolutionRef.
PA677.9% CPLhydrolysisHPA33085 min1:15[33]
PA655% OligomerhydrogenativeRuthenium15048 h1:2.5[34]
Teabag waste59.2% CPLpyrolysis -700--[35]
PA6 plastic 86% CPLionic liquidsPP13 TFSI3006 h-[36]
PA685% ACAionic liquidsHCl, 30%10924 h-[37]
PA6 fiber93% ACAhydrolysisHCl, 30%904 h1:25[17]
PA685% CPLhydrothermal -36060 min -[11]
PA662.3% CPLhydrolysis3 g Hβ-2534530 min1:10[38]
PA6 carpet wastemonomerichydrolysis HCl 10%2003 h1:20[10]
WS-2462.0% (CPL + ACA)hydrolysisH3PO4 50%2001 h1:1This study
WS-1362.4% (CPL + ACA)hydrolysisH3PO4 50%2001 h1:1This study
C-fiber69.7% (CPL + ACA)hydrolysisH3PO4 50%2001 h1:1This study
C-resin53.8% (CPL + ACA)hydrolysisH3PO4 50%2001 h1:1This study
Disclaimer/Publisher’s Note: The statements, opinions and data contained in all publications are solely those of the individual author(s) and contributor(s) and not of MDPI and/or the editor(s). MDPI and/or the editor(s) disclaim responsibility for any injury to people or property resulting from any ideas, methods, instructions or products referred to in the content.