1. Introduction
Mexico, with its extensive oil reserves, is an important player in global energy production, where petroleum refining remains a crucial driver of economic growth and national energy security [
1]. The country’s petroleum industry not only contributes significantly to revenue and employment, but also plays a vital role in meeting domestic energy demands, with the production and export of petroleum products being a crucial component of Mexico’s economic stability [
2]. According to the global assessment of heavy oil and oil sands, Mexico is one of the leading producers of heavy crude oil in North America, with a large share of its offshore Gulf of Mexico output classified as heavy grades. Similarly, Venezuela’s Orinoco Belt represents the largest accumulation of extra-heavy oil worldwide, while Brazil’s Campos Basin also produces significant volumes of heavy crude. These resources are characterised not only by high density, but also by substantial sulphur, salt, and metal content, which complicate processing and refining. Such characteristics make heavy oils strategic for Latin America and other regions with comparable deposits, as technological advances have improved the feasibility of their exploitation despite their environmental and operational challenges. Consequently, while the present study emphasises the Mexican refining context, its conclusions are relevant to other heavy-oil producing regions with similar feedstock characteristics [
3].
In this context, delayed coking technology (DCU) has emerged as an indispensable refining strategy, particularly for processing heavy Mexican crude [
4,
5]. This thermal cracking process transforms low-value vacuum residues into high-value light fractions, such as gasoline, diesel, and petroleum coke [
4,
6]. The process involves subjecting the feedstock to high temperatures in a specialised coker unit, breaking down complex hydrocarbon molecules into lighter and more valuable components [
7]. Given its economic importance, optimising the DCU is essential to improve profitability, energy efficiency, and sustainability within the Mexican refining sector. Beyond product optimisation, delayed coking also plays a crucial role in achieving environmental and sustainability objectives by allowing the reduction of sulphur content and the production of cleaner fuels [
8,
9,
10]. Furthermore, the production of petroleum coke as a byproduct offers additional economic opportunities, finding applications in industries such as cement manufacturing, power generation, and aluminium production, thus diversifying energy sources and promoting a circular economy [
11,
12]. From a chemical engineering perspective, achieving process sustainability requires a holistic approach that rigorously evaluates performance when modifying existing processes or designing new ones. This comprehensive evaluation is a crucial decision-making tool that objectively determines whether the changes implemented genuinely push the process toward a more sustainable future. Consequently, the development of robust and reliable sustainability indicators becomes paramount. Ruiz-Mercado et al. [
13,
14] present a taxonomic classification of sustainability indicators that provide the necessary data and information to guide efforts and ensure that modifications demonstrably enhance the environmental, economic, and social footprint of the process. One such technology warranting a comprehensive sustainability assessment is delayed coking.
Recent advances in process systems engineering have enabled the use of chemical process simulation tools, such as Aspen Plus
®, to analyse and optimise delayed coking processes [
12,
15,
16,
17]. These simulators offer robust thermodynamic models and integration with optimisation frameworks that facilitate reactor design, energy integration, and operational improvements [
18,
19]. When integrated with multi-objective optimisation techniques—particularly the
-constraint method—researchers can systematically evaluate trade-offs between economic, operational, and environmental criteria [
18]. Al-Sharrah et al. [
20] further highlight the importance of key sustainability indicators for the petrochemical industry, covering the environment, economy, and safety, and integrating these metrics into optimisation models to identify balanced networks. Mateos and Montiel report a study using Aspen HYSYS to analyse the Delayed Coker Unit at the Minatitlán Refinery, focussing on improving operational practices. The objective was to optimise product yields and quality by manipulating key process variables, including crude Maya feed and slurry recirculation in Mexico. The study highlights how such modelling efforts can contribute to improving overall plant performance, ensuring reliable fulfilment of national demand, and minimising operational costs [
21].
The application of Aspen Plus
® in conjunction with the
-constraint method for multi-objective optimisation (MOO) is a well-established approach in process systems engineering, widely documented across various chemical processes. For example, this methodology has been effectively employed in the socioecoefficient conversion of lignocellulosic biomass to biofuels and bioproducts [
22], as demonstrated by a study that integrated social, environmental, and economic criteria within a process superstructure, using Aspen Plus
® for the evaluation of energy balance and GAMS for the solution of the resulting Mixed-Integer Nonlinear Programming problem using the
-constraint method. Similarly, multi-objective optimisation of integrated biodiesel production and separation systems has used Aspen Plus
® for process simulation and MOO to identify trade-offs between performance indices, such as maximising the concentration of fatty acid methyl ester and minimising the cost of reactor energy [
23]. Furthermore, Liu et al. optimised the separation process of a FCC unit using Aspen Plus
®. An improved NSGA-II algorithm is used to maximise the yield of LPG and gasoline while minimising energy consumption. The results show a yield increase and a significant reduction in energy consumption. The findings confirm the effectiveness of this multi-objective optimisation method for industrial petrochemical processes [
24]. These studies collectively underscore the versatility and efficacy of combining Aspen Plus
® simulation with the
-constraint and other methods for addressing complex multi-objective optimisation problems in chemical process design and operation.
In this study, we apply sustainability indicators, focussing on mass efficiency, economic, energy, and social aspects, to evaluate the sustainability of a simulated delayed coking plant in Aspen Plus® v.12.1. We used operating data from a real DCU that processed heavy Mexican crude. A multiobjective optimisation strategy is employed to identify process configurations that balance product quality, environmental performance (e.g., Global Warming Potential, GWP), and energy consumption (e.g., Specific Energy Intensity, SEI).
This paper contributes to the literature by integrating rigorous Aspen Plus® v.12.1 simulation, the -constraint method, and sustainability metrics to optimise a real-world DCU in Mexico. The novelty lies in combining these powerful tools with multi-criteria decision making to guide operational strategies that align with Mexico’s sustainability goals in the refining sector, ensuring maximum recovery of valuable products while managing coke generation and environmental performance through integrated separation and treatment stages.
2. Process Description
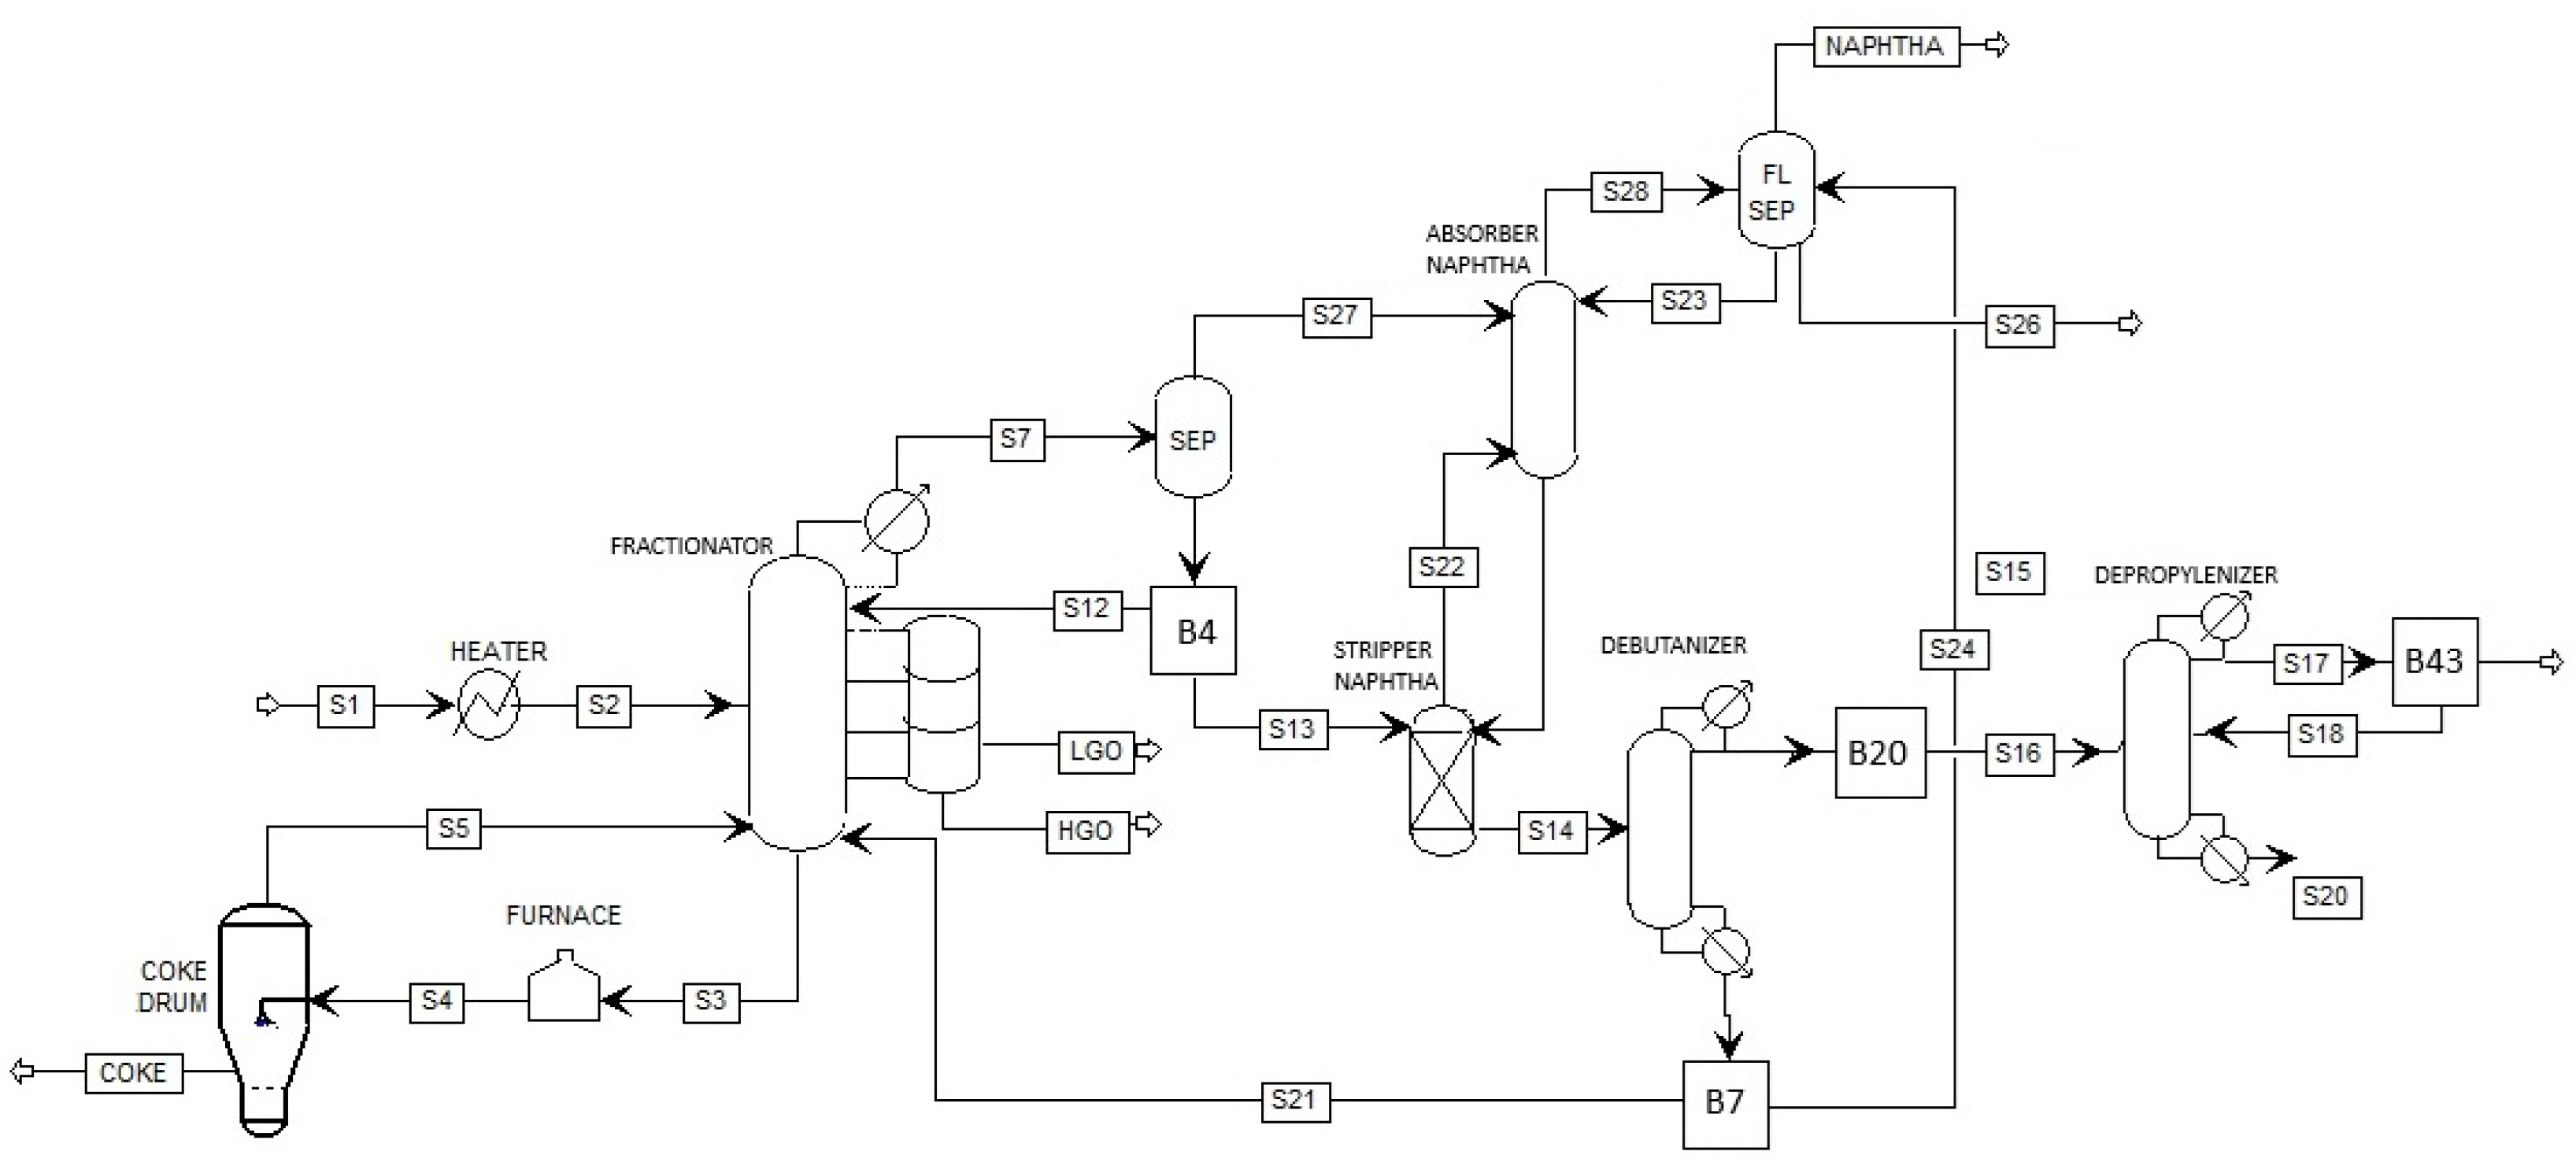
A simplified schematic of the delayed coking unit is presented in
Figure 1, highlighting the main subsystems and product draws used in this study. The complete and detailed process flow diagram employed for the Aspen Plus simulations is provided in
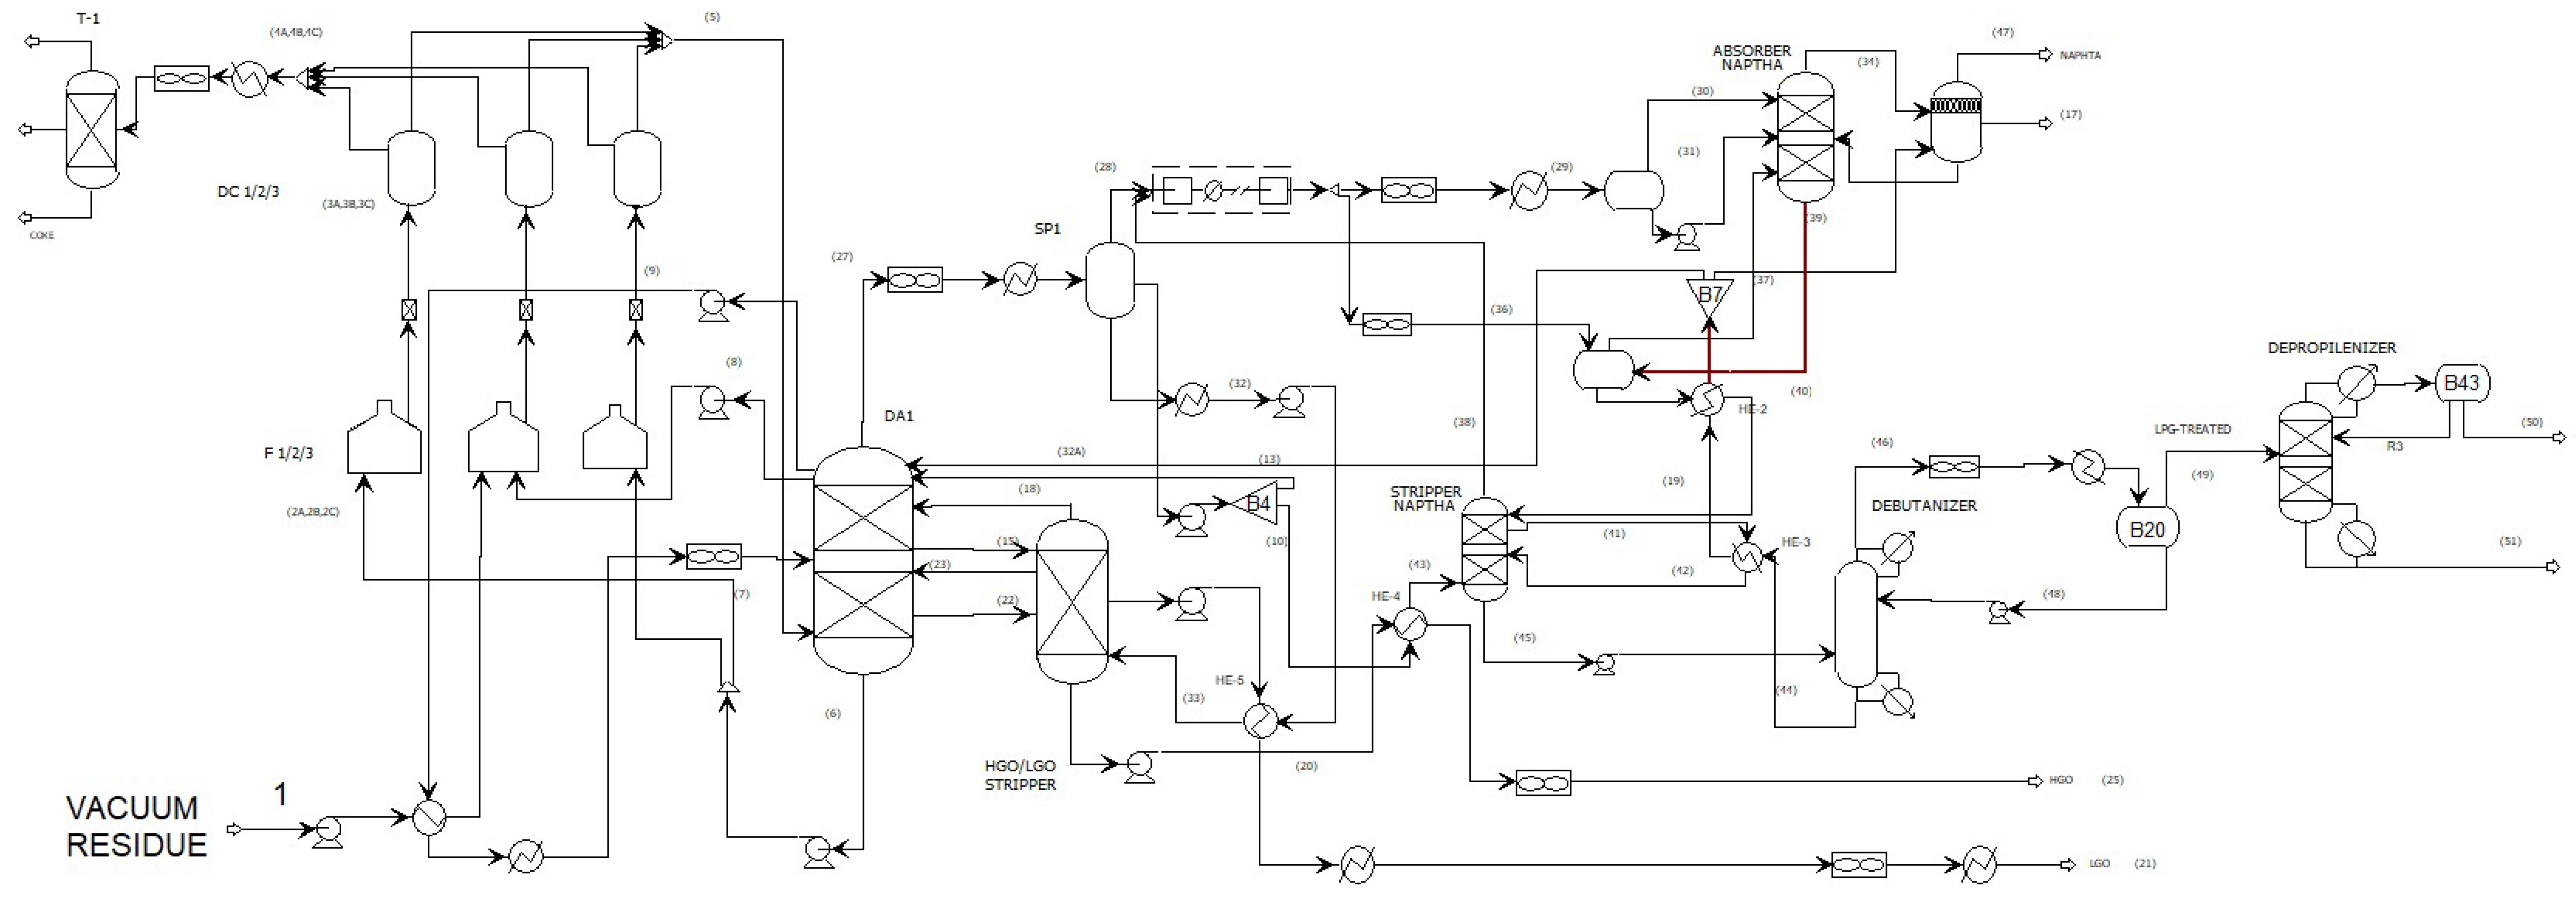
Appendix A for reference. The process involves a complex series of simultaneous thermal cracking and condensation reactions triggered at high temperatures. The hydrocarbon chains in the vacuum residue are broken into smaller fragments, which can undergo further cracking or condense to form a wide range of products, including gases, light hydrocarbon liquids, and heavier fractions. These reactions occur predominantly in the furnace at temperatures ranging from 200 to
°C and with short residence times before the feed enters the coke drums downstream.
The feedstock for the delayed coking unit (DCU) is vacuum residue from the Vacuum Distillation Unit, with detailed properties provided in
Section 5. The vacuum residue (stream 1) is first preheated to approximately
°C in a heat exchanger, then mixed with recirculated flash zone gas oil (FZGO) and fed to the bottom of the fractionator column. From there, it is continuously pumped into the furnace system to start cracking [
25].
The coker furnace consists of three cells (F1, F2, F3), each with dual-pass tubes. Each cell is equipped with rows of gas-fired burners that independently control flows in passes 2A, 2B, and 2C. High-pressure steam is injected into each inlet to ensure proper velocity and prevent premature coke formation inside the furnace tubes. Cracking begins here and vaporised products exit as streams 3A, 3B, and 3C, entering coke drums (DC1, DC2, DC3) where coking reactions are complete and solid coke accumulates.
The coke drums operate in a semi-batch cycle of approximately 16 h, involving phases of coking, steam stripping, cooling, and decoking. During decoking, one drum is taken offline, while the others remain in operation. The coke is discharged via streams 4A, 4B, and 4C.
The coke drum effluents (stream 5) are directed to the main fractionator, which serves three functions: (1) it balances the material in proportion to the recycle flows, (2) promotes vaporisation for the generation of intermediate products, and (3) provides heat integration by preheating fresh feed.
Within the fractionator column (DA1), three main product streams are drawn:
Heavy-Heavy Gas Oil (HHGO): Withdrawn from the bottom section (stream 6) at 385– °C, filtered to remove coke particles. Part of this stream is cooled and recycled to the fractionator (streams 26 and 27), while another portion generates medium pressure steam via feed preheat (stream 7).
Heavy Gas Oil (HGO): Withdrawn from the middle section (stream 22) at 330– °C, with a portion returned as reflux (stream 23). The remainder is cooled in double heat exchangers and directed for further processing or storage (stream 25).
Light Gas Oil (LGO): Withdrawn near the top of the column (stream 15) at 180– °C. The stream is heat exchanged via HE-1, stripped with steam, partially recycled (stream 16), and cooled for the handling of the final product (stream 21).
In this study, the term Heavy-Heavy Gas Oil (HHGO) is intentionally used to distinguish a fraction derived from the processing of very heavy Mexican crude oils. Unlike conventional Heavy Gas Oil (HGO), the HHGO stream reflects the specific characteristics of Mexican feedstocks, which are among the heaviest and most sulphur-rich in the Americas.
The overhead vapour from the fractionator (stream 27), rich in naphtha, is partially condensed in Separator SP1. Condensed hydrocarbons are refluxed (stream 13) and sent to the naphtha stripper via HE-4 (stream 10). The water (stream 32) is separated and sent for wastewater treatment.
SP1 separates the overhead into the vapour, liquid hydrocarbons, and aqueous phases. The hydrocarbon liquid (stream 43) is directed to the stripper, partially recycled (stream 42), and the vapour is processed in the input drum of the compressor and then compressed (stream 28).
Stream 28 undergoes cooling, heating, separation, and absorption, producing four final products: treated LPG, C3, C4, and stabilised naphtha. These are recovered in the Absorber, Debutanizer, and Depropanizer sections.
In the absorber, light mercaptans are removed using amine, and the liquid stream (stream 39) is heated in HE-2 and stripped (stream 40). The vapours contact lean sponge oil in the sponge oil absorber (stream 34) to absorb residual C5+ components.
The debutanizer removes butanes and lighter gases from the unstabilized naphtha. The overhead vapours (stream 46) are condensed and refluxed (stream 48). LPG is treated in the Amine Contactor and Caustic Treatment units to remove H2S and mercaptans.
The depropylenizer divides the treated stream C3/C4 (stream 48) into distinct streams of the products C3 (stream 50) and C4 (stream 51). The final cooling and condensation steps prepare the products for downstream use or storage.
This configuration ensures maximum recovery of valuable products while managing coke generation and environmental performance through integrated separation and treatment stages.
3. Methology and Strategy
The methodological framework of this study integrates detailed process simulation with multi-objective optimisation to evaluate and improve the sustainability of a delayed coking unit (DCU). The approach consists of three major stages: process modelling, sensitivity analysis [
26], and multi-objective constrained optimisation [
27,
28].
3.1. Process Simulation in Aspen Plus
In terms of the kinetic model for the coking reactions, it is important to clarify that this study did not include explicit mathematical modelling or kinetic validation of the reactor. Instead, we focused exclusively on simulating the downstream separation system. The coker-reactor effluent was treated as a fixed feed to the distillation column, enabling optimisation of the separation processes within a configuration comprising the main fractionator, side strippers, debutaniser, depropyleniser, and associated recovery columns. The characterisation of the feedstock and the unit operations was based on real operational data from refinery practice, including component cuts, pressure–temperature profiles, and product flow rates.
The simulation was performed under steady-state conditions with full specification of the physical properties and process constraints. The model was validated against known design specifications and product yields. Key output streams, including HGO, LGO, naphtha, butane, and propylene, were monitored for subsequent evaluation of sustainability metrics.
3.2. Definition of Sustainability Indicators
Five key sustainability indicators were used to assess the delayed coking process. The Global Warming Potential (GWP) represents the total mass of C
-equivalent emissions per unit of product, accounting for the cumulative contributions of C
, C
, and
O from combustion and process streams, where lower values indicate a reduced climate impact. Specific Energy Intensity (SEI) measures the net primary energy consumed per unit mass of product, expressed in kJ/kg, with an optimal reference point approaching 0 kJ/kg and the worst case reaching approximately 1.95 ×
kJ/kg. Mass Intensity (MI) is defined as the ratio of total mass input to useful product output, where the most sustainable performance is 1 kJ/kg and the least favourable case is 40 kJ/kg. Reaction Mass Efficiency (RME) reflects the proportion of feedstock effectively converted into desired products, ranging from 0 (least efficient) to 1 kg of product/kg of reagents (most efficient). Finally, Product Yield denotes the recovery of valuable intermediate fractions—such as light and heavy gas oils and naphtha—that constitute the primary high-value products of delayed coking technology and whose maximisation is essential to ensure both economic viability and process sustainability. These indicators were calculated using material and energy balances from the Aspen Plus simulation results
®. Additional classifications and complementary indicators can be consulted in the taxonomic work of Ruiz-Mercado et al. [
13,
14].
3.3. Sensitivity Analysis
To investigate the influence of key process variables on the distribution of products and sustainability indicators, a sensitivity analysis was performed using Aspen Plus
®. The analysis focused on four critical decision variables corresponding to mass splitters in the separation network: B4, B7, B20, and B43, which are illustrated in
Figure 1. These split fractions were systematically varied within feasible ranges defined by process constraints and industrial operation data. For each variation, the model was solved in steady state, and the resulting product yields (e.g., heavy gas oil, light gas oil, butenes, and propylene), energy consumption, and sustainability metrics (GWP, SEI, MI, and RME) were recorded. The sensitivity results revealed nonlinear effects and trade-offs in product recovery, highlighting operational intervals where selectivity and efficiency are maximised. Moreover, the feasible operating points obtained from this analysis provided consistent and realistic initial guesses for the subsequent multi-objective optimisation with the
-constraint method.
3.4. Multi-Objective Optimisation
Over the past few decades, numerous methods have been developed to address multi-objective optimisation (MOO) problems. Comprehensive reviews of these approaches can be found in key texts, such as those of Chen [
29] and Hakanen [
30]. Traditionally, MOO problems are often addressed through scalarization, typically by transforming the original problem into a single-objective optimisation problem, for example, using a weighted sum of objectives [
31]. This involves employing characteristic parameters, which can represent either the relative importance of objectives or serve as mathematical devices, to systematically vary and generate different Pareto-optimal solutions. However, from a practical standpoint, the user usually seeks a single, definitive solution. This introduces the crucial role of the decision maker, who is responsible for selecting the final solution from the set of optimal alternatives. Among the well-known methods used to solve the associated nonlinear programming problems, three prominent techniques are often highlighted: the Weighted Sum method and the
-constraint method, which involve an a priori articulation of preferences, and the Normal Boundary Intersection technique, which employs an a posteriori articulation of preferences. The
-constraint method was selected primarily due to its ease of implementation within a mathematical programming framework. Unlike metaheuristic approaches such as NSGA-II, the
-constraint method directly integrates with existing solvers for nonlinear programming problems, allowing for direct handling of the process’s intrinsic equality and inequality constraints. This approach also offers a systematic way to generate the Pareto front, providing a clear understanding of the trade-offs between objectives without the potential complexities associated with tuning algorithms or the limitations of the weighted-sum method to capture non-convex Pareto fronts [
32].
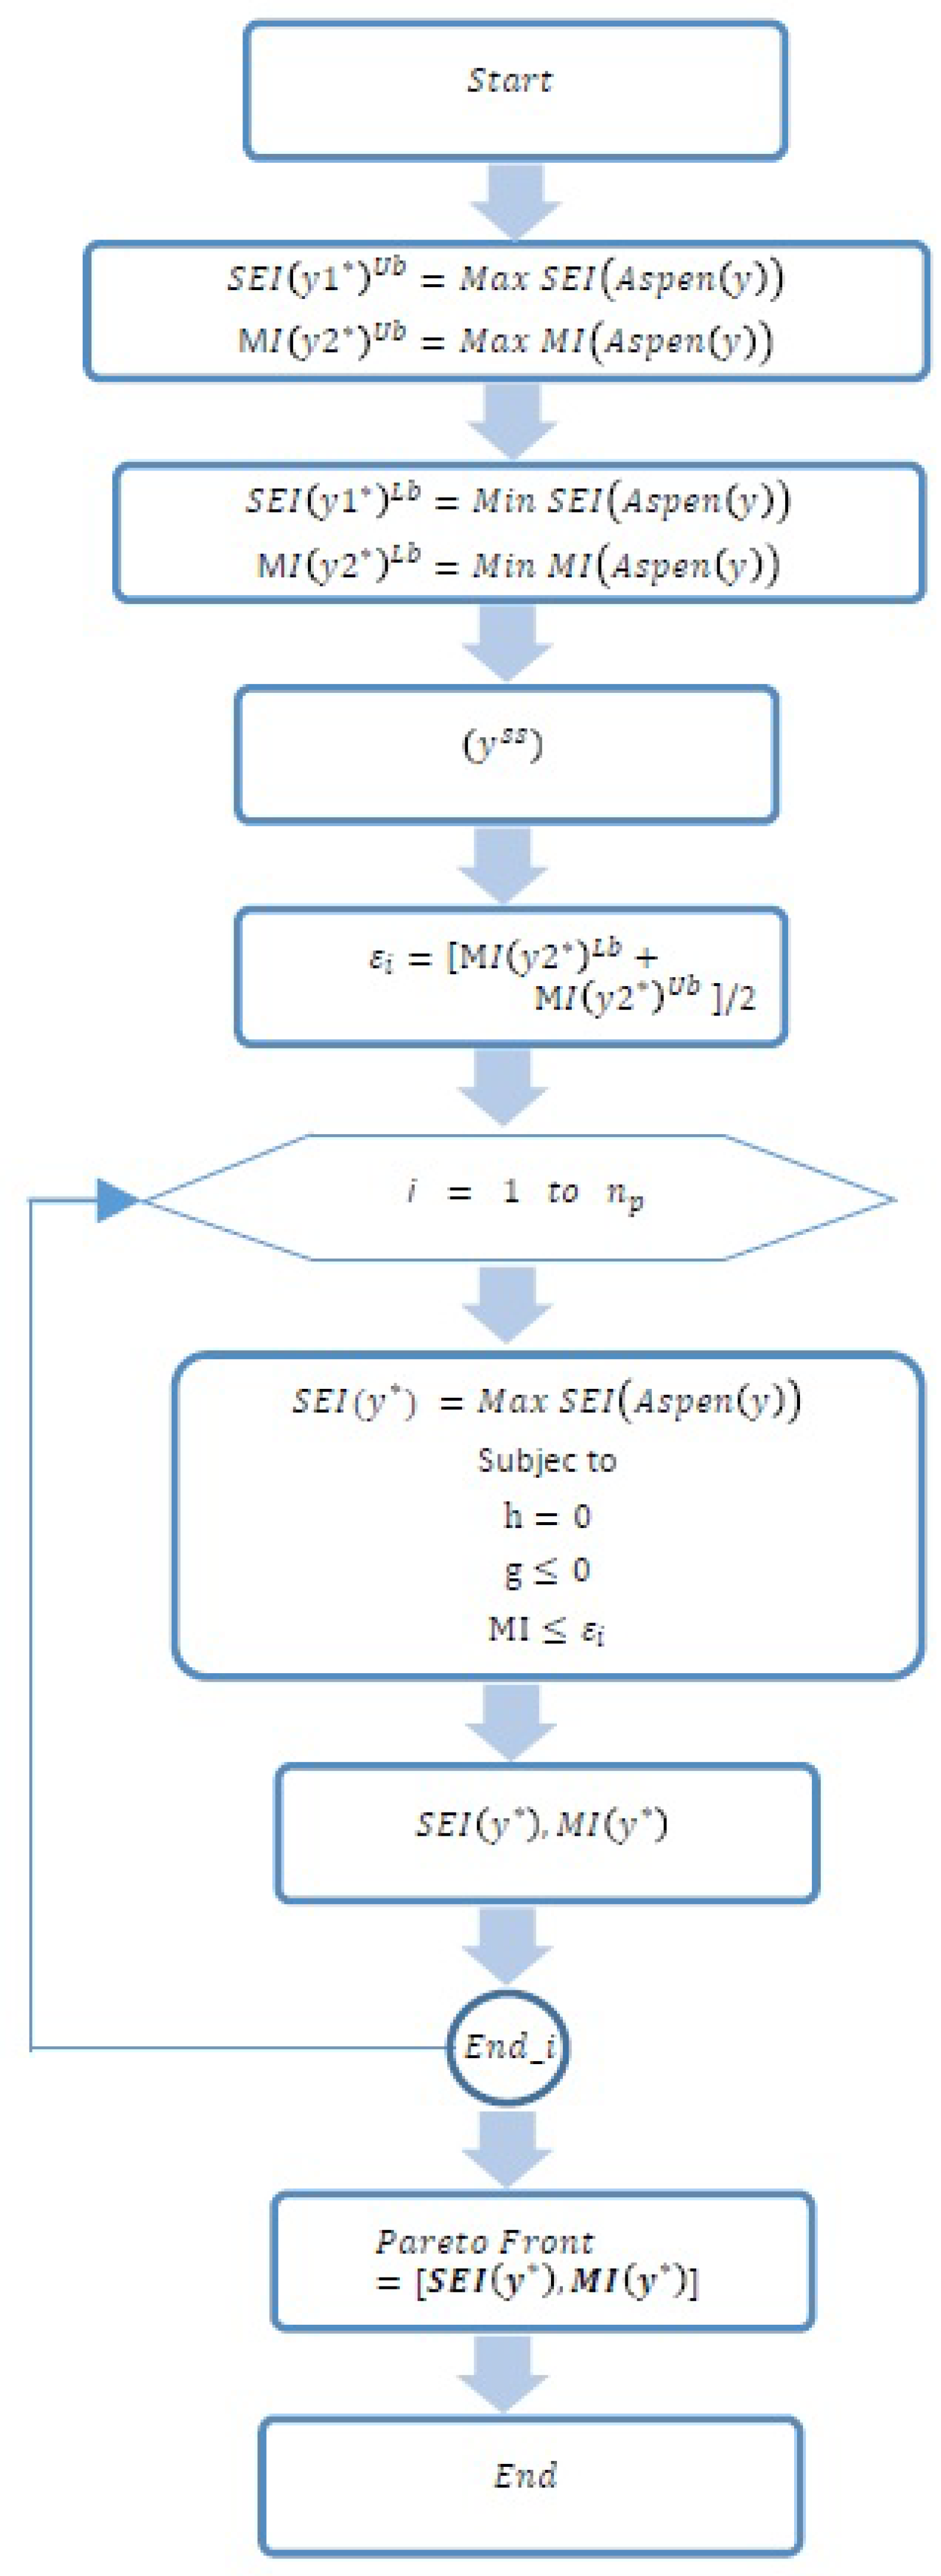
The main objective is to identify a Pareto-optimal operating point that improves sustainability without compromising product yield or operational feasibility. This efficient solution will be compared to the base case, demonstrating the potential of multiobjective optimisation as a tool for the design of sustainable refinery processes. The algorithm implemented to generate the Pareto frontier, illustrated in
Figure 2, is based on iterative calls to the Aspen Plus
® v.12.1 simulator. The simulation must start from a feasible solution at steady-state conditions (
), which is obtained directly from the Aspen Plus
® simulator. The
-constraint method was used to formulate the optimisation problem, where the SEI objective is minimised, while the MI objective is treated as an additional constraint with varying upper bounds
. The optimisation process, which employs the Sequential Quadratic Programming algorithm (SQP), operates as follows: first, the maximum and minimum values of the SEI and MI indicator are calculated to define the search limits. The problem is then solved repeatedly in Aspen Plus
® by varying the MI value from its lower bound
to its upper bound
. This procedure continues iteratively until a vector of dimension
is completed, which represents the discrete set of Pareto-efficient solutions. The decision variables considered include reflux ratios, separation temperatures, and recycle flows. Each solution on the Pareto front was evaluated on the basis of its proximity to the utopia point, representing the ideal (lowest) values of all objectives. The efficient solution, close to the utopia point, was selected for comparison with the base case. The radar plot will illustrate the comparative performance in all sustainability indicators.
4. Problem Definition for a Delayed Coking Plant
In the context of heavy crude oil refining, the delayed coking process is a key conversion unit that transforms low-value residues into higher-value products, such as gasoline-range hydrocarbons, light and heavy gas oils, and petroleum coke. Despite its economic advantages, the process is associated with high energy demand, significant carbon emissions, and the potential for excessive coke formation, making it an ideal candidate for the evaluation and optimisation of performance orientated to sustainability.
This study addresses the complex challenge of improving the environmental and energy performance of a Delayed Coking Unit (DCU) by integrating sustainability metrics into its operational strategy. Therefore, the scope of the present work is restricted to the optimisation of the downstream separation system, without modifying or assessing the reactor performance itself. This simplification provides a clear focus on the separation network and its contribution to sustainability improvements, but future studies should integrate reactor kinetics to capture the full behaviour of the delayed coking unit. The DCU in question processes vacuum residue and consists of a network of interconnected separation units, including a main fractionator, light and heavy gas oil strippers, and downstream columns, such as the debutanizer and depropylenizer. These units operate at high temperatures and pressures and are responsible for the recovery and purification of valuable product streams.
The goal of this research is to formulate and solve a Multi-Objective Optimisation Problem (MOOP) that improves the performance of the DCU with respect to five key sustainability indicators: Global Warming Potential (GWP)—a measure of greenhouse gas emissions per unit of product; Specific Energy Intensity (SEI), which represents the energy consumed to produce a unit mass of the product; Mass Intensity (MI)— the ratio of total material input to useful product output; Reaction Mass Efficiency (RME), which is the efficiency of conversion of feedstock into target products; and Product Yield.
The MOOP is expressed as follows:
where
y represents the set of decision variables, including reflux ratios, split fractions, and flow recycles throughout the unit. The equality constraints
ensure the consistency of the mass and energy balance, while the inequality constraints
define feasible operating ranges based on equipment limitations and process safety. The decision variables and constraints were identified through a sensitivity analysis, which helped to delimit the operational domain for optimisation.
This formulation enables the exploration of trade-offs between competing objectives, particularly between energy consumption and emissions reduction, under realistic process conditions. The ultimate goal is to identify a Pareto-optimal operating point that improves sustainability performance without compromising product yield or operational feasibility. This efficient solution forms the basis for comparison with the base case and demonstrates the potential of multiobjective optimisation as a tool for the design of sustainable refining processes.
5. Results and Discussion
The results presented and discussed in this section were obtained by applying the methodology described in the
Section 3. Specifically, the simulation and optimisation framework developed in Aspen Plus
® was used in conjunction with sustainability indicators to evaluate the performance of the delayed coking unit (DCU). Sensitivity analysis and multi-objective optimisation were formulated on the basis of operational variables and boundary conditions identified earlier. The key process and performance data used in this evaluation are summarised in
Table 1,
Table 2 and
Table 3, which include the thermodynamic operating ranges of the main equipment (
Table 2), the flow rates and compositions of the product under nominal and optimised conditions (
Table 3), and the numerical values of the sustainability indicators used for comparison (
Table 1). These tables serve as the foundation for the quantitative and qualitative analysis that follows, providing insights into the impact of optimisation on energy consumption, environmental performance, and material efficiency within the DCU.
The delayed coking unit (DCU) simulation developed in Aspen Plus® reflects the complexity and interdependence of thermal cracking and multicomponent separation required for the upgrading of heavy crude oil. This section presents a detailed analysis of the behaviour of the process under nominal and optimised conditions, as well as the implications for energy and environmental performance.
5.1. Sensitivity Analysis and Operating Domain
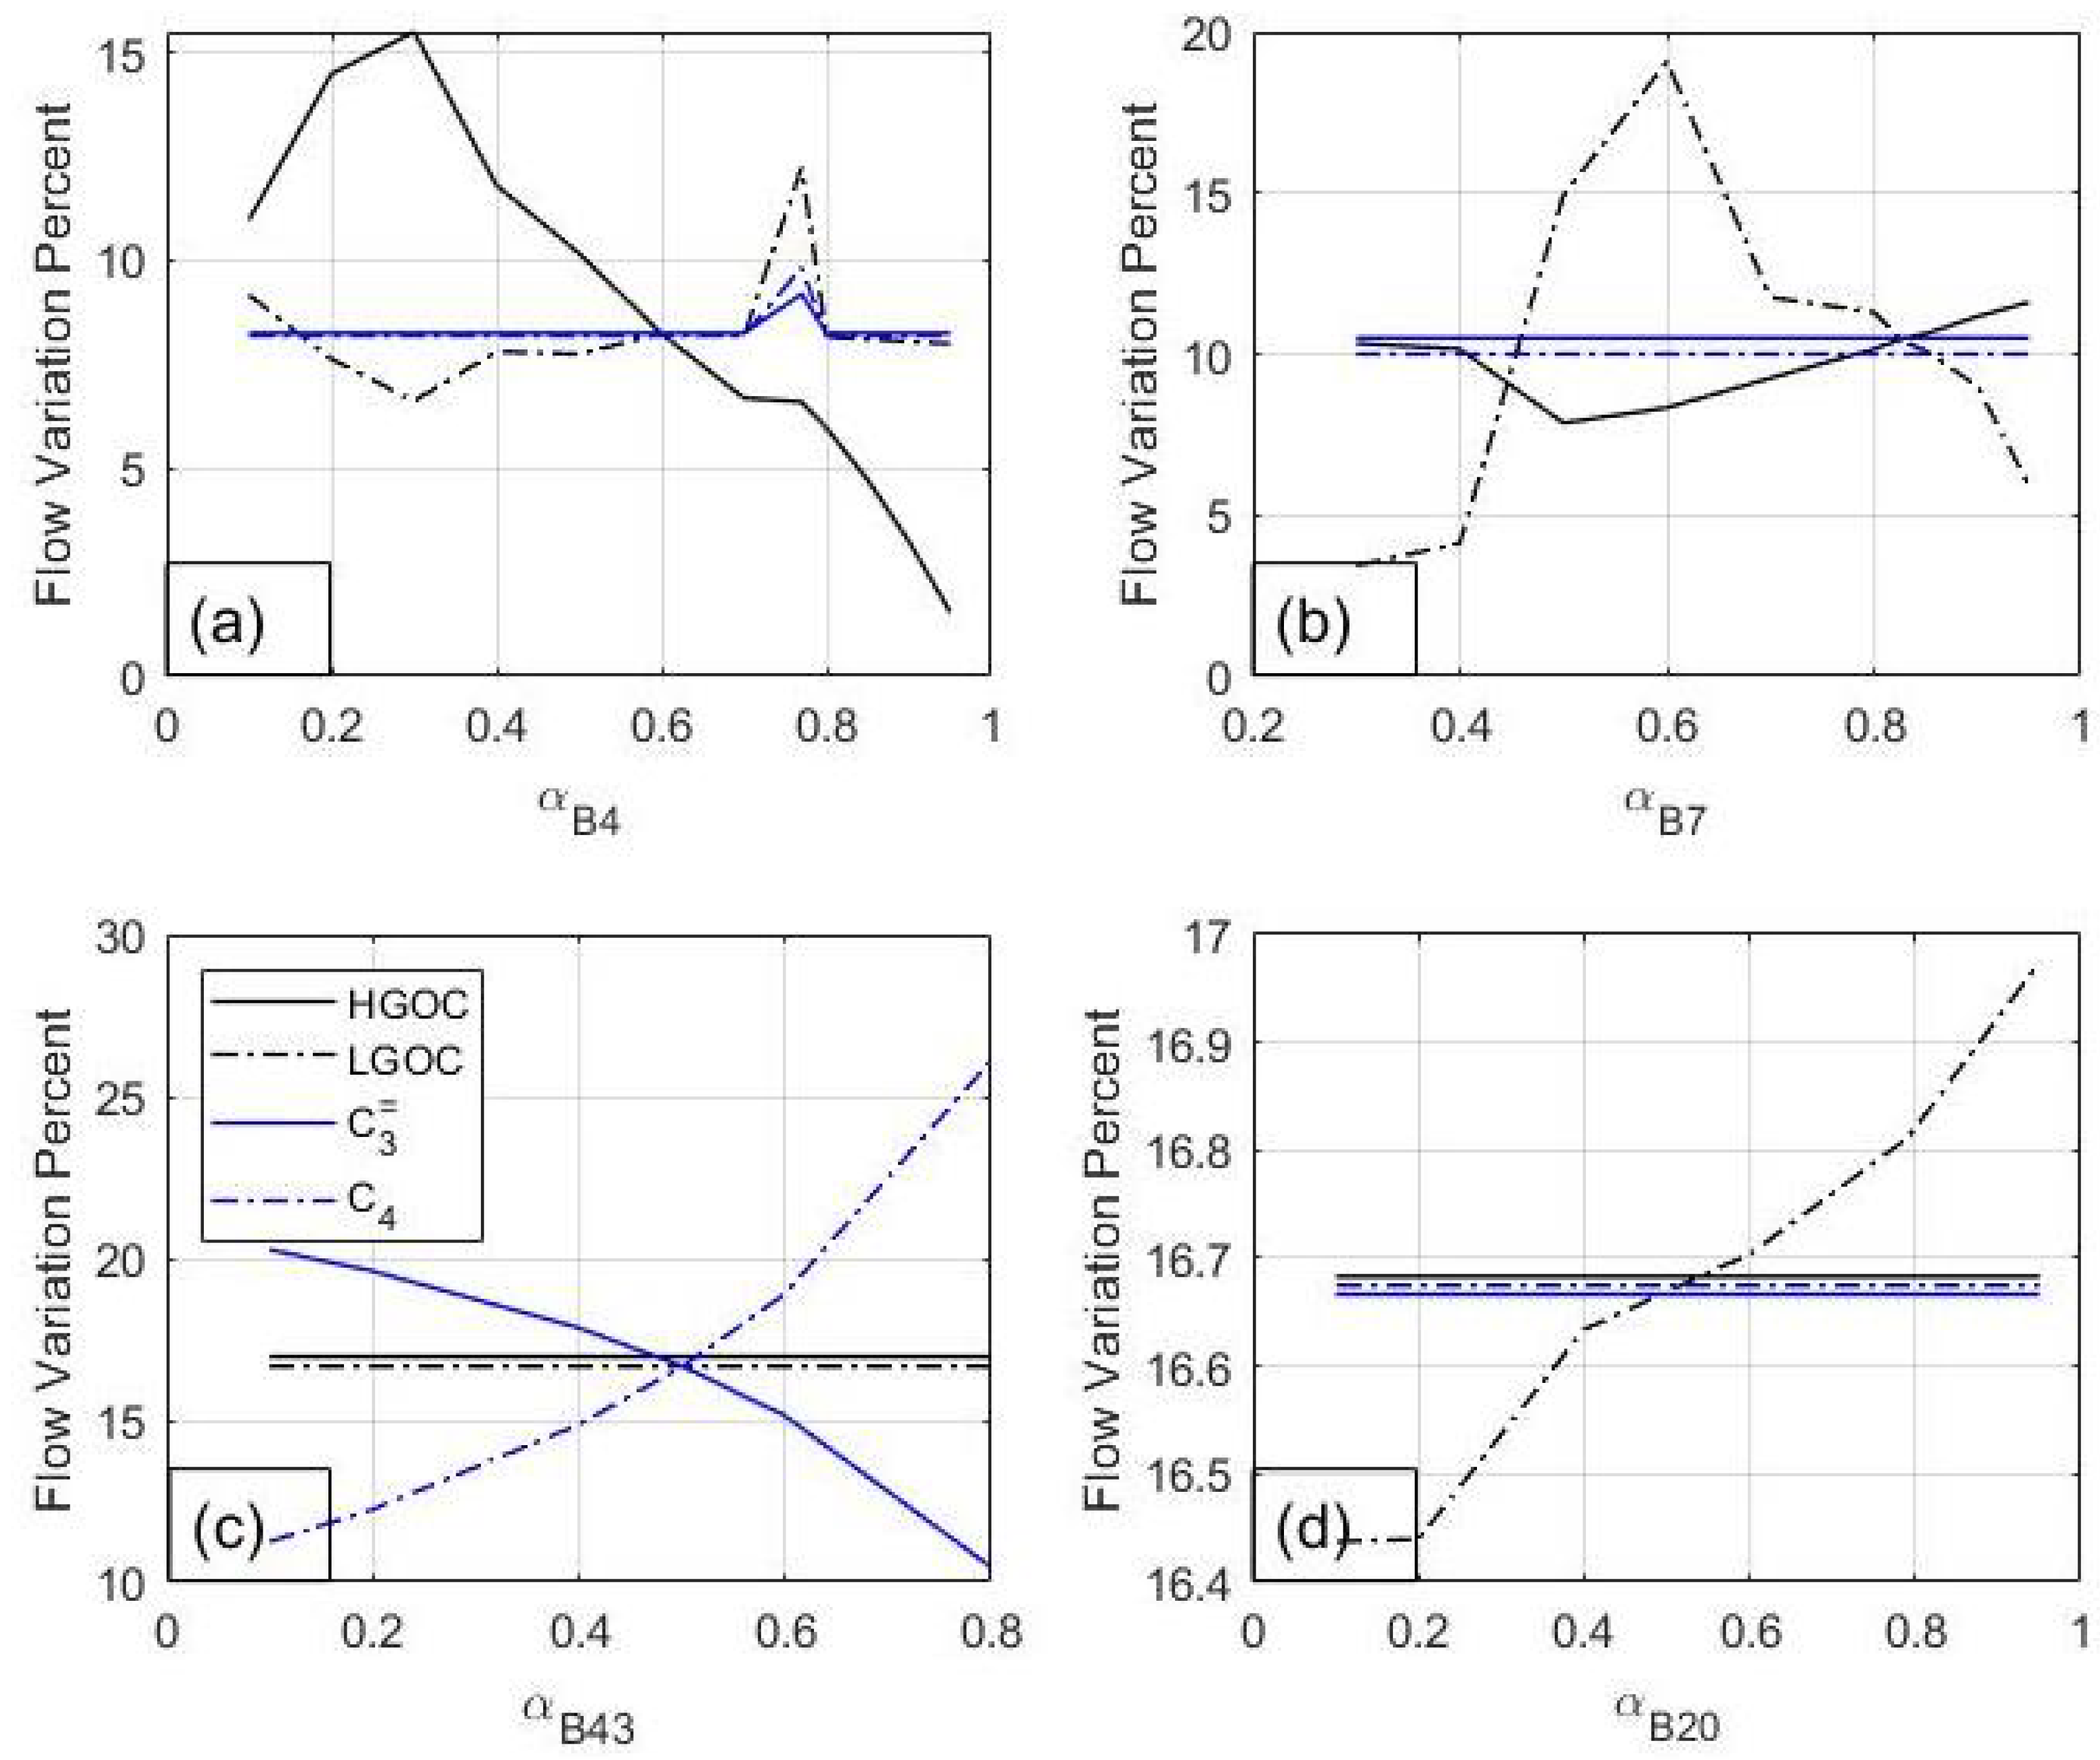
Figure 3 presents the results of the sensitivity analysis performed on key mass reflux variables in the network of splitters and distillation columns. These variables, particularly the reflux split fractions labelled
,
,
, and
, significantly influence the distribution of four target products: heavy gas oil (HGO), light gas oil (LGO), butane (C
4), and propylene (
). The sensitivity curves highlight nonlinear relationships between reflux distribution and product yields, where specific ranges of the split fractions yield higher selectivity and recovery efficiencies.
In
Figure 3a, corresponding to
, the maximum production of HGO is observed at a value of 0.2, while LGO reaches its minimum at this point and achieves the maximum yield at
= 0.7. Similarly, propylene and C
4 exhibit yield peaks in the range of 0.2 to 0.8. This behaviour suggests that
, should be considered a critical decision variable in the nonlinear programming formulation, with bounds from 0.2 to 0.8, when applying the SQP optimisation algorithm embedded in Aspen Plus
®. For
Figure 3b, related to
, favourable levels of HGO and LGO production are observed when the split fraction is between 0.4 and 0.85. In this case, the sensitivity of
and C
4 is negligible, as their flow variations remain essentially constant throughout the range. This stability can help simplify the optimisation formulation when these components are not primary objectives. In
Figure 3c, which explores the effect of
, an inverse relationship is observed between the production of propylene and C
4. As
increases, the flow of
decreases while C
4 increases, clearly justifying the need for a multiobjective optimisation approach. This antagonistic behaviour between the two light hydrocarbon products necessitates the identification of trade-off solutions that simultaneously maximise selectivity while meeting sustainability constraints. Based on the sensitivity response,
is recommended to vary within the range of 0.1 to 0.8 in the optimisation domain. Lastly,
Figure 3d shows the behaviour of
, where a very low sensitivity is detected. LGO flow varies by less than 0.5%, and no significant variation is observed for the other three products. Therefore,
has limited impact and can be fixed or excluded as a decision variable in the optimisation model.
In general, the analysis demonstrates that careful selection of decision variables based on sensitivity responses is essential for defining an effective search space in nonlinear and multi-objective optimisation. It helps reduce computational complexity while focussing optimisation efforts on the variables that have the greatest impact on process performance and product recovery. In particular, the results highlight that the adjustment of reflux flows and split ratios in the main columns plays a decisive role in shaping product yields and sustainability indicators, and the presentation of these operational details is valuable for refinery operators as it provides clear guidance on which parameters can be practically adjusted to achieve measurable improvements in energy efficiency, emissions reduction, and product distribution without requiring major process modifications.
5.2. Behaviour of the Fractionator Column and Interaction with the Separator Units
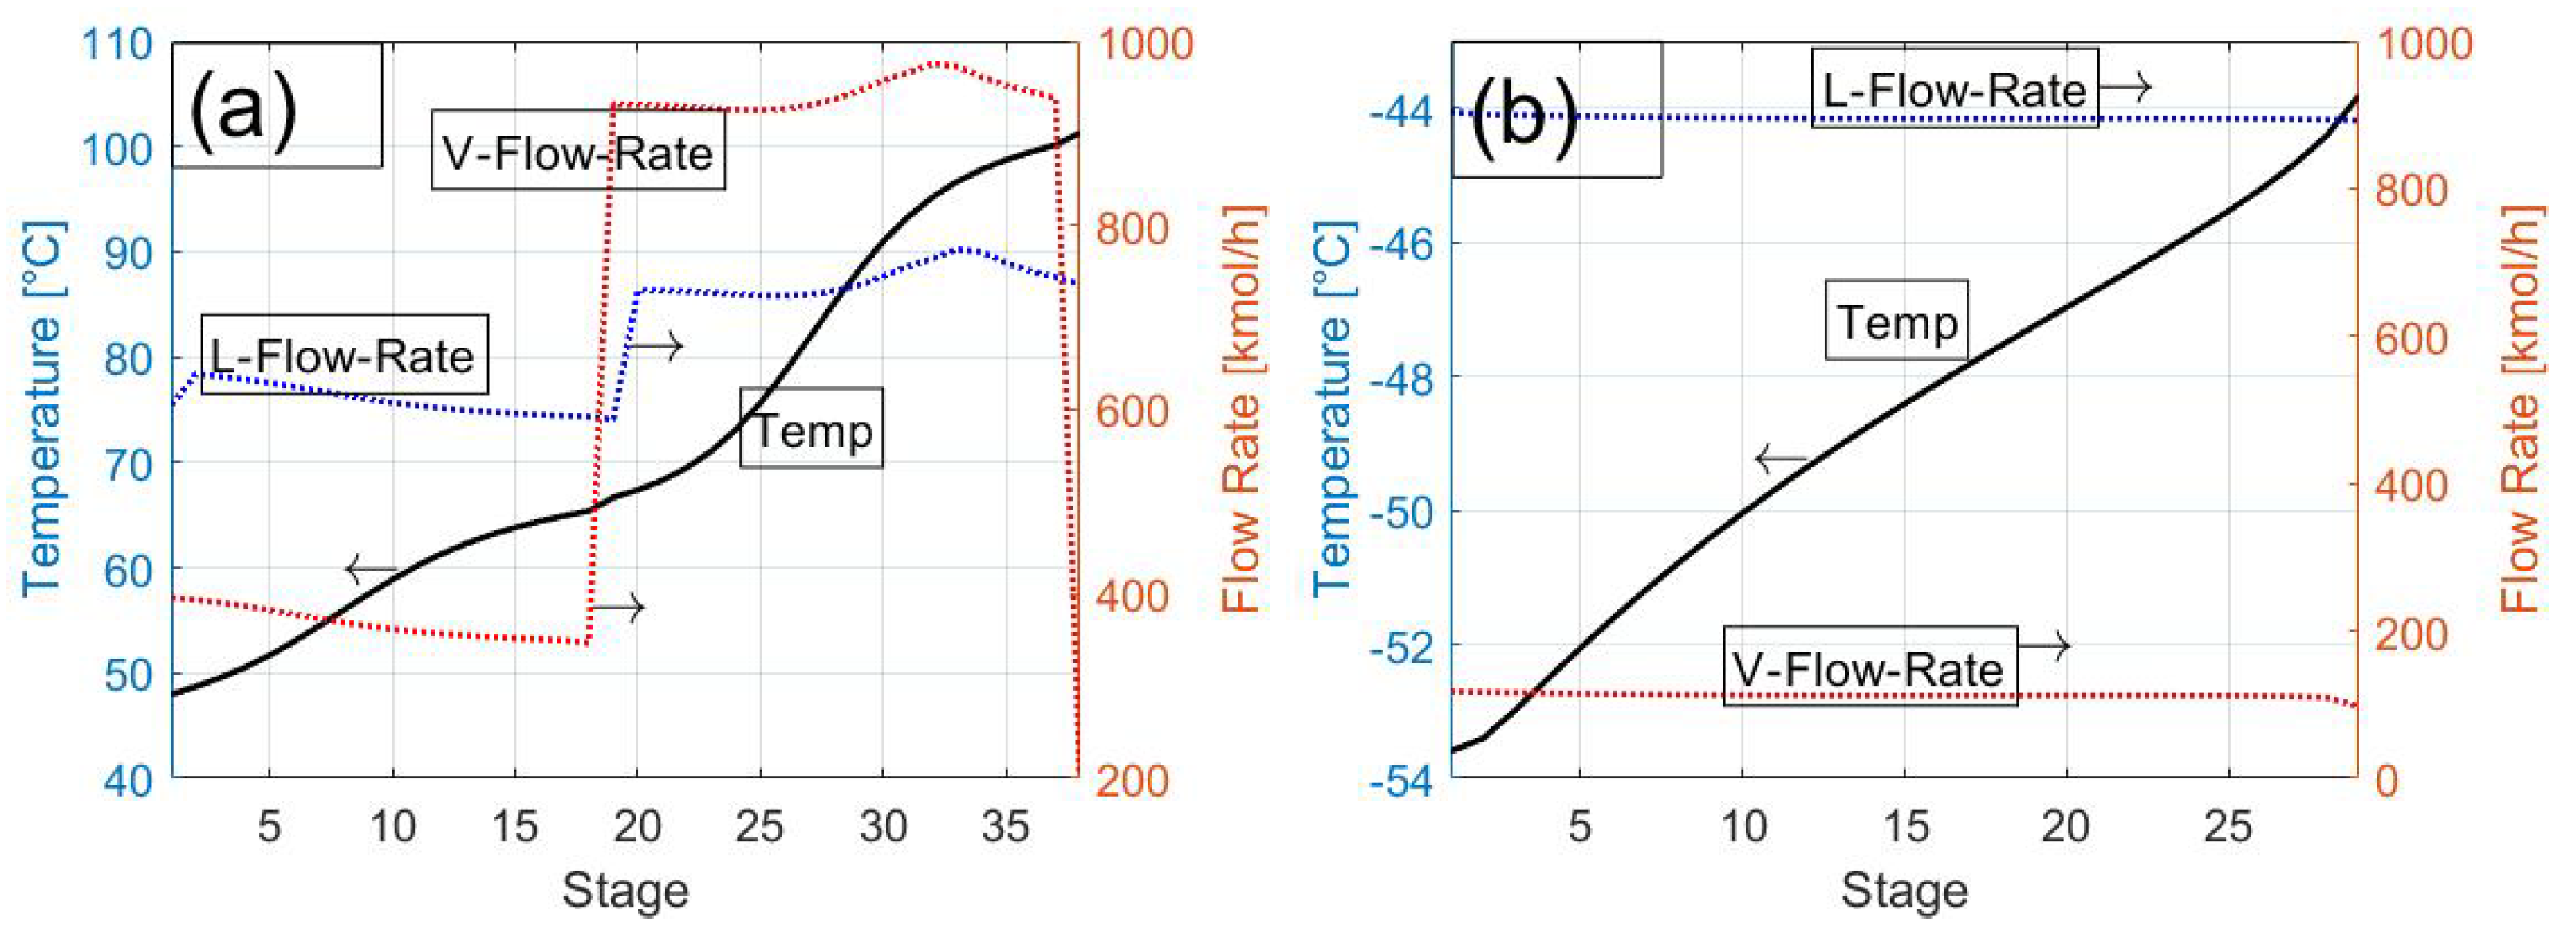
Figure 4a provides insight into the internal hydrodynamic and thermal behaviour of the main fractionator column, which acts as the core separator unit in the DCU. The temperature profile, which declines from the bottom reboiler to the overhead condenser, enables the progressive separation of components by volatility. This behaviour ensures that lighter products such as naphtha and LPG exit at the top, while heavier fractions concentrate toward the bottom.
The liquid and vapour interstage flow profiles show a complementary pattern: The flow of gases increases toward the top as a result of cumulative boiling, while the flow of liquids decreases downward as the material vaporises and disengages from the downflowing stream. The pressure profile, primarily dictated by hydrostatic effects, follows a near-linear trend from bottom to top, which is consistent with expected column behaviour and supports steady-state operation assumptions.
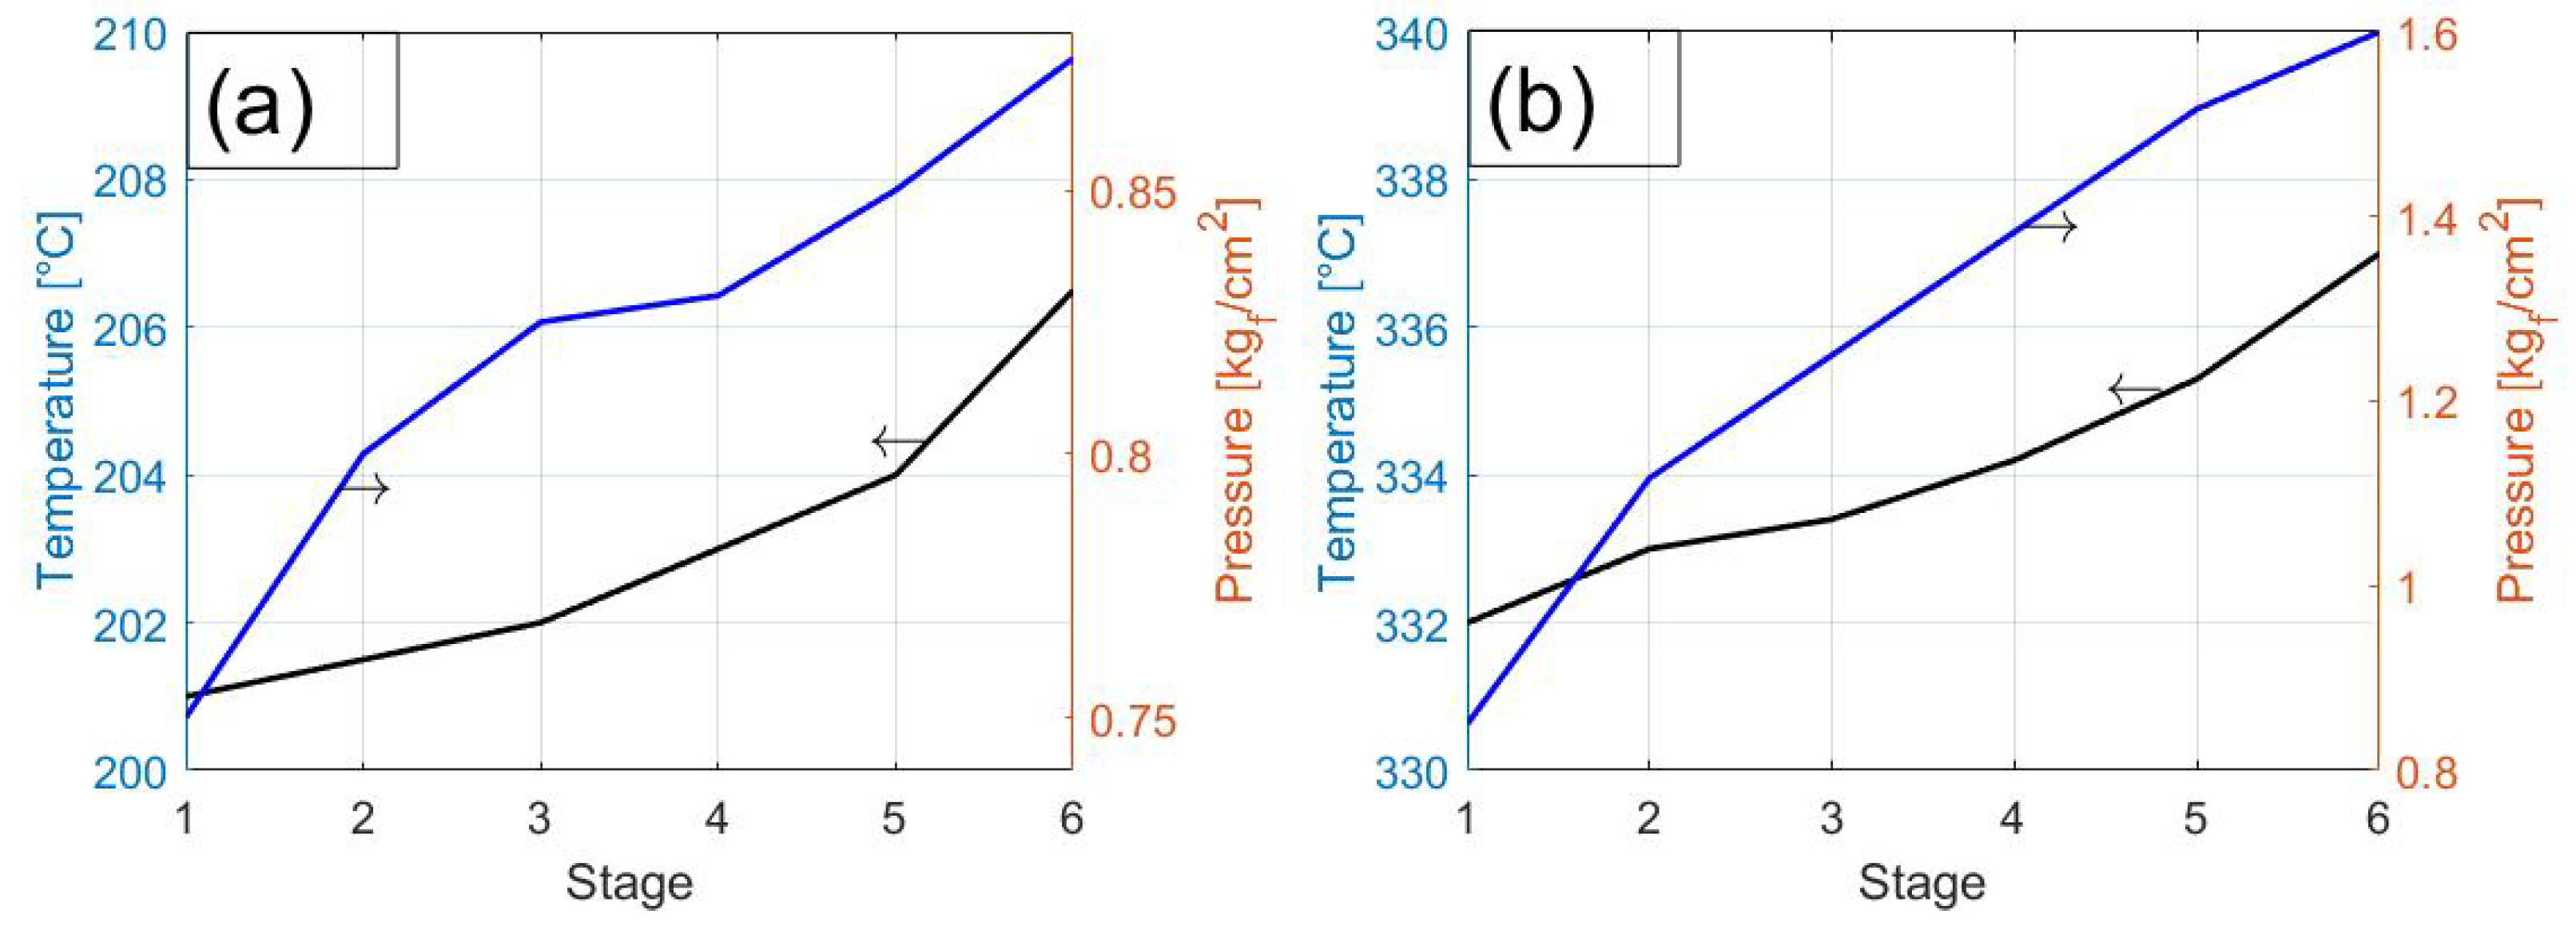
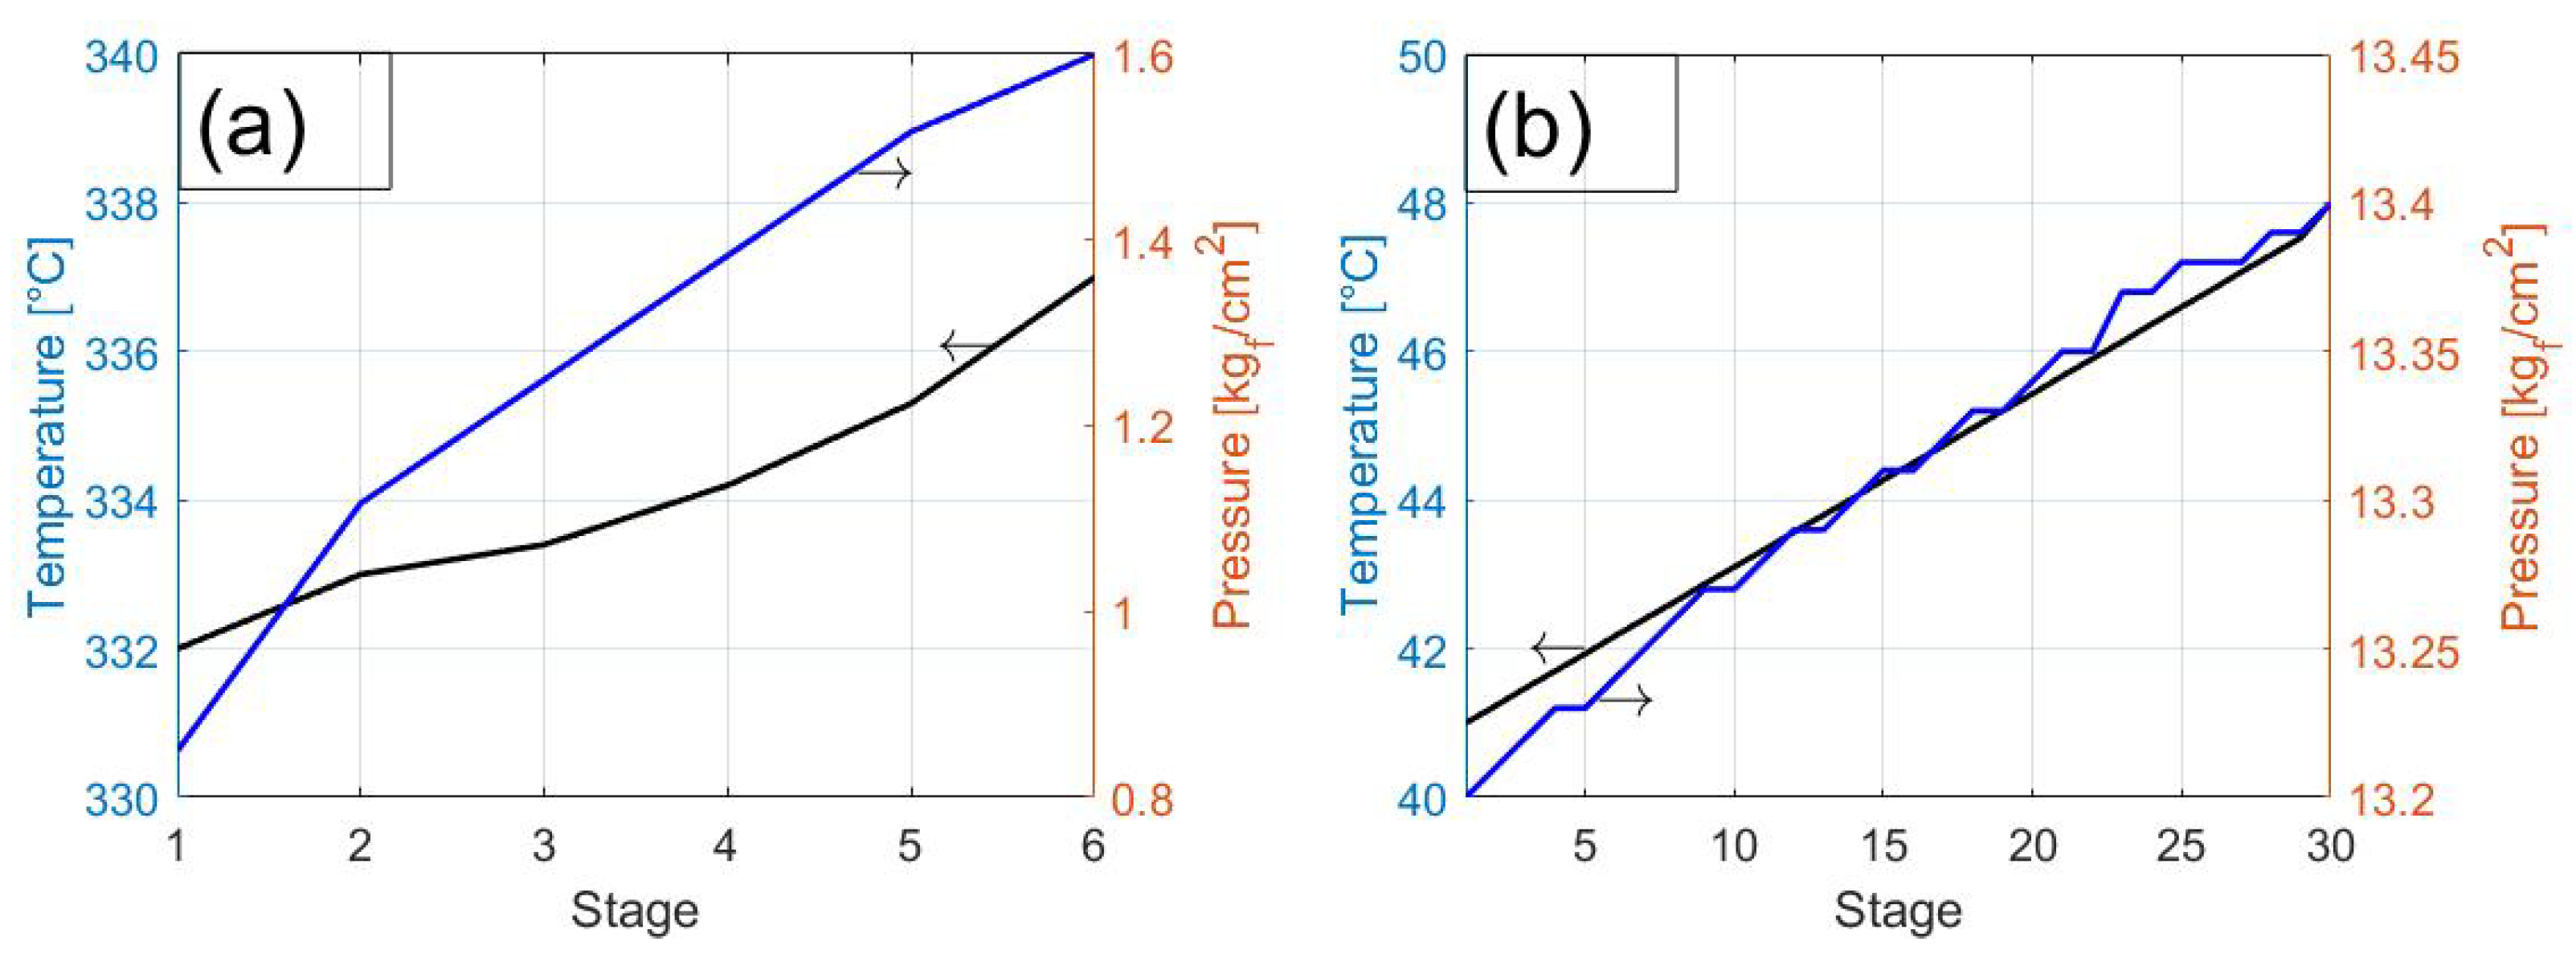
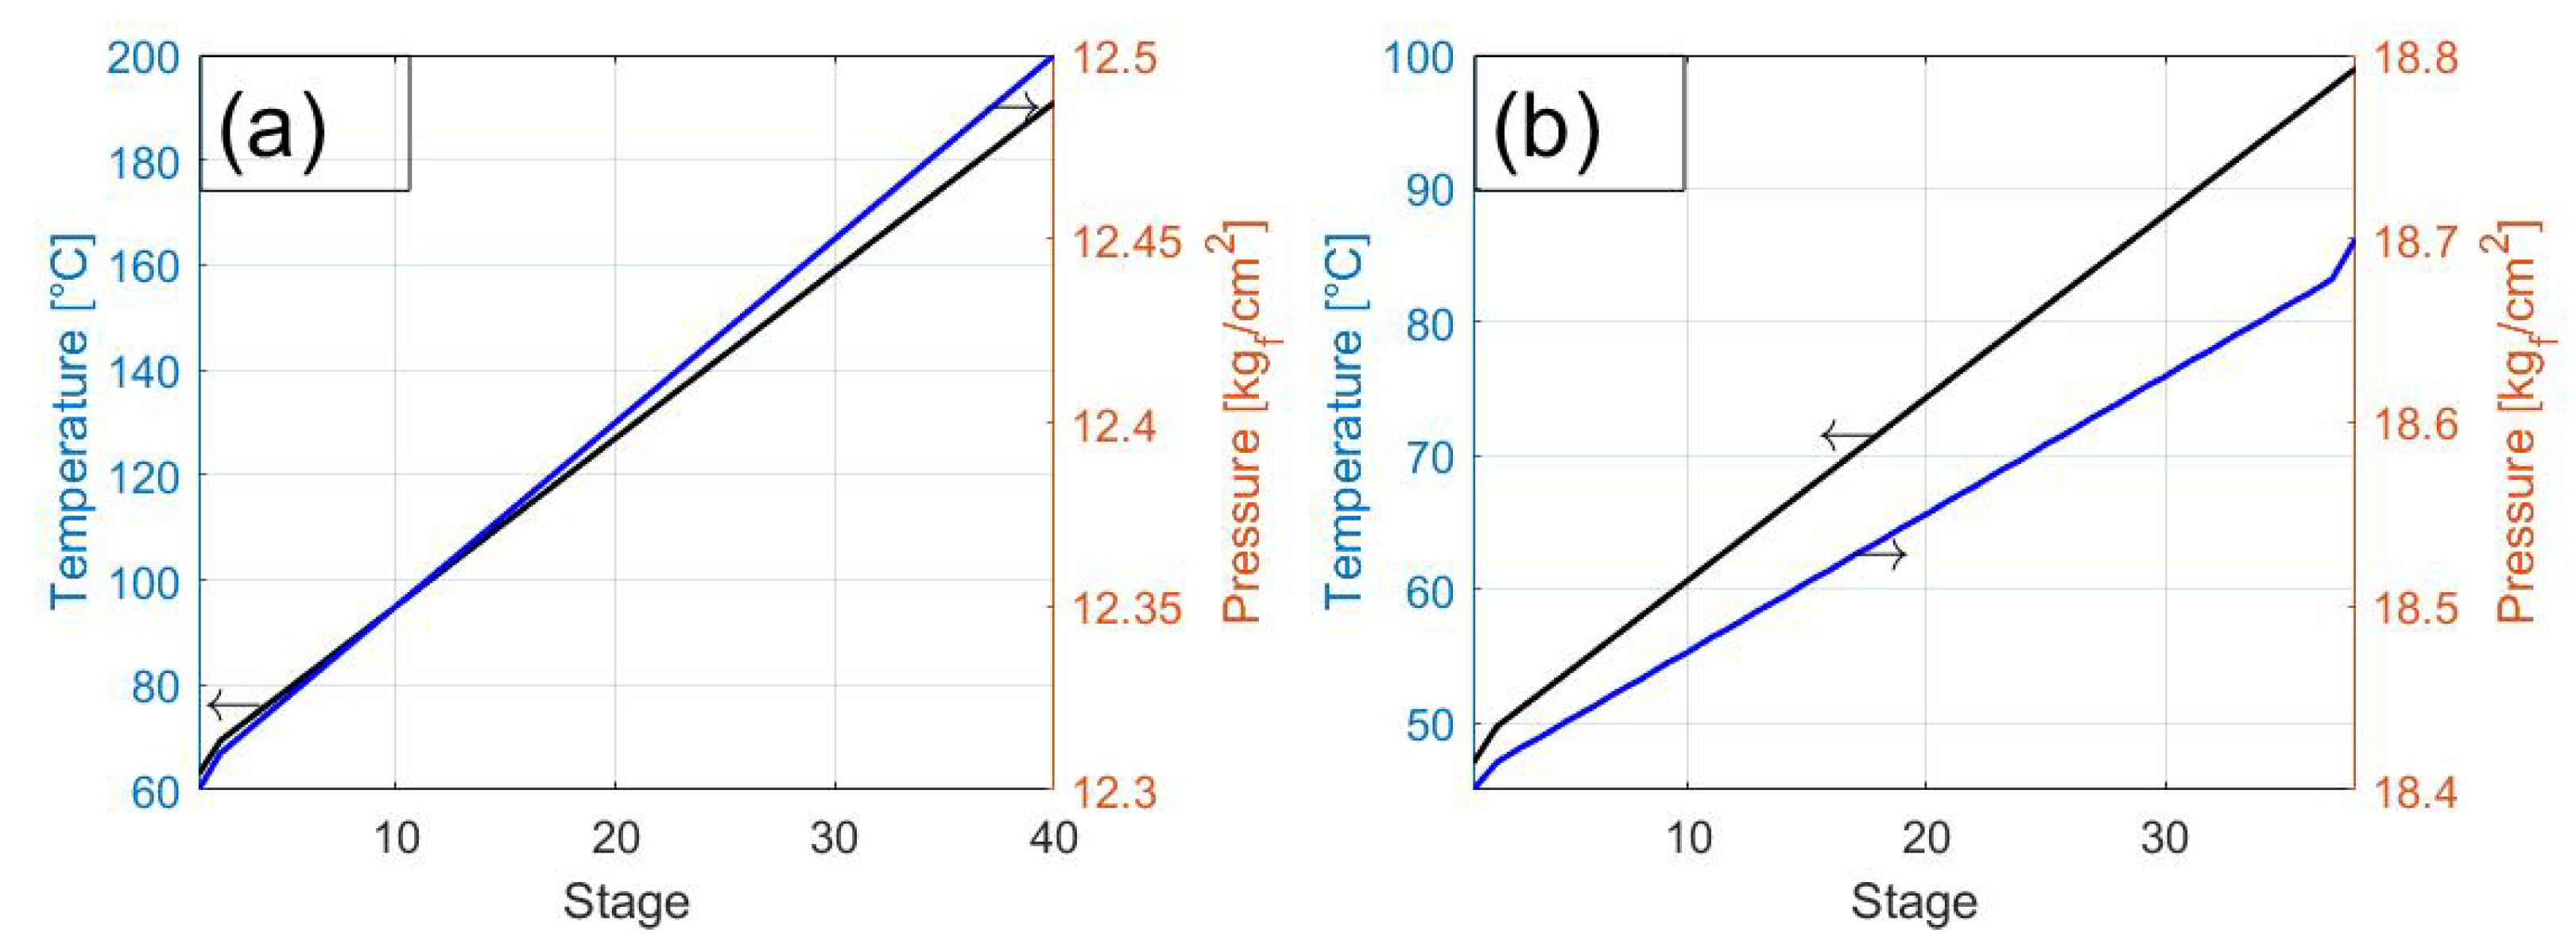
This dynamic is mirrored in the associated side column strippers (
Figure 4b), LGO and HGO product columns (
Figure 5), LGO and HGO naphtha product columns (
Figure 6), and light end recovery units, such as the debutanizer (
Figure 7a) and depropylenizer (
Figure 7b). Each of these units exhibits a similar descending temperature gradient, supporting high-purity separations and efficient fractionation. The coordination among these units is vital for maintaining material and energy balances, as product draw from one column becomes feed to another.
The system-wide interaction underscores that any adjustment in one unit can propagate throughout the network, affecting not only product quality, but also energy integration, recovery ratios, and emissions. Therefore, optimisation efforts must consider the interconnected nature of these separation steps rather than treating them in isolation.
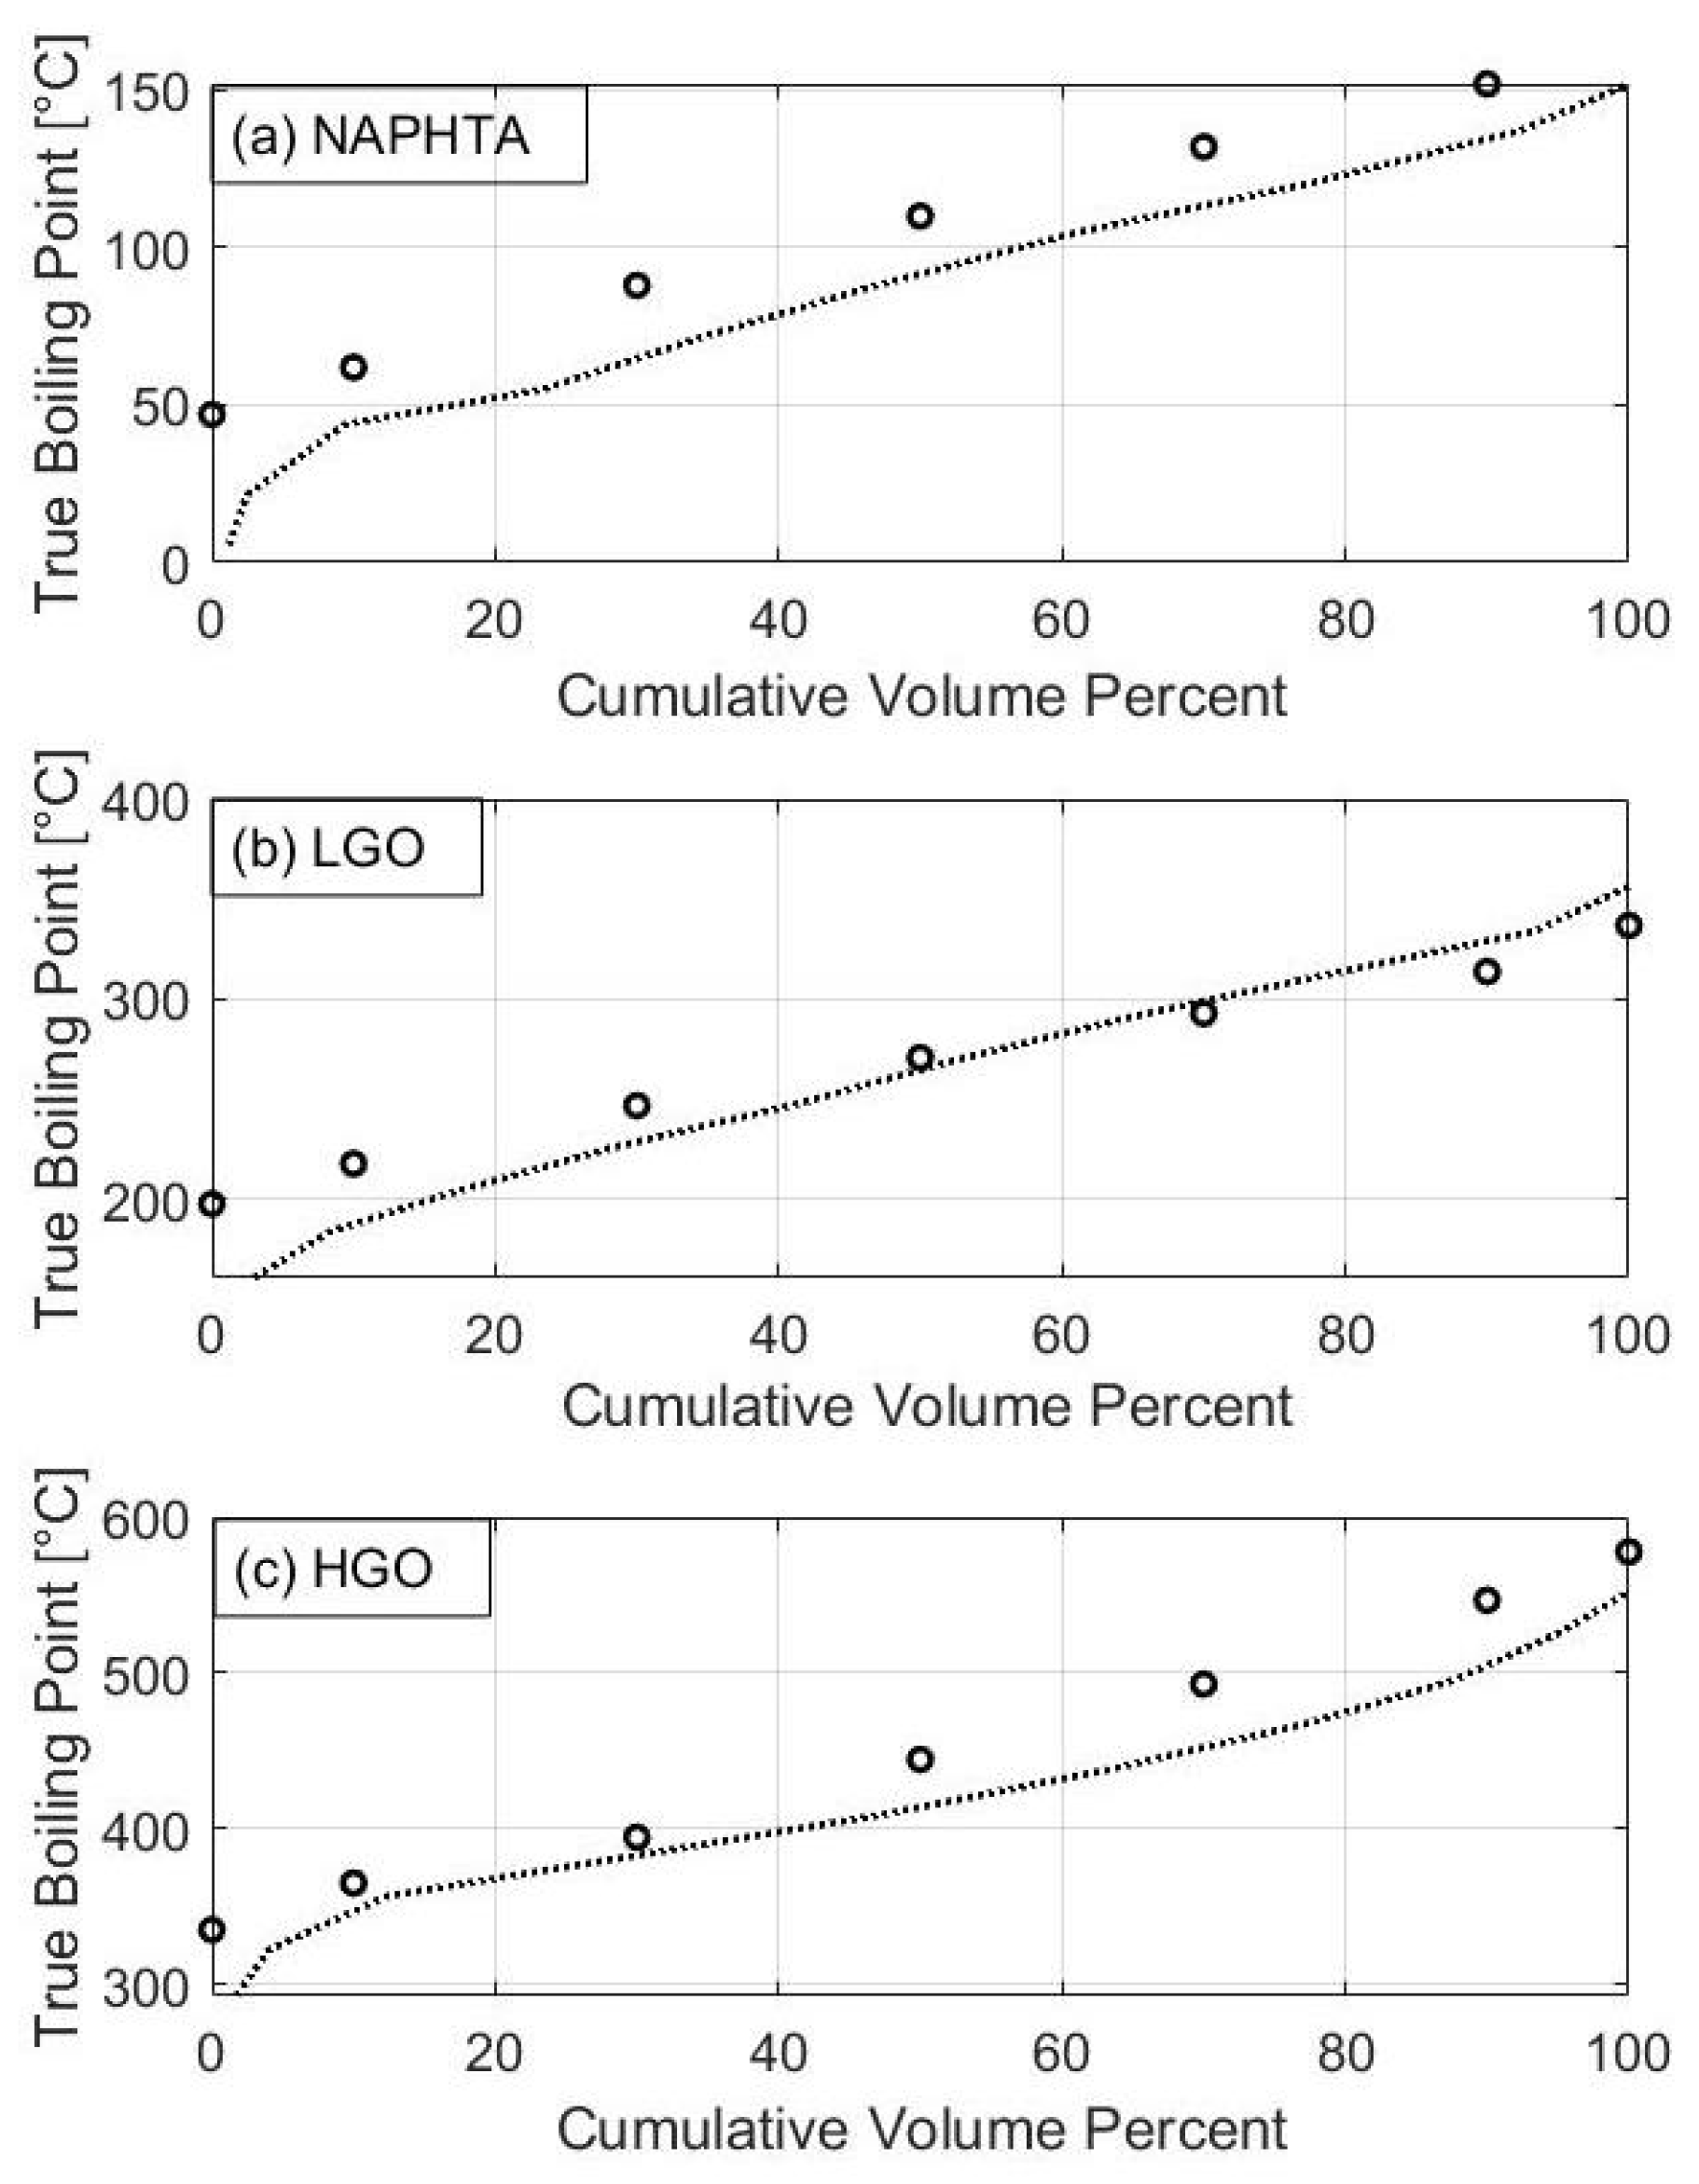
The true boiling point (Mexican) curves shown in
Figure 8 for the Naphtha, LGO, and HGO products from the optimised solution demonstrate a strong congruence between the design data [
21] (represented by circles) and the simulation results (represented by the dashed line). This alignment indicates that the multiobjective optimisation, which utilised the
-constraint method, successfully maintained the quality of the primary products while improving the system’s sustainability metrics.
For the most part, the simulation results show deviations of less than 10% from the design data in most of the temperature range, as specified in the query. This suggests a highly efficient and stable operation of the distillation columns that can achieve the desired separation of components. The coordinated operation of the main fractionator, side strippers, and other separation units is crucial to this result, ensuring the progressive separation of components according to their volatility and supporting high-purity fractionation. However, the analysis also reveals specific points with a higher deviation, reaching 18% at the low end of the distillation range (near zero volume percentage of distilled). This behaviour is characteristic of the initial separation of the lightest components in each product stream. It reflects the trade-offs inherent in multiobjective optimisation, where achieving significant gains in environmental and energy performance (such as a 15–25% reduction in global warming potential and a 5–18% reduction in specific energy intensity for LGO and HGO) may lead to minor controlled concessions in other areas, such as a slight variation in the initial boiling point of product cuts. In this context, these larger deviations are considered acceptable, as the overall sustainability profile of the process is substantially improved without compromising the viability or quality of the final products.
5.3. Performance of the Sustainability Indicator
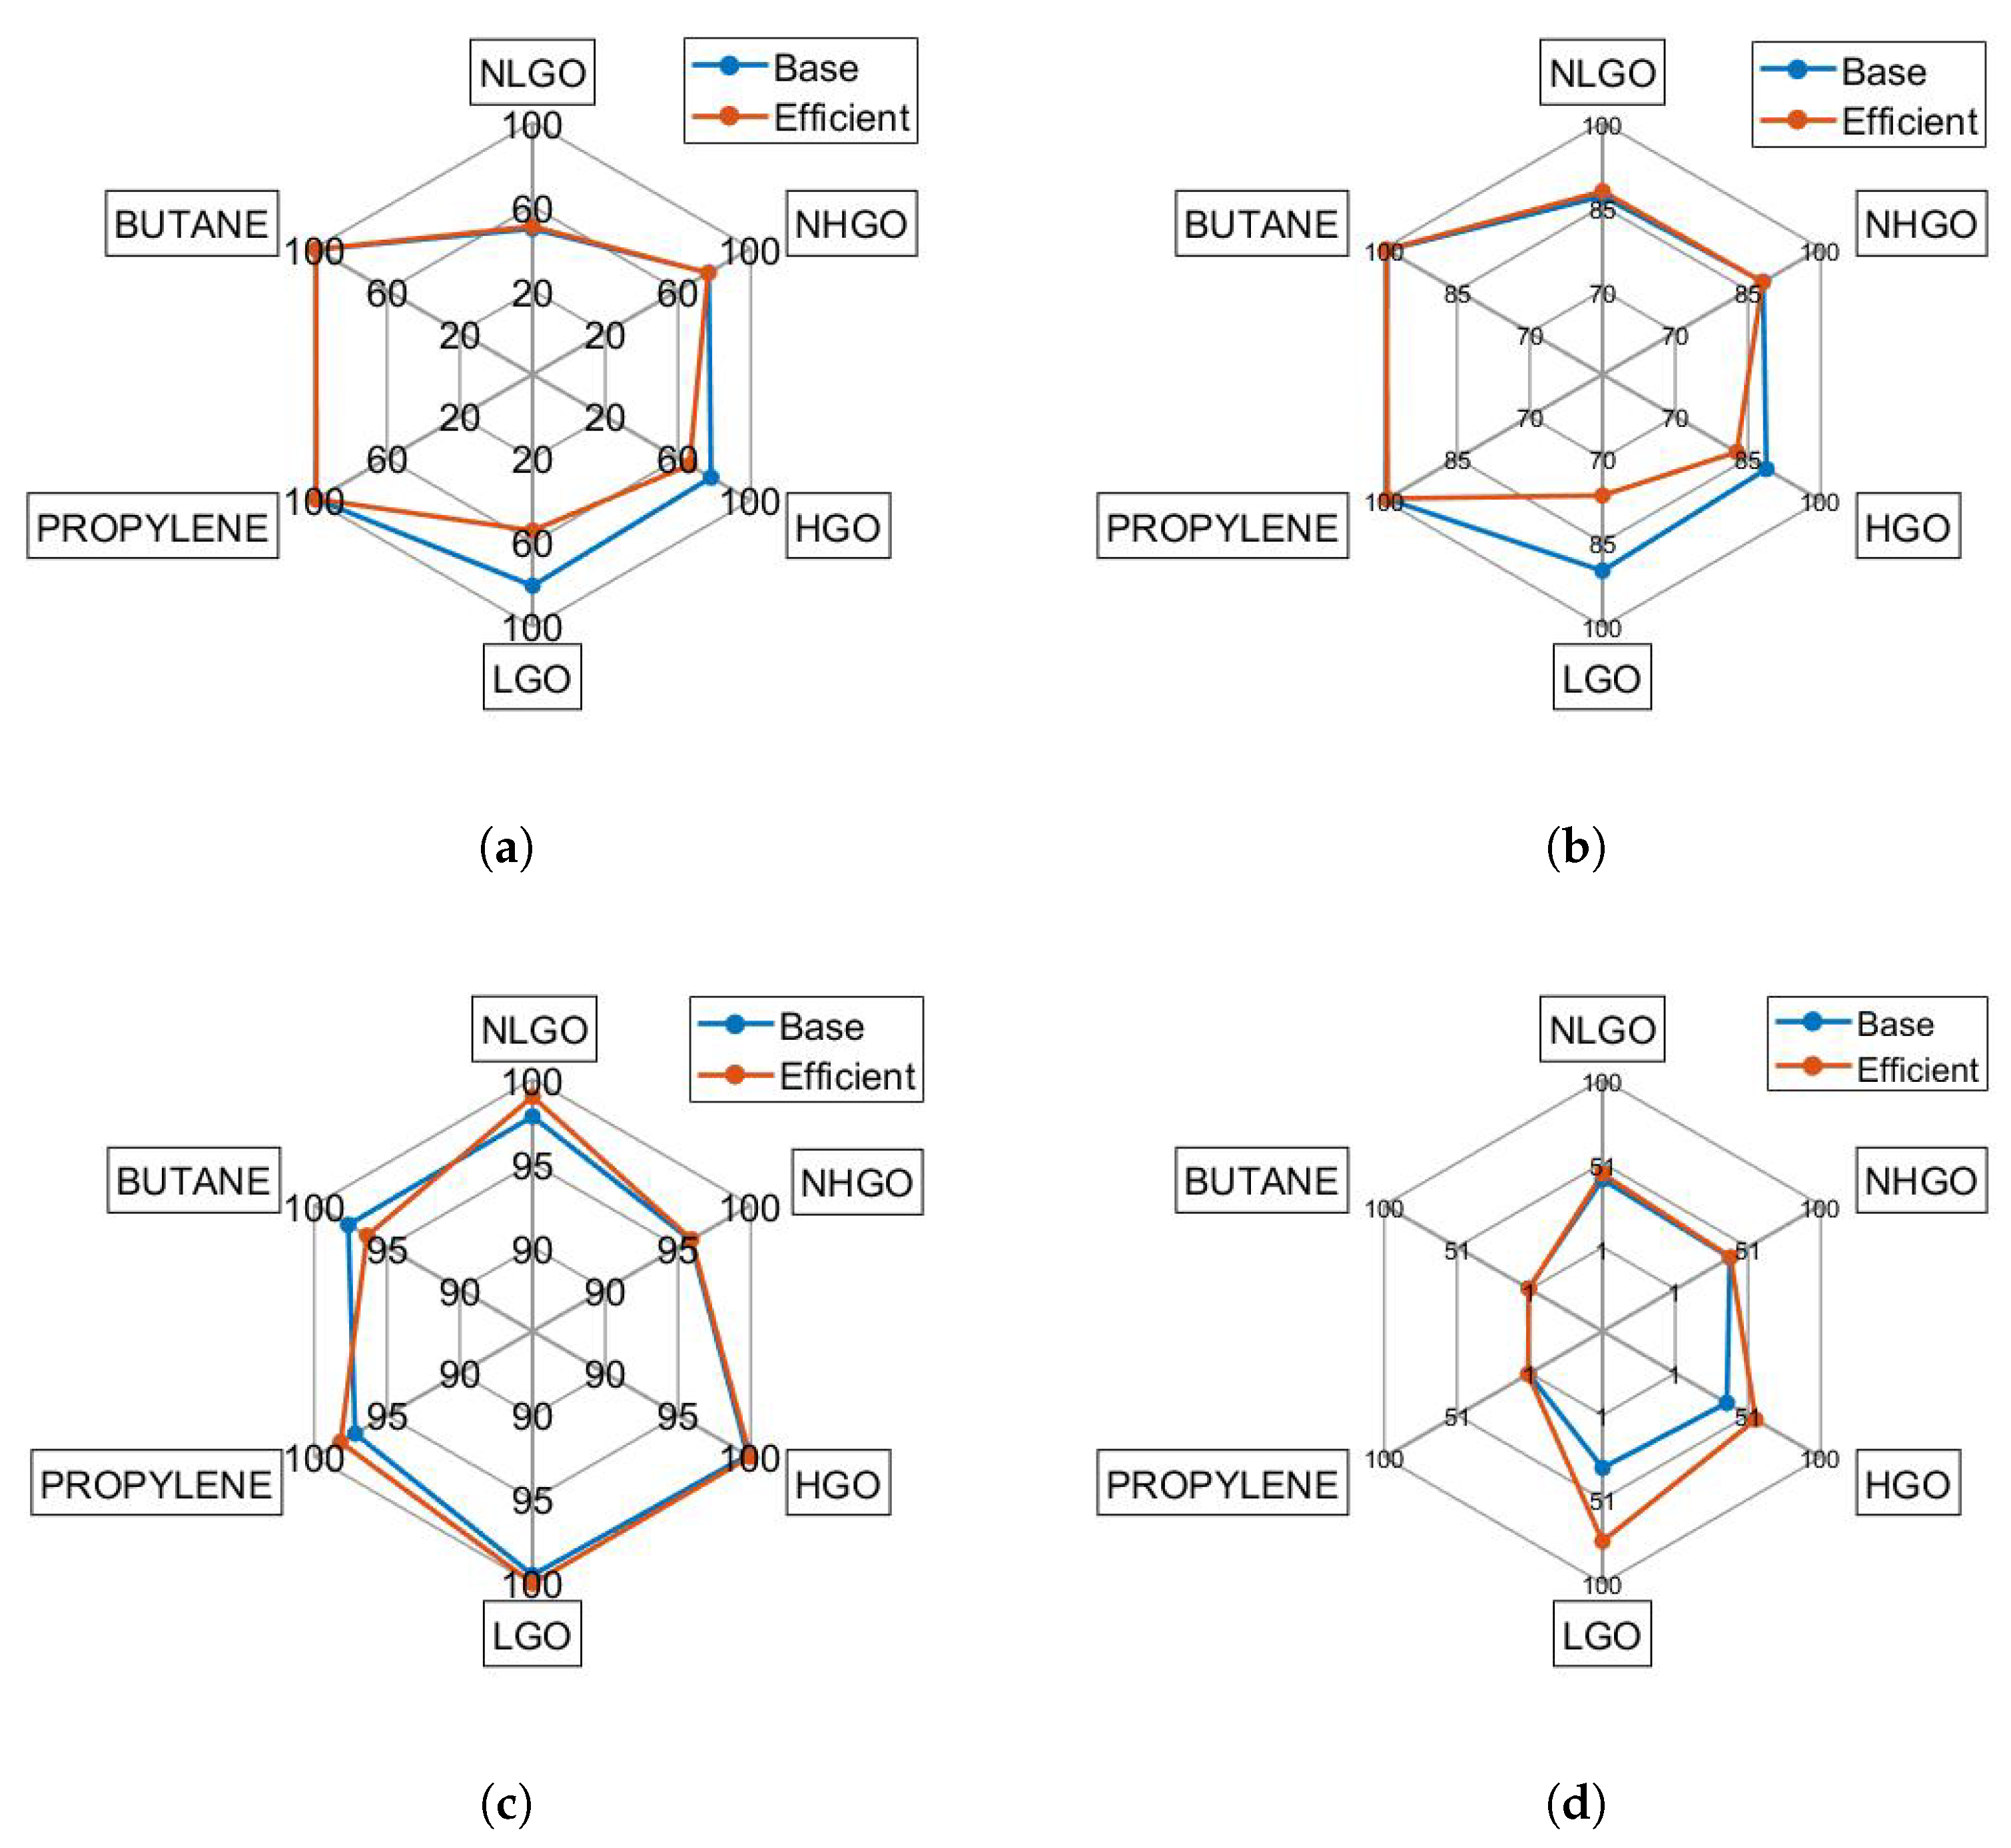
Figure 9 presents the comparative analysis of four sustainability indicators in the base case (blue lines) and the optimised condition (orange lines) determined by multiobjective optimisation. These indicators offer a comprehensive assessment of environmental impact, material efficiency, and energy performance.
Global Warming Potential (GWP). The most significant improvements were observed in this indicator, particularly for HGO and LGO, with reductions ranging between 15% and 25%. These gains are attributed to improved separation efficiency, reduced reboiler duty, and improved material routing that minimises unnecessary cracking and coke formation. GWP is especially relevant in the Mexican context due to the country’s commitment to international climate agreements and its dependence on heavy crude oil, which typically has a higher carbon footprint.
Specific Energy Intensity (SEI). The gains in energy efficiency ranged from 5% (HGO) to 18% (LGO), highlighting the effectiveness of the optimised configuration in reducing the consumption of thermal and electrical energy. Given that energy use is one of the primary contributors to both operational cost and GHG emissions, even modest improvements translate into substantial environmental and economic benefits. These results validate the ability of the optimisation to balance heat duties and minimise over-reflux, which often leads to energy penalties.
Mass Intensity (MI). Although the improvements in MI were small—between 0.5% and 2%—they reflect a significant reduction in the mass of feed required per unit of useful product. This indicates a process with fewer losses and a tighter conversion profile, which is desirable in a high-throughput unit like the DCU.
Reaction Mass Efficiency (RME). Interestingly, this indicator showed slight reductions for HGO and LGO in the optimised scenario. This suggests that although the system improves in environmental and energy terms, a portion of the feedstock may be diverted into non-target products or intermediate recycles. However, when evaluated in the context of all indicators, this trade-off is acceptable due to the more significant gains in GWP and SEI. Such outcomes are typical in multiobjective optimisation, where improvements in one dimension may lead to controlled concessions in others.
In general, the optimised solution provides a balanced sustainability profile that aligns with industrial goals and regulatory requirements, demonstrating the real-world feasibility of process-integrated decision making.
5.4. Optimisation Result and Trade-Off Analysis
The efficient solution identified from the Pareto front reflects an optimal compromise among competing sustainability objectives.
Table 4 presents the sustainability indicators calculated for five economically valuable products generated by the delayed coking unit in both the base case and the optimal solution. These products include HHGO, HGO, LGO, propylene, and butenes. The table highlights the adjustments made in reflux ratios, split fractions, and column temperatures that enabled performance improvements in most indicators.
It should be noted that 16 of the 20 indicators evaluated showed improvements under the optimised condition. For example, the Global Warming Potential (GWP) was significantly reduced for HHGO, HGO, LGO, and propylene, with relative reductions ranging from 2.7 to 19.7%, indicating better carbon efficiency. However, other products exhibited a detrimental trade-off: butenes, for example, showed an increase in GWP of 16.3%, and it is important to note that the values underlined in
Table 4 represent a negative outcome (worsening) from the perspective of sustainability, reflecting the compromises arising from changes in reaction and separation conditions.
Similarly, Mass Intensity (MI) and Specific Energy Intensity (SEI) also presented suboptimal outcomes for a few cases. The worst deviations were reached at 11%, notably for butenes, suggesting that the energy and mass conversion in that stream became less efficient in the optimised settings. Despite this, the overall sustainability profile of the DCU improved, demonstrating the strength of multi-objective optimisation in refining systems.
These findings illustrate the effectiveness of the -constraint method in systematically guiding process adjustments while respecting operational limits. The Pareto front results were reproducible by initiating each optimisation run from feasible operating points, previously identified through the sensitivity analysis. This ensured the stability of the solver and the consistent convergence in the defined decision space.
Ultimately, the results reinforce the importance of adopting multi-objective optimisation in the design and retrofit of delayed coking operations. The methodology proposed here offers a practical and replicable blueprint for balancing technical performance with environmental responsibility, particularly relevant as the Mexican refining sector faces increasing pressure to modernise and comply with international sustainability standards.
6. Conclusions
This study assessed the sustainability performance of a delayed coking unit (DCU), a process of strategic importance for the upgrading of heavy crude oil in Mexican refineries. Given Mexico’s production profile and the need to maximise the value of heavy fractions, delayed coking remains essential for national refining operations. Nevertheless, its high energy demand, greenhouse gas emissions, and associated environmental impacts highlight the need for innovative strategies that enhance sustainability while preserving profitability.
The sensitivity analysis confirmed that adjustment of reflux flows and split ratios in key columns of the delayed coking unit strongly influences both sustainability indicators and product distribution. By systematically varying these operational parameters within feasible ranges, it was possible to define an operating domain that balances energy efficiency, environmental performance, and product recovery. This analysis demonstrated that modest modifications in reflux flows and stream splits can lead to measurable reductions in GWP and SEI, while maintaining acceptable levels of MI, RME, and product yield. These findings provide practical insight for refinery operators, showing that sustainability improvements can be achieved through operational adjustments without requiring major process modifications or capital investments.
To address these challenges, a comprehensive multi-objective optimisation framework was developed, combining Aspen Plus® v.12.1 simulations, sustainability indicators, and the -constraint method. Five key metrics were evaluated: Global Warming Potential (GWP), Specific Energy Intensity (SEI), Mass Intensity (MI), Reaction Mass Efficiency (RME), and Product Yield. Integration of simulation and optimisation allowed identification of critical operating variables and feasible adjustments in reflux flows, split ratios, and column operating conditions.
The optimised scenarios demonstrated that GWP can be reduced by 15–25% and SEI by 5–18% for heavy and light gas oils. MI showed modest improvements (0.5–2%), while RME presented minor trade-offs, reflecting the inherent balance between environmental efficiency and conversion efficiency. Importantly, product yield was preserved under optimised conditions, confirming that sustainability gains can be achieved without compromising economic viability.
A primary limitation of this study is that the coking reactor itself was not modelled; instead, a fixed reactor effluent composition was assumed as the feed to the separation network. Therefore, the improvements reported are specific to the fractionation and separation stages rather than to the entire DCU reaction–separation system. Future work should incorporate detailed reactor kinetic models to capture the influence of feedstock properties, reaction pathways, and operating conditions on yields, coke formation, and emissions.
Despite this limitation, the proposed methodology provides a robust and replicable pathway to enhance the sustainability of refining operations. By systematically balancing emissions reduction, energy efficiency, material use, and product recovery, this approach aligns refining practices with Mexican environmental and social commitments and offers a framework applicable to other heavy oil upgrading processes. Heavy crude oils from Mexico and Latin America are typically characterised by low API gravities and high sulphur content, similar to other “sour” crudes around the world. The Mexican Maya crude and the Colombian Castilla crude are clear examples of these properties. Although this research focused on Mexican heavy crude, the methodology is broadly applicable and given the shared characteristics of these feedstocks, the findings of this work are relevant to other heavy oil producing regions.
Looking ahead, a promising direction for future research is the incorporation of a detailed kinetic simulation of the delayed coking reactor. The combination of reactor kinetics with fractionation optimisation would allow the complete reaction–separation system to be evaluated under realistic operating conditions, thus improving predictive capacity and providing more insight into integrated strategies that simultaneously enhance energy efficiency, environmental performance, and economic feasibility.
