Article

Research on Hydraulic Fracturing Crack Propagation Based on Global Cohesive Model

1
School of Mechanical Engineering, Southwest Petroleum University, Chengdu 610500, China
2
MOE Key Laboratory of Oil and Gas Equipment, Chengdu 610500, China
3
State Key Laboratory of Oil & Gas Reservoir Geology and Exploitation, Southwest Petroleum University, Chengdu 610500, China
*
Author to whom correspondence should be addressed.
Processes 2025, 13(10), 3146; https://doi.org/10.3390/pr13103146
Submission received: 26 August 2025 / Revised: 21 September 2025 / Accepted: 26 September 2025 / Published: 30 September 2025
(This article belongs to the Section Energy Systems)

Abstract

Hydraulic fracturing is currently the main technical means to form complex fracture systems in shale gas development. To explore the influence of fracture dip, fracture length and fracture filling degree on the propagation of hydraulic fractures under complex fracture conditions, this paper establishes a 20 cm × 20 cm two-dimensional numerical model by inserting global cohesive elements and conducting triaxial hydraulic fracturing experiments to verify the model. The results show that the fracture filling degree plays a major role in the fracture pressure and the propagation of hydraulic fractures, while the fracture dip plays a minor role. The experimental results are consistent with the model results in terms of the law, but due to the existence of other natural fractures in the test block, the fracture pressure is smaller than that of this model. This model can provide some theoretical basis and technical support for situations where there are complex natural fractures in hydraulic fracturing.

1. Introduction

Hydraulic fracturing is the main technical means to form complex fracture systems in shale gas development. Based on the true triaxial fracturing experiments of multi-layer shale–sandstone samples, it was found that increasing the radial wellbore length can effectively promote the cross-layer and jump-layer expansion of fractures, reduce the critical threshold of injection parameters, and be conducive to maximizing the stimulated reservoir volume [1]. At the same time, a higher fracturing fluid viscosity is crucial for ensuring the vertical cross-layer expansion of hydraulic fractures, while a lower fracturing fluid viscosity helps activate the weak interlayer surfaces and promote sufficient horizontal expansion along these planes, forming branch fractures. The alternate injection of high-viscosity and low-viscosity fracturing fluids enables hydraulic fractures to both break through weak interlayer surfaces and achieve uniform horizontal propagation, thereby forming more complex fracture patterns [2]. Under high stress conditions, the strength of natural fractures has a significant impact on the width, volume, and morphology of hydraulic fractures. Small differences in fracturing fluid viscosity have a relatively limited effect on fracture propagation, but high viscosity fracturing fluids have a greater impact on fracture propagation [3].
Considering the interaction mechanism between hydraulic fractures and natural fractures, a two-dimensional numerical model is used to analyze the influence of in situ stress, fracturing fluid viscosity, and fracturing fluid injection rate on the propagation of hydraulic fractures. The results show that higher in situ stress, higher fracturing fluid viscosity, and a higher fracturing fluid injection rate create more favorable conditions for the penetration of natural fractures by hydraulic fractures [4,5,6,7,8]. The geometry of fractures also affects the extent of hydraulic fracture propagation. Three-dimensional topography scanning tests and hydraulic coupling tests can be used to continuously improve the geometric parameters of the fracture surface under different confining pressures and establish the relationship between effective geometric parameters and confining pressure. Then, the root mean square error and the coefficient of determination are introduced to evaluate the error and the fitting degree between the model curve and the experimental data [9,10,11].
Shale oil and gas resources in China are widely distributed in shale-sandstone interbedded reservoirs, which have complex lithology and strong heterogeneity. Conventional fracturing can cause stress interference on fractures and inhibit their propagation [12]. Based on this, a coupled seepage–stress–damage model is developed to study the influence of the pump injection rate, fracturing fluid viscosity, and perforation parameters on the propagation of multi-cluster fractures. The results show that the heterogeneity of the reservoir may cause fracture diversion, and the interference fractures between reservoirs continue to expand [13,14]. It is possible to consider linking hydraulic fracturing modeling with well testing and introducing heterogeneity influence factors or discrete element methods to quantify the impact of heterogeneity on fracture propagation [15,16].
When there are multiple natural fractures inside the rock, the intersection behavior of fractures within the simulation unit is simulated based on the extended finite element method [17,18]. Simulating simultaneous and sequential fracturing, it is found that under multi-fracture conditions, low injection pressure is more effective in forming fractures [19]. A fully coupled seepage and stress extended finite element method is developed, considering multiple sensitive parameters, including elastic modulus and horizontal stress difference, to study the reorientation mechanism of fractures. Considering multiple weak interfaces and different rock properties in layered heterogeneous rocks, it is found that the propagation of hydraulic fractures in layered heterogeneous shales is the interaction between adjacent weak interfaces [20]. Then, a pseudo-three-dimensional fracture propagation model is established by globally inserting viscous elements, considering interface strength, perforation location, and pump speed, to study the characteristics of hydraulic fracture cross-layer propagation. The results show that hydraulic fractures cross-propagate in dense sandstone layers, while ladder-shaped fractures form in layered shales [21]. When studying the initiation and propagation behavior of multiple fractures, the diversion fracturing technology can also be considered [22].
Currently, deep learning models such as long short-term memory machine learning algorithms to create surrogate models, three-dimensional random discrete fracture network models, rate-dependent cohesive phase field models, and random forest models are used to predict the crack propagation path [23,24,25,26]. Deep learning models can help us process complex and diverse datasets [27], as well as use various machine learning algorithms to evaluate their predictive ability and select the learning algorithm with the best response variable performance [28]. In addition, the phase field method can also be used to simulate the propagation of hydraulic fractures. One is the hybrid coupling method for handling the interaction between fractures and fluids; the other is a novel rate-dependent cohesive phase field model for simulating dynamic mixed-mode hydraulic fractures [29,30,31,32].
Currently, most studies have focused on the influence of internal layering in rocks, the number of natural fractures, their stress intensity, and the fracturing fluid on the propagation of hydraulic fractures. However, the effects of the dip angle of natural fractures, their length and width, and the stress intensity of the filling material within the fractures on the propagation of hydraulic fractures have not been fully investigated. By inserting cohesive element models between rock matrix elements or along possible fracture paths, the model can autonomously calculate the initiation position, extension direction of fractures, as well as whether it is a single fracture or a complex fracture network. This is crucial for evaluating the fracturing effect. In order to be able to naturally predict the emergence and extension of complex fracture networks, this paper adopts a numerical simulation method of globally inserting viscous elements, taking into account factors such as fracture inclination and fracture filling degree, and studies the propagation characteristics of hydraulic fractures. The results show that the degree of fracture filling plays a major role in the fracture pressure and propagation path of hydraulic fractures, while the dip angle of fractures plays a secondary role. Based on this conclusion, a triaxial hydraulic fracturing experiment was conducted as a control group for verification, and the results were consistent with the conclusions of the model, effectively validating the correctness of the model.

2. Cohesive Element Model

Cohesion is the mutual attraction between adjacent parts of the same substance. This mutual attraction is the microscopic expression of the molecular forces between the molecules of the same substance. When simulating hydraulic fracturing, the cohesive element does not simulate the real rock layer but can be regarded as the stress resisting force generated at the crack tip when the cracks expand in the rock. Due to this property, the layer of the cohesive element has material attribute restrictions in the scale parameter setting, but in the simulation of hydraulic fracturing, the cracks can only expand along the pre-set path of the cohesive element layer.

2.1. Element Constitutive Model

The generalized Hooke’s law can be used to describe the relationship between stress and strain during the deformation of rocks. Specifically, in the finite element analysis of layered rocks in an elastic state. Its constitutive model is shown in Equation (1):
σ = D ε
where [D] represents the elastic constitutive matrix in Equation (2):
ε 11 ε 22 ε 33 γ 12 γ 13 γ 23 = 1 E υ E υ E 0 0 0 υ E 1 E υ E 0 0 0 υ E υ E 1 E 0 0 0 0 0 0 1 G 0 0 0 0 0 0 1 G 0 0 0 0 0 0 1 G σ 11 σ 22 σ 33 σ 12 σ 13 σ 23
where E represents the Young’s modulus. G represents shear elasticity; υ represents Poisson’s ratio; ε ii , γ ij and σ ij respectively represent the normal strain, the engineering shear strain and the stress.
The stress–strain relationship of the cohesion element during the initial damage stage is shown in Equation (3):
t n t s t t = E n n E n s E n t E n s E s s E s t E n t E s t E t t ε n ε s ε t = E ε
where Equation (4)
ε n = δ n T 0 ,   ε s = δ s T 0 ,   ε t = δ t T 0
where n, s and t represent the direction of the lower index, the first shear stress direction, and the second shear stress direction. represents strain. ε represents strain. δ represents the displacement in a certain direction. T0 represents initial thickness. t represents the intermolecular attraction, which can be decomposed into normal stress and two shear stresses.

2.2. Crack Initiation and Propagation Criteria

Simulate the initiation and propagation process of cracks. The cohesive element mainly reflects the energy relationship between the interfaces when the element fractures. The expression of its fracture criterion is shown in Equation (5):
σ n σ n max 2 + τ s τ s max 2 + τ t τ t max 2 = 1
where σ n represents the stress applied along the element’s surface, in MPa; τ s and τ t represent the stresses applied in the two tangential directions of the element, in MPa; σ n max represents the critical stress in the normal direction when the element fails, in MPa; τ s max and τ t max represent the critical stresses in the two directions when the element fails tangentially, in MPa.
The cohesive element is selected to simulate the intersection process of cracks. By presetting the crack extension path, the stress changes when two cracks intersect can be well simulated. Assuming that the element follows a linear elastic relationship, when the stress intensity exceeds the critical value, the cohesive element will fail, and its corresponding stiffness will become 0. It can be expressed as Equation (6):
max σ n σ n 0 , σ s σ s 0 , σ t σ t 0 = 1
where Equation (7) is as follows:
σ n = σ n σ n 0 0 σ n 0
and σ n 0 represents the tensile strength; the elements within the < > symbol will not be damaged; σ s 0 and σ t 0 represent the shear strength [33,34,35].

2.3. Numerical Model

This model employs global insertion of cohesive elements to establish a two-dimensional numerical model with a size of 20 cm × 20 cm. The material parameters are listed in Table 1. Pore pressure nodes are introduced to simulate the hydraulic fracturing crack propagation near the wellbore under different crack inclination angles ( θ = 0°, 30°, 60°and 90°) and different filling degrees (no filling, semi-filling, and full filling).

2.4. Test Supplement

To provide experimental data support for the model, this paper conducted 9 groups of fracturing tests as shown in Table 2. First, the sandstone was cut into fractures with inclination angles of 0°, 30°, 60° and 90°, and the fracture positions were reserved. Based on a certain proportion of the interlayer of illite/montmorillonite and the mixture of illite and kaolinite as the fracture filler, and then divided into full filling, semi-filling and no filling according to the filling proportion. The remaining part was filled with resin. In the experiment, a 20 cm × 20 cm × 20 cm sandstone sample was used, and the wellbore radius was 0.8 cm. The triaxial test system was used to achieve three-dimensional stress loading, and the loading method is shown in Figure 1.

3. Results and Discussion

This section first explores the influence of crack inclination and filling degree on crack propagation and obtains the model’s expansion law. Then, it compares this with the experimental results.

3.1. The Influence of Crack Inclination

As shown in Figure 2, for the fracture pressure, when the filling degree is half-filled, it can be observed that the fracture pressure will significantly change with the fracture inclination angle. When the crack inclination angle is less than 30°, the fracture pressure will increase as the crack inclination angle increases; when the fracture inclination angle is 30°, the fracture expansion pressure reaches its maximum, reaching 19.06 MPa; while when the crack inclination angle is greater than 30°, the fracture pressure will gradually decrease. When the filling degree is fully filled, the fracture pressure will not significantly change with the crack inclination angle, but in general, the fracture pressure will still reach its maximum value at a fracture inclination angle of 30°, with the maximum fracture pressure being 21.62 MPa, and the fracture pressure is all within the range of 21 MPa to 22 MPa. It can be clearly seen that the fracture pressure under the fully filled condition is significantly higher than that under the half-filled condition.
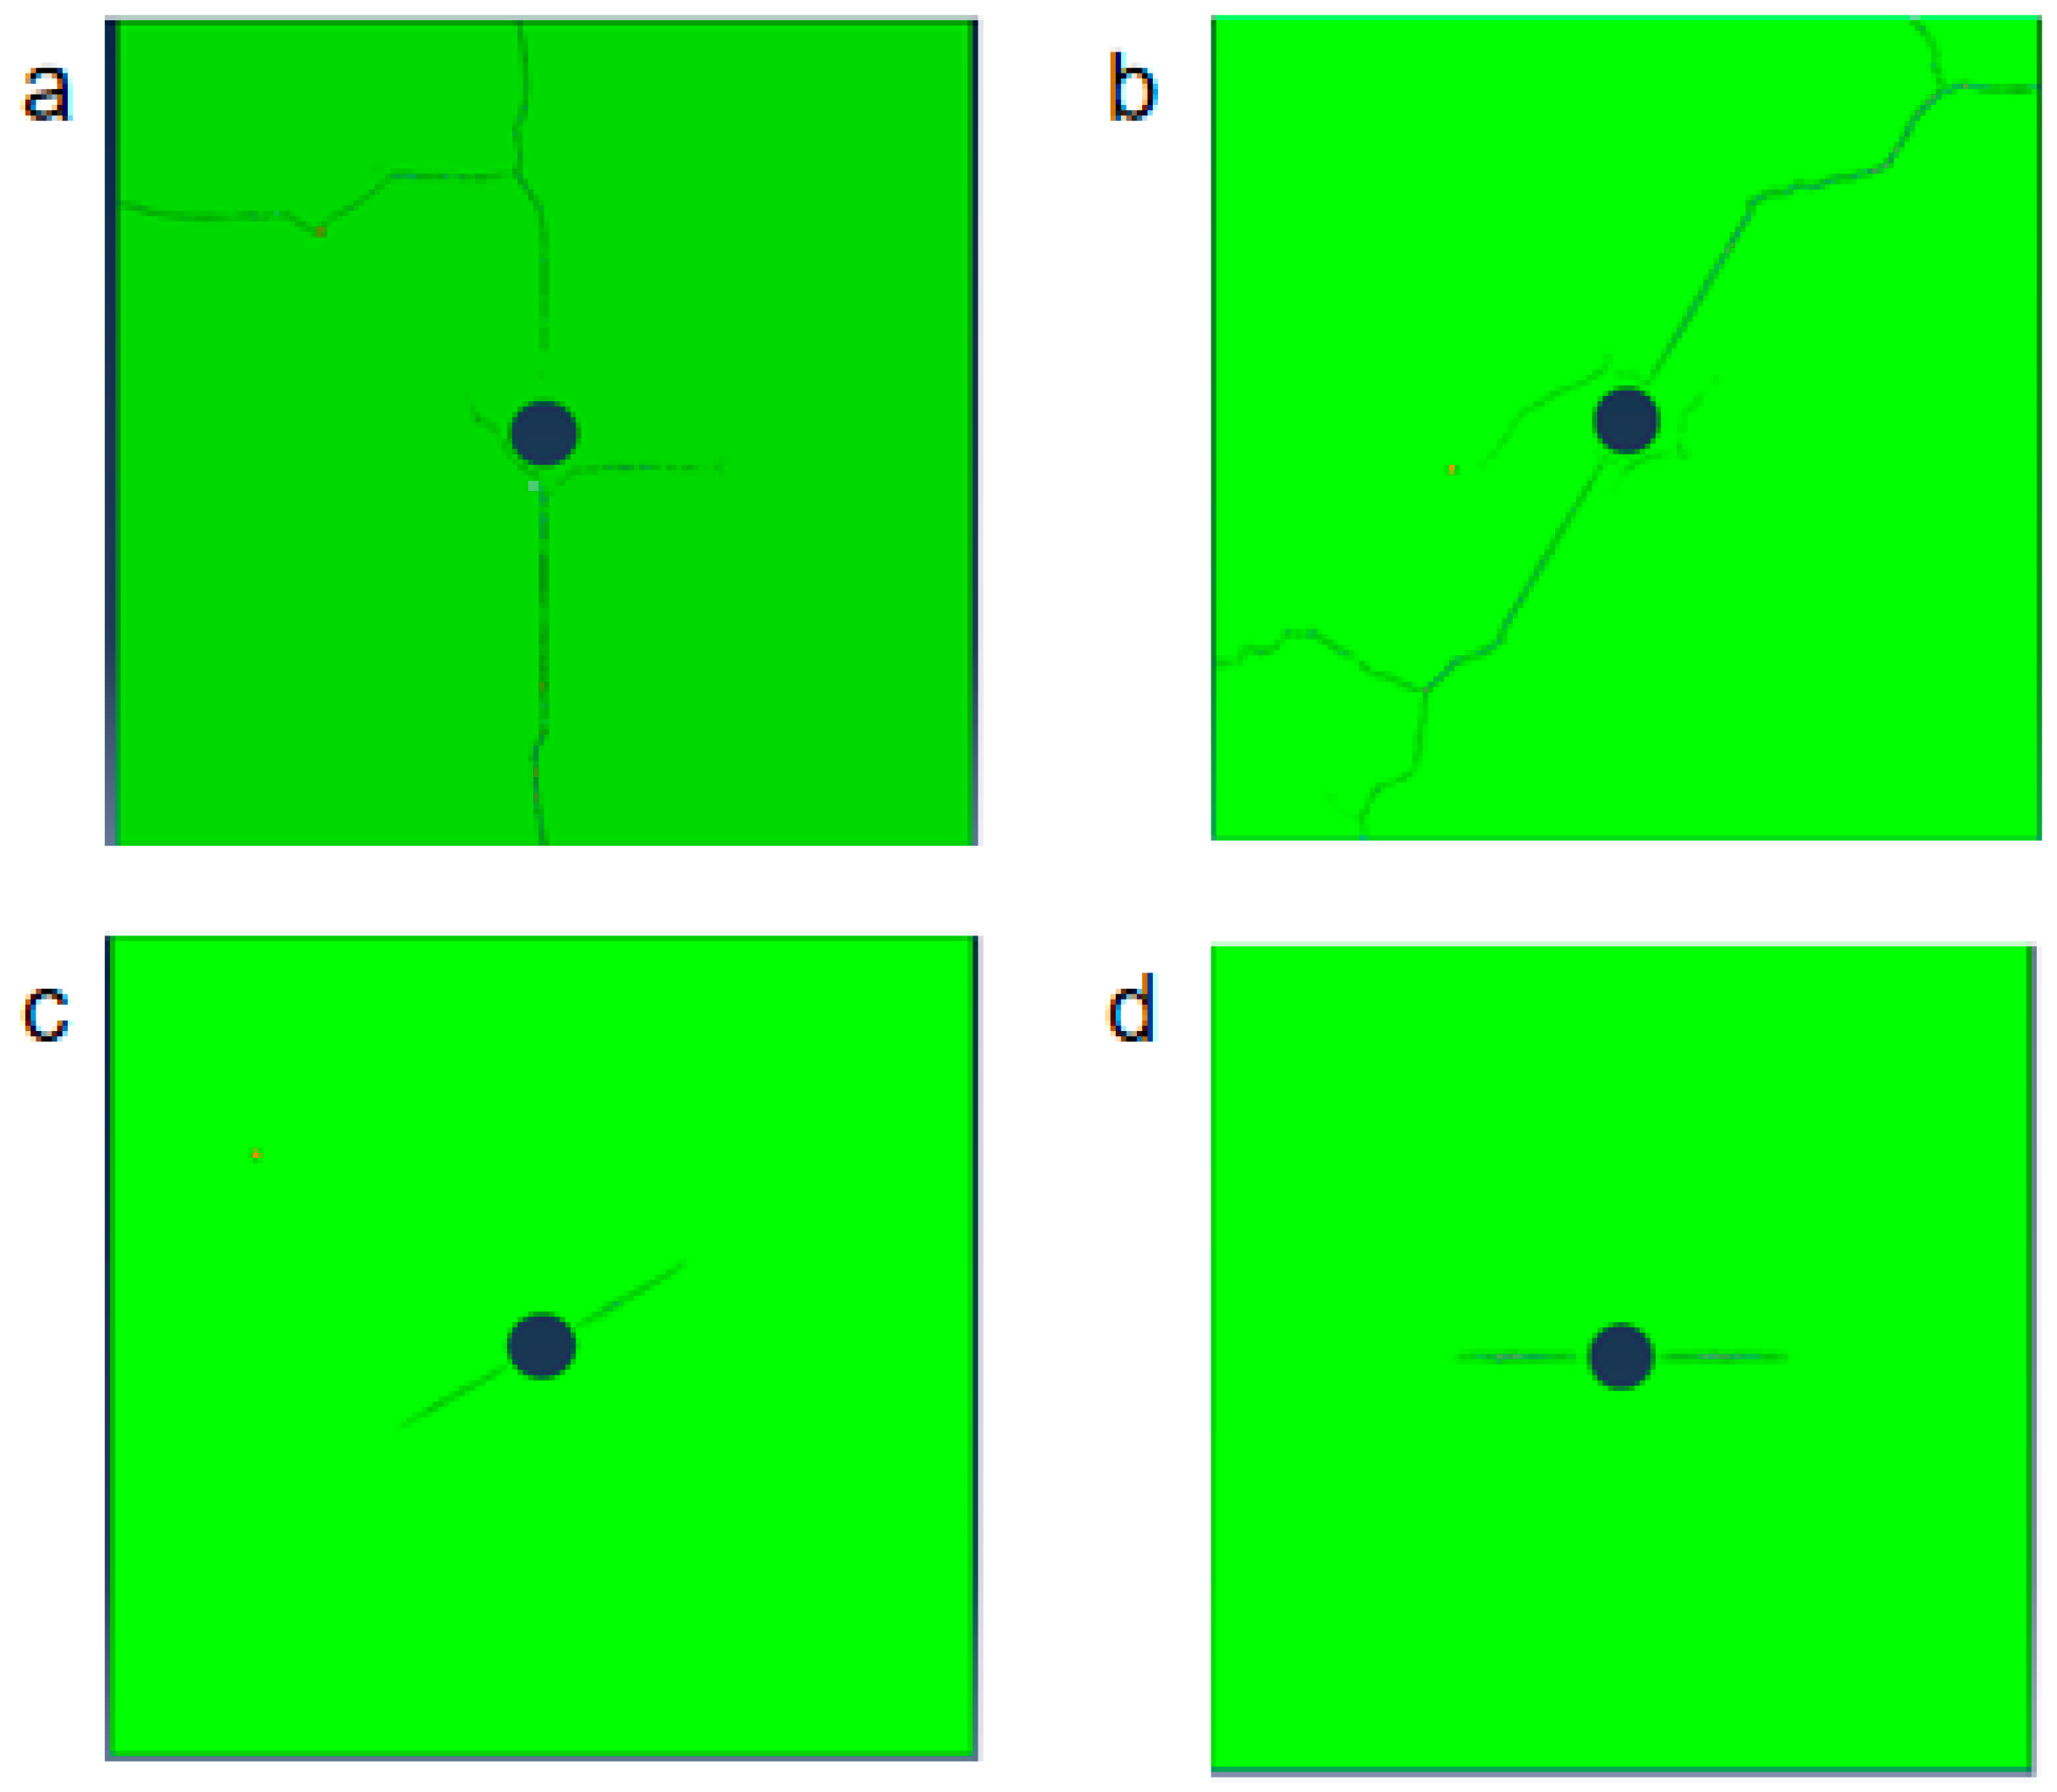
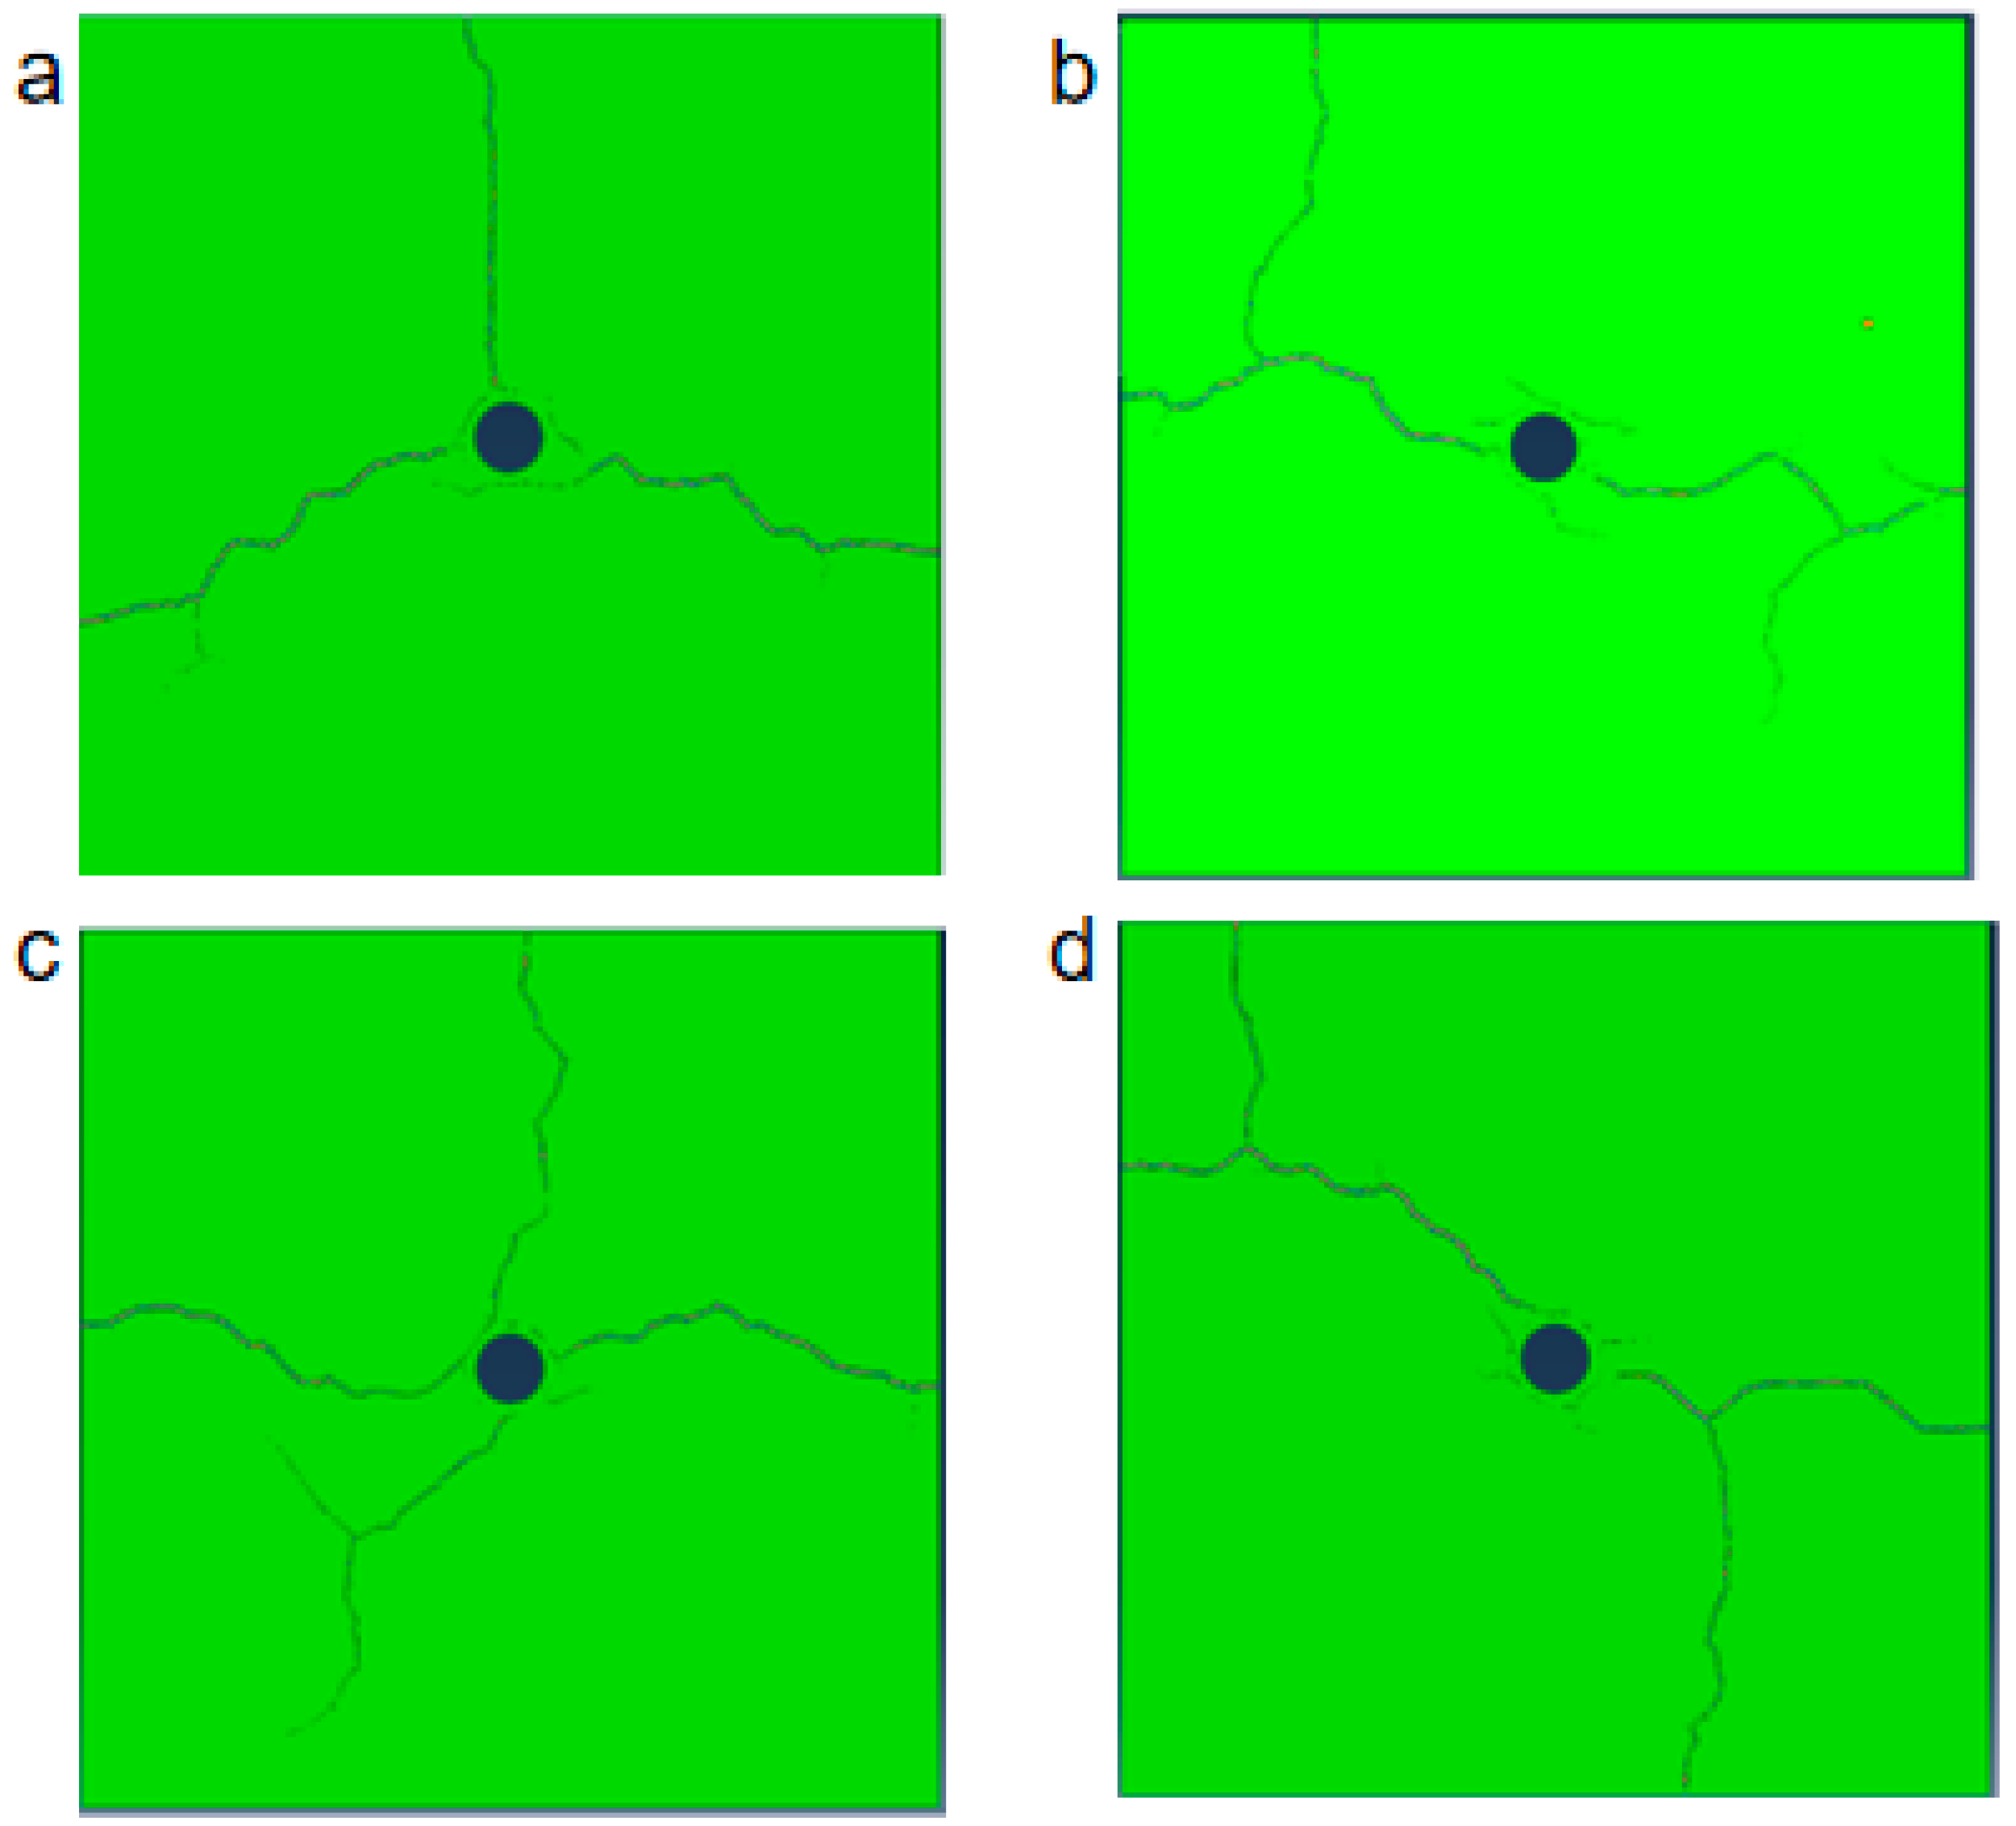
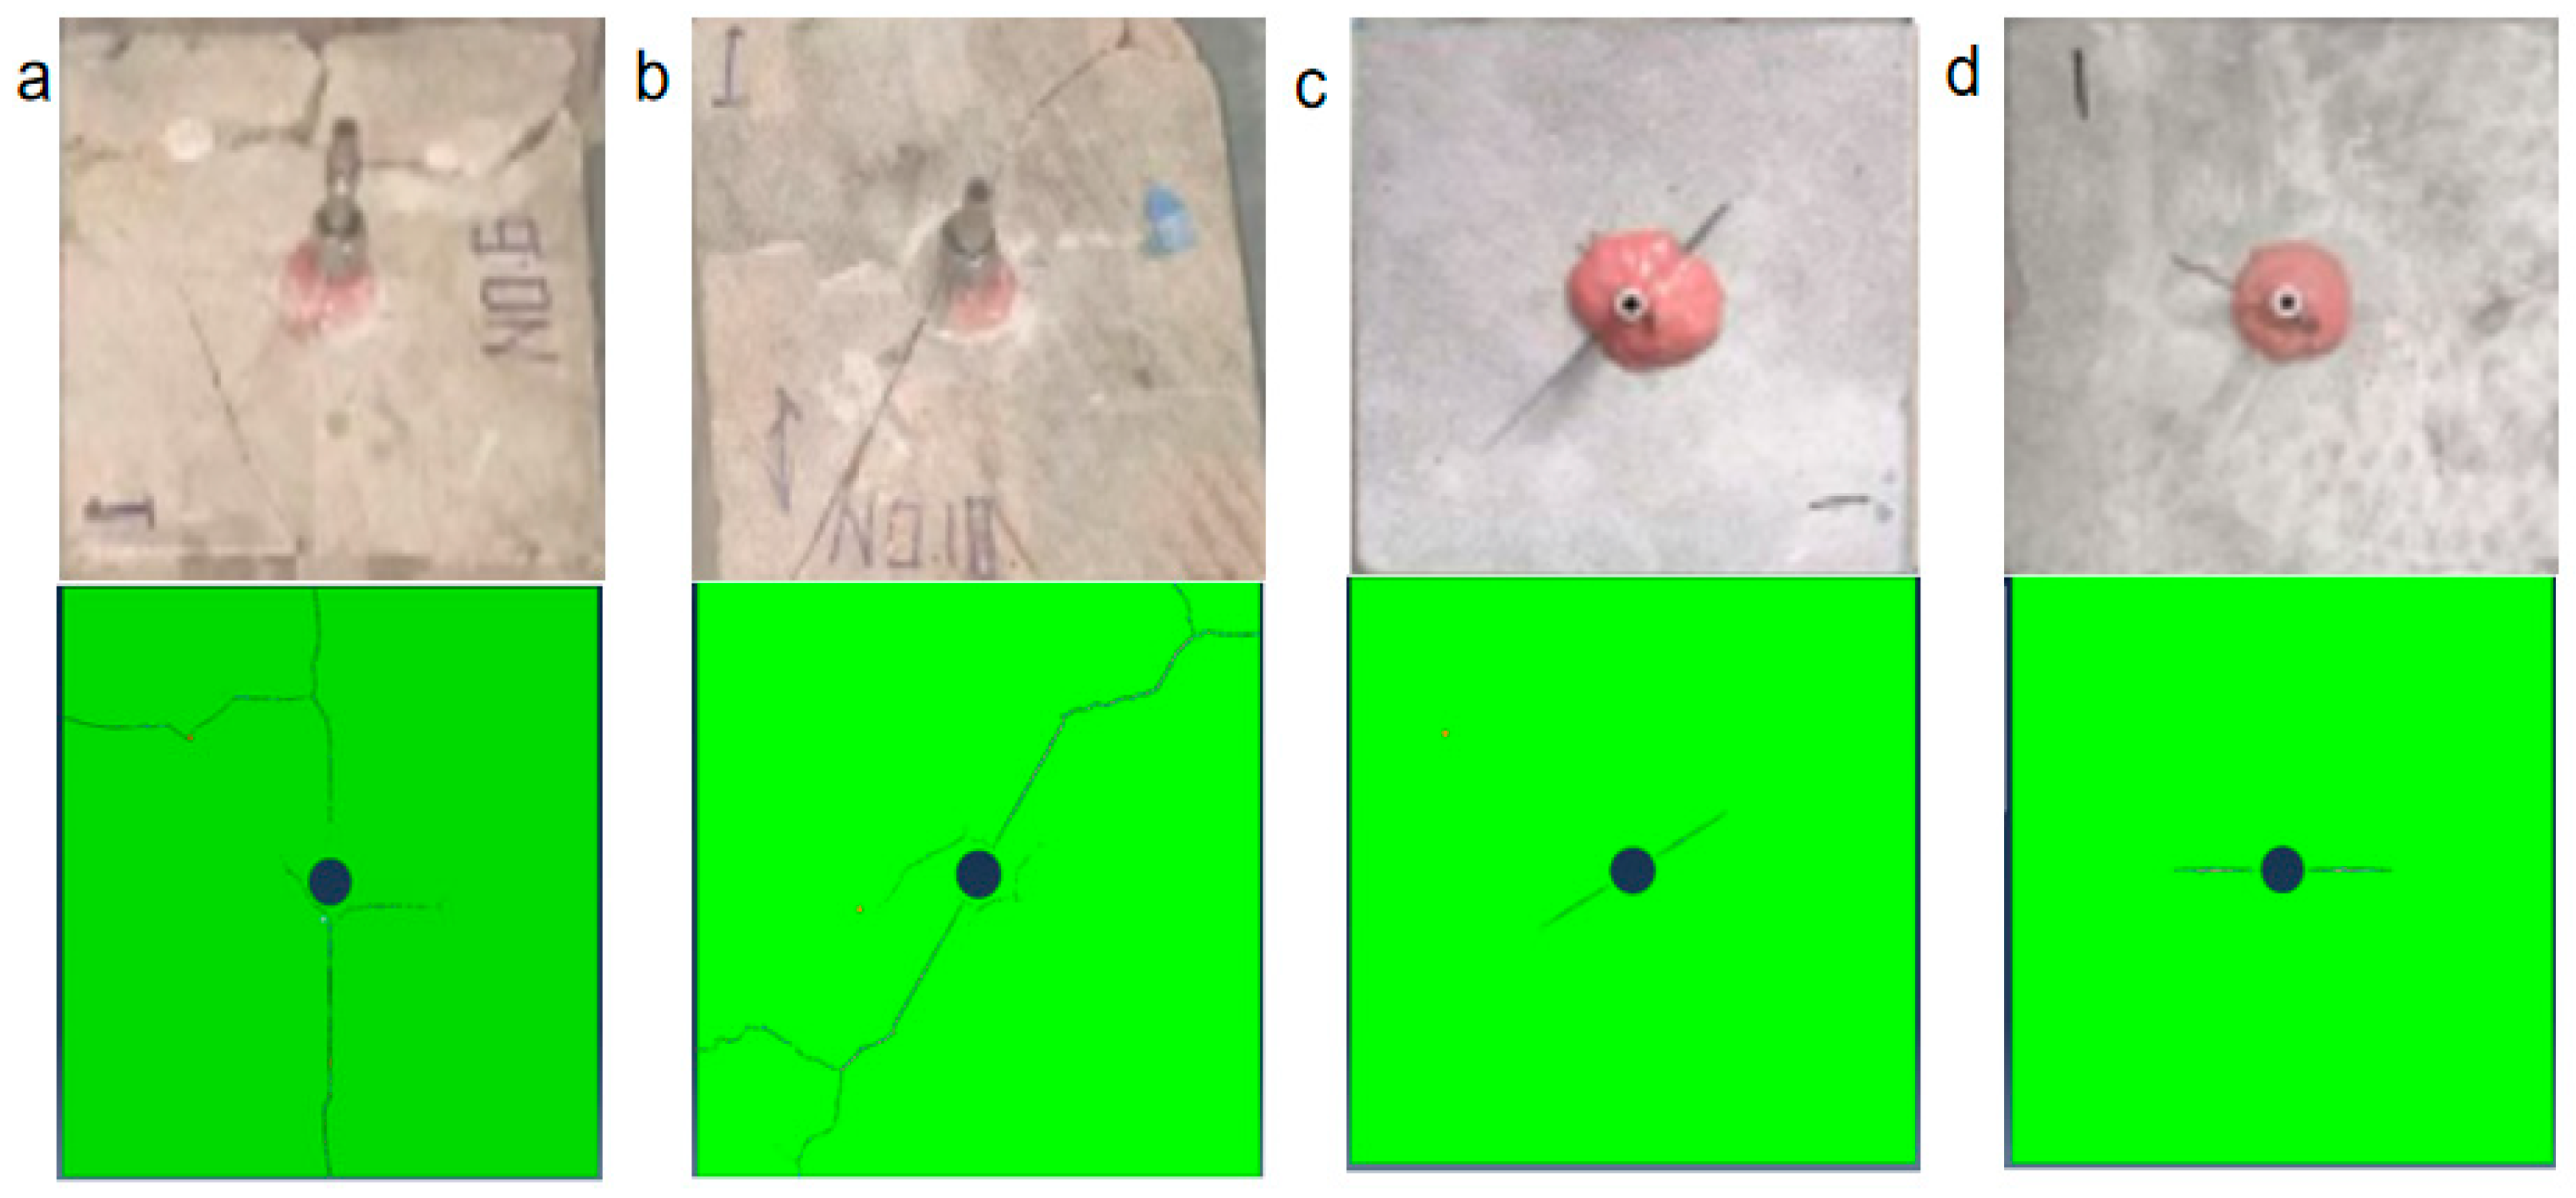
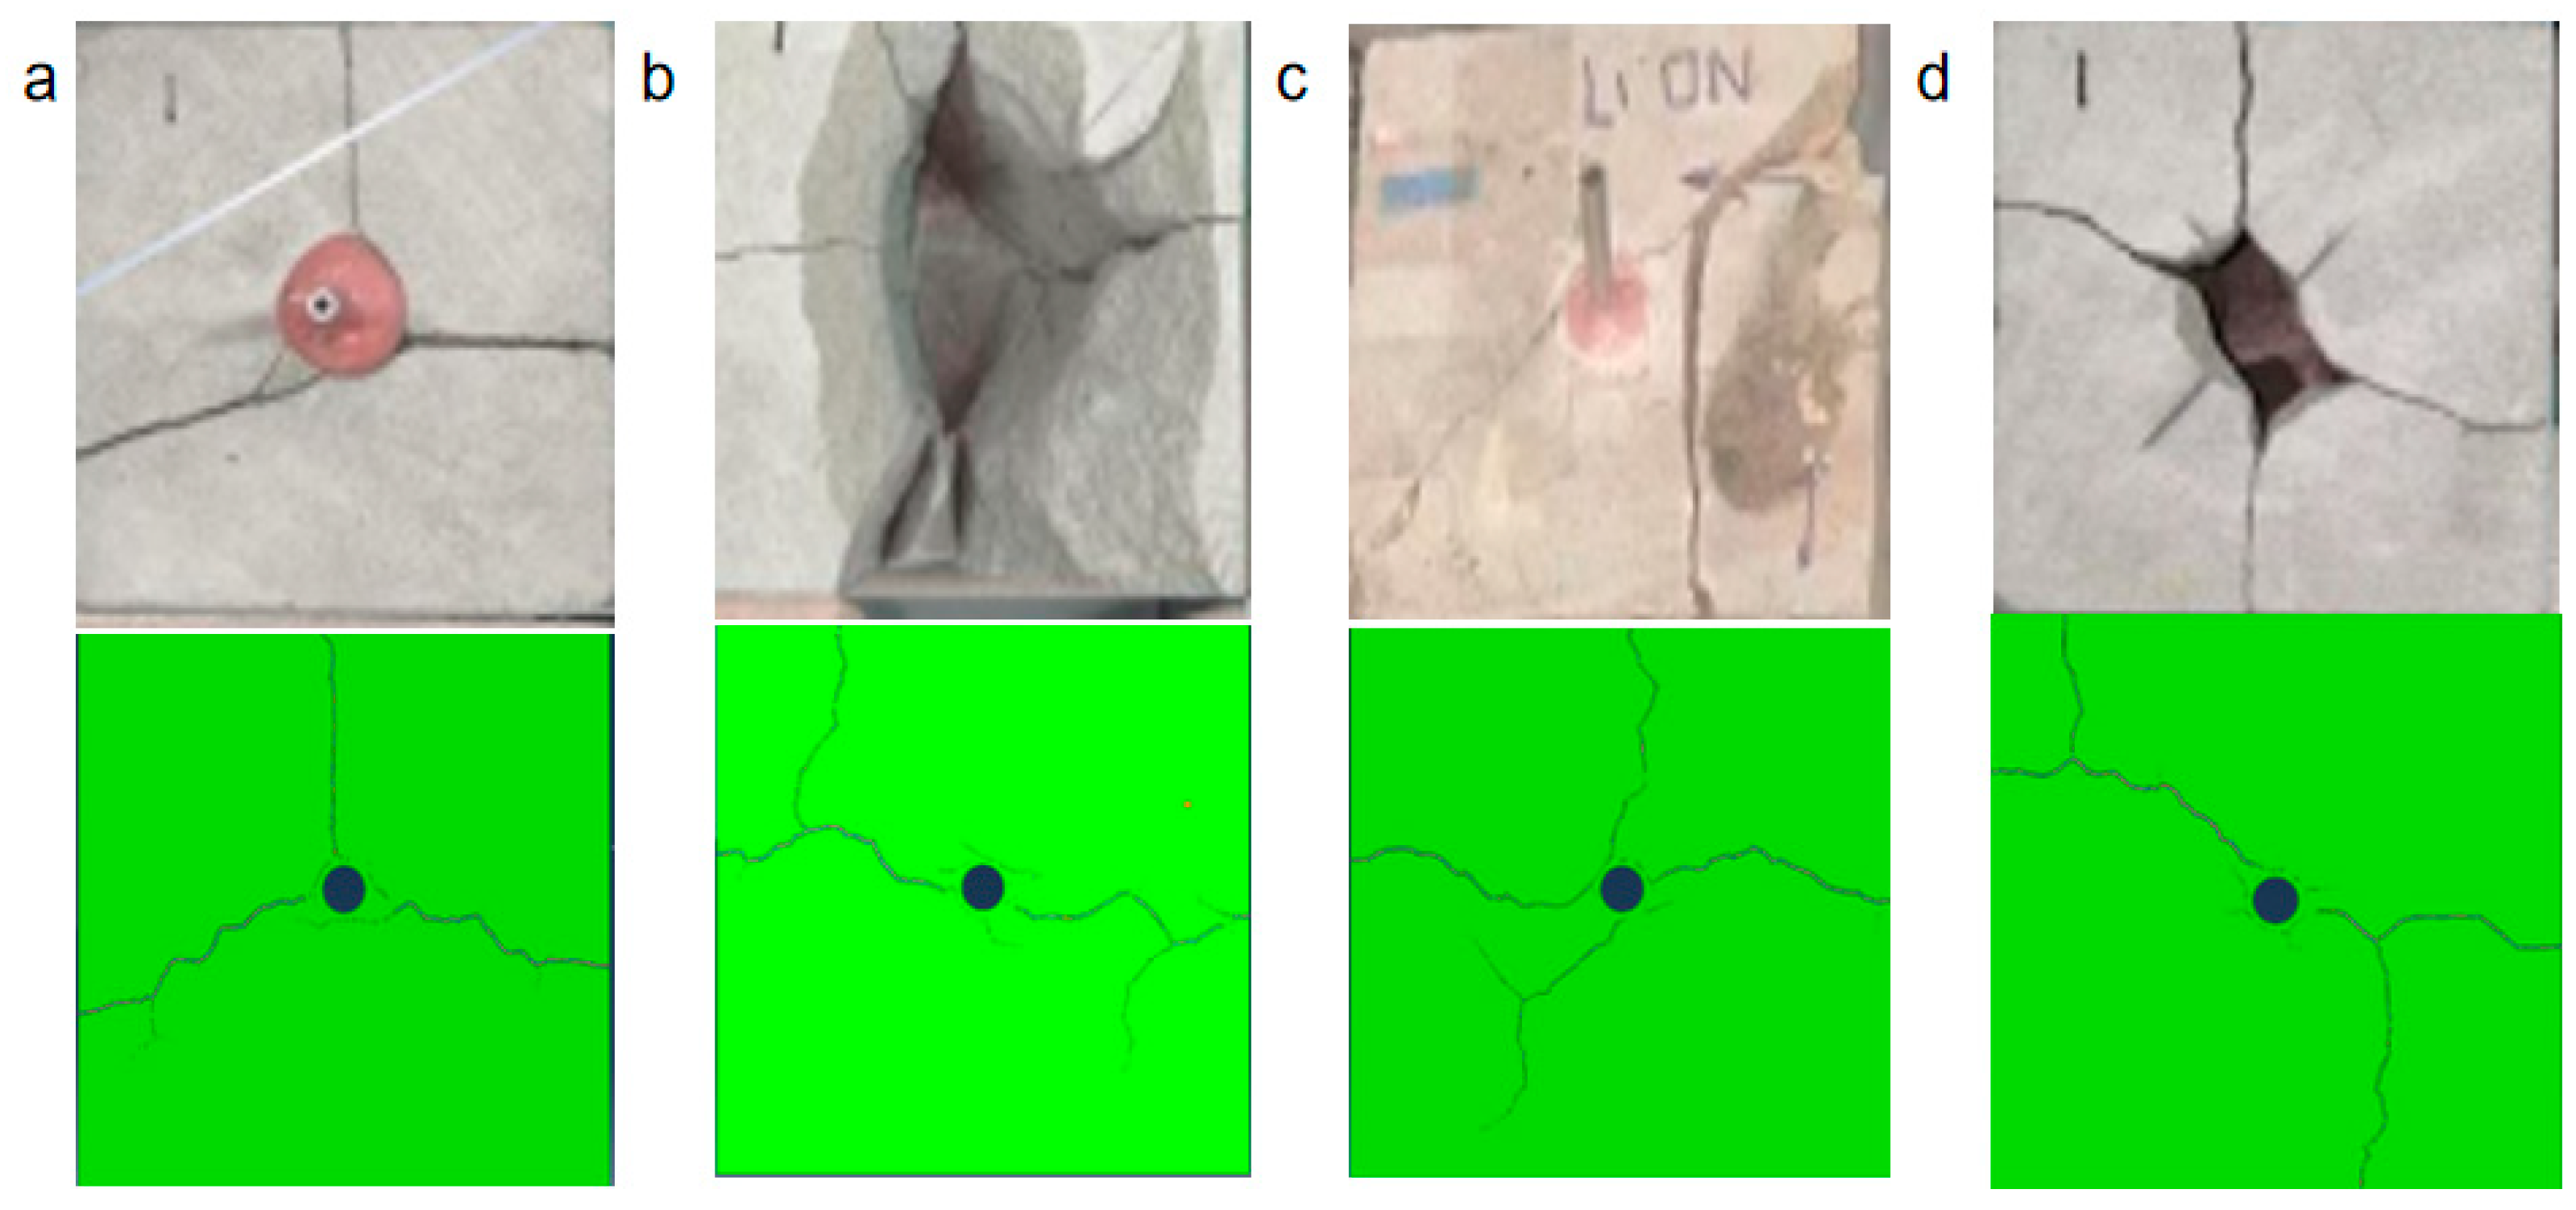
As shown in Figure 3, the main type of crack that is generated is the opening mode crack under the half-filled condition. When the fracture inclination angle is less than 30°, the fracture will expand along the natural fracture and generate branch fractures near the end face and also produce fine cracks near the wellbore to form a more complex fracture network. When the crack inclination angle is greater than 30°, it can be clearly seen that, except for the main fracture, no other obvious cracks are generated. As shown in Figure 4, the complexity of the cracks under the fully filled condition has significantly increased compared to the cracks under the half-filled condition, especially when the crack inclination angle is 60° and 90°, the fractures do not expand completely along the main fracture but will bend significantly and generate multiple branch fractures extending to the surface. When the crack inclination angle is 30°, the cracks and the angle perpendicular to the natural fracture expand, and multiple different angles of bending and branch fractures occur. When the crack inclination angle is 0°, three cracks will expand from the wellbore to the surface, and only one is along the main fracture.

3.2. The Influence of Filling Degree

Without filling, the fracture pressure of the specimen is 20.89 MPa. As shown in Figure 5, it is clearly visible that the fracture pressure in the semi-filled state is less than that in the no-filling state and the full-filling state. Moreover, regardless of the crack inclination angle, the fracture pressure will reach its maximum value in the full-filling state. When the crack inclination angle is 0°, the maximum fracture pressure is 21.54 MPa; when the crack inclination angle is 30°, the maximum fracture pressure is 21.62 MPa; when the crack inclination angle is 60°, the maximum fracture pressure is 21.08 MPa; and when the crack inclination angle is 90°, the maximum fracture pressure is 21.34 MPa.
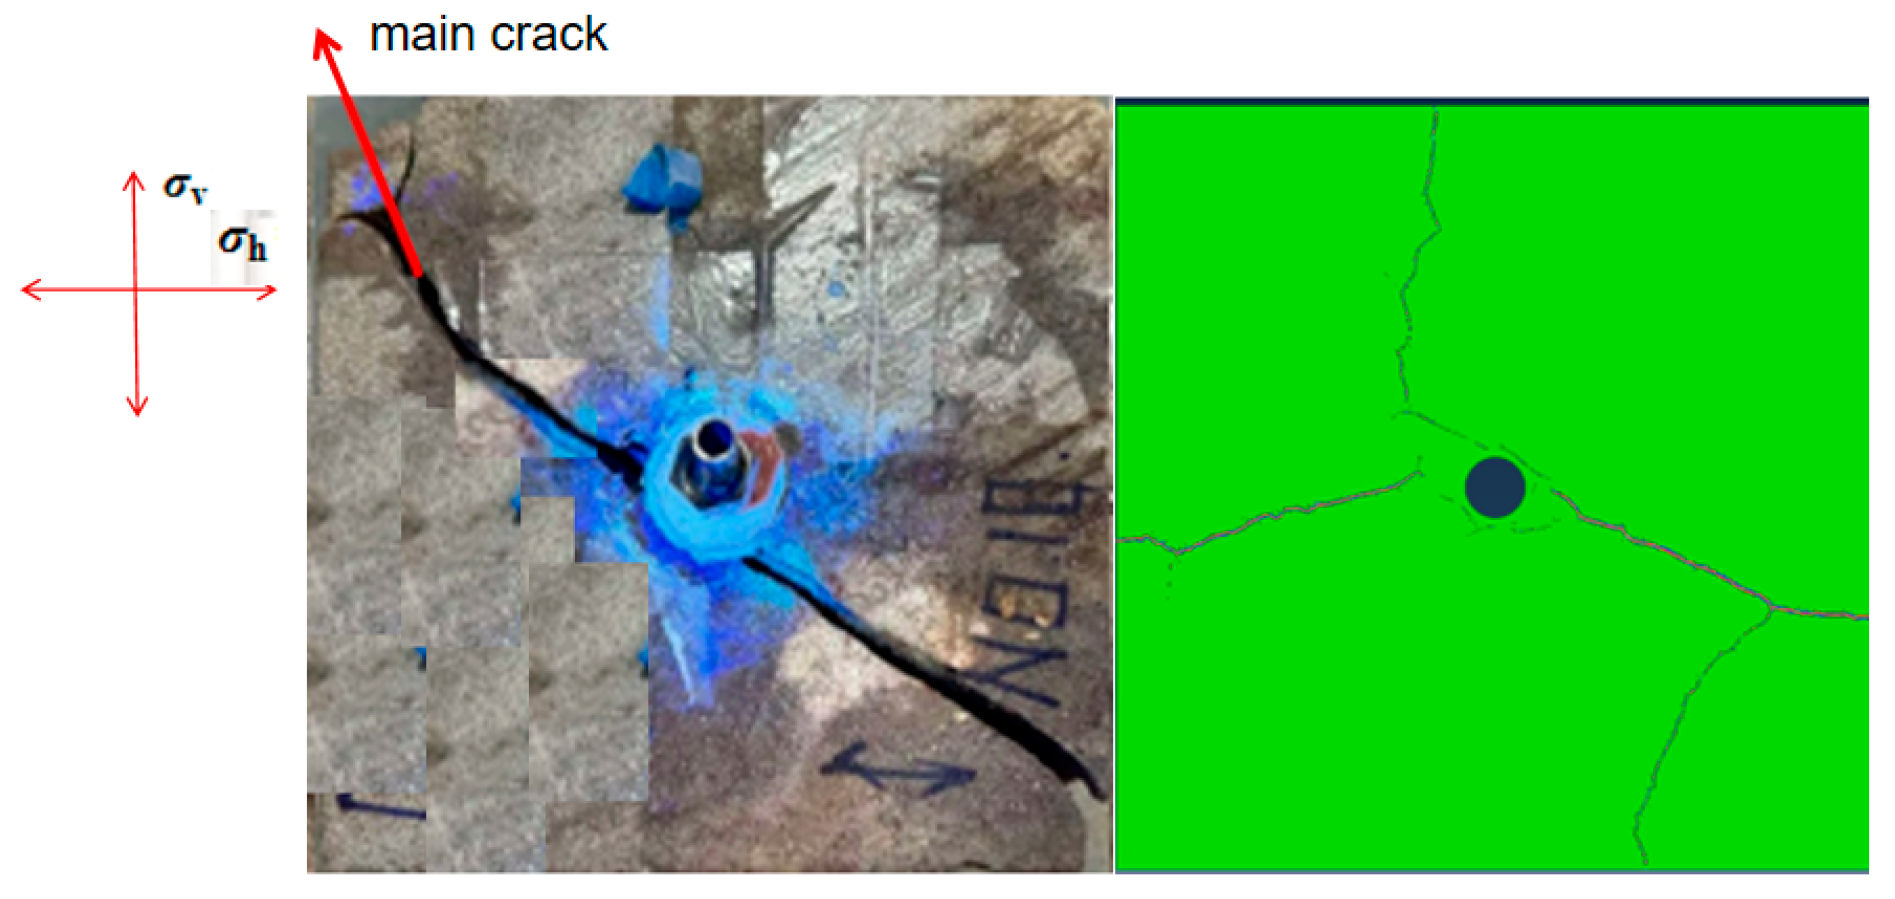
As shown in Figure 6, in the no-filling condition, three main fractures and multiple branch fractures are generated at the wellbore injection port. Two of the main fractures extend along the maximum principal stress direction to the end face, and the other main fracture extends along the direction perpendicular to the maximum principal stress to the end face. As shown in the figure, we can clearly see that the complexity of the cracks in the semi-filled state is lower than that in the no-filling state and the full-filling state.

3.3. Experimental Verification

3.3.1. Fracturing Pressure

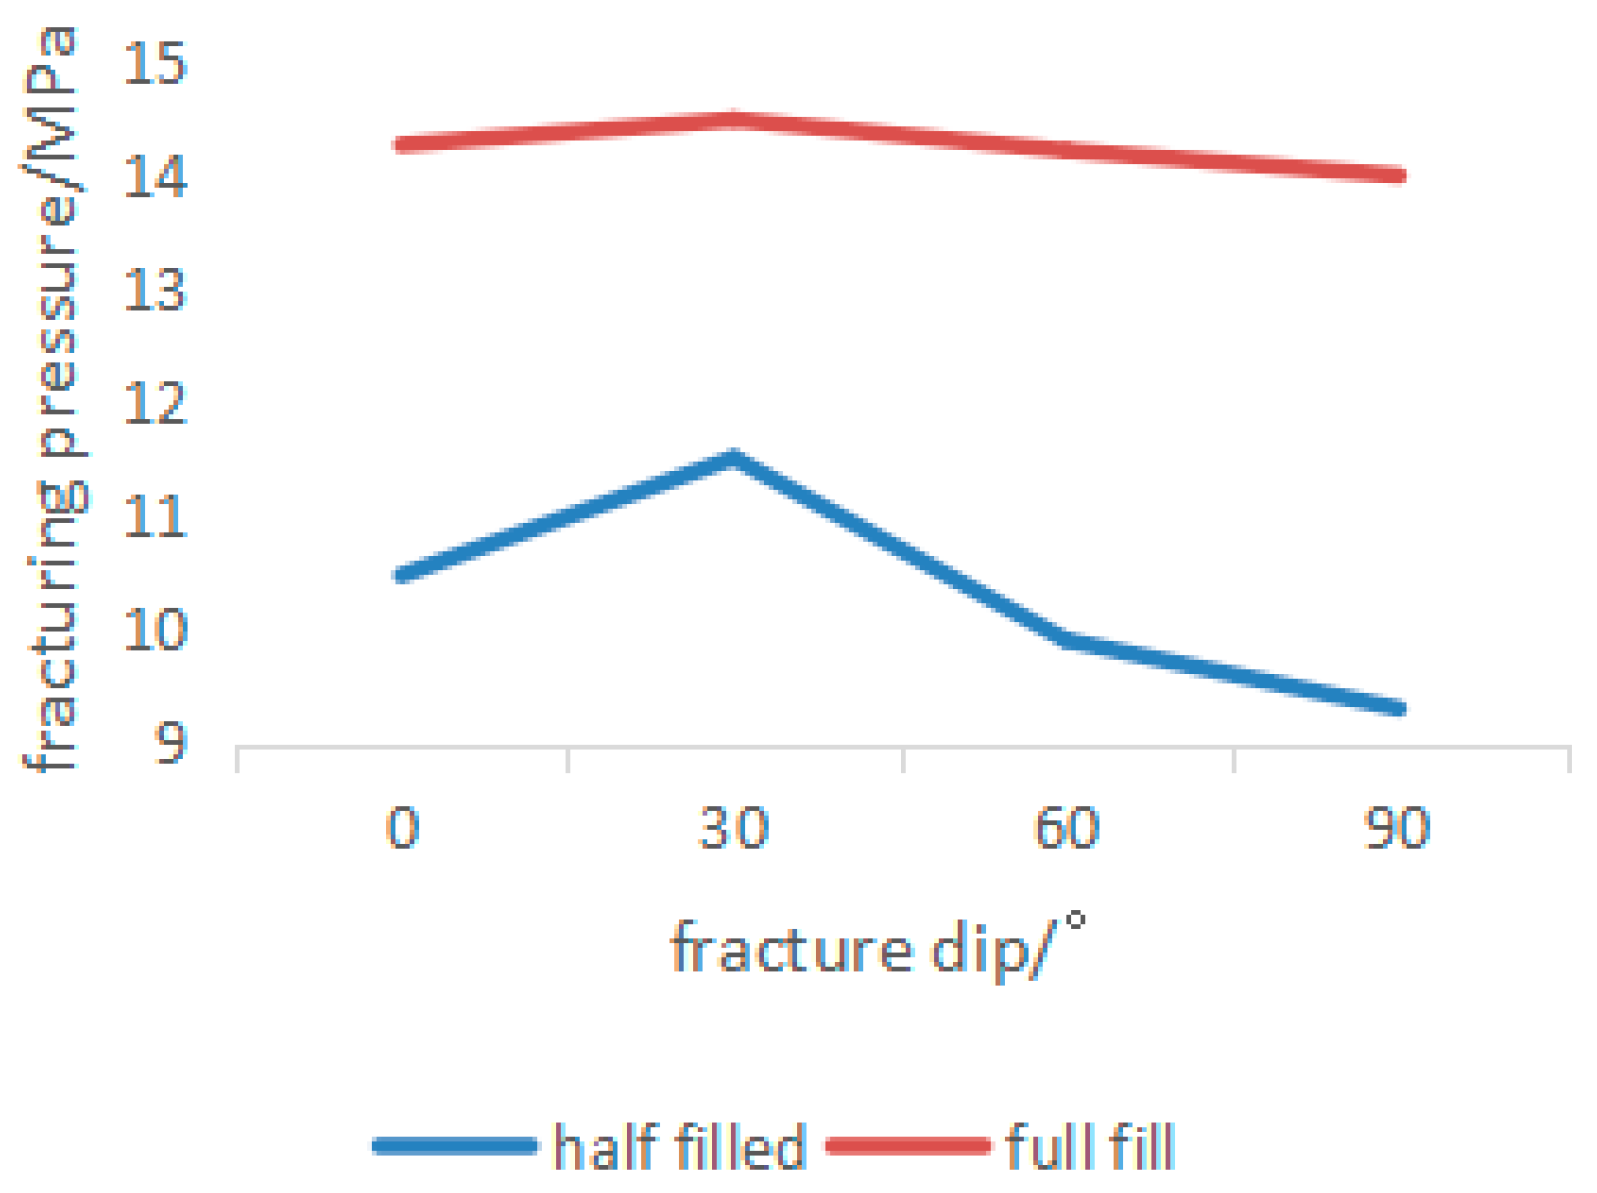
As shown in Figure 7, in the semi-filled state of the experiment, the fracture pressure reached its maximum value when the fracture inclination angle was 30°, with the maximum fracture pressure being 11.50 MPa. When the fracture inclination angle was greater than 30°, the fracture pressure gradually decreased. Similarly, in the fully filled state, the fracture pressure reached its maximum value at 30°, with the maximum fracture pressure being 14.47 MPa. Beyond 30°, the fracture pressure gradually decreased. The difference is that the fracture pressure in the fully filled state was generally within 13.9–14.5 MPa, with a very small difference, but the fracture pressure was much greater than that in the semi-filled state.
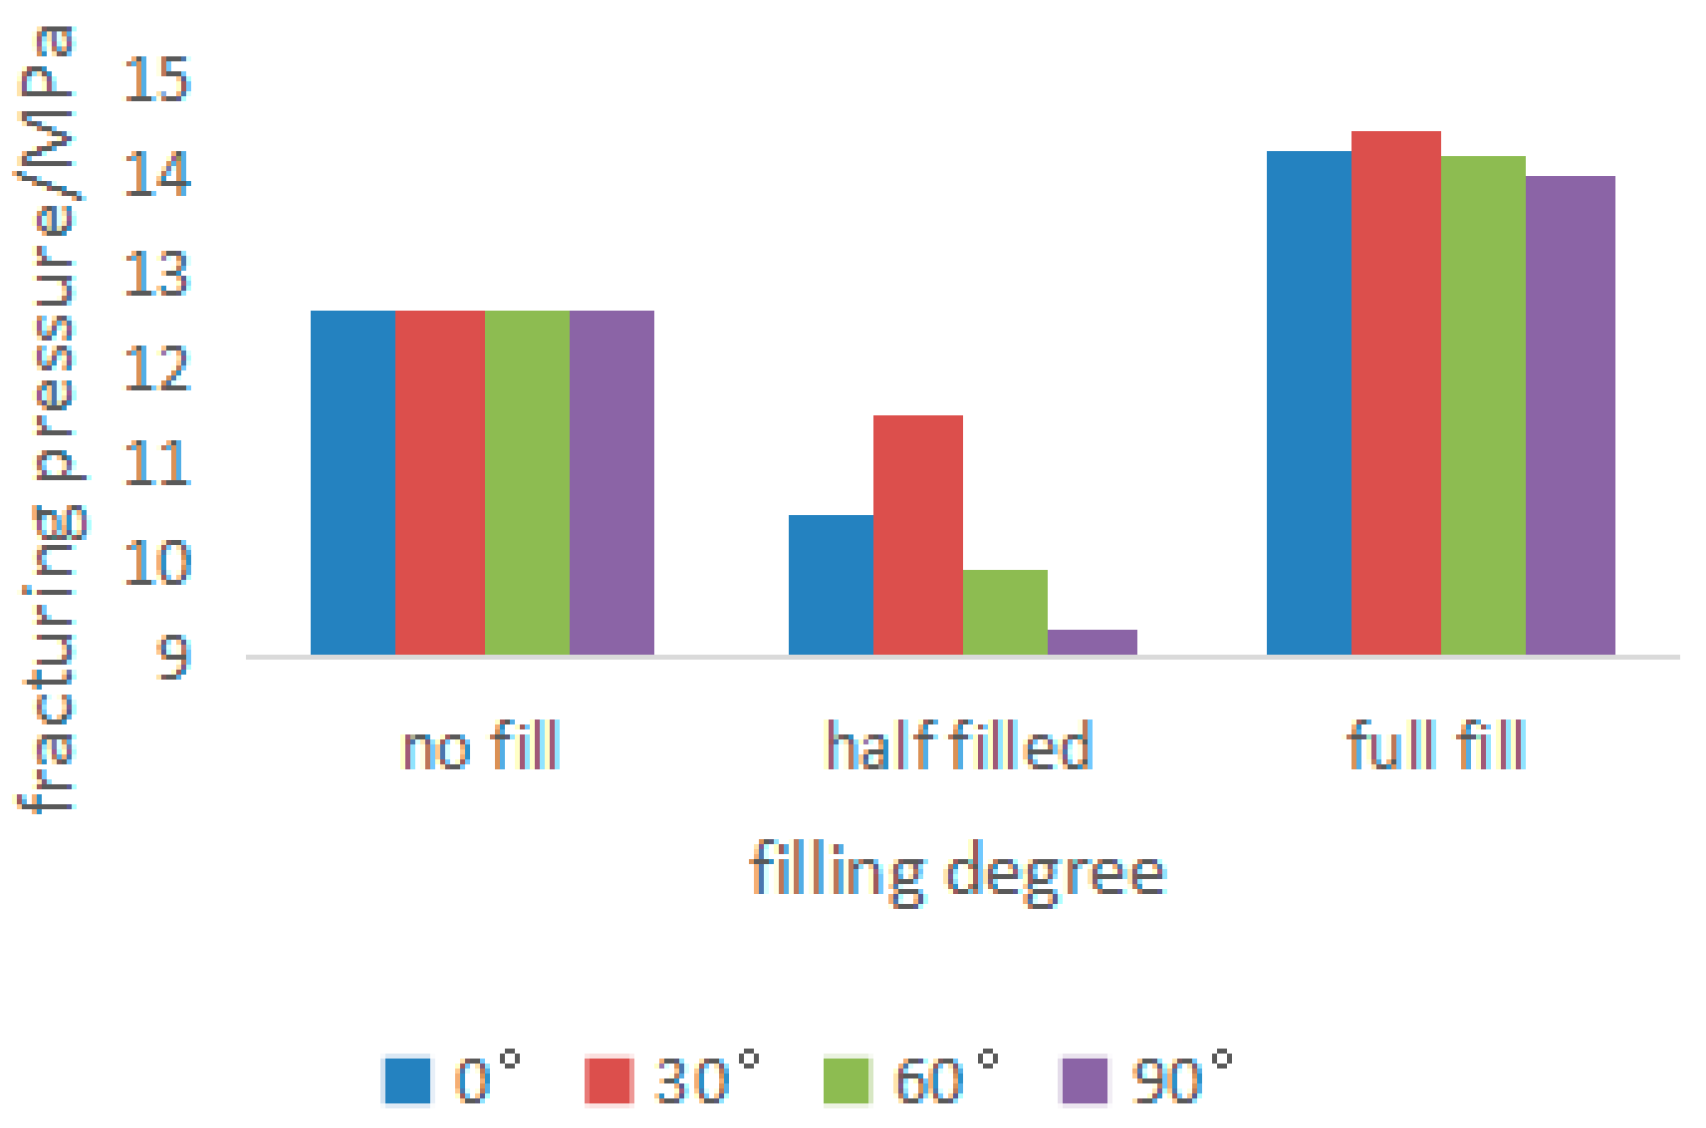
When considering the influence of the filling degree on the fracture pressure, as shown in Figure 8, the fracture pressure in the non-filled state was 12.58 MPa, which was greater than that in the semi-filled state but less than that in the fully filled state. This verified the correctness of the model.
At the same time, we can observe that in triaxial fracturing experiments, whether in the non-filled, semi-filled, or fully filled state, the fracture pressure of the specimens was significantly less than the fracture pressure simulated by this model. This is mainly because the test blocks used in the experiments were sandstones in their natural state, which contained more natural fractures that the naked eye could not detect. Moreover, when simulating the filling material in the experiments, it could not be precisely controlled as in numerical modeling, thus reducing the fracture pressure of the specimens.

3.3.2. Crack Propagation

As shown in Figure 9, in the unfloated state, the main fractures generated by hydraulic fracturing extend along the maximum principal stress plane to the end face and generate branch cracks at the end. In the semi-floated state, as shown in Figure 10, when the fracture inclination angle is greater than 30°, the cracks of the test piece can closely match the fractures generated by the model. However, when the crack inclination angle is 0°, the fractures of the hydraulic fracturing experimental test piece extend upward along the main fracture to the end face and generate multiple branch fractures and bends. In the fully floated state, as shown in Figure 11, we can observe that when the crack inclination angle is 0°, 30°, and 90°, the fractures of the hydraulic fracturing experimental test piece can also match the fractures of the model. However, when the crack inclination angle is 60°, the test piece fracture extends along the main fracture and will generate branch fractures that extend downward to the end face. Through intuitive comparison, we can find that the fractures generated by the test piece in the triaxial hydraulic fracturing test can basically match the fractures generated by the model in this paper. Only two test pieces have fractures that differ from those of the model, which is mainly because the model in this paper is two-dimensional modeling, while the triaxial hydraulic fracturing experiment is three-dimensional modeling, and it cannot fully reflect the extension direction of the fractures. At the same time, there are also other natural fractures in the test piece, which can also lead to the fractures not extending as expected. This difference is a normal phenomenon. At the same time, it also verifies the correctness of this model.

3.4. Discussion

During the fracturing process, the fracture pressure always reaches its maximum value at the full-filling degree and its minimum value at the semi-filling state. This is because the filling material has similar mechanical properties to the sandstone, and in full-filling condition, the fracturing model is closer to a completely integrated structure, resulting in a significantly enhanced compressive strength. Similarly, in the absence of filling, the model is also closer to a completely integrated structure. The difference is that in the semi-filling state, due to the other half material having slightly different properties from the sandstone, this causes the model’s compressive strength to slightly decrease. When considering the fracture inclination angle, the fracture pressure always reaches its maximum value when the crack inclination angle is 30°. When the crack inclination angle is greater than 30°, the fracture pressure will gradually decrease. This is mainly because, as the fracture inclination angle increases, the fracture surface gradually becomes perpendicular to the maximum principal stress direction, requiring a larger fracture pressure. And when the fracture inclination angle continues to increase, the required fracture pressure will become smaller and smaller.
In triaxial hydraulic fracturing experiments, the fracture pressure pattern is consistent with the model, but the fracture pressure generated by the experiments is less than that generated by the numerical modeling. This is mainly due to the presence of imperceptible natural fractures within the specimen, which reduces the fracture pressure required for the specimen to rupture. Considering that the model may have systematically overestimated stress, we conducted a control group experiment and found that the results were consistent with previous studies. Therefore, we excluded the option of overestimating stress.
The fracturing process is quite complex. Similarly, the filling state plays a major role in the complexity of the fractures. In both the absence of filling and full-filling states, the specimens generate multiple fractures, and during the fracture expansion process, there are also branched fractures, forming a complex fracture network. In the semi-filling state, the crack inclination angle has a significant impact on the formation and expansion of fractures. When the crack inclination angle is less than 30°, the fractures will expand along the natural fractures and generate branch fractures near the end face, and fine cracks will also form near the wellbore, resulting in a more complex fracture network. When the crack inclination angle is greater than 30°, it can be clearly seen that, except for the main fractures, no other obvious cracks are generated. This is mainly because in the absence of filling and full-filling states, fracturing requires a larger fracture pressure and takes a longer time, allowing the specimen sufficient time to generate cracks and expand. However, in the semi-filling state, although the fracture pressure is less than that in the full-filling state, the required pressure and time are still sufficient to generate multiple fractures. When the fracture inclination angle is greater than 60°, the angle between the fracture surface and the maximum principal stress plane gradually decreases, and the required fracture pressure also becomes smaller and smaller. The fracture pressure is insufficient to generate more fractures.
Considering the fractures, we found that the fractures generated by the specimens in the triaxial hydraulic fracturing experiments can largely match the fractures in this numerical model, with only a few having a low degree of matching. This is mainly related to the two-dimensional modeling used in this study, while the triaxial hydraulic fracturing experiments are three-dimensional and cannot fully reflect the actual direction of crack expansion. In addition, the natural fractures present in the test block will also affect the expansion path of the cracks in the experiment.

4. Conclusions

This paper establishes a seepage–stress model based on global cohesive units to predict the crack propagation paths under specific crack inclination and different filling states. This model takes into account multiple parameters of pore pressure and sandstone, and its correctness is verified through triaxial fracturing experiments.
(1)
The results show that the fracture pressure and crack propagation paths are significantly influenced by the filling level. At the same time, the fracture pressure and crack propagation paths are also affected by the crack inclination.
(2)
The fracture pressure always reaches its maximum value at the fully filled degree and reaches its minimum value at the semi-filled state. When considering the crack inclination, the fracture pressure always reaches its maximum value when the crack inclination is 30°. When the crack inclination is greater than 30°, the fracture pressure will gradually decrease.
(3)
In the semi-filled state, when the crack inclination is less than 30°, the crack will propagate along the natural crack and generate branch cracks near the end face. Small cracks will also form near the wellbore, forming a more complex crack network. When the crack inclination is greater than 30°, it can be clearly seen that, except for the main crack, no other obvious cracks are generated. The complexity of the cracks in the full-filling state significantly increases, especially when the crack inclination is 60° and 90°, as the cracks do not completely propagate along the natural cracks but will bend significantly and generate multiple branch cracks extending to the surface. When the crack inclination is 30°, the cracks extend and branch at an angle perpendicular to the natural crack, and multiple different angles of bending and branch cracks occur. When the crack inclination is 0°, three cracks will extend from the wellbore to the surface, and only one extends along the main crack.
(4)
Based on the true triaxial hydraulic fracturing test, the obtained fracture propagation pattern is consistent with the model. However, due to the presence of natural fractures and other factors, the fracture pressure is relatively low.

Author Contributions

All authors contributed to the study conception and design. Material preparation, data collection and analysis were performed by S.X. The first draft of the manuscript was written by S.X., W.Y. and Y.L. All authors have read and agreed to the published version of the manuscript.

Funding

This research received no external funding.

Data Availability Statement

The original contributions presented in this study are included in the article. Further inquiries can be directed to the corresponding author.

Conflicts of Interest

The authors declare no conflicts of interest.

References

  1. Wu, X.; Huang, Z.; Long, T.; Li, G.; Tian, S.; Wang, H.; Yang, R.; Li, K.; Wang, Z. Radial Wellbore Cross-Layer Fracturing in Multi-Lithologic Superimposed Shale Oil Reservoirs: A Laboratory Study. Engineering 2025, 45, 188–211. [Google Scholar] [CrossRef]
  2. Qiu, G.; Chang, X.; Li, J.; Guo, Y.; Zhou, Z.; Wang, L.; Wan, Y.; Wang, X. Study on the interaction between hydraulic fracture and natural fracture under high stress. Theor. Appl. Fract. Mech. 2024, 130, 104259. [Google Scholar] [CrossRef]
  3. Deng, D.; Ren, Q.; Yang, Y.; Wang, J.; Zeng, C.; He, P.; Liu, J.; Liu, P.; Luo, Y. Investigation of Hydraulic Fracture Propagation Characteristics in the Shale Reservoir with Natural Fractures and Bedding Plane. Geofluids 2025, 2025, 9970558. [Google Scholar] [CrossRef]
  4. Wei, C.; Yu, L.; Geng, S.; Yuan, Z.; Wang, Y. Experimental and numerical studies on propagation behavior between hydraulic fractures and pre-existing fractures under prepulse combined hydraulic fracturing. J. Rock Mech. Geotech. Eng. 2025, 17, 2879–2892. [Google Scholar] [CrossRef]
  5. Qin, M.; Yang, D.; Jia, Y.; Zhou, Y. Peridynamics modeling of hydraulic fracture interaction with natural fractures in fractured rock mass. Eng. Fract. Mech. 2024, 307, 110299. [Google Scholar] [CrossRef]
  6. Barbosa, L.G.; Cleto, P.R.; Maedo, M.A.; Camargo, M.; Rodrigues, E.A.; Manzoli, O.L. Simulation of the natural fractures influence on hydraulic fractures propagation using high aspect ratio interface elements. Comput. Geotech. 2025, 179, 107026. [Google Scholar] [CrossRef]
  7. Zheng, Y.; He, R.; Huang, L.; Bai, Y.; Wang, C.; Chen, W.; Wang, W. Exploring the effect of engineering parameters on the penetration of hydraulic fractures through bedding planes in different propagation regimes. Comput. Geotech. 2022, 146, 104736. [Google Scholar] [CrossRef]
  8. Han, P.; Wang, K.; Pang, J.; Ji, X.; Zhang, C. Response properties of geometries of coal penetrating fracture on seepage behavior. Int. J. Min. Sci. Technol. 2025, 35, 191–211. [Google Scholar] [CrossRef]
  9. Zhong, C.; Chen, J.; Leung, J.Y. Analysis of downhole temperature-strain response in hydraulic fracturing—A coupled geomechanics-thermal-flow simulation approach. Geoenergy Sci. Eng. 2025, 247, 213710. [Google Scholar] [CrossRef]
  10. Tan, P.; Chen, Z.W.; Huang, L.K.; Zhao, Q.; Shao, S.R. Evaluation of the combined influence of geological layer property and in-situ stresses on fracture height growth for layered formations. Pet. Sci. 2024, 21, 3222–3236. [Google Scholar] [CrossRef]
  11. Cruz, F.; Roehl, D.; do Amaral Vargas, E., Jr. An XFEM implementation in Abaqus to model intersections between fractures in porous rocks. Comput. Geotech. 2019, 112, 135–146. [Google Scholar] [CrossRef]
  12. Kong, X.; Huang, H.; Xie, G.; Yan, R.; Xu, H.; Li, S. Experimental study on equilibrium initiation and extension of multiple clusters of fractures based on true triaxial physical simulation. J. Nat. Gas Geosci. 2023, 8, 349–362. [Google Scholar] [CrossRef]
  13. Huang, T.; Zhu, H.; Liu, Q.; Dai, X.; Tang, X.; Yi, X.; He, X.; She, C.; Zheng, M. Study on multi-cluster fracture interlaced competition propagation model of hydraulic fracturing in heterogeneous reservoir. Geoenergy Sci. Eng. 2025, 244, 213415. [Google Scholar] [CrossRef]
  14. Ouchi, H.; Foster, J.T.; Sharma, M.M. Effect of reservoir heterogeneity on the vertical migration of hydraulic fractures. J. Pet. Sci. Eng. 2017, 151, 384–408. [Google Scholar] [CrossRef]
  15. Nagaso, M.; Mikada, H.; Takekawa, J. The role of rock strength heterogeneities in complex hydraulic fracture formation–numerical simulation approach for the comparison to the effects of brittleness. J. Pet. Sci. Eng. 2018, 172, 572–587. [Google Scholar] [CrossRef]
  16. Parvizi, H.; Rezaei-Gomari, S.; Nabhani, F.; Turner, A. Evaluation of heterogeneity impact on hydraulic fracturing performance. J. Pet. Sci. Eng. 2017, 154, 344–353. [Google Scholar] [CrossRef]
  17. Zhao, J.; Zhao, J.; Hu, Y.; Zhang, S.; Huang, T.; Liu, X. Numerical simulation of multistage fracturing optimization and application in coalbed methane horizontal wells. Eng. Fract. Mech. 2020, 223, 106738. [Google Scholar] [CrossRef]
  18. Azarov, A.V.; Serdyukov, S.V. Stress Determination in Rock Mass by Fracture Propagation Pressure Nearby Cylindrical Opening. J. Min. Sci. 2025, 61, 13–28. [Google Scholar] [CrossRef]
  19. Li, X. Fracture reorientation mechanism during hydraulic fracturing based on XFEM simulation. Front. Earth Sci. 2024, 12, 1503934. [Google Scholar] [CrossRef]
  20. Zhong, Y.; Yu, H.; Wang, Q.; Chen, X.; Ke, X.; Huang, H.; Wu, H. Hydraulic fracturing in layered heterogeneous shale: The interaction between adjacent weak interfaces. Eng. Fract. Mech. 2024, 303, 110115. [Google Scholar] [CrossRef]
  21. Wang, Y.; Hou, B.; Wang, D.; Jia, Z. Features of fracture height propagation in cross-layer fracturing of shale oil reservoirs. Pet. Explor. Dev. 2021, 48, 469–479. [Google Scholar] [CrossRef]
  22. Zou, Y.S.; Yang, C.; Zhang, S.C.; Ma, X.F.; Li, Y.C.; Zou, L.Q. Multi-fracture growth behavior during TPDF in a horizontal well of multi-clustered perforations: An experimental research. Pet. Sci. 2024, 21, 4230–4247. [Google Scholar] [CrossRef]
  23. He, L.; Eyre, M.; Coggan, J.; Holley, S.; Watkins, D. Investigating hydraulic anisotropy of fractured rock mass using three-dimensional numerical modelling and laser scanning: A case study at South Crofty mine in Cornwall, UK. J. Hydrol. Reg. Stud. 2025, 60, 102541. [Google Scholar] [CrossRef]
  24. Sarkar, P.; Yoon, S.; Kim, J.; Baek, S.; Sun, A.; Yoon, H. Surrogate models for development of unconventional shale reservoirs by an integrated numerical approach of hydraulic fracturing, flow and geomechanics, and machine learning. Geomech. Energy Environ. 2025, 43, 100691. [Google Scholar] [CrossRef]
  25. Liu, Y.; Peng, Z.; Liu, Z.H.; Wu, L.; Wu, Y.; Guo, J. The impact of step sizes on pressure prediction in fracturing treatment via deep learning algorithms. Pet. Sci. Technol. 2025, 43, 2572–2588. [Google Scholar] [CrossRef]
  26. Konstantinou, C.; Papanastasiou, P. A data-driven and machine learning-assisted interpretation of hydraulic fracturing experiments in various formations. Geomech. Energy Environ. 2025, 43, 100707. [Google Scholar] [CrossRef]
  27. Liu, M.; Xie, H.; Pan, W.; Ding, S.; Li, G. Prediction of cutting force via machine learning: State of the art, challenges and potentials. J. Intell. Manuf. 2023, 36, 703–764. [Google Scholar] [CrossRef]
  28. Der, O.; Tasci, M.; Basar, G.; Ercetin, A. Intelligent modeling and prediction of CO2 laser cutting performance in FFF-printed thermoplastics using machine learning algorithms. Proc. Inst. Mech. Eng. Part E J. Process Mech. Eng. 2025. [Google Scholar] [CrossRef]
  29. Swapnil, K.; Abhijit, C.; Avtar, S.; Siladitya, P. Phase field method to model hydraulic fracturing in saturated porous reservoir with natural fractures. Eng. Fract. Mech. 2023, 286, 109289. [Google Scholar] [CrossRef]
  30. Zhou, S.; Zhuang, X.; Rabczuk, T. Phase field method for quasi-static hydro-fracture in porous media under stress boundary condition considering the effect of initial stress field. Theor. Appl. Fract. Mech. 2020, 107, 102523. [Google Scholar] [CrossRef]
  31. Navidtehrani, Y.; Betegón, C.; Vallejos, J.; Martínez-Pañeda, E. A phase field model for hydraulic fracture: Drucker–Prager driving force and a hybrid coupling strategy. Comput. Methods Appl. Mech. Eng. 2025, 444, 118155. [Google Scholar] [CrossRef]
  32. Yang, Z.; Liu, J.; Yi, L.; Yi, D.; Li, X. A Cohesive Phase-Field Model for Dynamic Mixed-Mode Hydraulic Fractures. Rock Mech. Rock Eng. 2025, 1–23. [Google Scholar] [CrossRef]
  33. Wang, J. Hydraulic Fracturing Simulation of Concrete Face Slab Based on XFEM and Cohesive Model. China Water Power Electrif. 2025, 6, 11–17. [Google Scholar] [CrossRef]
  34. Li, W.; Li, Y.; Xin, J.; Huang, H. Research on the effect mechanism of mesoscopic damage behavior of microencapsulated resin mineral composites based on cohesive elements. Comput. Part. Mech. 2025, 1–15. [Google Scholar] [CrossRef]
  35. ABAQUS Inc. ABAQUS Analysis User’s Manual; Dassault Systèmes: Providence, RI, USA, 2023. [Google Scholar]
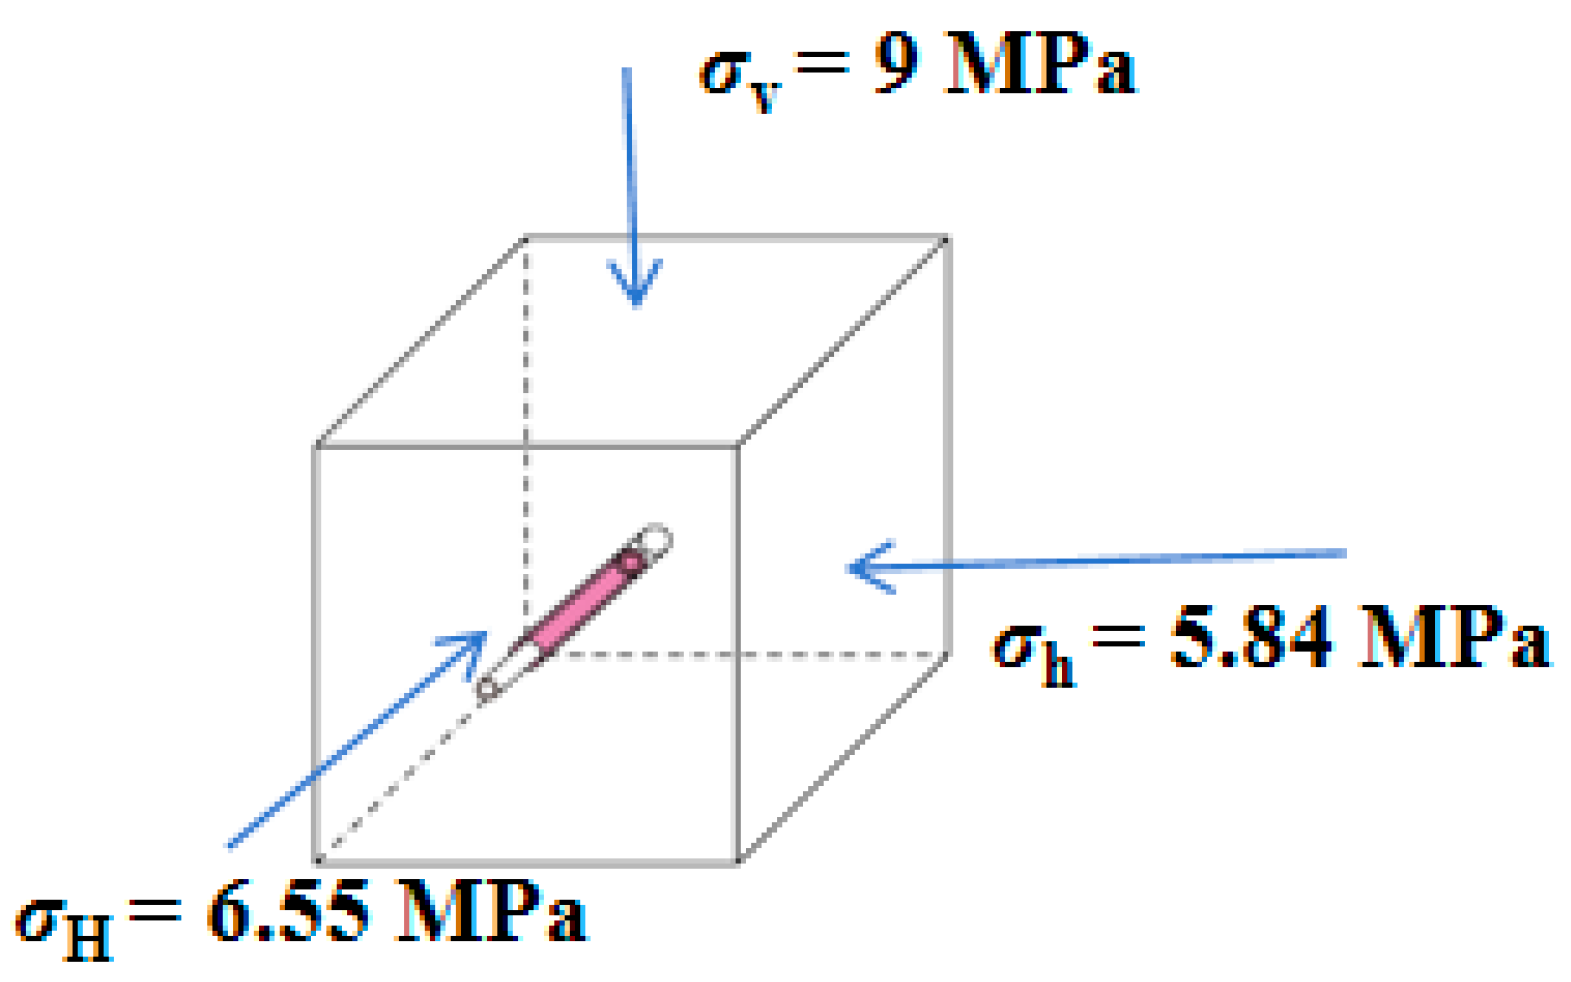
Figure 1. Stress Loading Schematic Diagram.
Processes 13 03146 g001
Figure 2. Fracture pressure of the model under different fracture dip angles.
Processes 13 03146 g002
Figure 3. In the semi-filled state, the extension paths of hydraulic fracturing fractures with different fracture inclinations ((a) crack inclination of 0°; (b) crack inclination of 30°; (c) crack inclination of 60°; (d) crack inclination of 90°).
Processes 13 03146 g003
Figure 4. Hydraulic fracturing fracture extension paths under full-filling condition (for fractures with different inclination angles: (a) with 0° inclination angle; (b) with 30° inclination angle; (c) with 60° inclination angle; (d) with 90° inclination angle).
Processes 13 03146 g004
Figure 5. Fracture Pressure of the Model under Different Filling States.
Processes 13 03146 g005
Figure 6. Hydraulic Fracture Propagation Path in the Unfilled State.
Processes 13 03146 g006
Figure 7. Failure pressure of test specimens under different crack inclination angles.
Processes 13 03146 g007
Figure 8. Failure pressure of test blocks under different filling conditions.
Processes 13 03146 g008
Figure 9. Comparison of crack patterns between the test block and the model in the unfilled state.
Processes 13 03146 g009
Figure 10. Comparison of crack patterns of the test block and the model in semi-filled state ((a) with a crack inclination of 0°; (b) with a crack inclination of 30°; (c) with a crack inclination of 60°; (d) with a crack inclination of 90°).
Processes 13 03146 g010
Figure 11. Comparison of crack patterns of the test block and the model in the fully filled state ((a) with a crack inclination of 0°; (b) with a crack inclination of 30°; (c) with a crack inclination of 60°; (d) with a crack inclination of 90°).
Processes 13 03146 g011
Table 1. Model parameter.
ParameterValue
Model dimension20 cm × 20 cm
Wellbore radius0.8 cm
Maximum horizontal stress9 MPa
Minimum horizontal stress5.84 MPa
Vertical stress6.55 MPa
Young’s modulus20 GPa
Poisson’s ratio0.1
Void ratio0.1
Top/Bottom coefficient1 × 10−14
viscosity0.001
Tensile strength7.42 MPa
Compressive strength67.8 MPa
Initial pore pressure0
Table 2. Experimental program.
Experimental Group NumberFill StatusFracture Dip
1No fill/
2Half filled0°/30°/60°/90°
3Full fill0°/30°/60°/90°
Disclaimer/Publisher’s Note: The statements, opinions and data contained in all publications are solely those of the individual author(s) and contributor(s) and not of MDPI and/or the editor(s). MDPI and/or the editor(s) disclaim responsibility for any injury to people or property resulting from any ideas, methods, instructions or products referred to in the content.