1. Introduction
Inadequate irrigation water resources are a key constraint to agricultural development in northern China. Irrigation agriculture, as the most water-saving potential water-using unit, has serious problems on the nodes of water resources transmission and distribution [
1,
2]. Digital twins revolutionize irrigation management via real-time data integration, optimizing water distribution and enabling adaptive diversion control for enhanced efficiency. To address multi-level water regulation needs in irrigation canal networks, and in the face of different flow rates, sand contents, and seasonal program adjustments in irrigation districts, gate control at the diversion point offers a highly efficient and sustainable water resource management model for regional water transmission and distribution systems [
3,
4]. The study of flow structures at diversions is of significance for the management of water resources and sediments [
5,
6] and can be used to provide references for water supply in the irrigation district, water treatment, irrigation and drainage network system design, and so on. At the same time, clarifying fluid behavior at diversions enables improved canal water management and control, avoiding the economic and accuracy problems of water-measurement instruments and facilities.
Flow distribution is broken by intensive 3D flow characteristics at diversions (e.g., abrupt changes in the geometry of the inflow wall, lateral constriction effects), inducing the dynamic coupling of the vertical logarithmic flow profile with the lateral secondary circulation [
7,
8]. These characteristics affect flow energy transfer efficiency and dissipation [
9] and dominate the lateral transport of suspended sediment by altering the bed shear stress distribution [
5]. Therefore, the accurate observation of flow distributions is of vital significance for hydraulic optimization [
10].
Recent studies have focused on flow structure but there is little focus on distribution at diversions. On the macro scale, the theories of flow velocity distribution are constructed based on statistical laws such as the principle of minimum entropy [
11], the principle of maximum sand transport rate [
12], the analytical solution of the NS equation [
13], and the exponential formula [
14].
In addition to theoretical analysis, experiments are vital because of water–sand coupling and intensive flow characteristics. On the micro scale, the theories are preliminarily validated with LDV (Laser Doppler Velocimetry), ADV (Acoustic Doppler Velocimetry), PIV (Particle Image Velocimetry), and other techniques [
15]. For example, Ramamurthy [
16] captured the flow bursts in the near-bottom area of a diversion and revealed the nonlinear correlation between the bed surface shear stress and sediment initiation. Ghostnie [
17] carried out model experiments through predefined flow scenarios and optimized a diversion model through numerical approximation methods. Momplot [
18] identified two kinds of secondary flow structures at a diversion by applying experiments and numerical simulations with the same downstream weir. Alfatlawi et al. [
19] derived optimal diversion angles via experiments and simulations; however, their study ignored the nonlinear coupling of geometric and hydraulic parameters on energy dissipation. Shen et al. [
20] investigated velocity distributions at right-angle diversions but focused on canal–pipe combined systems; the study did not perform an analysis of stable zone length or in situ validation.
Theoretical studies and laboratory experiments have enriched the research on diversions; however, high-resolution data are still extremely scarce due to the interference of suspended solids and limitations arising from the equipment’s durability. Fluctuations at diversions are also one of the key factors limiting instrument observations. Numerical simulations overcome observation limitations through the use of multi-scale turbulence models, such as the LES and hybrid RANS-LES models [
21,
22], that quantitatively evaluate the contribution of secondary flow to lateral sand transport. Ramamurthy [
16] analyzed the 3D flow distribution at a diversion by combining model experiments and numerical simulations. Kandula [
23] proposed that the flow velocities in the inner zone of the open channel conformed to the logarithmic law and that the flow velocities in the outer zone conformed to the parabolic formula. Weber et al. conducted a study of the 90° diversion and accumulated an extensive dataset; however, there is still a lack of 3D flow velocity components and water surface line data. Wei et al. [
24] constructed a model of a tidal channel for saltwater intrusion in estuaries. Overall, the open channel diversion was generated, developed, and exists under a variety of conditions [
25]. The lack of field validation limits the practical applicability of the existing models, especially under high
Fr conditions. ADCP (Acoustic Doppler Current Profiler) is a fast and effective method. However, in the absence of modeling experiments and numerical simulations, there are problems such as blind spots in measurement and navigation biases.
Flow distributions at a diversion were investigated in this study using a framework that combined controlled physical modeling, high-resolution in situ sensing, and adaptive numerical simulation. A new theory for the formation of flow stability zones is presented, as well as a prediction of stability zones based on the geometric and hydraulic characteristics of the diversion. A synthesis of the related research data and a new means of laying out the flow measurement is also provided.
Despite advancements in diversion flow research, three critical limitations can be identified in existing studies: (1) Laboratory-only studies lack in situ validation, leading to uncertainties in real-world applicability; (2) Numerical simulations often rely on idealized boundary conditions, ignoring complex field turbulence; and (3) Single-method in situ measurements fail to capture micro-scale flow structures due to instrument resolution constraints. To address these gaps, this study pioneers a three-tiered validation framework integrating, as follows:
Controlled physical modeling: Using a rectangular channel with ADV (Nortek Vectrino profiler) for high-precision velocity measurements (1 cm spatial resolution) and water-level probes (±0.1 mm accuracy), enabling micro-scale flow structure characterization under controlled conditions;
In situ sensing: Deploying ADCP at a northern China irrigation hub to validate laboratory findings under real-world conditions, ensuring ecological relevance;
Numerical simulation: A RNG k-ε turbulence model coupled with VOF free-surface tracking (ANSYS Fluent 2022 R2) was used to resolve multiscale flow dynamics, with mesh independence verified and errors against experiments <15%.
This integrated approach bridges the “laboratory-field-simulation” gap. Physical models provide mechanistic insights, in situ data ground truth to real irrigation scenarios, and numerical simulations extend parameter ranges beyond experimental feasibility. By quantifying the nonlinear coupling of geometric and hydraulic parameters, this framework advances diversion flow characterization from qualitative description to predictive modeling. Finally, based on the zoning characteristics of the diversion zone, this study proposed a selection scheme for water-measuring equipment in different regions.
2. Materials and Methods
2.1. Experimental Setup
The model channel experiments were carried out in the experimental hall of the Institute of Agricultural Irrigation, Ministry of Water Resources.
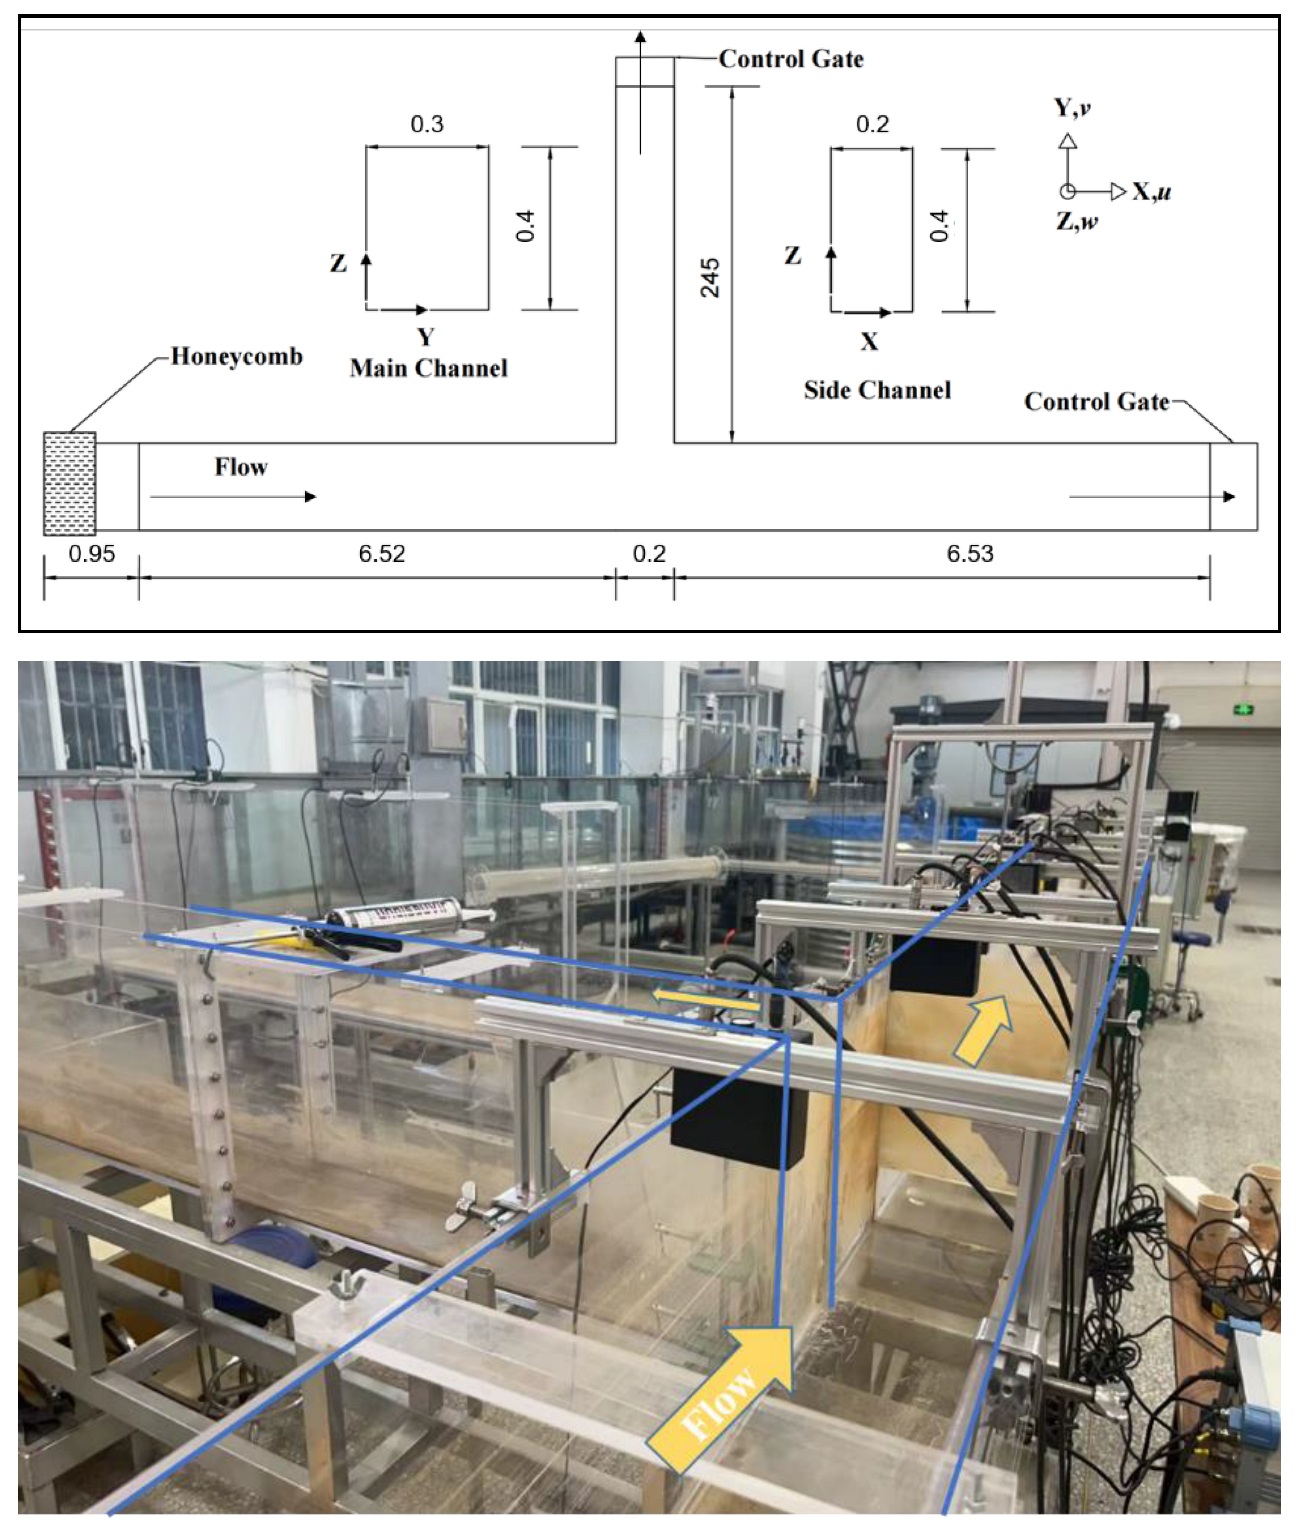
In the experiment, the main and side-channel sections were rectangular. Depending on preliminary research, all channels were set to 1/5000, consistent with the in-situ hub (X district), where the bed slope is 1/5000. The main channel was 13.25 m long, 0.3 m wide and 0.4 m high; the side channel was 24.5 m long, 0.2 m wide and 0.4 m high (
Figure 1). The flow rate was controlled by an upstream constant-head tank (capacity 2000 L) connected to a centrifugal pump (flow range 0–200 m
3/h). The main channel flow was measured with an electromagnetic flowmeter and ultrasonic measuring box.
In this experiment, by controlling the control gate of the main channel and incoming flow, nine trials were designed. The condition settings are shown in
Table 1. Nine in situ experiments covered the typical operating conditions of the X hub, as per the irrigation management manual. These conditions account for more than 80% of annual operation scenarios, ensuring representativeness.
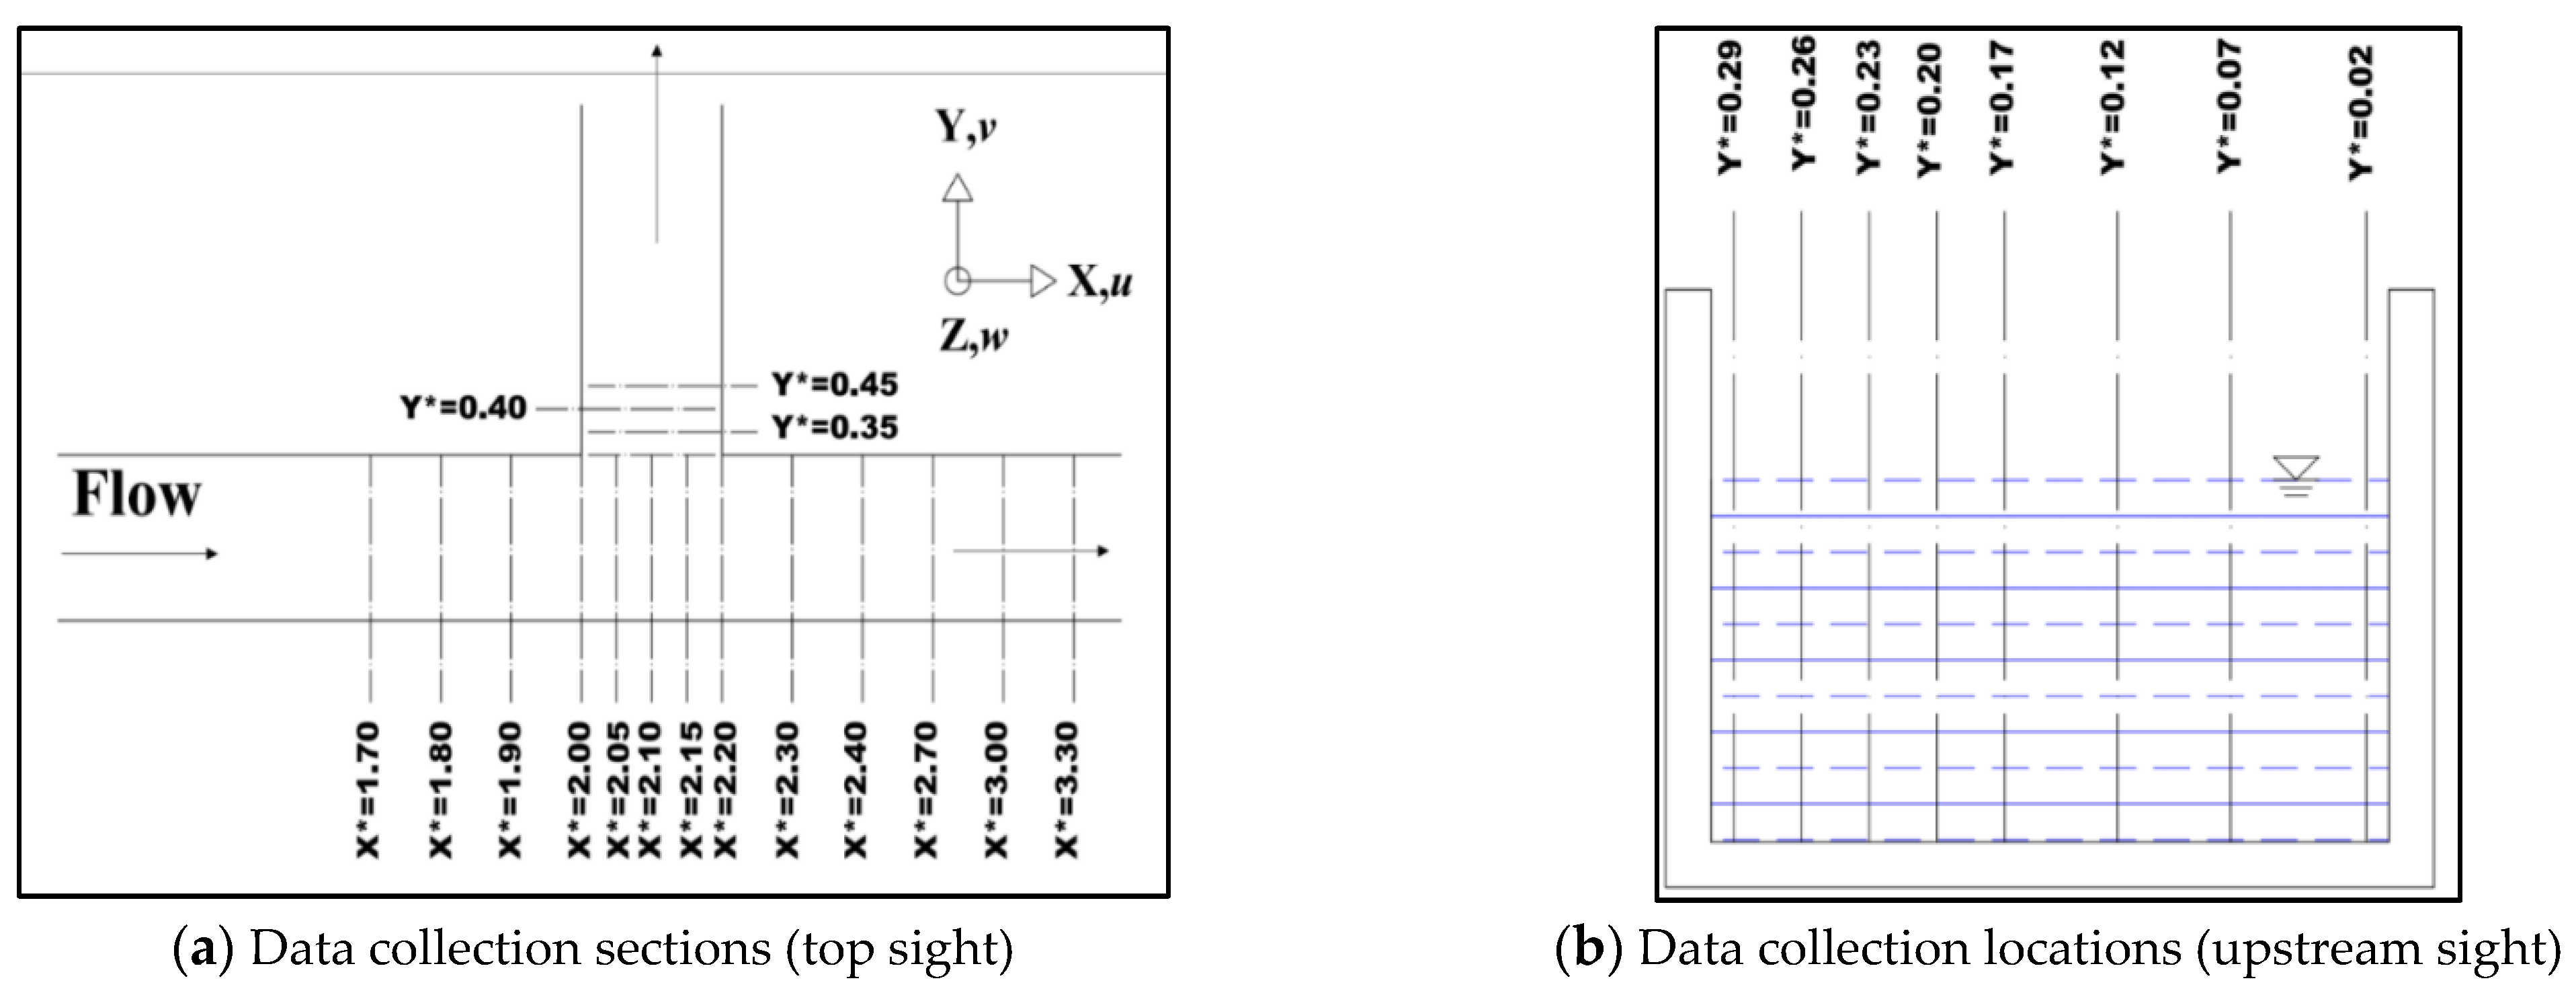
The angle between the side and main channel was 90°, where 5 sections were set up at the diversion and 3 sections were set upstream and downstream of the main channel, respectively. The 90° diversion angle was selected as it is the most common configuration in northern China irrigation hubs. Eight normals were set up in each section from 1 cm underwater; the depths of the measurements were arranged at every 1 cm. Four sections were set up downstream of the side channel; the measurement depth was the same as that described above.
Based on our pre-research and field trial, the channel walls were made of smooth Plexiglass (roughness height ks = 0.3 mm) and the channel beds were made of rough glass (roughness height ks = 0.6 mm), corresponding to common irrigation channels in northern China.
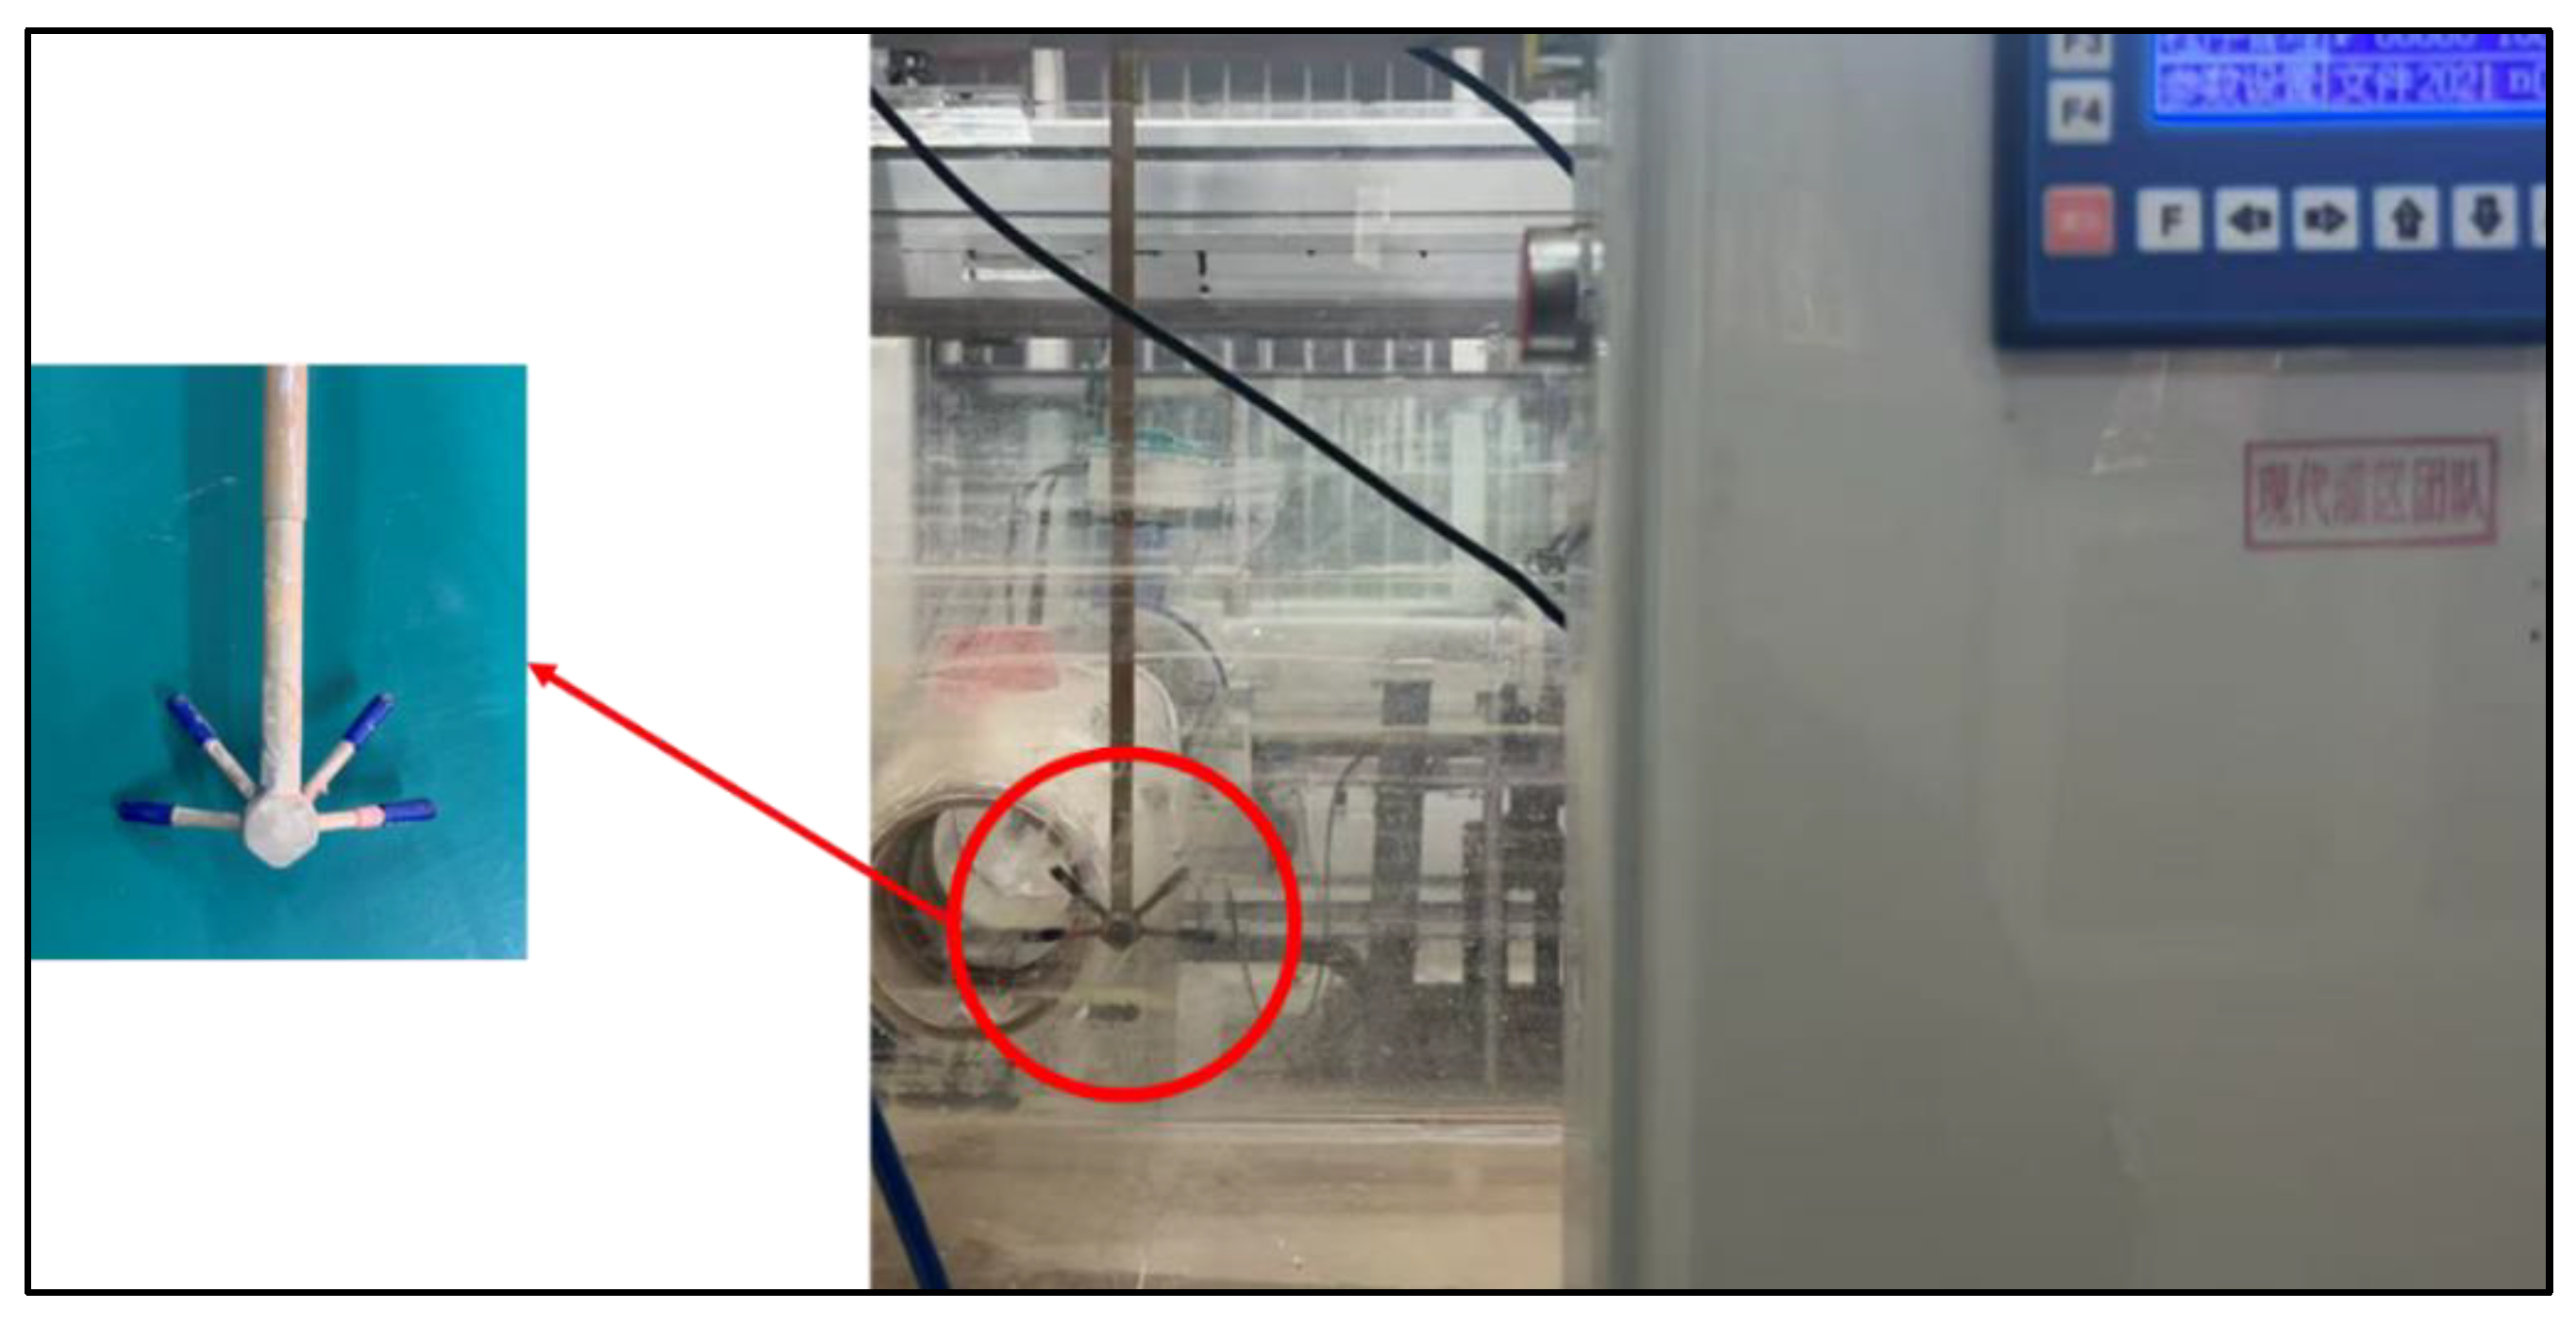
The flow velocity measurements were carried out with ADV (
Figure 2), together with an independently designed test platform with stepper motor control. To eliminate the influence of sidewall and water surface fluctuation on the flow velocity meter probe, the probe sidewall distance of 1 cm was set (
Figure 3). The water surface line was measured by an SCM60-type water-level stylus with an accuracy of ±0.1 mm.
2.2. In Situ Channel Experiments
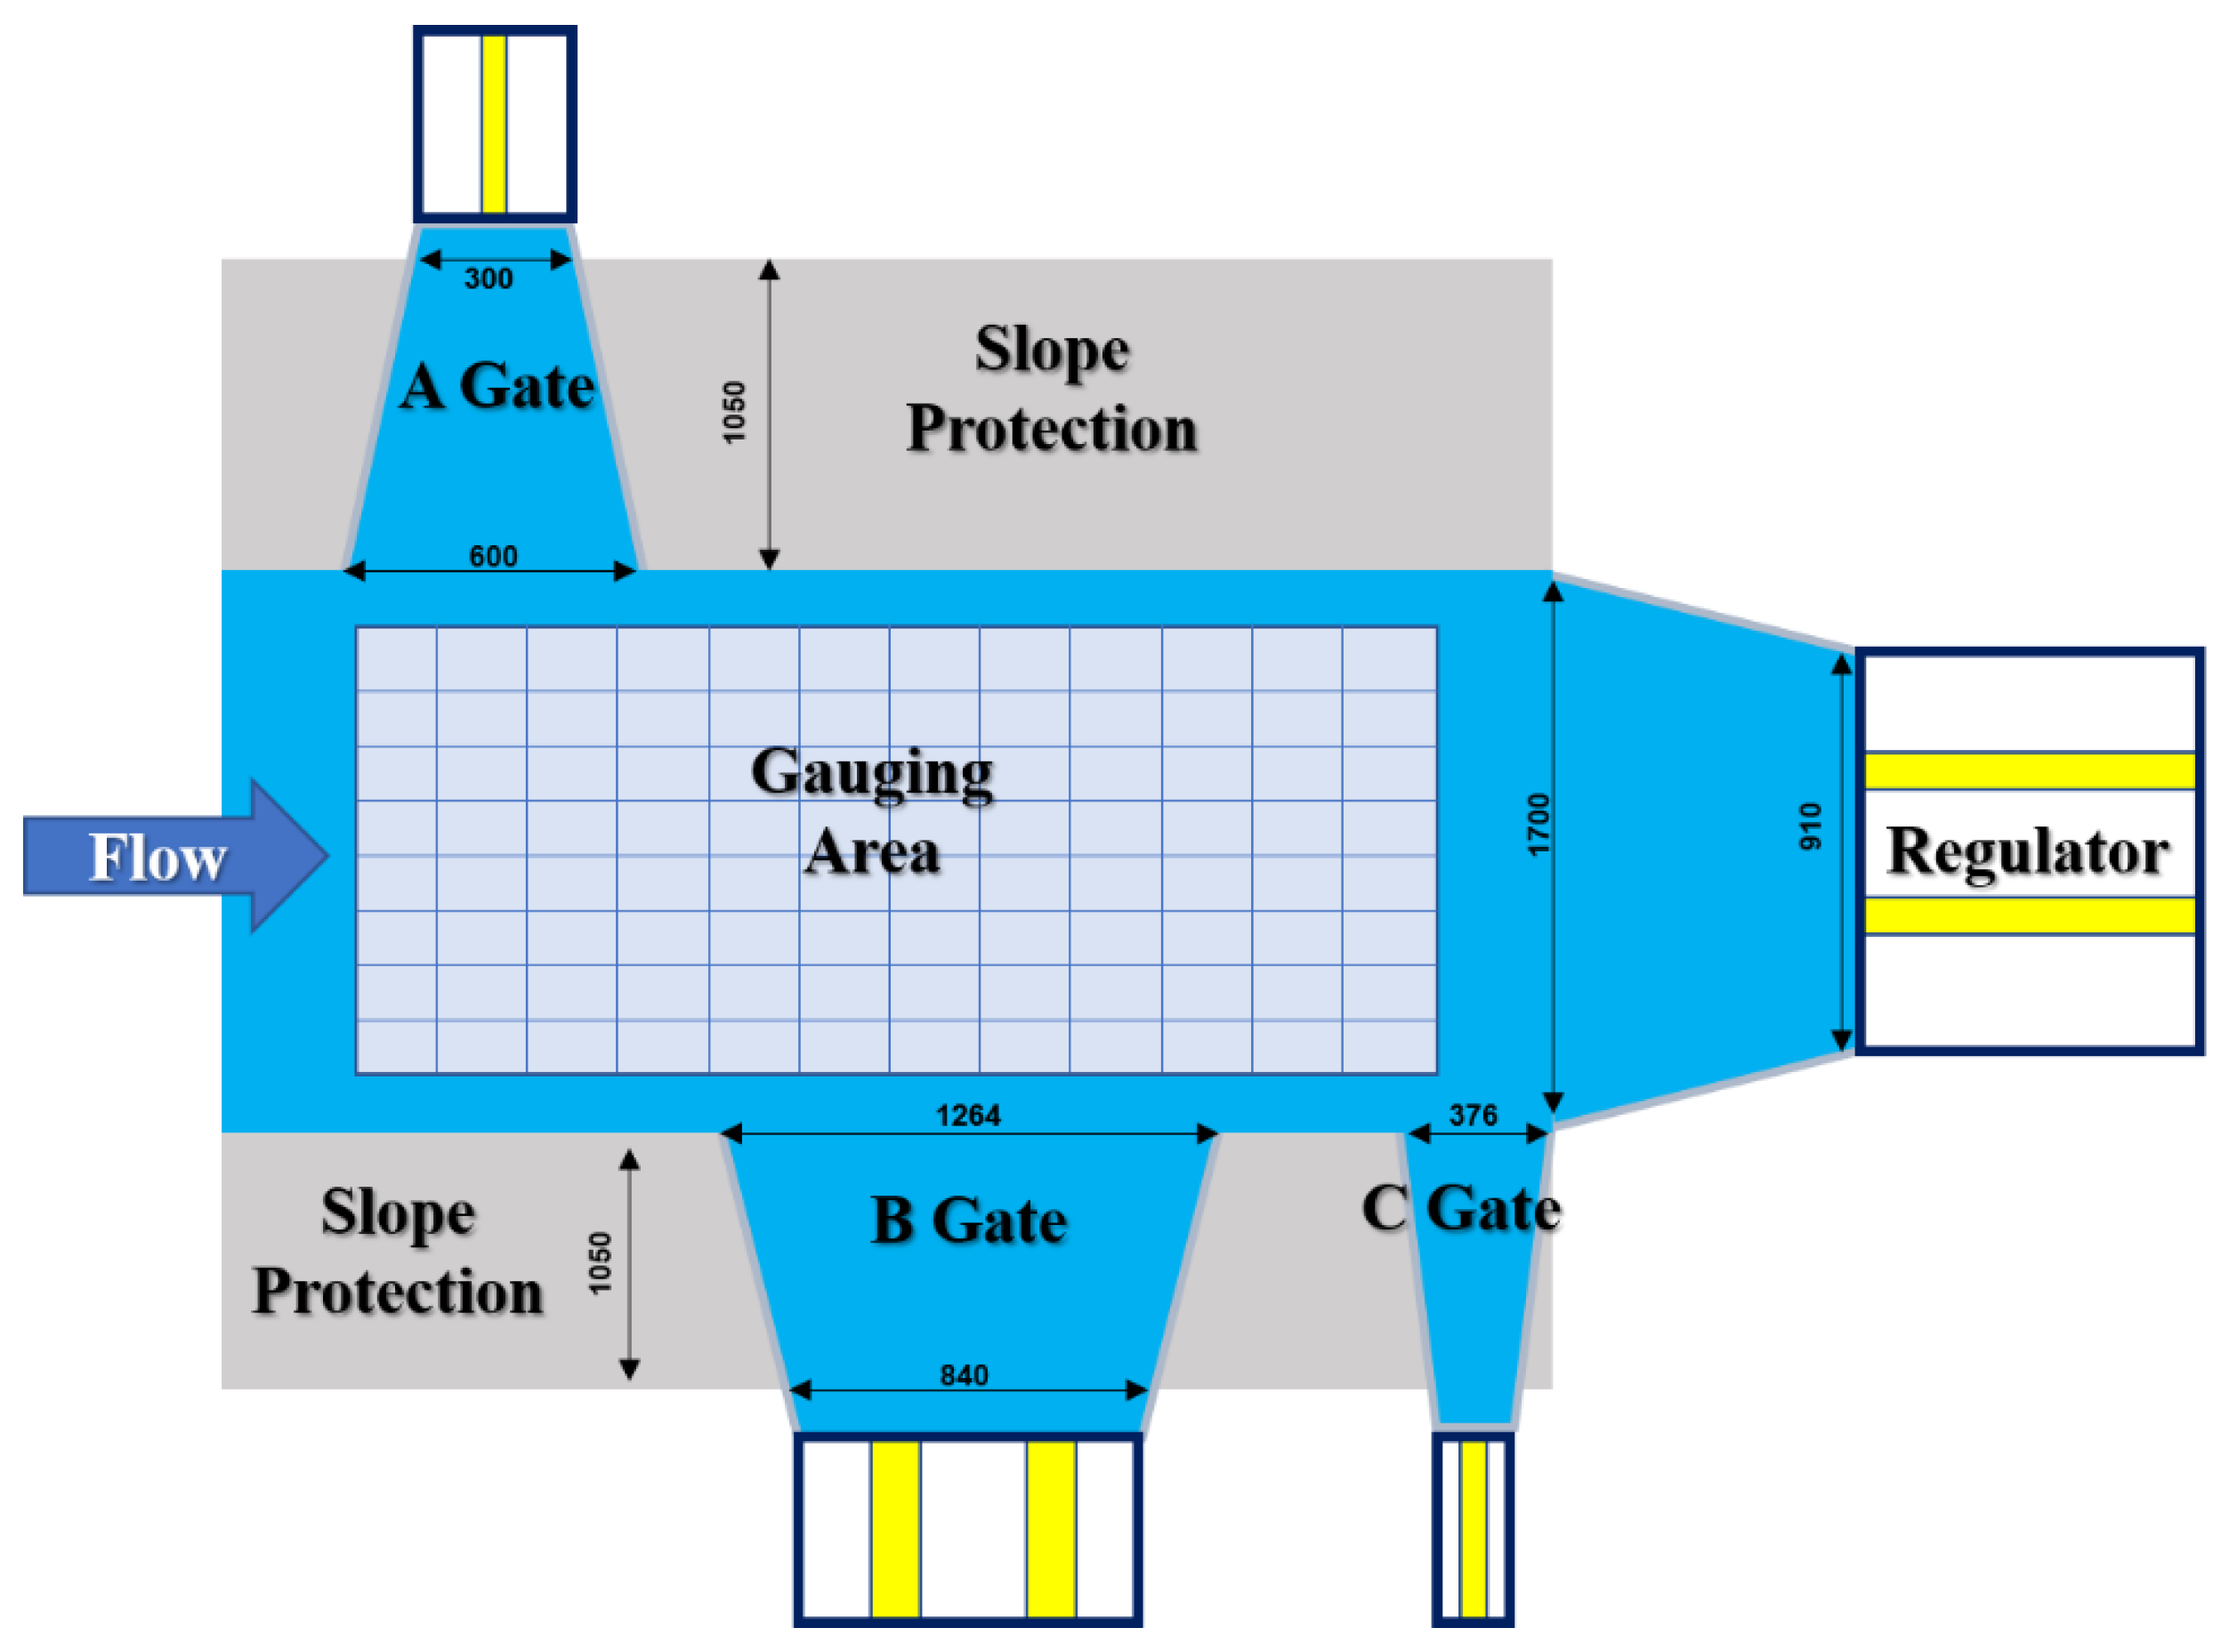
The in situ channel experiment was carried out at a water conservancy hub in X district in northern China (
Figure 4). Several sets of gate opening and closing conditions were set up; in situ experimental measurements were carried out on the diversion in front of the gate using the ADCP, which is a dynamic flow measurement method that can carry out 3D measurements of flow velocity and direction.
A total of six sets of experiments were conducted by adjusting the A Gate and B Gate openings, respectively, while the regulator kept the normal daily operation openings unchanged; these scheduling methods were obtained from the daily irrigation management operations. The measurement arrangement is shown below, in
Table 2.
2.3. Numerical Simulations
The CFD-Fluent (Ansys 2022R2) program was selected for 3D numerical simulation of water flow, using the actual parameters of the model channel. The upstream boundary was in the inlet box, the inlet was set according to the measured flow data, and the two outlet boundaries of the main and side channel were established. The horizontal direction grid used the triangular section; the vertical direction was in accordance with the equal proportion of stratification; the diversion and outlet used the local encryption; the minimum grid scale was 0.01 m; and the maximum grid scale was 0.02 m. Model roughness was obtained according to the model experiments in the flow traces. Flow velocity distribution, water level, flow rate and other measured hydrodynamic characteristics of the data were used to verify the model experiment, and were combined with the model experiments to carry out the numerical simulation.
The pre-experiment and fluid domain grid size irrelevance test showed that the relative error of simulation and measured value from the cell length of less than 0.02 m was less than 0.1%. Therefore, encrypted and non-encrypted area grid sizes of 0.01 m and 0.02 m were selected; the total number of grids was about 11 million. The inlet boundary was set as the mass flow inlet. The main channel outlet boundary was the gate for the local encryption treatment. The side-channel outlet was the free outflow. The canal wall and bottom of the canal, together with the gate, was the solid boundary. The air above the free water surface had a relative pressure of 0.
Due to the intense turbulence of the water flow at the diversion point, the Reynolds number Re was larger than ; a RNG k-ε three-dimensional model was selected, with an expandable wall function (SWF). The coupled solution method was selected, the spatial gradient was selected as the Green–Gauss node-based spatial gradient, the momentum and turbulence term were selected as the second-order windward, and the free liquid surface was considered by the multiphase flow (VOF) model to establish the open channel flow and open channel flow fluctuation boundary. The control equations are as follows.
The continuity equation is as follows:
The motion equation is as follows:
where
is the fluid density (Water–Liquid), taking the value of
.
is the flow time, second.
is the flow velocity vector in each direction of the component (
are 1, 2, 3) and μ is the dynamic viscous coefficient,
.
is the fluid pressure.
is the mass force of the fluid in the individual directions force.
equation is as follows:
equation is as follows:
where k is the turbulent kinetic energy,
. ε is the turbulent dissipation rate,
.
is the effective kinetic viscosity coefficient of the fluid, kg/((m/s)).
is the turbulent energy production term due to the gradient of the flow velocity.
and
are empirical constants (Fujun, 2004 [
26]).
Based on the in situ experimental measurements and actual parameters, a numerical simulation model for X hub was established in CFX; the VOF model was selected for processing. According to the pre-experiment and the fluid domain grid size irrelevance test, it was found that the relative error between the simulated value and the measured value for the cell length less than 0.5 m was less than 0.1% and that the grid size was 0.5 m. The inlet boundary of the main channel was set as the inlet of the mass flow, the A Gate and the B Gate were set as the outlet of the mass flow and the regulator was set as the outlet of the unpressurized self-flow. The canal wall, the bottom of the canal, and the gates were set the solid boundaries. The surface above the free water surface was air and the relative pressure was set 0.
3. Results
The existence of a diversion affects the flow structure of the main channel, causing significant fluctuations in the water surface in the surrounding areas. For the convenience of representation, at the wall in front of the diversion port was set as the origin .
The maximum water levels in four sections (
) from the point upstream of the diversion (
) to 30 cm downstream of the diversion (
) are plotted in
Figure 5, of the water surface line of the main canal.
The water levels in the sections similarly varied along the longitudinal course, being more stable before the diversion until a decline occurred in the diversion area. The fluctuation of the water level near the diversion (Y/Y* = 0.05) was larger, with a relative fluctuation of 13.2%. The minimum occurred on the upper side of the diversion () and the peak occurred on the lower side (). The fluctuations on the side away from the diversion (Y/Y* = 0.75, 0.95) were smaller, with relative fluctuations of 4.92% and 2.67%. The water surface lines on the upper and lower sides of the diversion basically overlapped and slow growth occurred at the downstream. Above all, the location of the extreme value point of the cross-section water level moved downstream with the increase in the relative distance.
3.1. Validation of Numerical Models
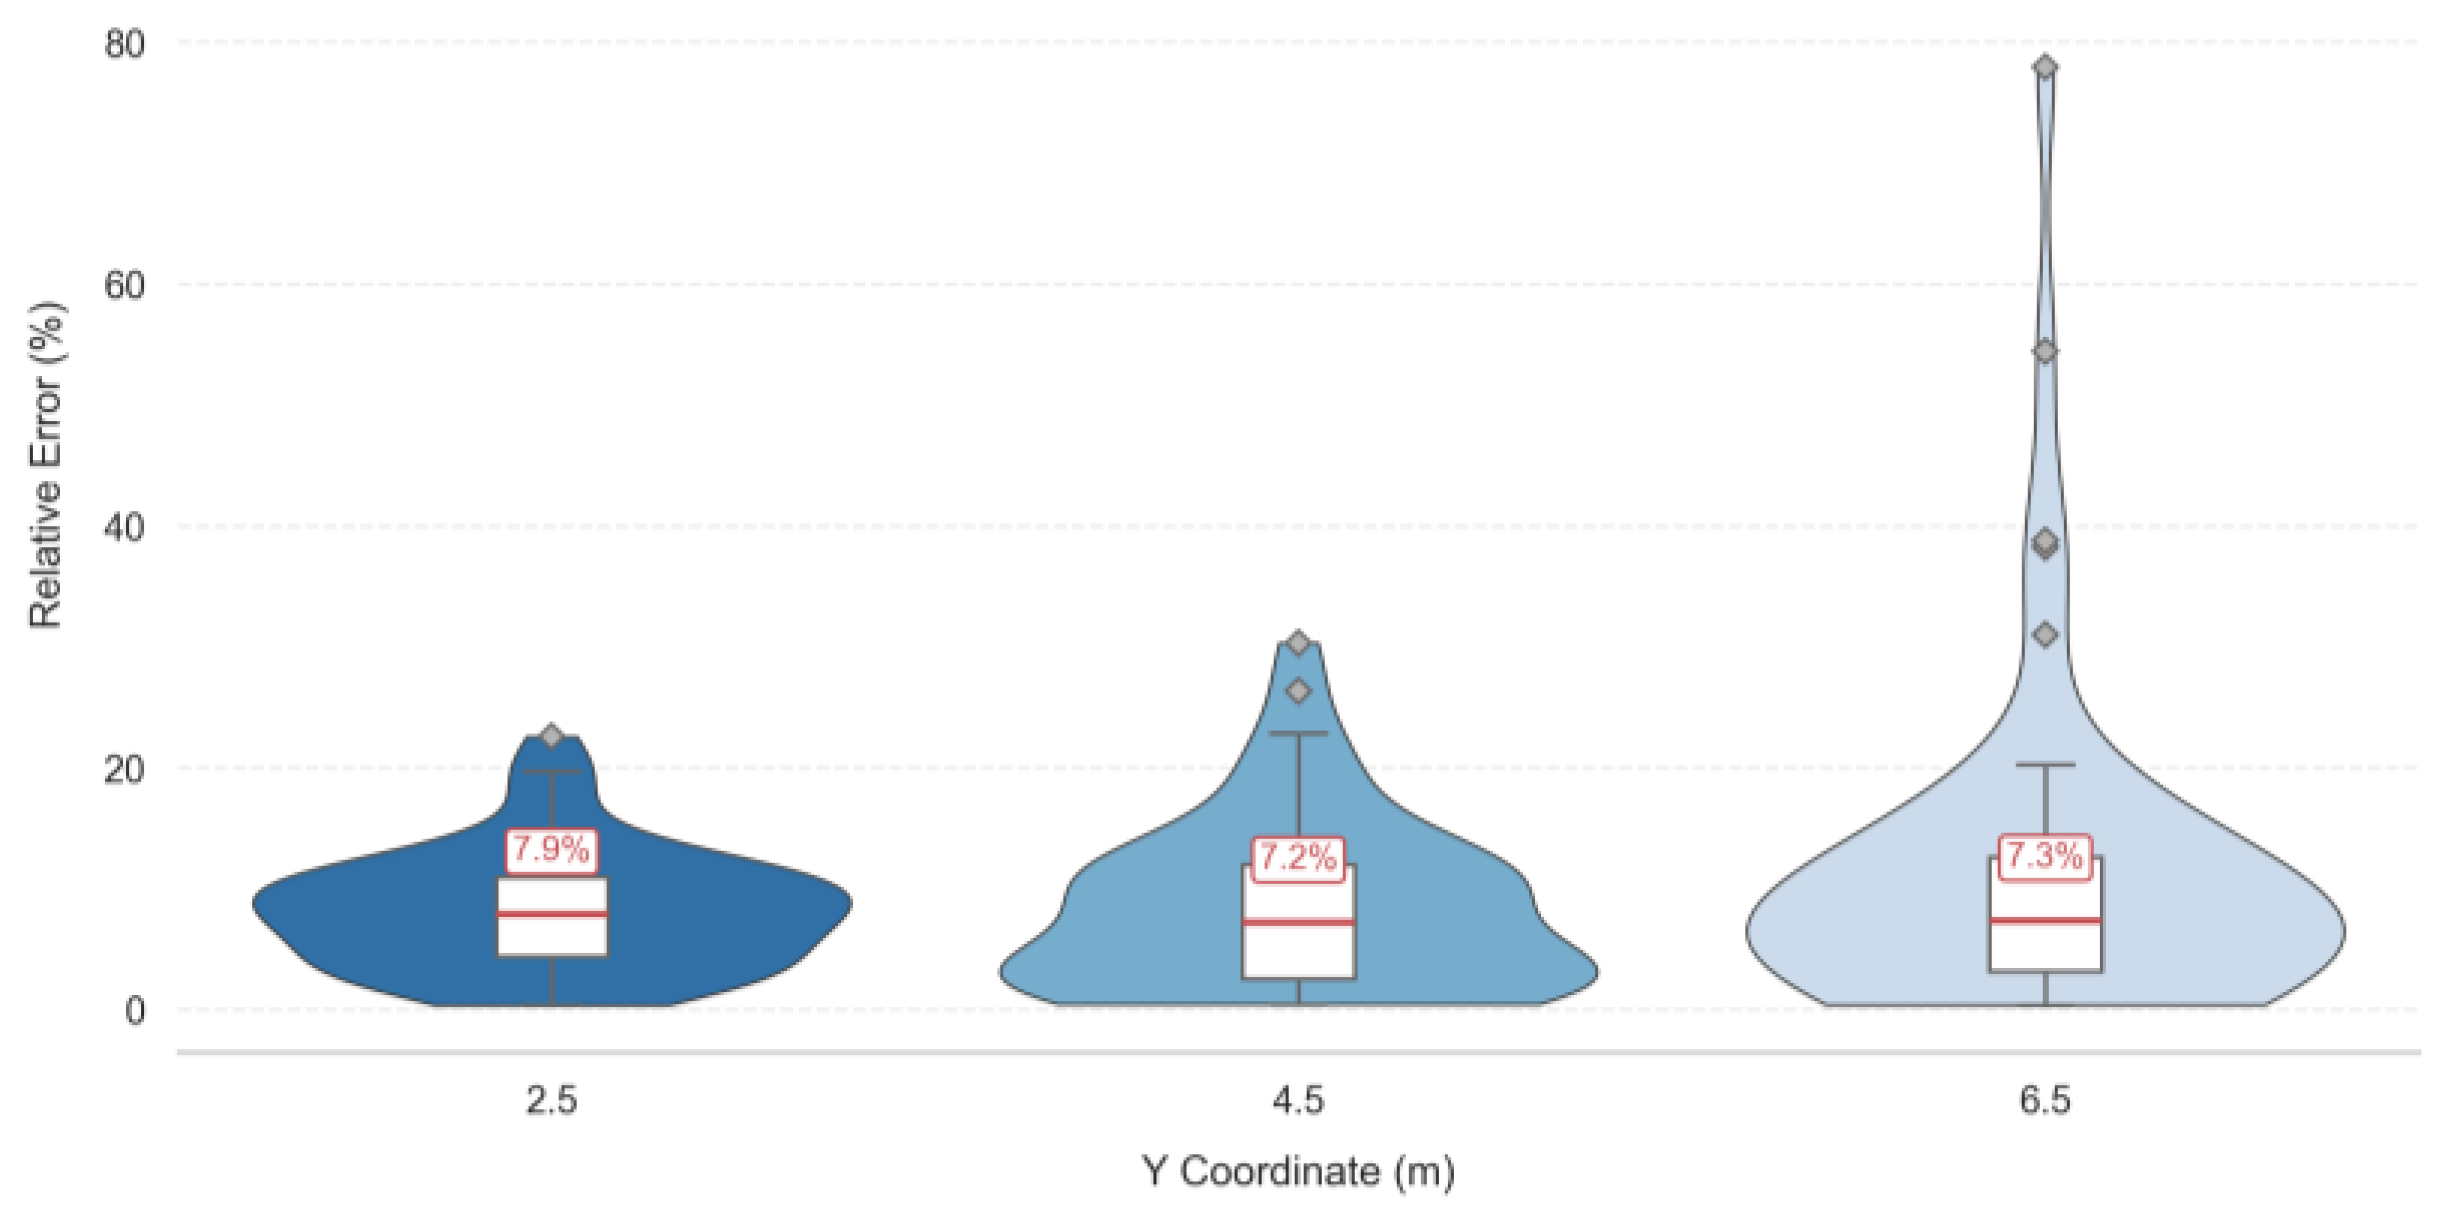
In this paper, the measured and simulated results of high-, medium-, and low-flow rates were selected for comparison; the data error distribution is shown in
Figure 6.
By comparing the measured and simulated results of C1, the errors between the simulated and experimental values based on C1 are given (
Figure 6a,b). The average errors of sections II–VI were all below 15%. The average errors of the sections were at least 8% (Sections III and IV) and at most 12% (Section VI), which are in line with the requirements of simulation operation, indicating that the numerical simulations by Fluent were credible. It was shown that 1% of the anomalous data were located outside the 20% error line, which was negligible. Comparing the measured and simulated results of medium-flow rate C3 and low-flow rate C4 (
Figure 6c,d), the error distribution between the simulated and experimental values conformed to a normal distribution. The error between the simulated and experimental values decreased as the water level (flow rate) decreased, and the data fluctuation tended to stabilize.
A comparison of the results of the test showed that the trend of the flow velocity distribution in each group had the correspondingly same trend, in which the high-depth group C1 had the representative data as the deep water-level group. Therefore, C1 was selected as a typical case to analyze the overall law.
3.1.1. Cross-Sectional Flow Rates and Structural Characteristics
Turbulence occurs in the main canal flow after the diversion and large changes occur in the flow line of each layer with different characteristics. This section extracts the
u velocity at different water depths for several conditions (C1, C5, C7 and C9).
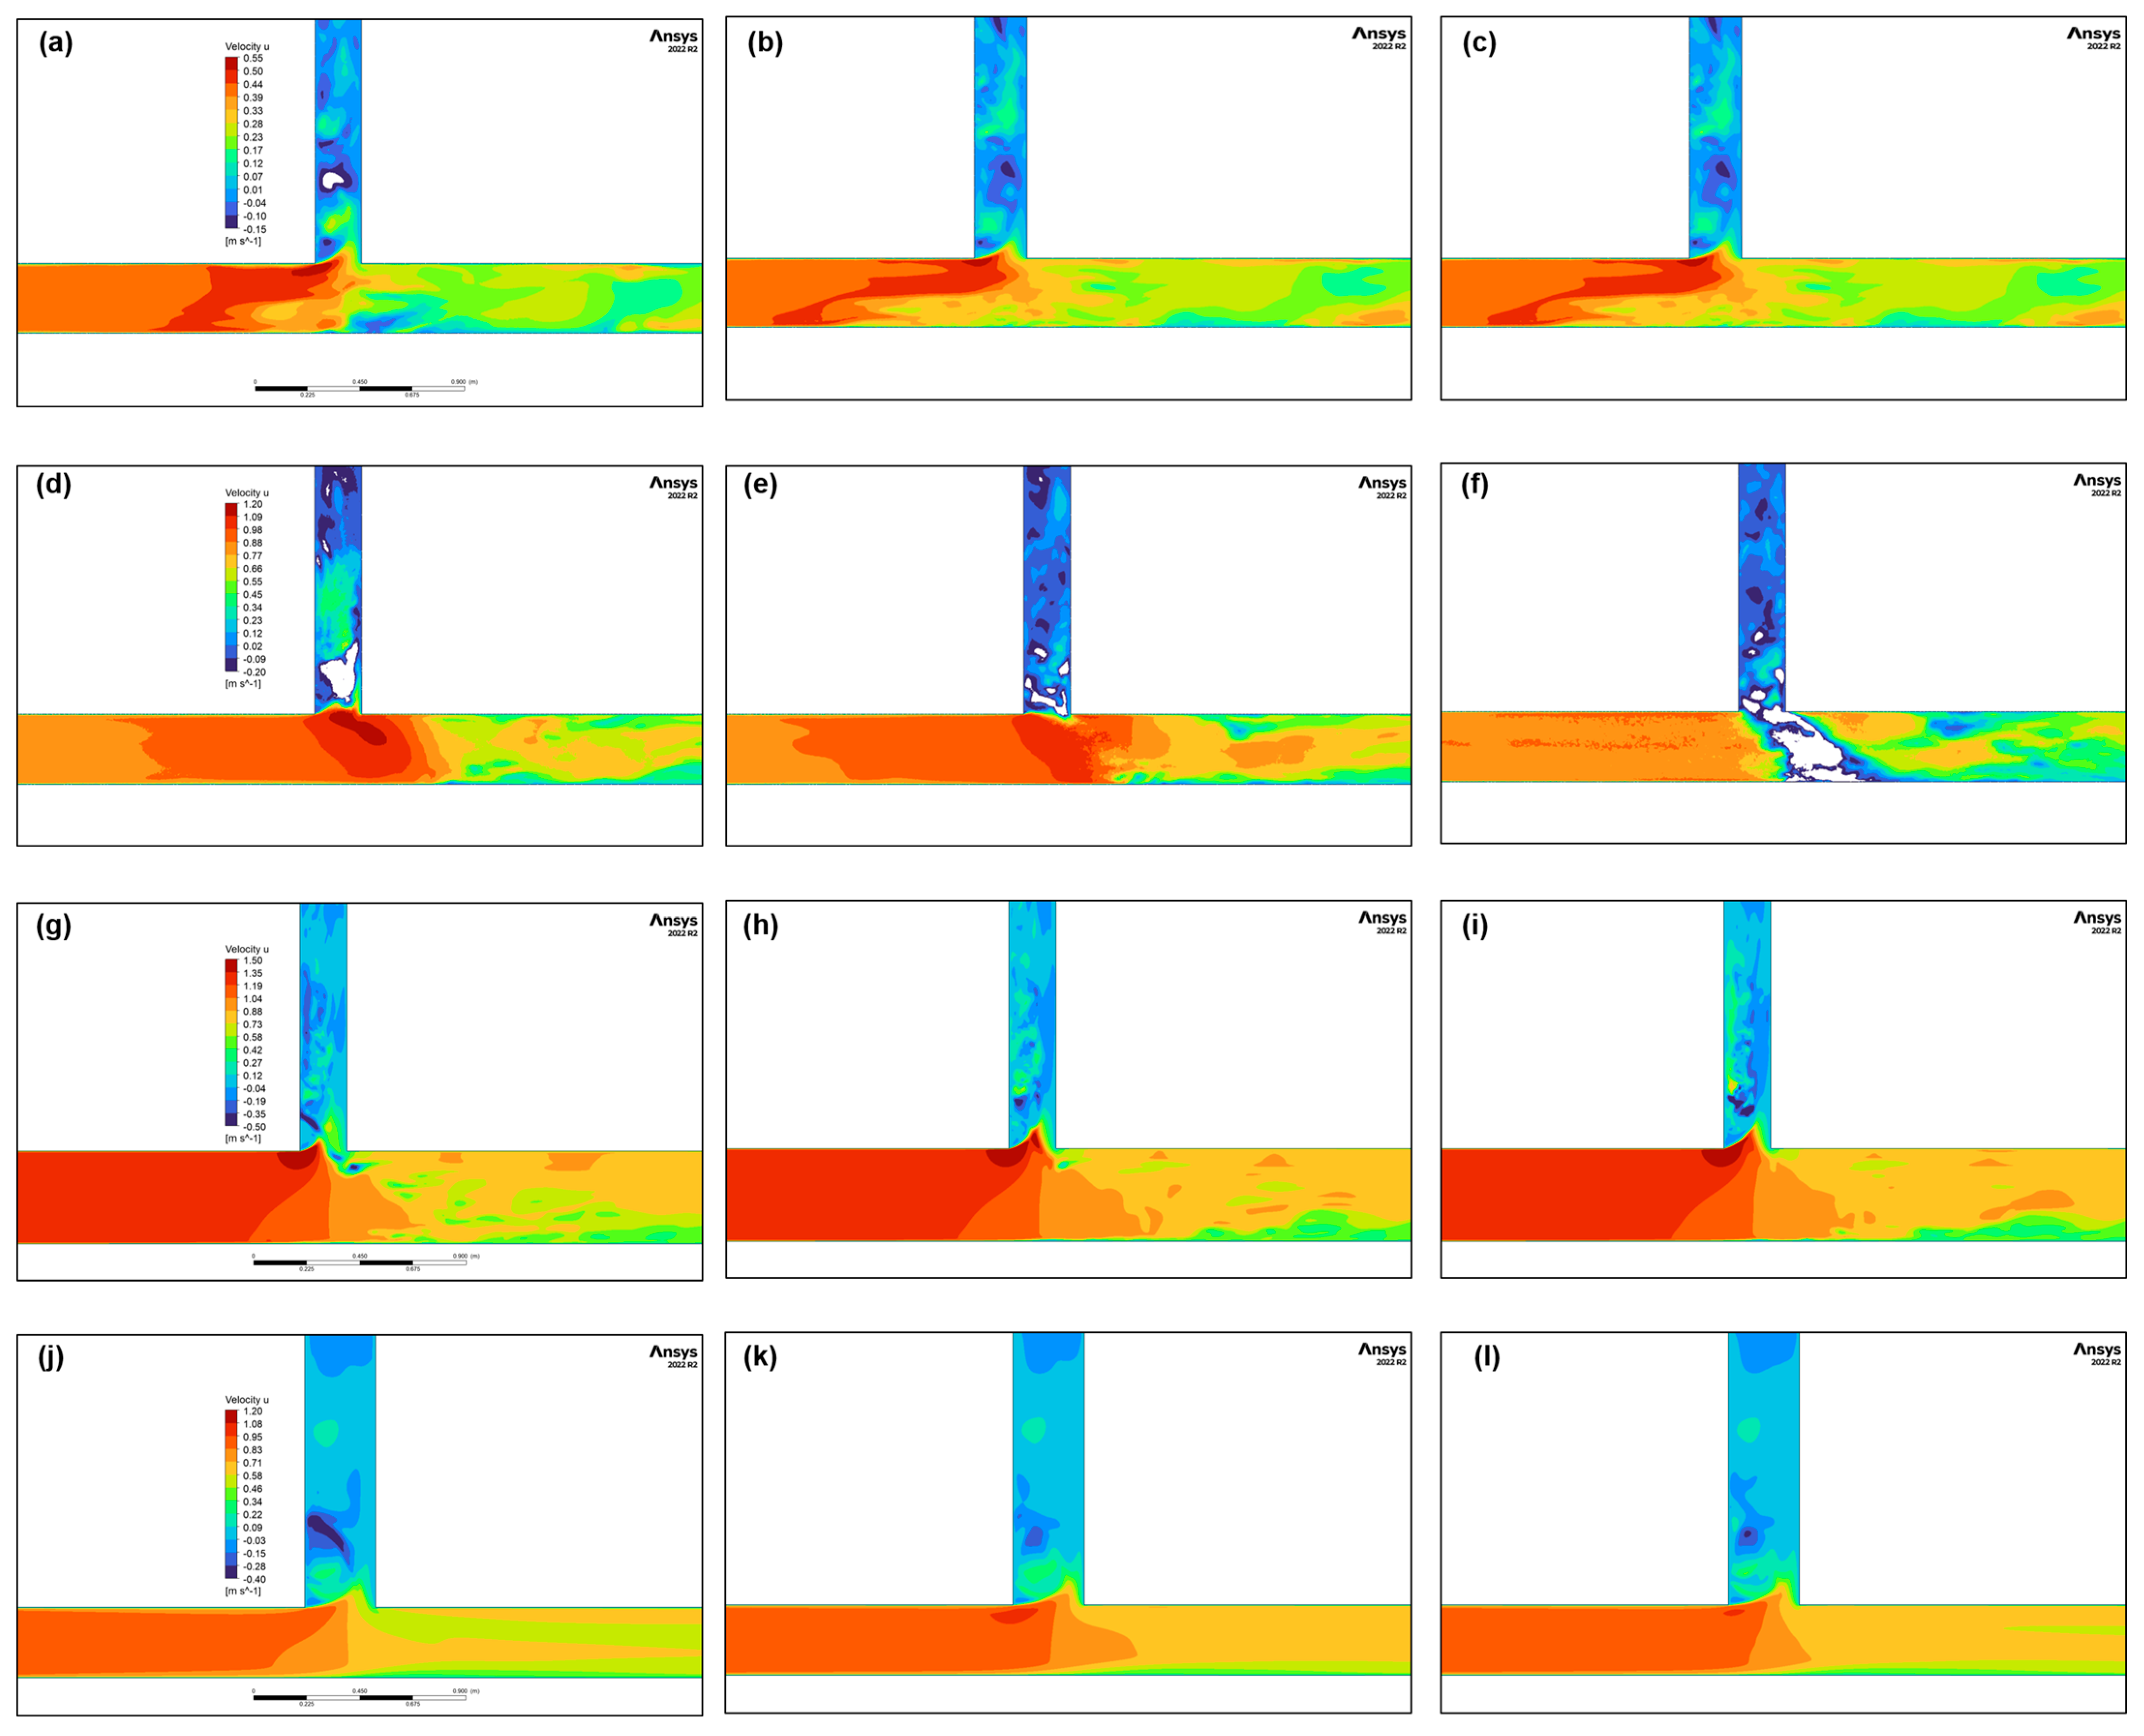
Figure 7 shows the
u velocity cloud diagrams at
,
and
(
h is the water level in each experiment).
As can be seen in
Figure 7, when the main stream flows through the upstream area of the diversion, the flow velocity of each layer changes. The flow near the diversion accelerated. In the flow through the diversion 2–3 d (d is the width of the side channel) distance, the
u velocity in the Y direction adjusted to the normal flow velocity, which was comparable to the flow before the diversion decreased. A vortex structure can be seen in the entrance of side channel, with the velocity maximum located near the inner wall, which is the same as that concluded by Berger (1983) [
27].
Comparing the three columns of plots, the fluctuation at the diversion was more drastic as the height increased. The recovery length of velocity downstream (L
rec) of the diversion was significantly negatively correlated with
Fr (R
2 = 0.82), which is consistent with the theory of hydraulic mutation for wide-channel diversion proposed by Nezu [
28].
Comparing the four rows of graphs, the scope and degree of turbulence at the diversion appeared to decrease as the water level decreased. The maximum and minimum velocity appeared at the near-wall end. This is due to the potential energy caused by the water-level change at that place. Meanwhile, with the increase in the width of the side channel, the range of the secondary flow vorticity in the side channel was larger, from 0.3 d to 0.8 d. This is due to the weakening of the coupling effect of the energy gradient brought about by the upstream and downstream sidewalls, which makes the secondary flow more fully developed.
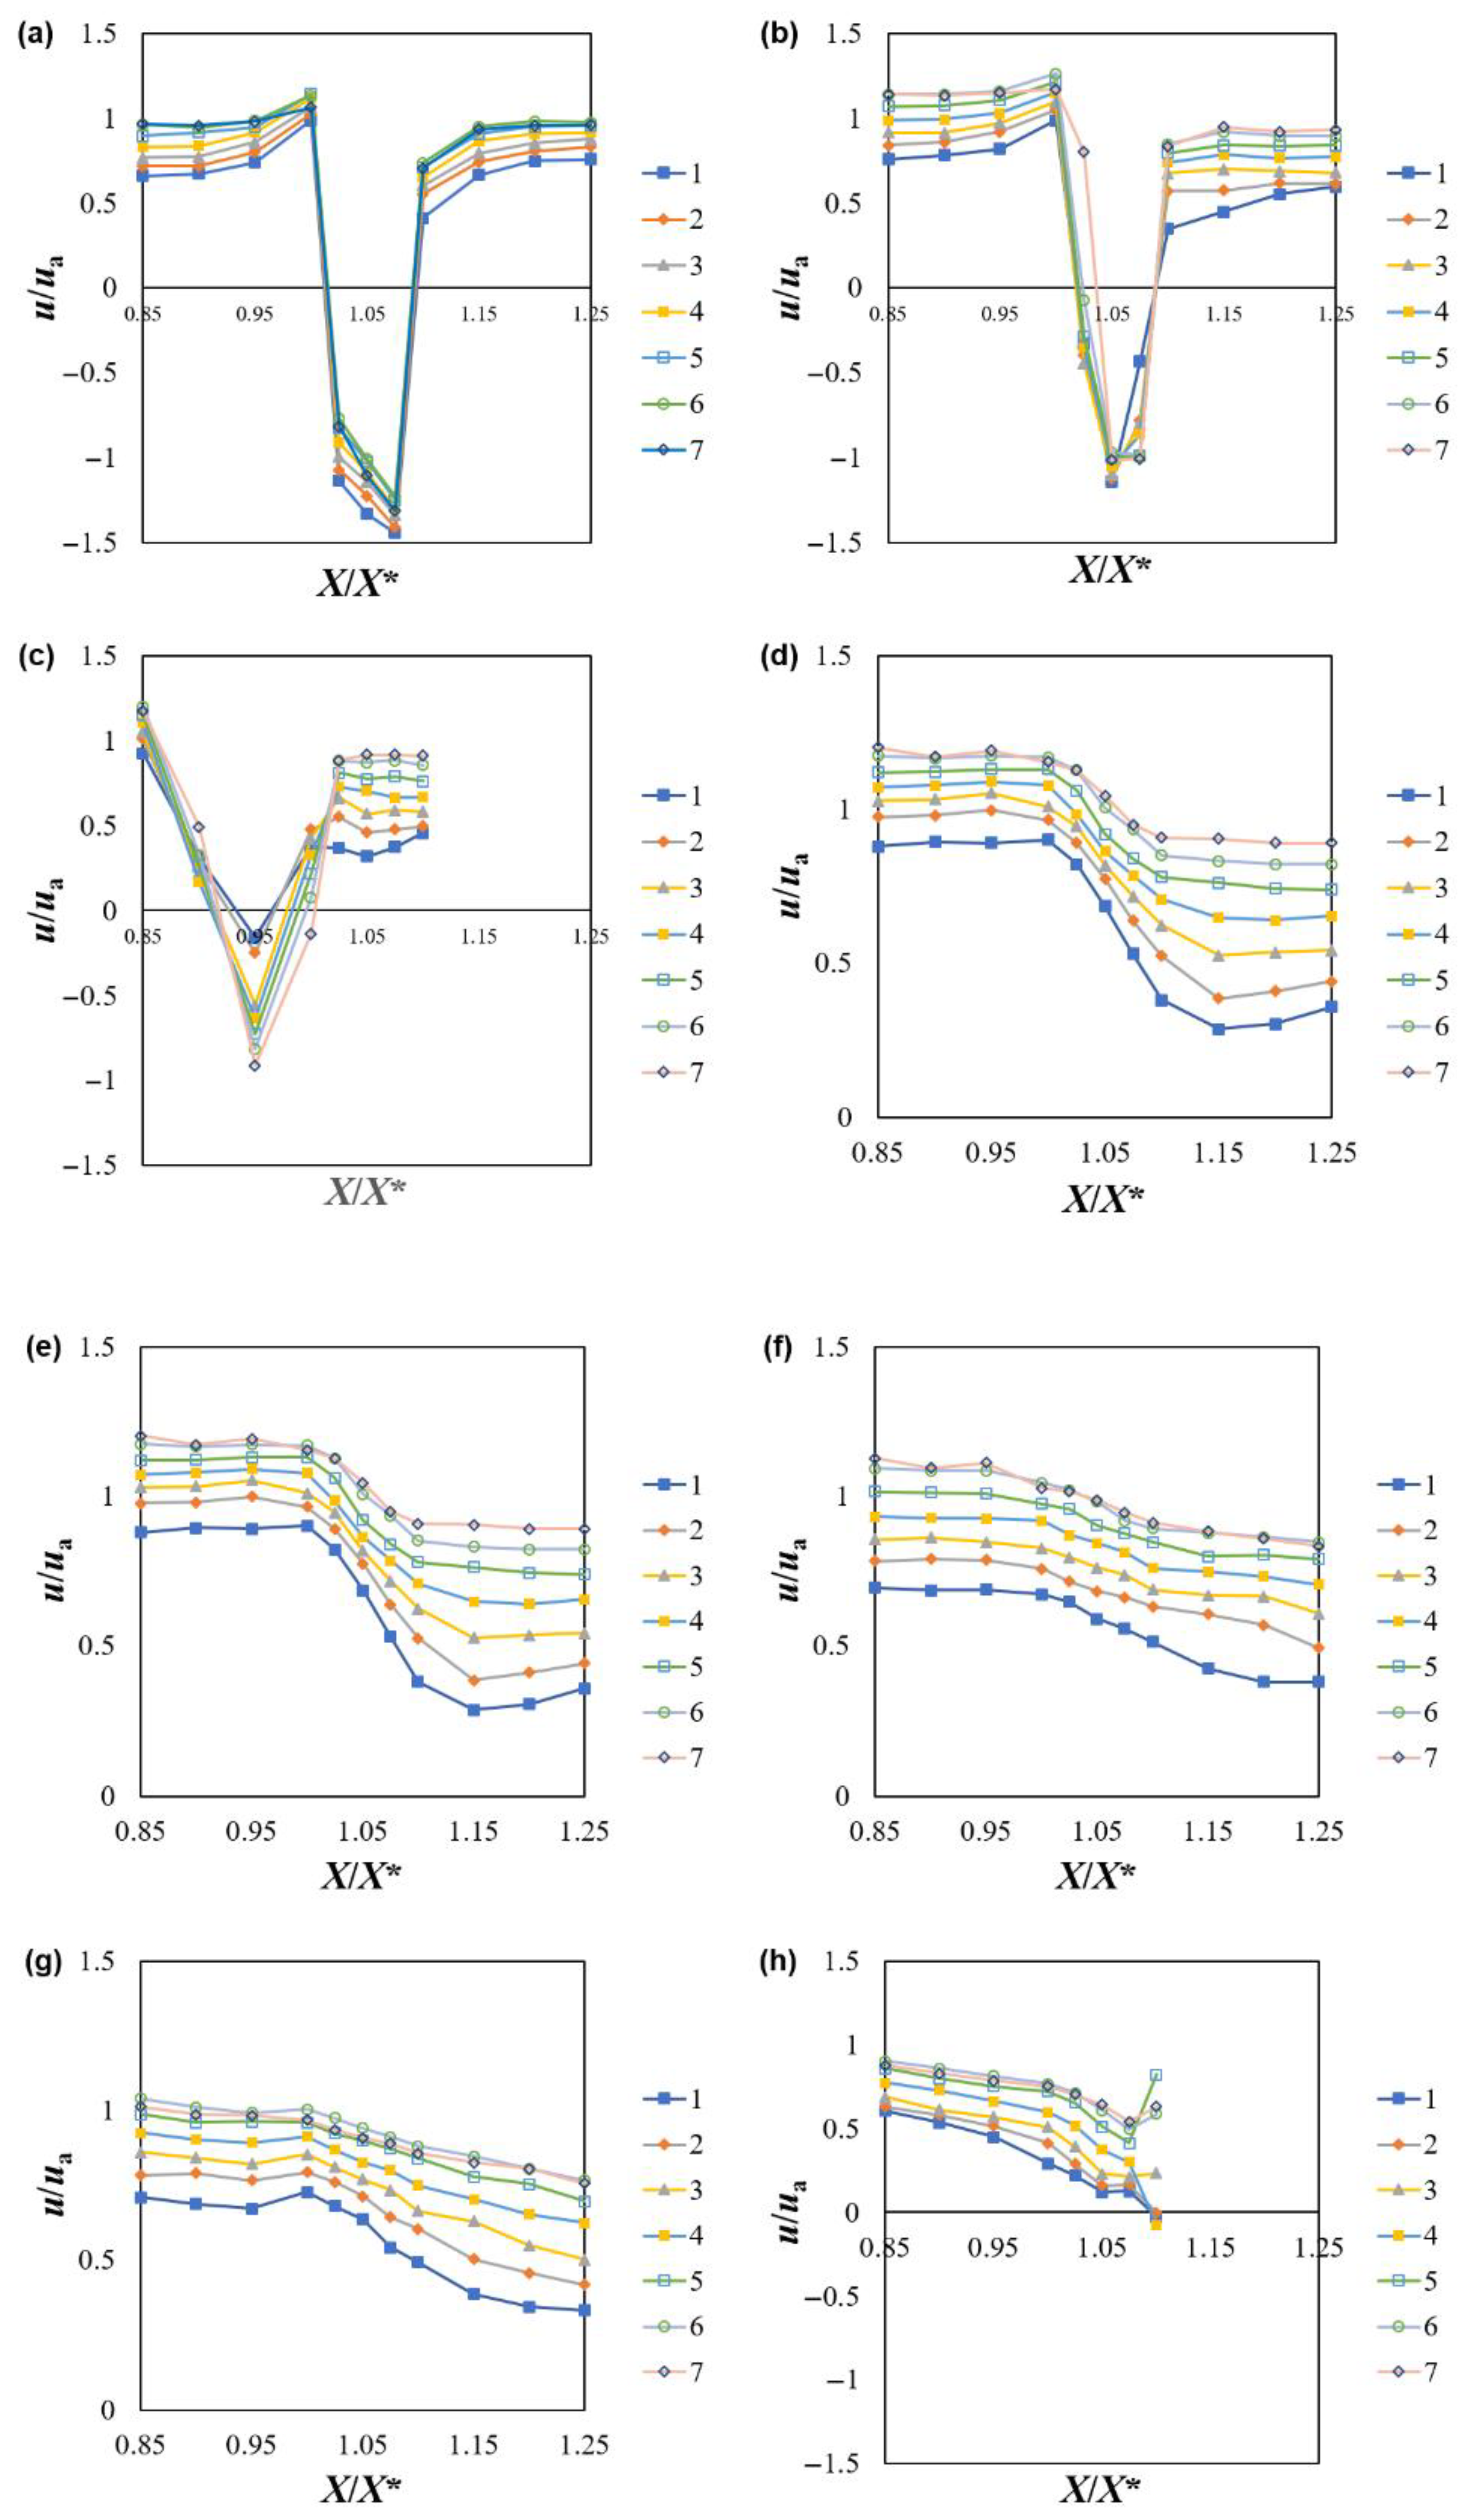
The u/ua flow velocity at the C1 diversion was selected for analysis; ua was the average velocity for the section.
Figure 8a–h shows the I–VII section; 1–7 show the water depth position at 0.15 h, 0.3 h, 0.45 h, 0.6 h, 0.7 h, 0.85 h, and 0.95 h. In the downstream range of the diversion at the I–III section close to the diversion, the velocity of the upper sidewall decayed from 0.42 m/s to 0.31 m/s, the flow reversal occurred at X/X* = 1–1.1, and the maximum velocity gradient occurred at X/X* = 1–1.05, which reached 3.8 (m/s)/m. The momentum thickness growth rate was calculated by the Prandtl boundary layer equation (
Supplementary Materials Text S1): where the shape factor
increased from 1.4 to 2.1, indicating a gradual transition of the flow out of the Blasius-type laminar boundary layer to a turbulent state (Schlichting, 1979 [
29]). The backflow phenomenon (V < 0) at the lower sidewall satisfied the classical flow separation criterion (
Supplementary Materials Text S1).
The figure shows that as the distance relative to the diversion increases, the fluctuation along the course appears to decrease until it reaches the far-wall end (Section VIII), where the sidewall effect has a fluctuating effect on the flow. Combined with
Figure 7, the flow velocities in the near-wall end (0.36 m/s) and far-wall end (0.29 m/s) regions were smaller than that in the mid-axis (0.41 m/s) region, which is due to the phenomenon of mainstream convergence at the bottom of the main channel and the effect of the channel sidewalls. This result is the same as the conclusion made by Yong [
30]. As the distance between the relative interfaces increases, the fluctuations became larger while the flow velocity decreases.
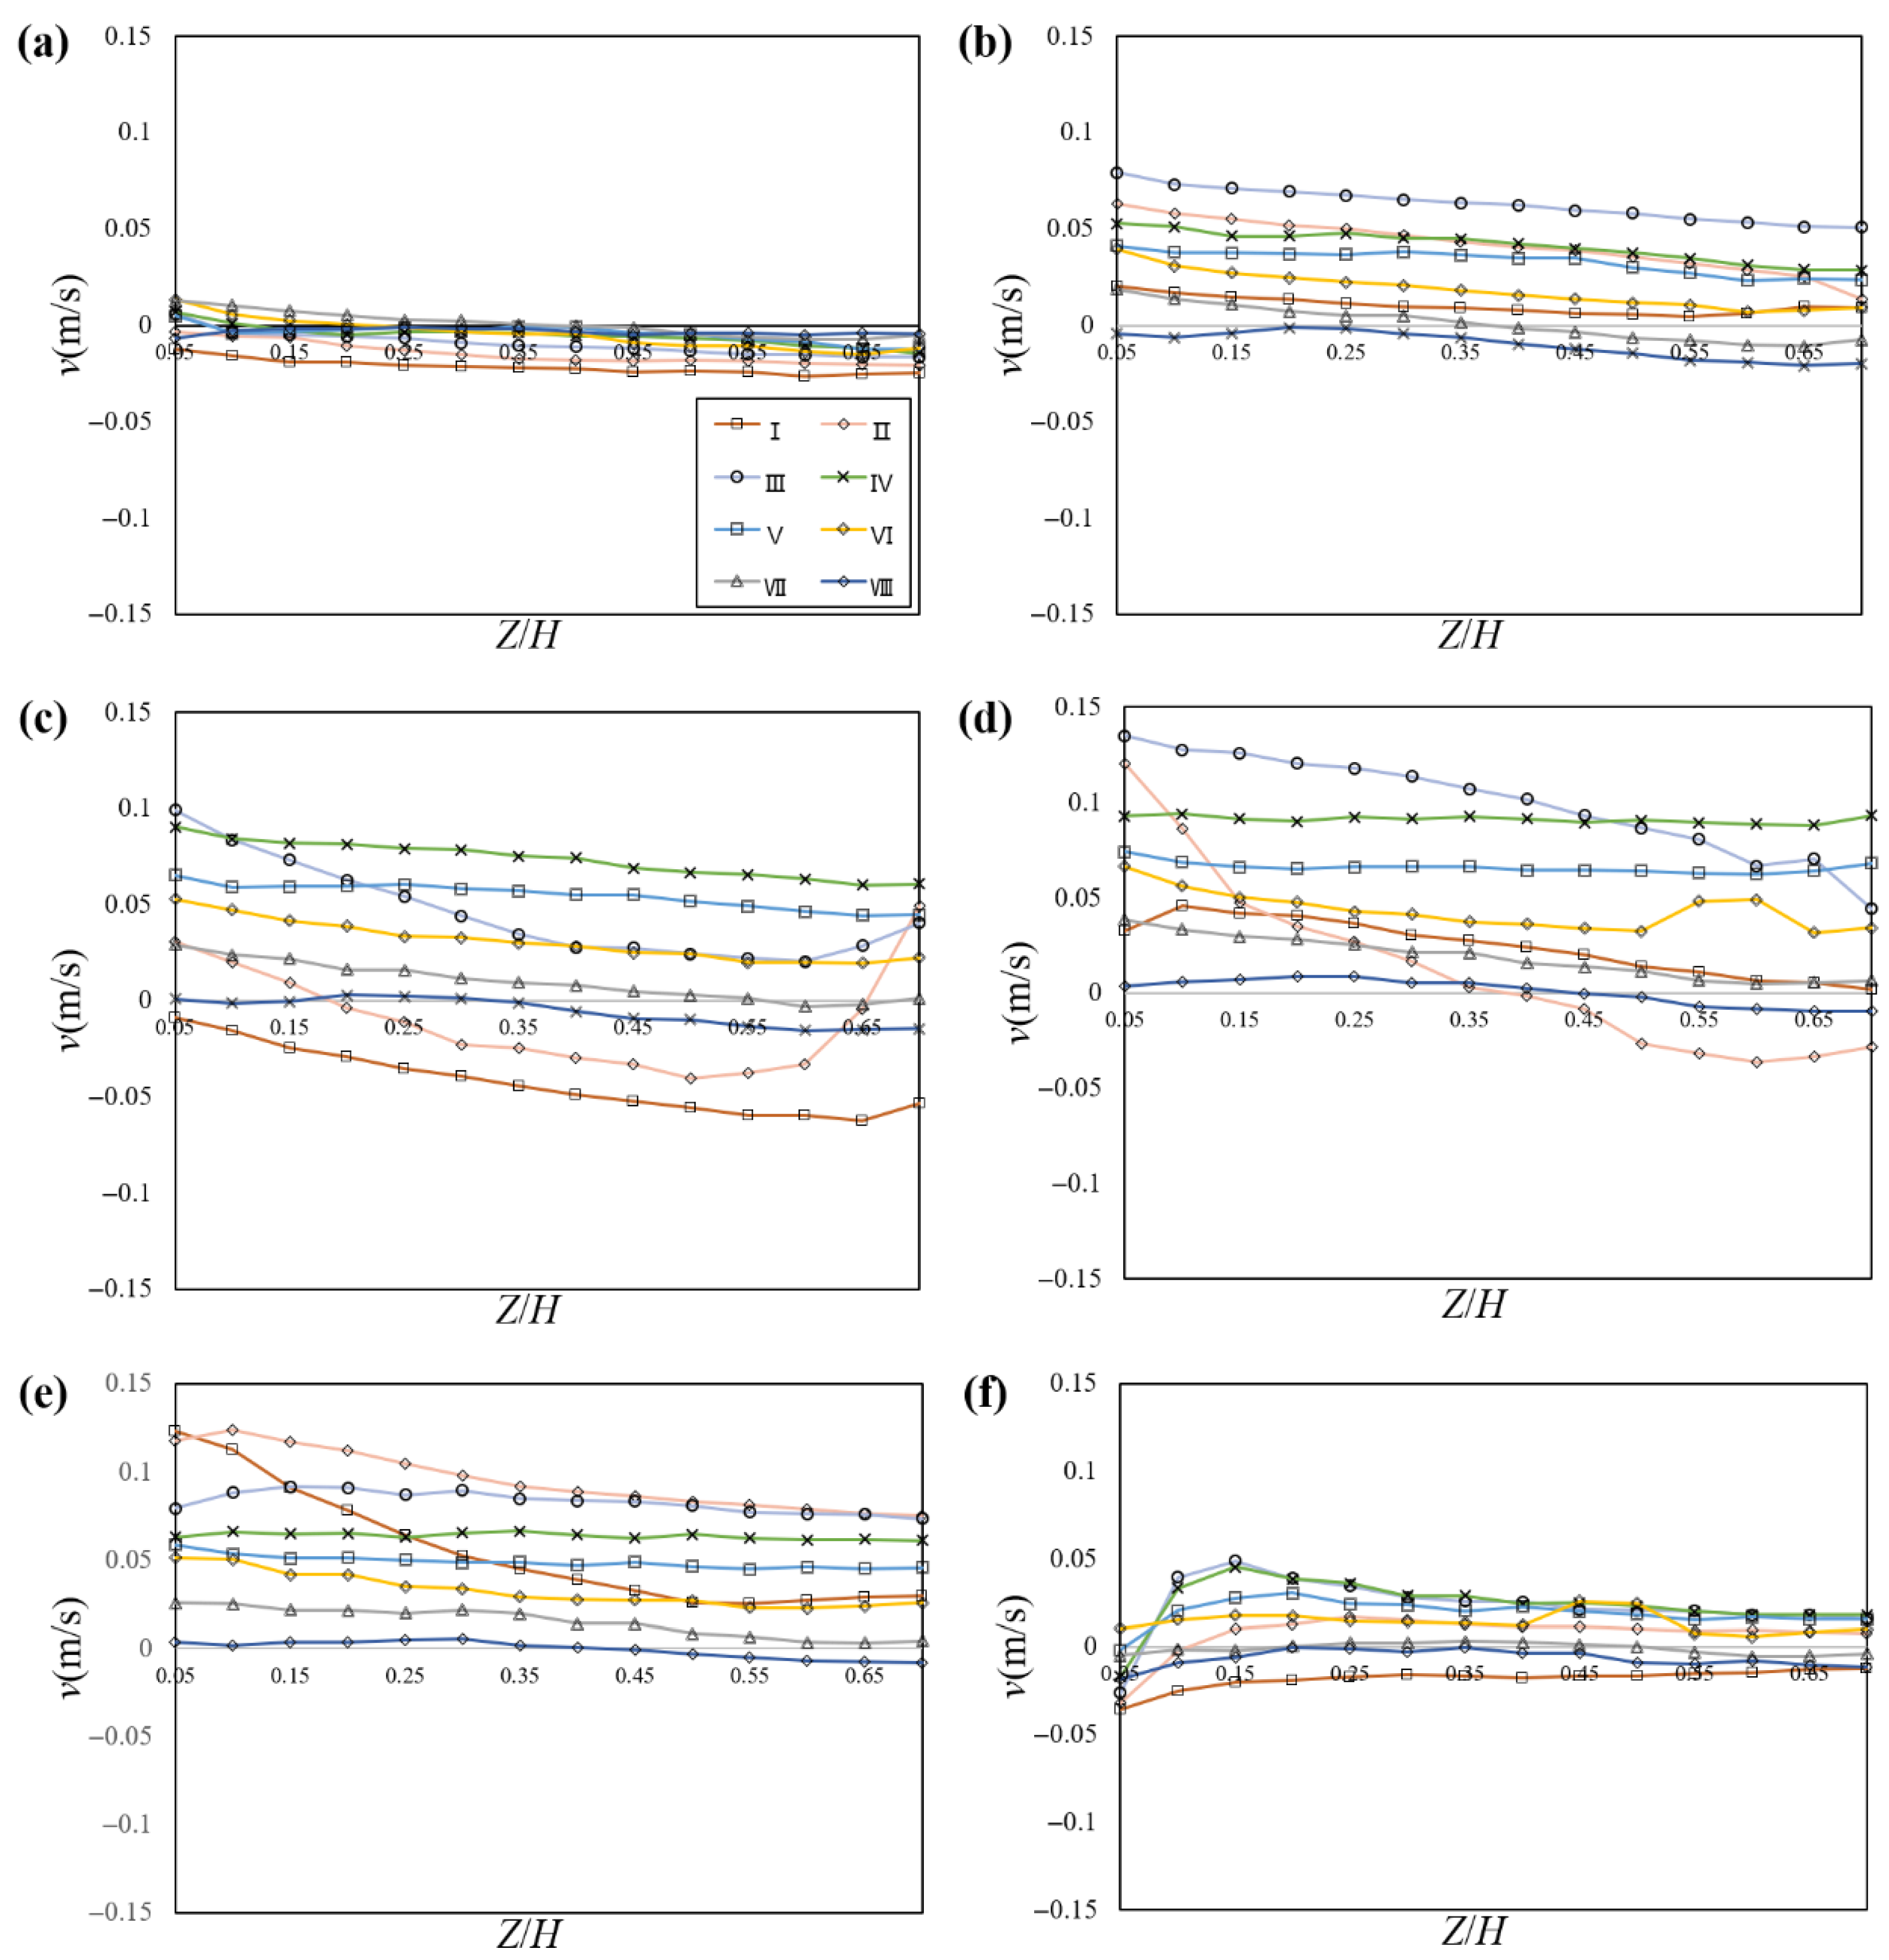
The lateral flow velocity
v at the diversion varies significantly.
Figure 9 shows the
v flow velocities at each section from upstream to downstream of the diversion. The distribution
v at each section mostly conformed to the constant type and there was a tendency for
v to increase when X increased. In the transverse direction of the channel, the fluctuation was more intensive at the diversion (Sections I–III), while it was relatively smooth between the center axis and further away from the diversion. In the Z-direction, the
v at the near-wall end of the section decreased gradually with the increase in
Z/H, while the far-wall end showed an increasing trend. This phenomenon arose from the gas–liquid interface’s fluctuation-dominant effect as the distance from the diversion increased, combined with the lateral force and hydraulic pressure interactions.
Figure 10 shows the
w of each section from upstream to downstream of the diversion. In the X-direction, the fluctuation increased with the decrease in the distance from the inlet. In the Z-direction, there was a general trend of increasing and then decreasing; the extreme values appeared at 0.8 h and 0.2 h.
The
u velocity at the near-wall surface (a), central axis (b) and far-wall surface (c) of the diversion is shown in
Figure 11; the size of the arrows in the figure represents the magnitude of
uv Reynolds stress and the direction represents the direction of change. The downstream lateral velocity difference was reduced to 0.12 m/s. A strong shear layer in the region of
(Δu = 0.35 m/s) exhibited K–H instability characteristics. By calculating the dimensionless parameter
, which was larger than the critical Reynolds number of 1000 [
31], it was shown that the shear layer enters the vortex-pairing evolution stage. At the same time, the recirculation bubbles appeared downstream, which is the same as the results obtained by Li [
8].
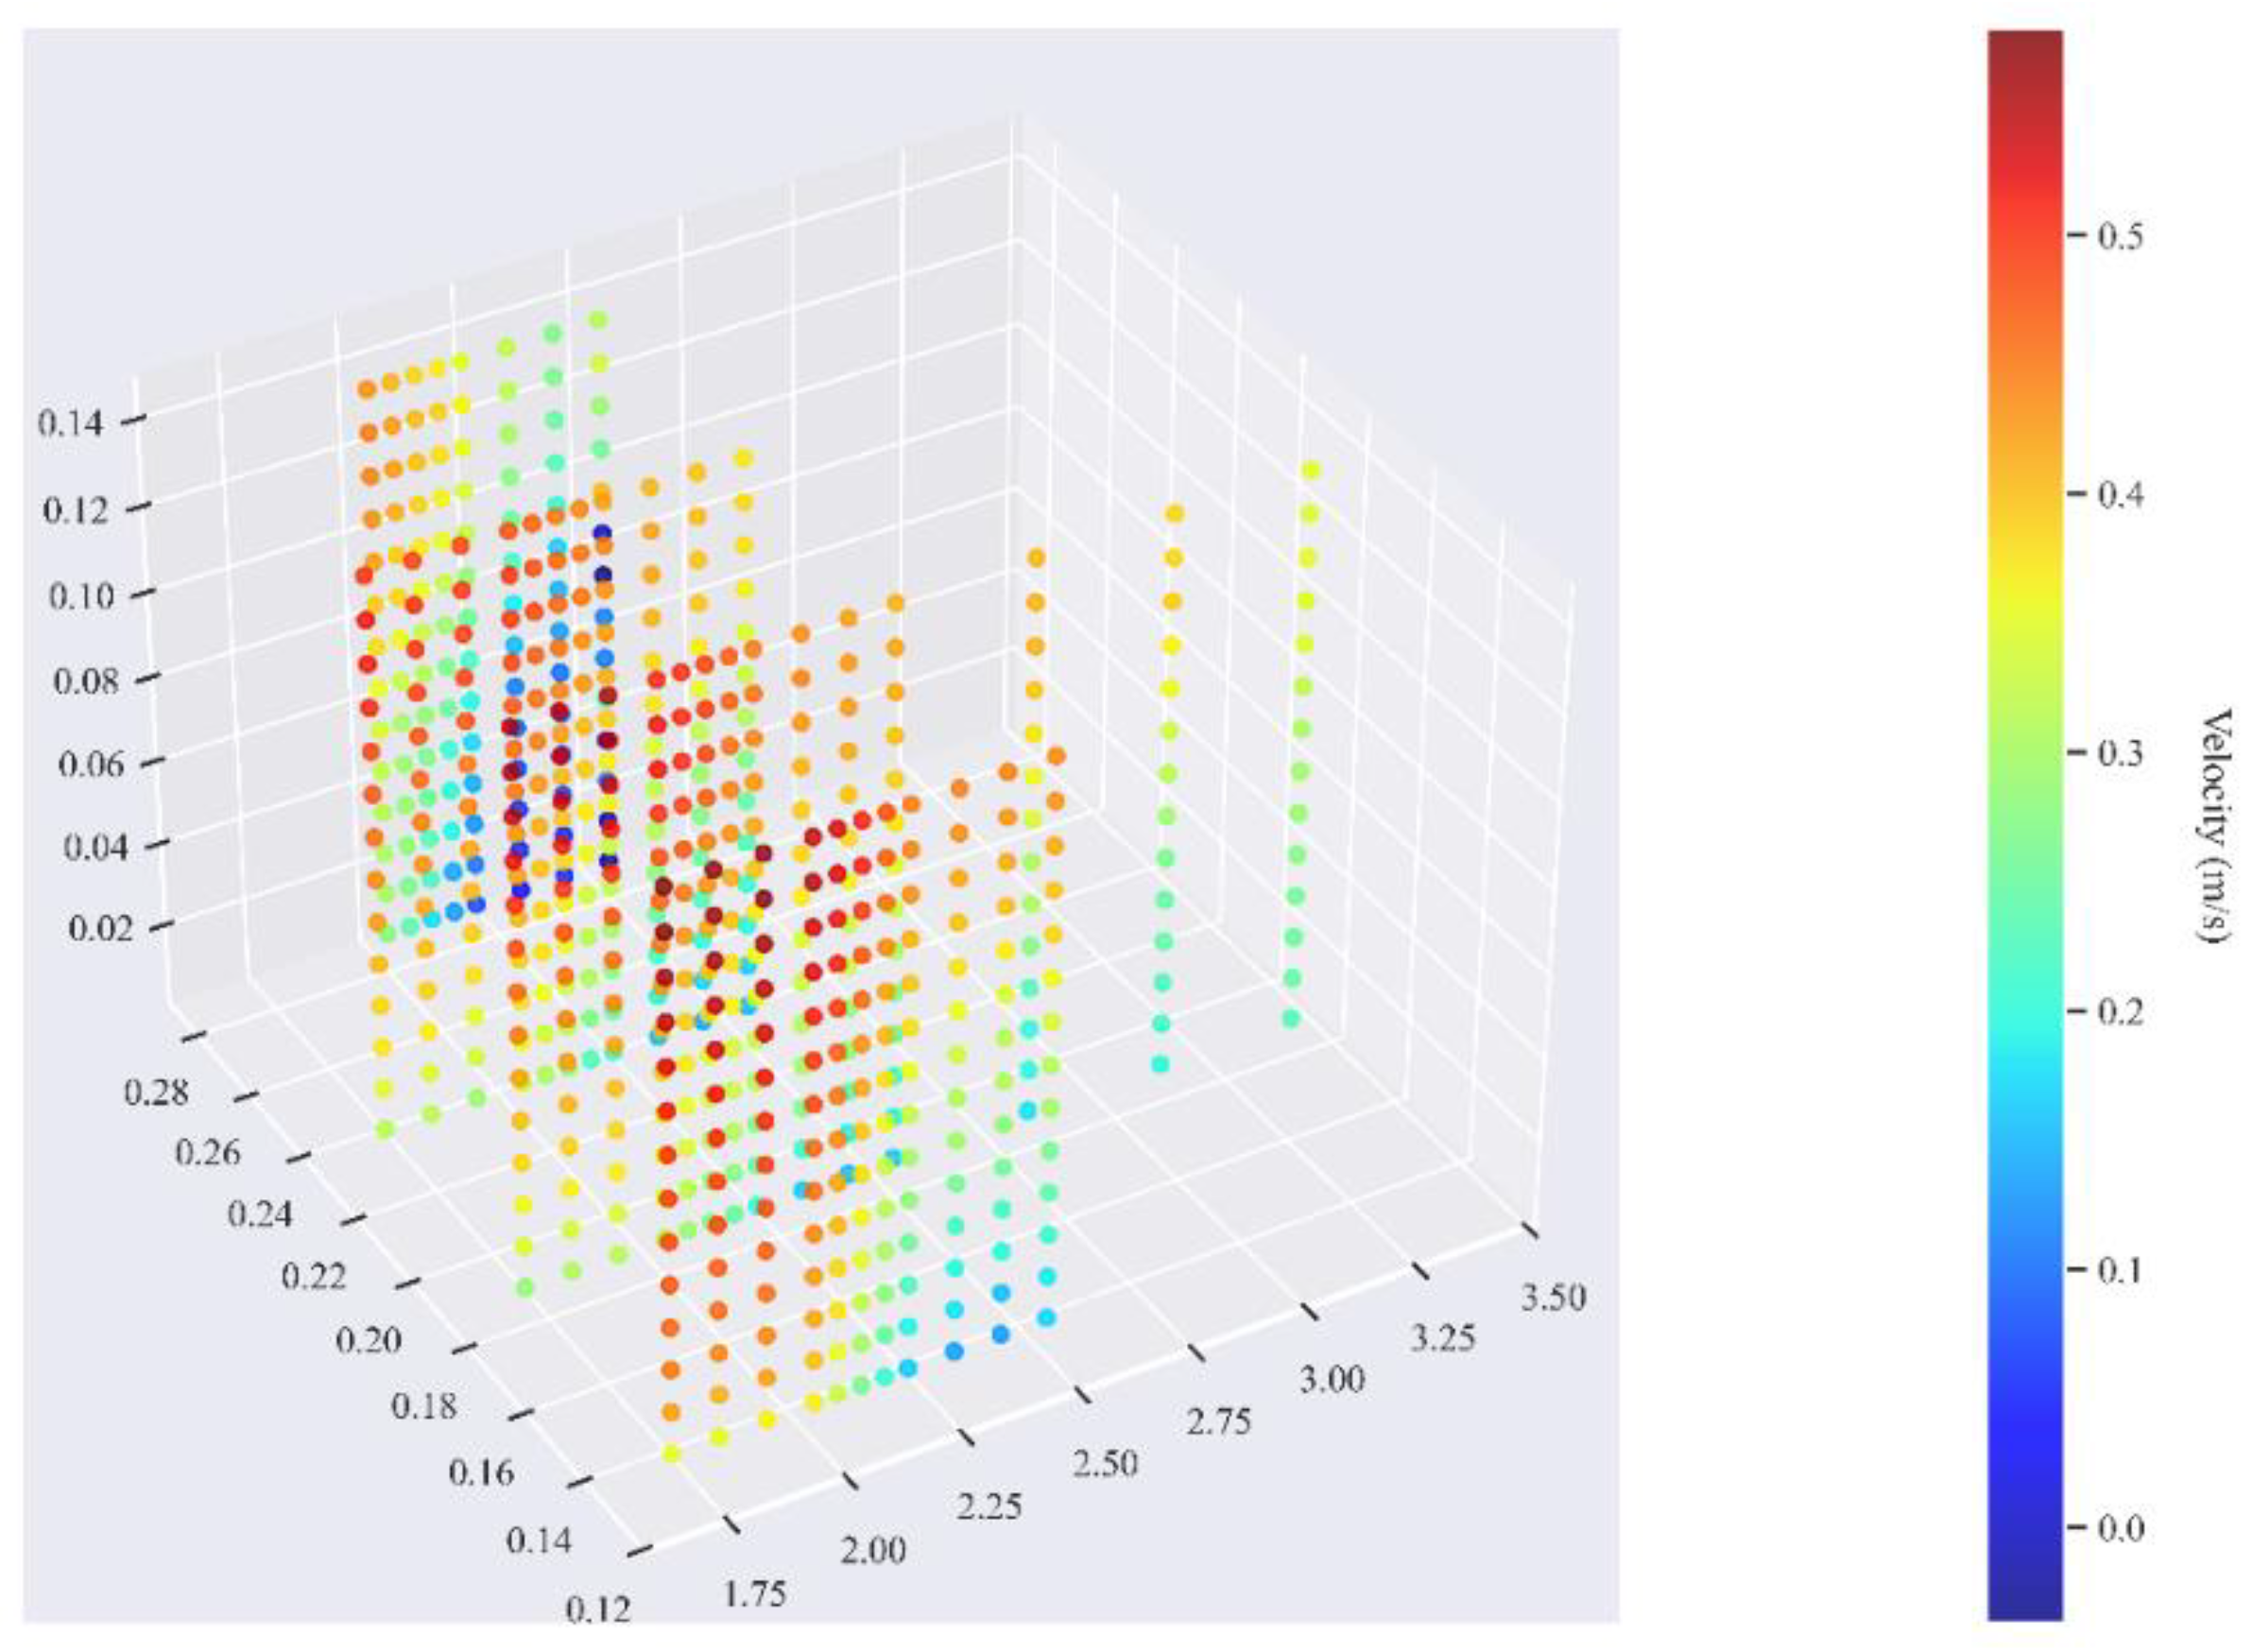
Figure 12 shows the 3D u map of the diversion. There is an obvious secondary eddy structure in the height layer of Z = 0.05–0.15 m; the maximum value of the velocity occurred in the region of
and Z = 0.12 m, forming a localized high-velocity zone. Meanwhile, the 3D inverted flow showed steering behavior at the bottom of the riverbed, which was consistent with the results of a study by Neary [
32]. The secondary flow, eddied at Z = 0.05–0.15 m, can be attributed to the coupling effect of the normal velocity gradient and flow curvature [
33]. The Dean value was about 80 < 100, which was in the Dean eddy stability interval [
27].
Combined with the structure at the diversion outlet, the variations in v and u were the main reason for the formation of secondary flow. It was demonstrated that the sudden change in v at the diversion outlet will simultaneously form a circulation flow, which will have an impact on sediment transport and canal wall stability.
3.1.2. Comparison of In Situ–Numerical Simulation Methods
The simulated–measured relative errors were derived by comparing the simulated data with the ADCP measured data, as shown in
Figure 13. The average relative error was less than 15%, which confirms the reliability of the simulation method. The average relative errors of the cross-sections were 8.2%, 9.5%, and 11.3%, respectively. The high error points (>15%) were concentrated within 0.2 m downstream of the diversion, mainly due to the turbulent pulsations not fully captured by the RNG
k-ε model.
3.1.3. Actual Channel Cross-Section Flow Rates and Structural Characteristics
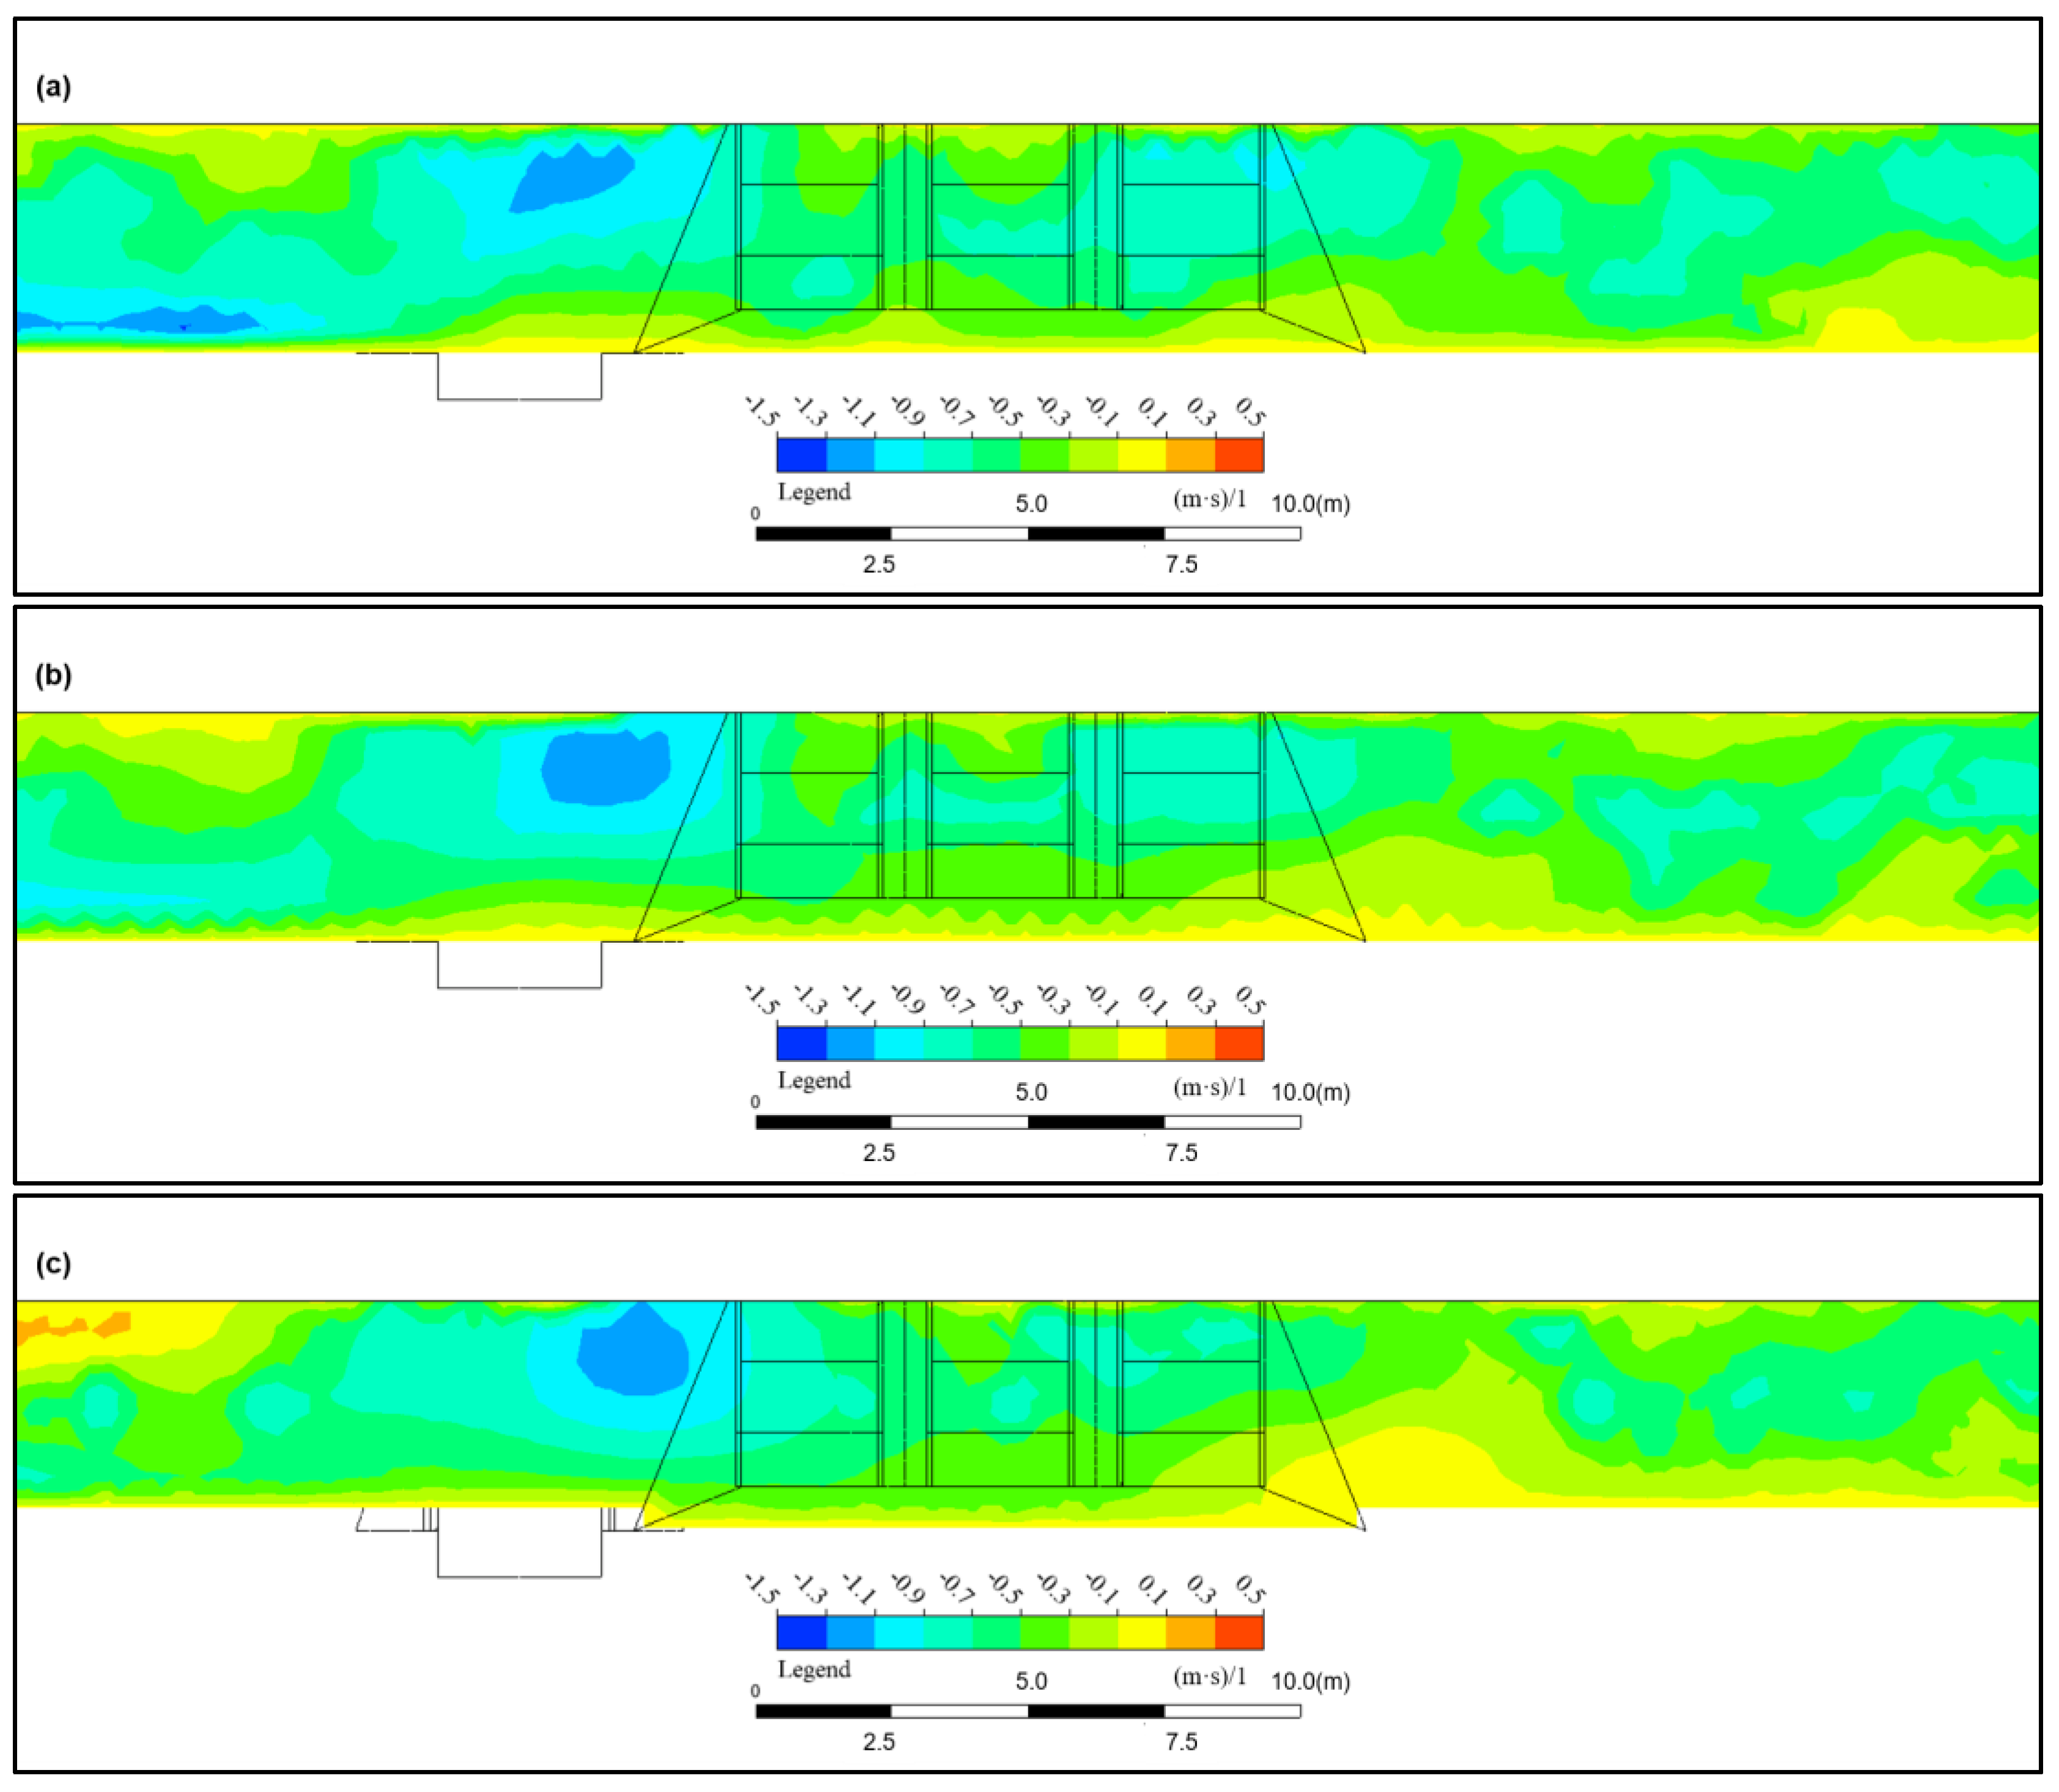
A water depth of h was chosen to obtain the cloud map of the flow velocity distribution in the section of
Figure 14. The flow velocity near the wall upstream of the diversion increased from 0.35 m/s to 0.42 m/s. At the downstream on L = 0.28 m, the lateral difference
u velocity Δ
u decreased from 0.35 m/s (1/4 h) to 0.12 m/s (3/4 h), indicating a significant gradient in turbulent diffusion in the vertical direction (∂
u/∂
z = 0.8 s
−1).
Setting the entrance of the single inlet at Y* = 0 m, the flow velocity distribution in
Figure 15 was obtained. The flow velocity gradient at the Y* = 0 m section (centerline of the diversion) reached ∂
u/∂
y = 3.5 s
−1, forming a K–H instability Re
δ = Δ
uδ/ν = 1200 > 1000. Downstream (Y* = 0.5 m), there was a
u = −0.05 m/s countercurrent; the length of the countercurrent zone was L
rec = 0.18 m.
Setting the entrance of the combined inlet at Y* = 0 m, the velocity distribution is shown in
Figure 16. At Y* = 0.5 m, the standard deviation σ of the flow velocity decreased from 0.15 m/s at the single inlet to 0.08 m/s; the lateral shear layer was Δ
u = 0.12 m/s. The length of the countercurrent zone downstream of the combined intake was shortened to L
rec = 0.08 m. The peak TKE = 0.12 m
2/s
2 was dispersed to both sides of the combined inlet by porous flow splitting; the main eddy scale was reduced from λ = 0.15 m to 0.08 m.
4. Discussion
The
uv Reynolds stress characterizes the momentum exchange between vertical (z) and lateral (y) velocity pulsations. The expression is as follows:
Figure 17 gives a grouped bar diagram based on the
uv Reynolds stress at the main sections around the diversion. The
uv Reynolds stress at the upstream (X* < −0.05 m) showed a stable vertical distribution, while it increased after the diversion position (−0.05 m < X* < 0.25 m) and a maximum occurred in the middle of the diversion (X* = 0.1 m). In the Y direction, with the distance from the diversion section, the
uv Reynolds stress showed a tendency to increase and then decrease; the maximum value occurred at Y = 26 cm.
Based on the flow velocity and energy (
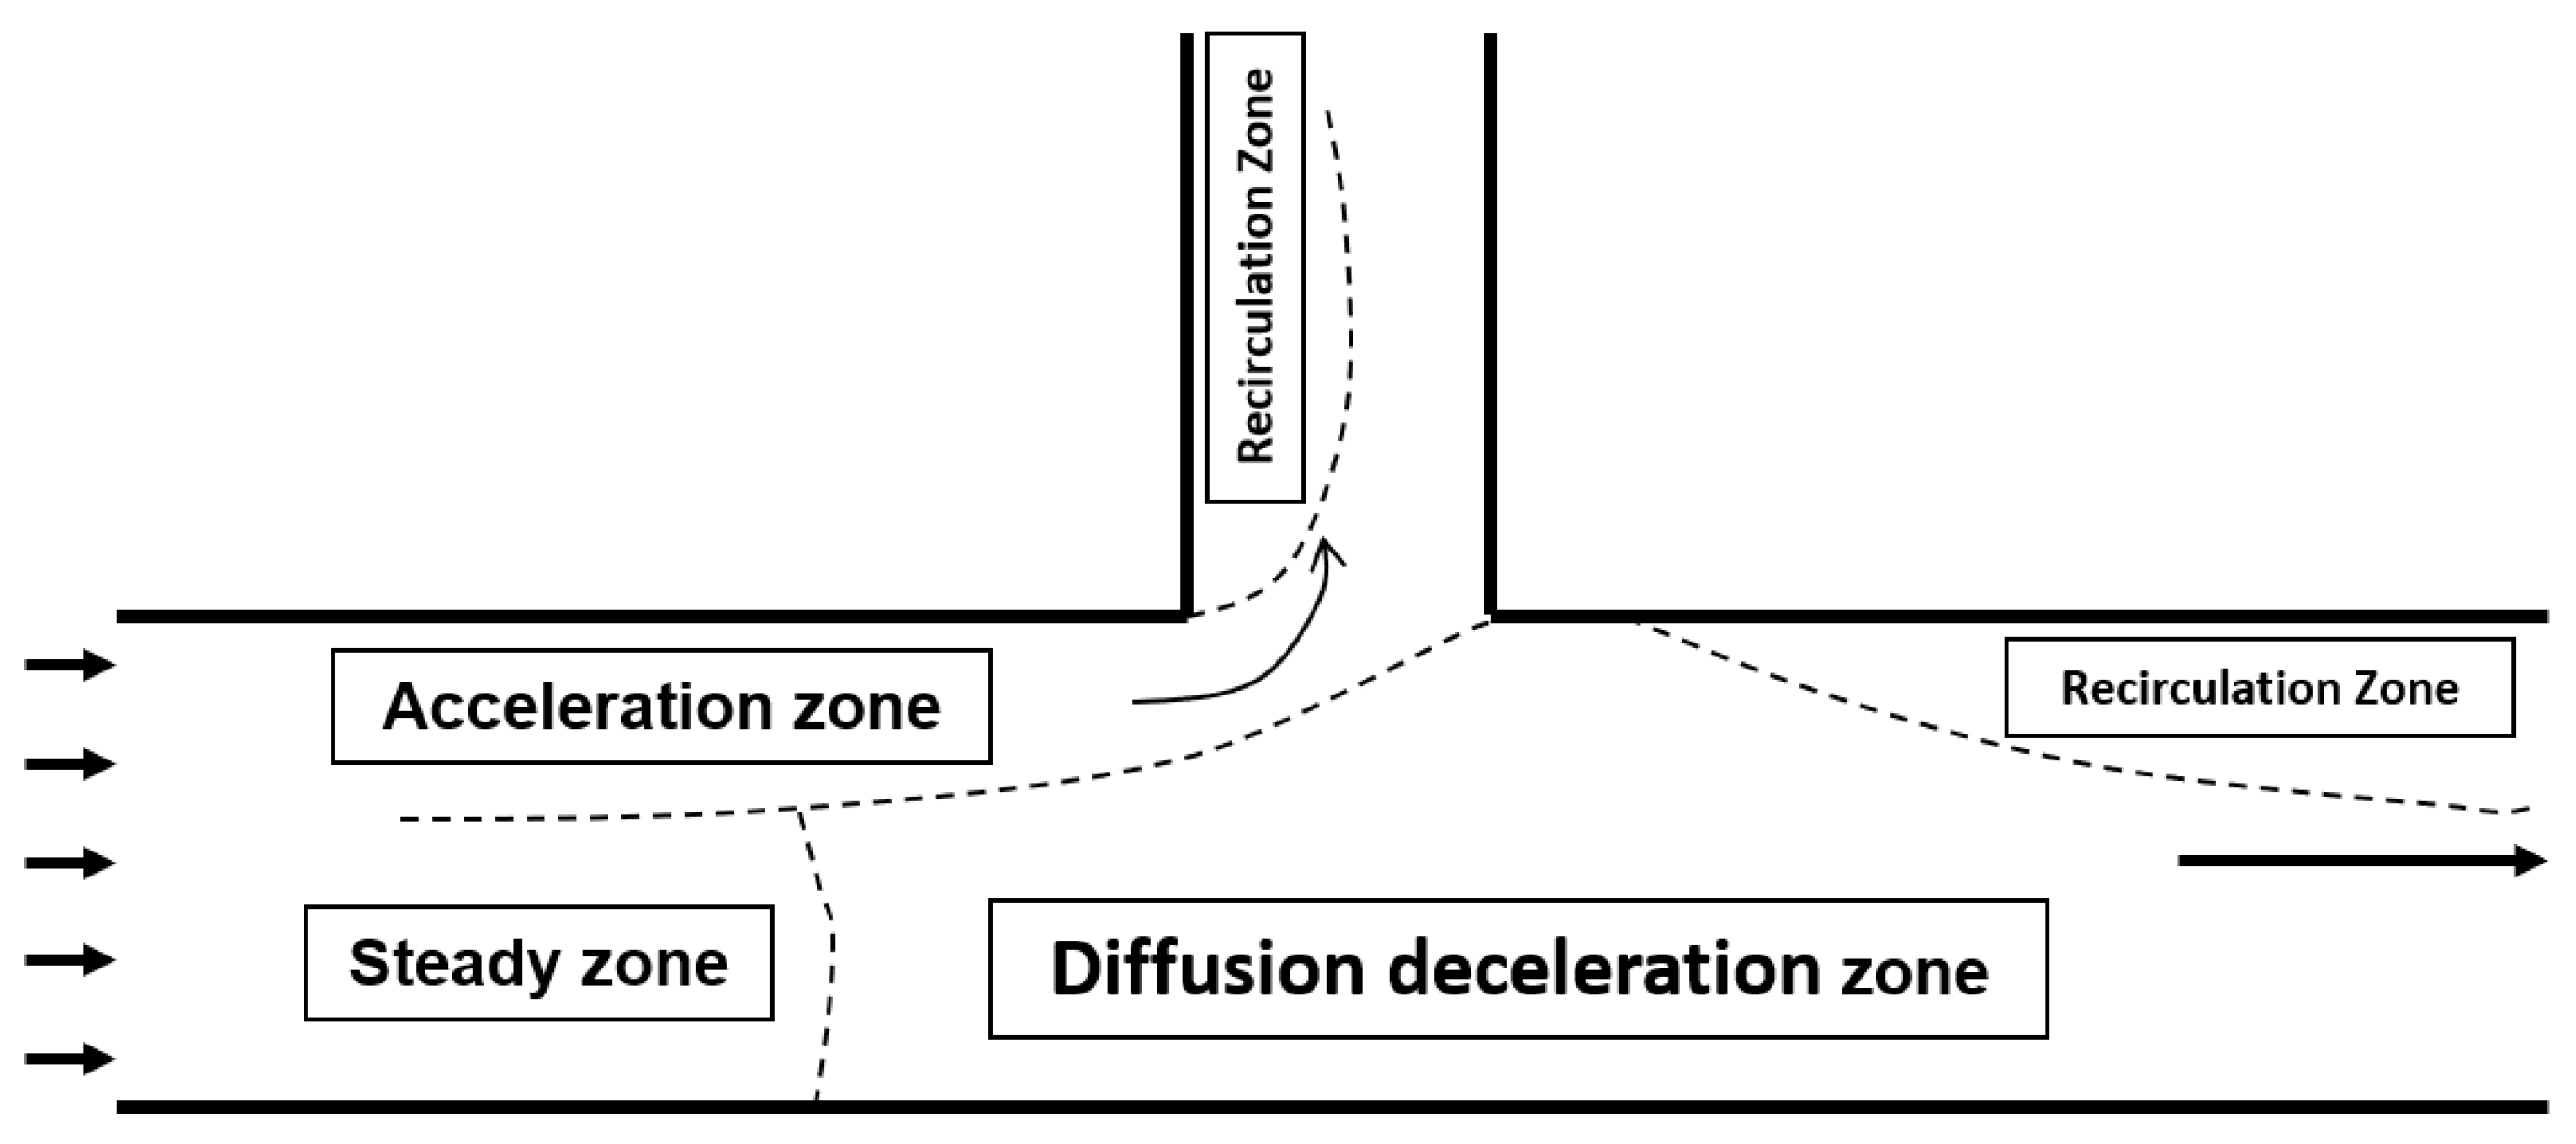
Supplementary Materials Text S3) of the region to be analyzed, this study characteristically zoned the diversion area of the rectangular open channel. However, due to the small amount of data and insufficient observation accuracy, quantitative analysis was not performed in this study (
Figure 18).
Acceleration zone:
The acceleration zone indicates the potential location of sediment control structures and consists of two parts, the acceleration zone on the front side of the diversion and on the back side of the diversion, with the former showing acceleration due to the change in the energy gradient from the main to the side channel and a peak in the u flow velocity. The latter is due to the contraction of the diversion, resulting in an increase in the regional flow velocity.
Steady zone:
The steady zone is formed by the main flow stream of the open channel laminar flow, which is controlled in accordance with the continuity equation in incompressible constant flow.
Diffusion deceleration zone:
The diffusion deceleration zone is the result of fluid inertia, pressure gradient, and turbulent dissipation; its physical mechanism can be decomposed into three parts: geometric diffusion effect, reverse pressure gradient, and turbulent dissipation.
The recovery coefficient is derived from Bernoulli’s equation, as follows:
It is higher than the critical value of 0.35, indicating that the adverse gradient sufficiently stabilizes the deceleration effect.
The turbulent kinetic energy dissipation rates are as follows:
The above conforms to the Kolmogorov scaling law on the order of magnitude, suggesting that the energy dissipation process influences the deceleration process.
Stagnant Flow Zones (Recirculation Zones):
The recirculation zone highlights areas prone to localized scour. Persistent negative values were observed on the sidewall side, downstream of the diversion. Eddies were judged for this area using the Kelvin–Helmholtz instability criterion:
According to the qualitative zoning method, this paper determined the location of the distribution of the upstream and downstream stable flow lines of the rectangular open channel diversion. The derivation process is shown in
Supplementary Materials Text S2.
The stable zone length (
L) depends on: water depth (h); gravity (g); average velocity(U); main-/side-channel width (
); roughness height (ks); and pressure gradient (
). Using the Buckingham Pi theorem, five dimensionless groups were derived:
Based on the experimental data, it was found that the effects of and were relatively small; therefore, the core dimensionless parameter was determined to be .
Multivariate statistical analysis yielded the following upstream empirical formula:
(R2 = 0.83, p < 0.01)
Multivariate statistical analysis yielded the following downstream empirical formula:
(R2 = 0.76, p < 0.01)
The downstream empirical formulation proposed in this paper deviates less than 10% from Parker’s wide-channel diversion model () for Fr < 0.6. This improvement suggests that the limitation of the conventional model for high Froude number conditions can be compensated by the geometric parameter.
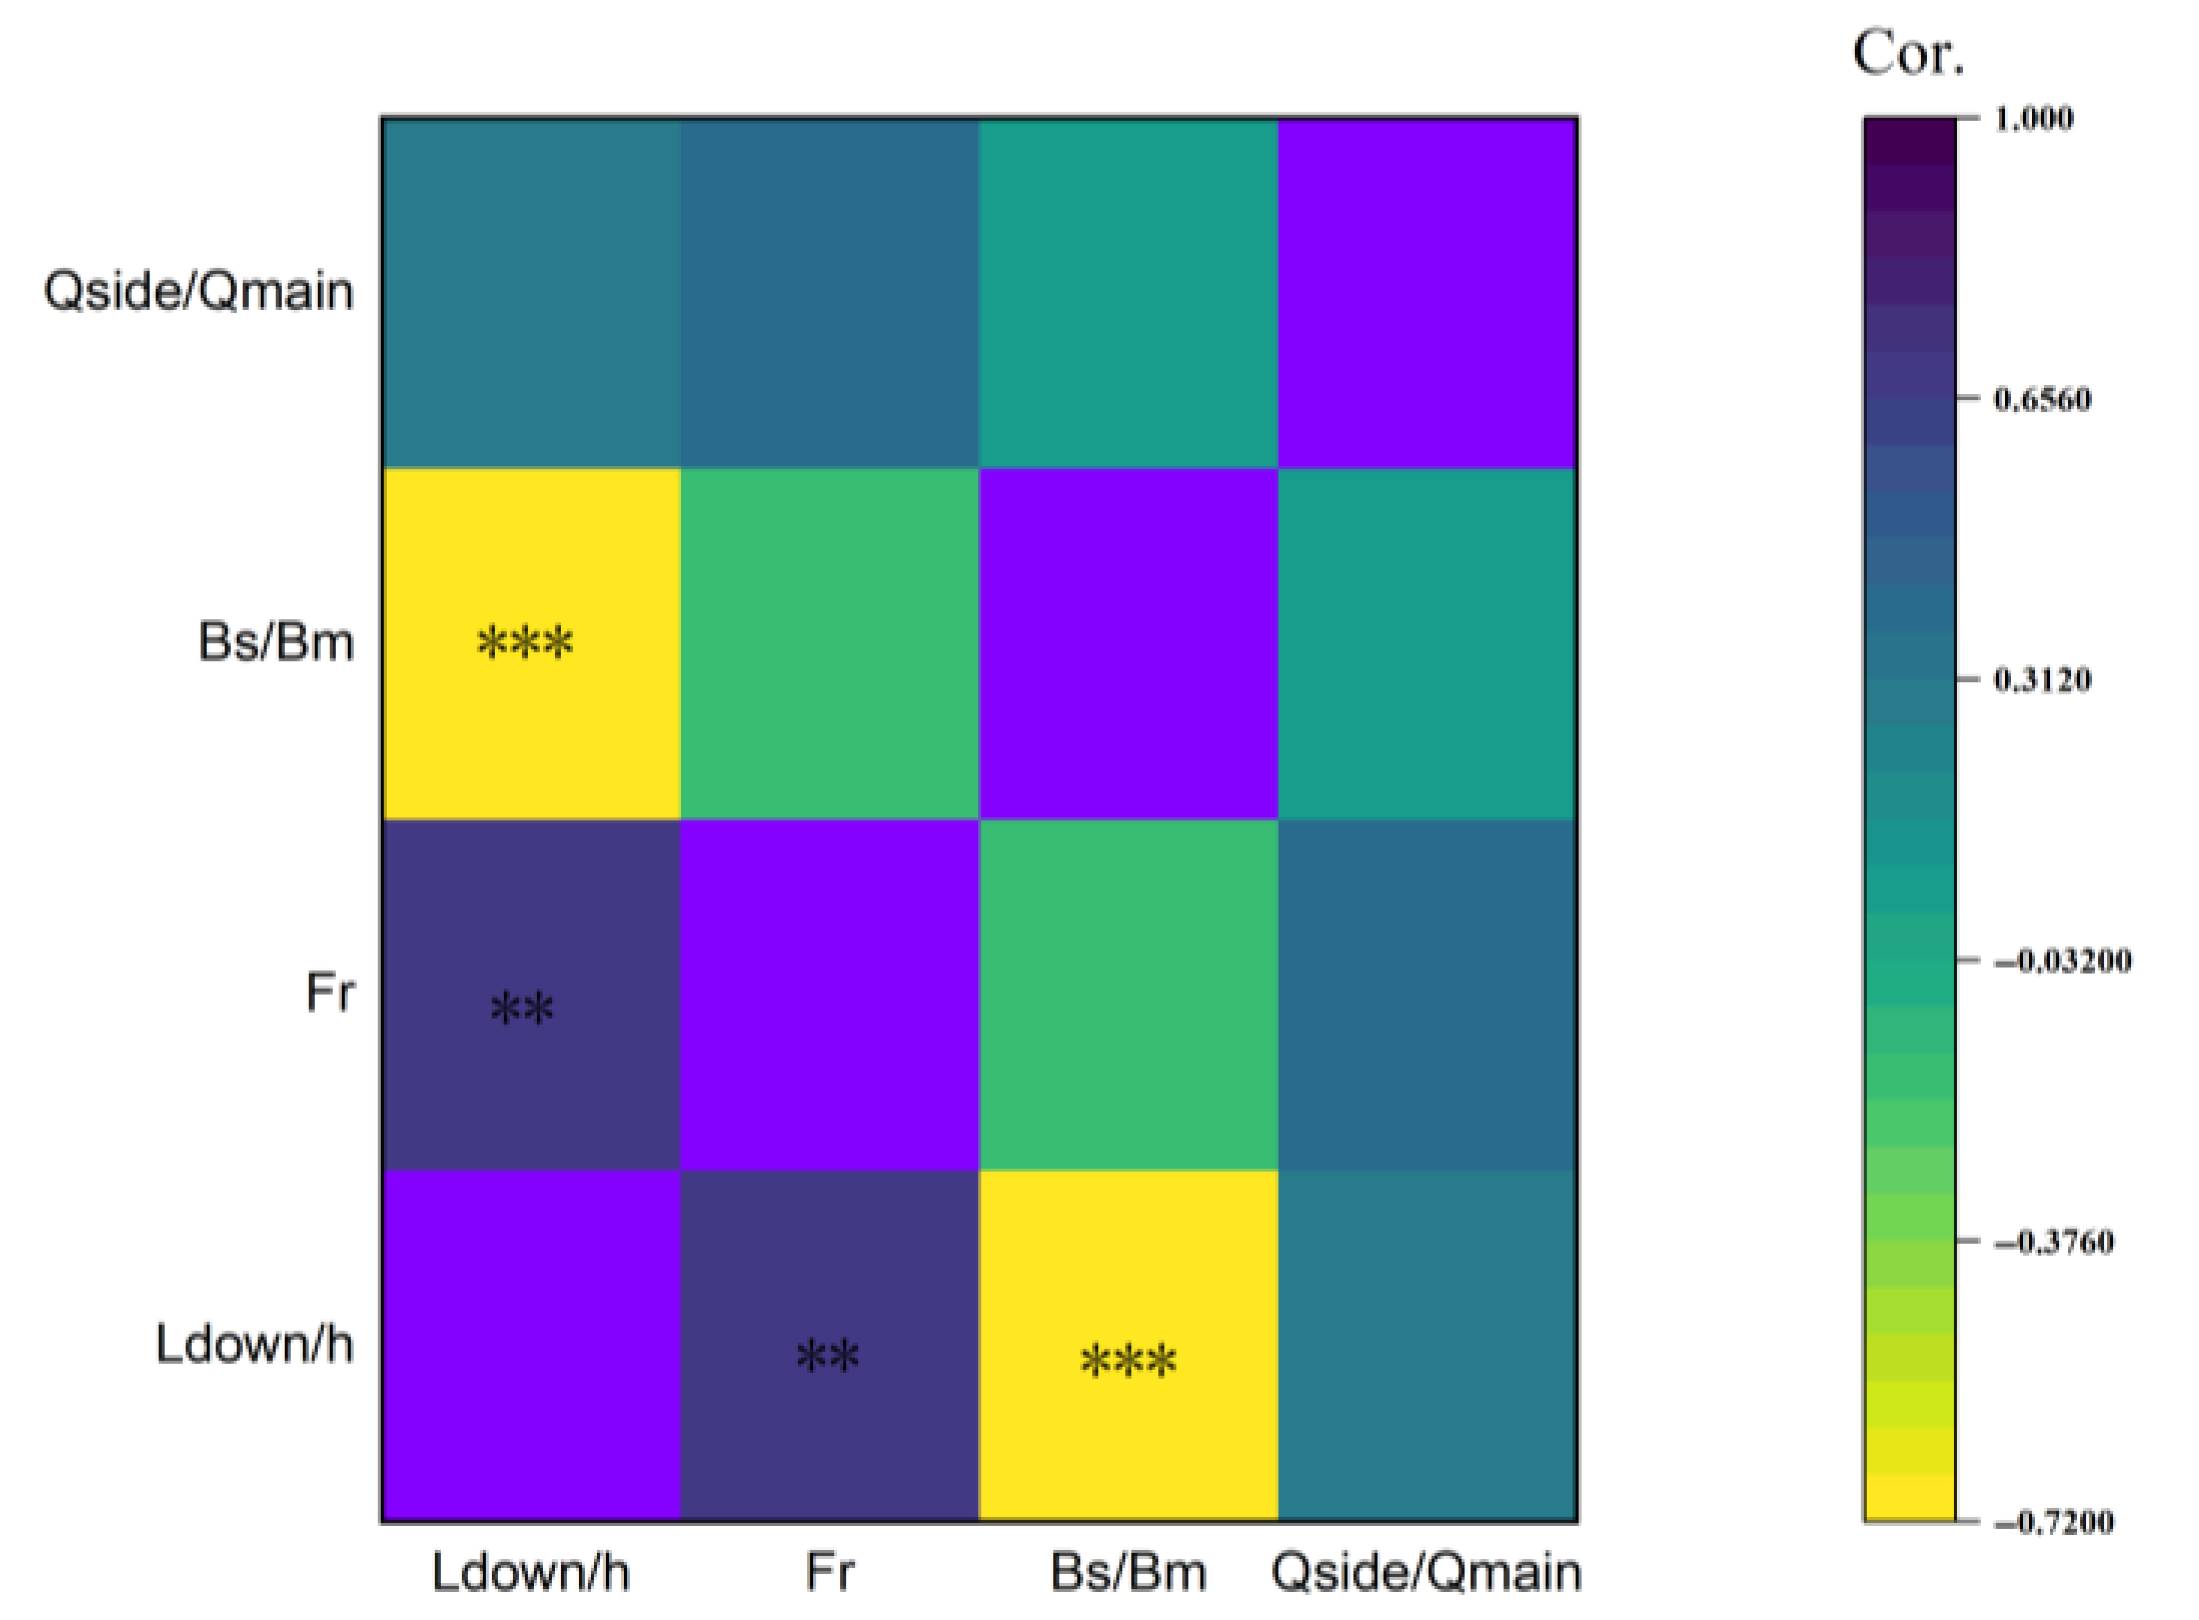
As shown in
Figure 19, by principal component analysis (PCA), the order of the contribution of key parameters affecting the stability of the diversion was found to be
(12%). A sensitivity analysis of the parameters yielded the results shown in
Table 3.
Notably, the interaction of Bs/Bm and Fr had a joint explanation of 0.68 for Ldown/h, indicating that the nonlinear coupling of the channel geometric ratio and flow inertia force is the core mechanism dominating the energy dissipation at the diversion.
Recommendations for the Layout of Irrigation District Flow Measurement Facilities.
The following recommendations for the layout of flow measurement facilities are proposed to improve accuracy and regulation efficiency for irrigation districts:
A flow measurement box is suitable for small-flow, low-sediment scenarios in the stabilization zone downstream of the diversion. The flow in the stabilization zone becomes uniform after diffusion and deceleration, satisfying the flow measurement box’s requirement for stable flow patterns. It is recommended to install the box at the starting point of the downstream stabilization zone (X/X* ≈ 1.25);
- 2.
Flow Measurement Weir
The flow measurement weir is recommended for medium-to-high flow measurements in the upstream acceleration zone (X/X* < 1.0). Broad-crested or triangular weirs are suggested, with the weir crest height adjusted based on Fr;
- 3.
Current Meters (ADV/ADCP)
Current meters are suitable for high-precision velocity measurements in the core turbulent regions (diffusion–deceleration and stagnation zones). ADV (point measurement) captures meso-scale velocity pulsations near the wall (Y/Y* = 0.05), while ADCP (area measurement) covers the 3D flow field to within 0.28 m downstream of the diversion;
- 4.
Radar Water-Level Gauge
Radar water-level gauges are recommended for water surface fluctuation-sensitive areas (Y/Y* = 0.05). The non-contact design helps to avoid sensor wear from sediment-laden flow;
- 5.
Ultrasonic Water-Level Gauge
The ultrasonic water-level gauge is suitable for the stabilization zone (Y/Y* = 0.75∼0.95) and low-sediment scenarios. Its high-frequency pulse measurement captures micro-amplitude water surface changes (Δh = 1∼3 cm) in the stabilization zone, complementing radar gauges;
- 6.
Integrated Measurement and Control Gate
An integrated measurement and control gate is recommended for installation at the diversion point (X/X* = 1.0). By integrating the stable zone prediction formulas, the gate dynamically adjusts its opening based on real-time data. It is important to note that the water-measuring tank should be placed after the side-channel gate.
5. Conclusions
The hydrodynamic characteristics of irrigation diversions are critical for efficient water resource management and infrastructure design. This study systematically investigated flow structure and stable zone dynamics through integrated physical modeling, in situ sensing, and numerical simulation. The key conclusions drawn are as follows:
- (1)
Diversion Zone Zoning and Flow Characteristics
The diversion zone was qualitatively divided into four sub-regions based on velocity distribution, energy dissipation, and turbulence intensity, as follows.
Acceleration zone: Extends 0.8–1.2 h upstream and downstream of the diversion, with peak u.
Stable zone: Characterized by uniform velocity distribution and logarithmic vertical profiles, with the upstream length and downstream length described by empirical models with R2 = 0.83 and 0.76, respectively (p < 0.01).
Diffusion–deceleration zone: Spans 3.5–5.0 h downstream, where velocity decreases by 40% due to the turbulent dissipation and reverse pressure gradient (Cp = 0.45).
Stagnation zone: Localized recirculation bubbles (0.3–0.8 d) form near the inner wall, exceeding the Reynolds stress;
- (2)
Dominant Parameters Controlling Stable Zones
Principal component analysis (PCA) revealed that the stable zone length is dominated by geometric parameters. The hydraulic characteristics of the diversion on energy dissipation were proposed. The ranking of the contributions of the key parameters to the stabilization zone downstream of the diversion is as follows: (12%);
- (3)
Practical Guidelines for Flow Measurement Facilities
Based on the proposed zoning principles and flow characteristics, recommended solutions applicable to different water quantity facilities in the irrigation area were presented.
6. Uncertainty
Turbulence modeling errors mainly arise from limitations in model assumptions and uncertainties in parameter calibration, including:
- (1)
The RNG k-ε model was selected for its balance between computational efficiency and turbulence resolution, critical for simulating complex diversion flows with secondary circulation. The comparison to alternative models demonstrated that: (1) Large Eddy Simulation (LES) offers higher accuracy for small-scale eddies but requires 10× greater computational resources [
22], limiting parameter sweep feasibility; (2) the SST k-ω model performs well in boundary layers but overpredicts free-surface turbulence in open channels. The RNG k-ε model is based on the
Boussinesq eddy-viscosity assumption, which defaults to isotropic turbulence. However, strong shear flow near the manifold (e.g.,
at Y = 23 cm) leads to anisotropic turbulence, which biases the Reynolds stress prediction by 15–20%;
- (2)
Parameters, such as C1ϵ∗ = 1.42 and C2ϵ = 1.68, in the model are calibrated by the ideal flow. However, in the complex manifold flow, C2ϵ needs to be corrected dynamically according to Fr in order to reduce the energy consumption rate error;
- (3)
The inability of the RANS model to resolve small-scale eddies leads to energy loss in the TKE spectrum downstream of the manifold in the high wave number region, which affects the prediction of the mixing process;
- (4)
Future studies should explore different diversion angles (60°, 120°) and sloped channels (i = 0.001–0.01) and incorporate sediment transport dynamics to address scouring in stagnation zones.
