Abstract
After long-term water injection development in Block M of the Gudong Oilfield, the fluid seepage field in the formation has become increasingly complex, and the heterogeneity of the reservoir has intensified. The uneven injection-production and the differences in lithological permeability have further led to a series of problems such as uneven reserve utilization, a low injection-production correspondence rate, and a poor overall development effect. During the development process, severe water flooding at the bottom and rich remaining oil at the top within the layer also emerged. These issues not only affected the economic benefits of the oilfield but also put forward higher requirements for the subsequent development strategies. In order to solve the above problems, based on a detailed analysis of geological characteristics, reservoir engineering and monitoring data, this paper uses the numerical simulation method to systematically simulate the dynamic changes in the residual oil saturation and pressure field in the formation under different development stages. The simulation results show that the pressure and saturation in each layer are both on a downward trend, especially in the layers with large pressure changes, where the oil saturation changes are more significant. Therefore, combined with the results of numerical simulation, a series of profile control and water shutoff schemes were systematically designed. These schemes covered different types of profile control agents and technological parameters. Representative well groups were selected to predict and evaluate the profile control effect. In the technical and economic evaluation of the profile control effect, the input–output ratio method was adopted. Finally, an optimal scheme was selected and applied in the field. The results show that after the implementation of this scheme, the daily oil increment of the well group was remarkable. During the test period, the cumulative oil increment reached 100 t, and the total expected oil increment could reach 190 t. The input–output ratio reached 1:2.1. The profile control measures significantly improved the injection-production correspondence, slowed down the in-layer water flooding, and further enhanced the recovery rate of remaining oil. In conclusion, the methods and achievements of this study can provide important technical references and support for the efficient and long-term development of similar high-water-cut and heterogeneous complex oil reservoirs, and have guiding significance for the subsequent adjustment, potential tapping, stable production and efficiency improvement of oilfields.
1. Introduction
Excessive water production from oil wells is a common problem in the development of oil and gas reservoirs [1]. The fundamental cause lies in the low mobility of water compared to hydrocarbons (oil and gas), which makes water more prone to migration within the reservoir and entry into production wells [2,3,4]. However, in actual situations, the reasons for excessive water production in oil wells are more complex. A comprehensive analysis that takes into account specific geological conditions, reservoir characteristics, and wellbore conditions is necessary to find effective solutions [5,6]. The reasons for excessive water production in oil wells have been proven to show that implementing effective deep profile control technology is the key to improving the water flooding development effect [7,8]. By optimizing the deep profile control process, the heterogeneity in the deep part of the oil layer can be effectively changed, the bypassing phenomenon of injected water can be reduced, and the deep liquid flow can be redirected, thereby increasing the swept volume of deep water flooding [9]. However, at present, relying solely on large doses of profile control injection is difficult to achieve the expected effect, often resulting in a situation where huge investment leads to insignificant results [10,11].
For the development of oil reservoirs that have entered the high water cut stage, various enhanced oil recovery (EOR) technologies should be introduced based on water injection, profile control, and dynamic monitoring to construct a comprehensive development strategy covering the entire life cycle of the oil reservoir [12,13]. In terms of water injection, measures such as fine layering, alternate water injection, optimization of the injection-production ratio, and water quality management are adopted to maintain formation pressure and improve the sweep efficiency. In the aspect of profile control, physical plugging, chemical water shutoff, and composite profile control technologies are combined to effectively manage high-permeability zones and water channeling paths [14,15,16]. On this basis, chemical flooding technologies such as polymer flooding, surfactant flooding, and polymer-alkali-surfactant (ASP) composite flooding can be introduced according to local conditions to further reduce the oil-water interfacial tension and improve the displacement efficiency [17,18]. For oil reservoirs that meet the conditions, carbon dioxide flooding, nitrogen flooding, or miscible gas flooding methods can be used to supplement energy and increase the recovery rate. At the same time, through 4D seismic monitoring, produced fluid profile analysis, tracer tests, and real-time data analysis of the digital oilfield platform, a dynamic feedback and optimization mechanism is established to ensure the continuous correction and improvement of the plan [19,20,21,22,23,24,25]. Ilavya et al. [26] introduced nano-graphene oxide to improve gel performance and alleviate the problems of instability and degradation. By implementing layered water injection and profile control, the water flooding effect can be effectively improved and the recovery rate of the oil reservoir can be enhanced. In addition, combining the geological model with numerical simulation technology can provide a scientific basis for the design of the profile control plan, thus achieving a more precise development strategy [27,28,29]. Song et al. [30] combined indoor experiments and numerical simulation methods to test the plugging performance of gel profile control agents in fractured-vuggy reservoirs, and determined the optimal injection parameters for gel profile control. This provides a reference for the implementation of gel profile control development in similar fractured-vuggy reservoirs. Although various profile control technologies have been applied in different oil fields, most of them still rely on single-agent types or large-dose injection, which leads to rapid effect attenuation and high costs. Due to the disconnection between the development of profile control agents and the actual adaptation of oil reservoirs, the existing technologies show obvious insufficiency in adapting to extreme oil reservoir conditions such as high temperature and high salinity. Therefore, it is urgently necessary to carry out targeted formula optimization and injection parameter design research.
During the past more than 20 years of development, Gudong Oilfield has experienced multiple rounds of intensive water injection and production. However, with the passage of time, the limitations of waterflood development have gradually emerged [31]. Due to long-term water injection and scouring, significant changes have occurred in the formation channels. Coupled with the inherent heterogeneity of the oil reservoir, the injected water mainly advances along the high-permeability layer bands, while the coverage of the medium- and low-permeability layer bands is relatively small. This phenomenon has led to severe water channeling in water-flooding reservoirs, affecting the overall recovery efficiency [32,33]. At present, this development unit has entered the medium to high water cut period, with the comprehensive water cut rate exceeding 95% and the recovery degree reaching 42%. The distribution pattern of remaining oil among layers shows significant differences. The disparity in recovery degree among layers poses greater challenges to the development of the reservoir [34]. Therefore, it is particularly important to conduct research on the pressure field regulation and optimization technology for water-driven reservoirs in the Gudong Oilfield.
In view of the above problems, this paper, through a systematic literature review, has identified the research gaps in the current field of profile control technology for high water cut reservoirs. It innovatively integrates numerical simulation, quantitative analysis of remaining oil and economic sensitivity analysis, and for the first time, achieves a synchronous evaluation of oil production increase effect, input–output ratio, net present value and price fluctuation stability. The simulation prediction results are highly consistent with field applications, forming a replicable technical paradigm. This provides a solution that is both process innovative and economically reliable for the efficient development of high water cut reservoirs, significantly enhancing the application effectiveness of profile control measures in the high water cut period of oilfields.
2. Geological Overview
Gudong Oilfield is located in the northeast of Zhanhua Sag, Jiyang Depression, Bohai Bay Basin. It is one of the important large-scale continental sandstone oilfields in eastern China. Its oil and gas exploration and development history can be traced back to the 1970s. The West of the Seventh District is the largest development block in the Gudong Oilfield, located on the eastern wing of the Gudong structure. The strata within the area gently dip towards the northeast with an angle of approximately 1.0° to 2.0°. The geological structure is relatively simple, mainly featuring large-scale gently inclined structures. The reservoir type is mainly a fault-block and lithologic composite reservoir, with the reservoir lithology mainly being medium and fine sandstone, featuring medium to high porosity and permeability. The original formation pressure of the reservoir is sufficient, but as the development enters the high water cut stage, the displacement energy undergoes significant changes, and the difficulty of reservoir development gradually increases. Affected by factors such as high development intensity and uneven injection and production, the recovery factor of this block has exceeded 50%, and the comprehensive water cut has reached over 98%, entering the late stage of ultra-high water cut development as a whole.
In the high water cut stage, the remaining oil distribution in the Gudong Oilfield has become increasingly complex, mainly manifested in the large distance between injection and production wells, uneven water injection, and the increase in vertical and horizontal remaining oil enrichment zones, significantly raising the difficulty of utilization. In recent years, the Gudong Oil Production Plant has continuously intensified its efforts in resource exploration and implemented the “Resource Breakthrough Project”. At present, the oil production plant put 60 new wells into operation, with the average daily oil production capacity of each well reaching 3.6 t, setting a new record in recent years. In the future, the chemical flooding in Shengli Oilfield will face challenges such as higher reservoir temperatures, higher formation water salinities, and higher crude oil viscosities in the replacement areas. Focusing on the more demanding reservoir conditions, developing the theory of chemical flooding for high-temperature and high-water-cut reservoirs and tackling the chemical flooding technology for such reservoirs are of great significance for maintaining the stable production of Shengli Oilfield and even Sinopec and ensuring national energy security [35,36,37].
3. Principle of Flow Field Simulation
The grid flow simulation is based on the geological model. It simulates the oil and water flow during the production process from the initial state of the reservoir on a monthly basis, reveals the flow patterns, and obtains the current underground cross-flow channel distribution. The theoretical basis of the flow simulation subsystem of the grid-based simulation is the motion equation, Darcy’s formula and material balance, and the simulation process involves the coordination and comprehensive utilization of various data. The simulation process involves the following steps: ① Based on the results of well logging interpretation and geological modeling, an initial pressure distribution model is established through pressure gradient inversion, and the well location coordinates, completion method (vertical well/horizontal well), and perforation parameters are updated. ② Consider the hierarchical flow distribution and calculate the flow parameters of oil and water wells as well as pipelines. ③ Determine the length (L), cross-sectional area (S), and initial water saturation (Sw) of the flow parameters for oil and water wells and pipelines. ④ Simulate the variation and distribution of Sw in each flow tube after water injection. ⑤ Evaluate the deviation of water saturation, adjust the parameters to fit the actual situation, and then obtain the adjusted flow and saturation distribution.
According to Darcy’s formula, calculate the relative relationship of flow tube flow:
where is the fluid flow rate, m3/min; is the permeability, mD; is the area, m2; is the flowing pressure of the water well, MPa; is the pressure difference in the radial flow near the water well, MPa; is the flowing pressure of the oil well, MPa; is the pressure difference in the radial flow near the oil well, MPa; is the startup pressure gradient, MPa/m; R is the relative flow resistance of water flooding (1 for pure oil), is the viscosity, mPa·s; and is the well spacing, m.
Taking into account the actual water absorption profile and the relative flow rate calculated above, the total water injection volume of the well is allocated to each small layer. In the grid simulation, the water flooding degree in the flow tube is calculated by decomposing the three-dimensional flow of the entire oilfield block into many one-dimensional flows in the flow tubes. In the classical seepage theory, there is an analytical formula for one-dimensional seepage:
where is distance from the well, m; is cumulative water injection volume, m3; is porosity, %; is cross-sectional area, m2; is the derivative of water content and water saturation.
In water injection development, the main flow is concentrated in the streamline clusters within a certain range on both sides of the line connecting the oil and water wells in the small layer plane. The flow near the wells is similar to radial flow, while the flow between the wells is similar to linear flow. During a certain period of time, the grid-like structure formed based on the perforation conditions of oil and water wells and the inter-well communication conditions revealed the main flow correlations within the studied oilfield block.
4. Production Analysis of Units 54–61 in Block M of Gudong Oilfield
An analysis was conducted on the production situation of the 54–61 unit in the M block of the Gudong Oilfield. By simulating the underground flow field, pressure field and remaining oil saturation field distribution through flow tubes, the potential development areas were determined.
Flow Field Simulation of Profile Control Effect
The profile control situation of Unit 54–61 in Block M was simulated. The remaining oil distribution and pressure field distribution of the small layers in the block in different years were simulated and analyzed, as shown in Figure 1, Figure 2 and Figure 3. Based on the changes in the remaining oil saturation in the 54–61 units of the M block in the Gudong Oilfield, it can be found that as of April 2025, the remaining oil saturation is approximately between 15% and 25%. The remaining oil saturation in unit 54 is relatively low, while that in unit 55 is relatively high. This is mainly attributed to its geological characteristics and production history. Specifically, unit 54 is close to injection wells and production wells, with strong connectivity, which improves the sweep efficiency, and thus the remaining oil saturation is lower. In addition, the local reservoir heterogeneity in unit 54 is conducive to more effectively displacing crude oil, which is superior to the adjacent areas. That is, since the development of the reservoir to date, the recovery degree of unit 54 is relatively high, while the recovery degrees of Units 55 and 61 are slightly lower, indicating that they have development potential.
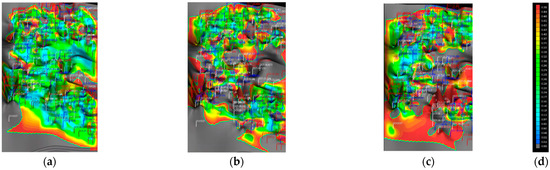
Figure 1.
Distribution of remaining oil saturation in each small layer of Units 54–61 in Block M ((a). 54; (b). 55; (c). 61; (d). bar chart).
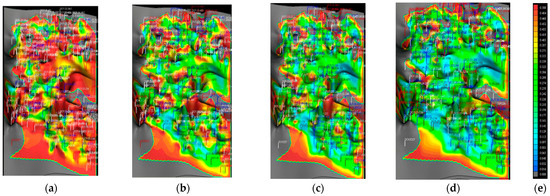
Figure 2.
Distribution of remaining oil saturation in M block at different months and years ((a). 1995.12; (b). 2005.12; (c). 2015.12; (d). 2025.04; (e). bar chart).
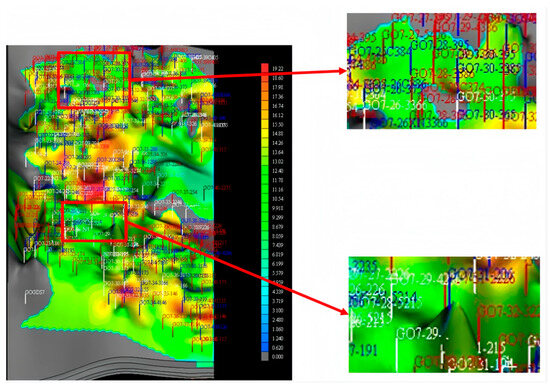
Figure 3.
Pressure field distribution of the combined layers of Units 54, 55, and 61 in Block M.
According to the pressure field map, the northwest, southwest and southeast directions of units 54–61 are areas with relatively low pressure. Combined with the inter-well connectivity, the flow lines are also more densely distributed in these areas. The simulation results of both are basically consistent, indicating that these areas can be regarded as the key regions for subsequent profile control. The above two areas are regions with relatively low pressure and severe cross-flow channels, which are consistent with the simulation results of inter-well connectivity. They are the regions that need to be focused on for profile control.
5. Profile Control Program Design and Effect Prediction
The pressure field of the flow was simulated by the numerical simulation method. The changes in oil production before and after the injection of profile control agent under different construction parameters and injection parameters were compared to analyze the effect of the profile control agent. By analyzing the impact of changes in injection parameters on remaining oil, researching the profile control agent system and injection method that match the reservoir environment, designing a reasonable profile control optimization plan, and conducting effect prediction analysis.
5.1. The Initial Profile Control Well Group
Based on the analysis of remaining oil, physical properties and development potential, the GO7-23-3366 well group was selected for the optimization of profile control operation parameters and effect prediction. The well group underwent polymer gel profile control in March 2025, with an injection concentration of 3000 ppm, an injection rate of 100 m3/d, and an injection volume of 2000 m3. The well group achieved a relatively good oil production increase effect, with a cumulative total oil increment of 300 t.
However, the oil production increase effect of the GO7-23-3366 well group has recently shown a decreasing trend. Combining the interlayer cross-flow and pore structure adjustment mechanism, existing research indicates that the thickening plugging agent can effectively block high-permeability channels in high-water-cut oil layers, reshape the streamline distribution of injected water, and enhance the sweep efficiency of low-permeability layers and the mobilization of remaining oil. Theoretically, the effective role of profile control agents lies in reducing the permeability of high-permeability zones and increasing the recovery rate of low-permeability zones. However, their plugging effect is prone to attenuation due to the influence of formation heterogeneity and flow characteristics. Therefore, to maximize the profile control oil production increase effect, a new round of optimized design should be carried out before the previous round of profile control becomes ineffective, taking into account the dynamic changes in formation pressure and the distribution of remaining oil. Therefore, a profile control plan design and on-site construction optimization plan were carried out for the GO7-23-3366 well group.
5.2. Numerical Simulation History Matching
In order to predict the future dynamics of the oilfield, numerical simulation studies were introduced. After historical fitting, based on the analysis of the comprehensive exploitation status of the oil layer, pressure and fluid saturation distribution conditions, the experience of previous development was summarized, the potential for future development was identified, and a development adjustment plan for the oilfield was formulated. Only through the analysis of the fitting results can the adjustment plan that needs to be carried out be determined. The main content of its analysis is that, based on the distribution of remaining oil saturation, the control status and location of the remaining oil are analyzed. The utilization status of each layer is analyzed by interlayer development indicators. The remaining oil saturation within the layer is studied, and the water flooding law is explored. New well points are provided based on the distribution of remaining reserves and water flooding, and various enhanced oil recovery schemes are proposed. Figure 4 shows the historical fitting situation of the entire area. A good historical fitting result provides a solid and reliable foundation for subsequent scheme design.
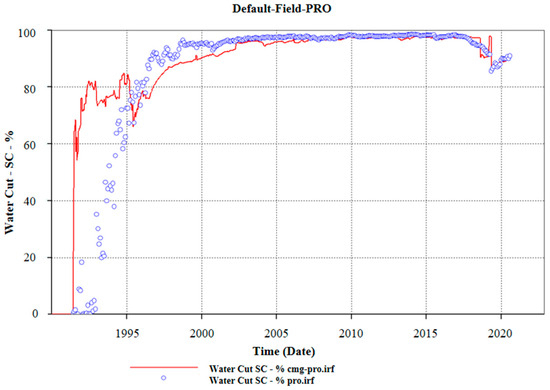
Figure 4.
Historical matching of the entire area of Units 54–61 in Block M.
5.3. Profile Control Scheme Design and Prediction
The plugging agent used in the plan is independently developed by Gudong Oil Production Plant of Shengli Oilfield. Its main components are a gel system composed of particulate materials with a specific particle size distribution and polymer crosslinking agents. When this system comes into contact with water, it forms a stable three-dimensional network structure, which can effectively block high-permeability channels and improve the injection profile. The plugging agent has good environmental friendliness. The residues after injection have little impact on the formation and surface environment. At the same time, it has high mechanical and chemical stability and provides a long-term and continuous plugging effect, which can guarantee the medium- and long-term effects of water injection development. It also explores the feasibility and popularization potential in other blocks of Shengli Oilfield and even under similar reservoir conditions.
Combining the parameters of the plugging agent obtained from laboratory experiments and considering the actual field construction conditions, the injection rate, injection volume and other parameter combinations of different types of plugging agents and different proportion concentrations are designed to form a profile control construction scheme. The specific parameters are shown in Table 1.

Table 1.
Profile control scheme table for different dosages of different plugging agents.
5.3.1. Liquid-Phase Inorganic Particle Profile Control
The profile control design schemes (Schemes 1–3) with the concentration of 20,000 ppm particles and injection volumes of 1600 m3, 2000 m3 and 2500 m3, respectively, were analyzed for the changes in oil production and the oil increment effect of the three affected oil wells. The comparison of cumulative oil production before and after the measures is shown in Table 2.
Table 2.
Cumulative oil production data of effective oil wells.
By comparing the oil production before and after the injection, it can be seen that different injection schemes all have effects. For the water well GO7-23-3366, the effect of injecting 20,000 ppm concentration particles is better with the increase in injection volume. It is predicted that by May 2025 (i.e., one year after the measure), for the affected well GO7-22-386, injecting 1600 m3 of particles will increase oil production by 6.7 t, injecting 2000 m3 of particles will increase oil production by 14.36 t, and injecting 2500 m3 of particles will increase oil production by 16.19 t. For the affected well GO7-23-3385, injecting 1600 m3 of particles will increase oil production by 14.92 t, injecting 2000 m3 of particles will increase oil production by 32.83 t, and injecting 2500 m3 of particles will increase oil production by 42.79 t. For the affected well GO7-23N3385, injecting 1600 m3 of particles will increase oil production by 7.71 t, injecting 2000 m3 of particles will increase oil production by 20.67 t, and injecting 2500 m3 of particles will increase oil production by 26.94 t.
Similarly, the oil production increase in three effective oil wells was predicted and analyzed according to the liquid-phase inorganic particle profile control scheme. Next is the analysis of the profile control effect of polymer gel.
5.3.2. Polymer Gel Profile Control
The profile control design schemes (Schemes 10–12) with the injection volumes of 1600 m3, 2000 m3 and 2500 m3, respectively, at the combination concentration of 30,000 ppm polymer and 30,000 ppm crosslinker in the form of gel are presented. The changes in oil production and the oil increment effect of the affected oil wells are analyzed as shown in Figure 5.
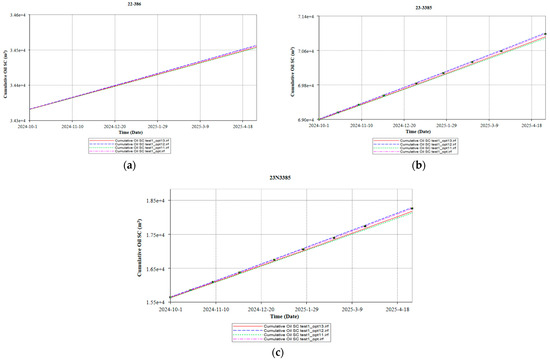
Figure 5.
Cumulative oil production profiles of three effective oil wells (polymer gel: (a). GO7-22-386; (b). GO7-23-3385; (c). GO7-23N3385).
By analyzing the oil production rate curves before and after the measures, it can be seen that different injection schemes are all effective. For Well GO7-23-3366, injecting a 20,000 ppm concentration of polymer and crosslinking agent shows better effects as the injection volume increases. It is predicted that, by May 2020 (i.e., one year after the measures), for the effective well GO7-22-386, injecting 1600 m3 of gel results in an oil increase of 13.04 t, injecting 2000 m3 of gel leads to an oil increase of 17.46 t, and injecting 2500 m3 of gel causes an oil increase of 39.31 t. For the effective well GO7-23-3385, injecting 1600 m3 of gel results in an oil increase of 29.27 t, injecting 2000 m3 of gel leads to an oil increase of 37.01 t, and injecting 2500 m3 of gel causes an oil increase of 77.97 t. For the effective well GO7-23N3385, injecting 1600 m3 of gel results in an oil increase of 7.88 t, injecting 2000 m3 of gel leads to an oil increase of 16.36 t, and injecting 2500 m3 of gel causes an oil increase of 51.26 t.
5.3.3. Oil Production Increase and Economic Forecast of Profile Control Scheme
The input–output ratio of measures refers to the ratio of the input of measures to the output increment of measures, where the input of measures includes measure investment and incremental cost, and the output of measures is the measure income. The crude oil price of Gudong Oilfield is set at 0.235 million yuan per ton, and the construction cost is calculated at 1.8 million yuan per well. The input–output ratios of each scheme are shown in Table 3 below:
Table 3.
Total oil increment and input–output ratio of well groups for various schemes.
Based on the above results and considering the economic benefits, it is recommended that, for the well group GO7-23-3366, Scheme 15 be adopted, with an injection of 2500 cubic meters of gel at a concentration of 3500 ppm. The input–output ratio is 1:2.78, indicating a relatively good economic benefit.
Based on this, a sensitivity analysis of crude oil price fluctuations was conducted to assess the robustness of the economic evaluation results under different market conditions. Three price scenarios were set, namely ±20% and ±40% of the benchmark price (0.235 million yuan/ton), and the net present value (NPV) and payback period were calculated for each scenario. The results show that, even under the unfavorable condition of a 40% price drop, Scheme 15 still maintains a positive NPV and falls within the acceptable payback period, while in the price increase scenario, the economic benefits are significantly enhanced. This indicates that the proposed scheme has good risk tolerance and profit potential in different market environments.
6. Field Application and Effect Analysis
The interlayer and intralayer contradictions of Well GO7-23-3366 are prominent, with intralayer contradictions being the main issue. In March 2024, the well group underwent polymer gel profile control, with an injection concentration of 3000 ppm, an injection rate of 96 m3/d, and an injection volume of 2000 m3. The well group achieved a good oil production increase effect, with a cumulative total oil increase of 300 t. Previous studies have shown that in-layer profile control should be carried out before the previous round of profile control becomes ineffective. In October 2024, profile control was carried out on this well group again. As of now, the affected wells GO7-23-3385 and GO7-23N3385 have shown good results. They have already increased oil production by 100 t, and the expected oil production increase is 190 t, indicating great development potential. The crude oil price of Gudong Oilfield is calculated at 0.235 million yuan per ton, and the construction cost is calculated at 210,000 yuan per well. The expected input–output ratio is 1:2.1, indicating that the design and research of the profile control prediction plan through numerical simulation have a certain guiding role for on-site construction.
The interpretation results of the water injection profile of the injection well GO7-23-3366 are shown in Figure 6. After the implementation of the profile control and flooding measures, the water absorption profile of Well GO7-23-3366 has changed significantly. The water absorption ratios of low water absorption layers such as units 54 and 55 have increased significantly, with an average increase of 15%. This is conducive to expanding the swept volume of water flooding and improving the recovery rate of remaining oil. Generally speaking, the profile control and flooding measures have improved the distribution of the injection profile, suppressed the over-injection phenomenon in high-permeability layers, expanded the water flooding swept volume of low-permeability and medium-permeability layers, and thus enhanced the oil displacement efficiency of the entire well group.
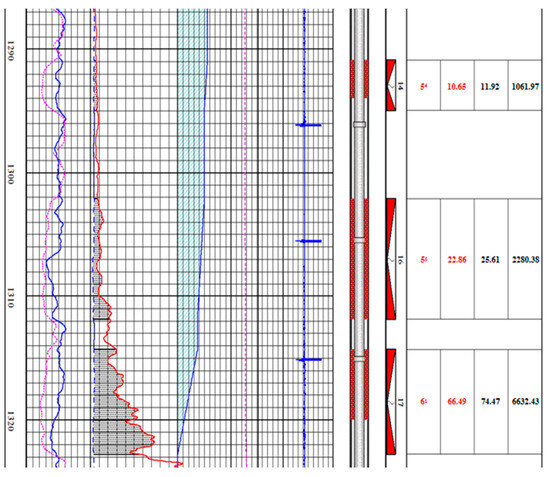
Figure 6.
Interpretation results of the water absorption profile of well GO7-23-3366.
7. Conclusions
In response to the problems such as intensified reservoir heterogeneity, imbalance between injection and production, and low exploitation efficiency that occurred during the long-term water injection development process in Block M of Gudong Oilfield, this paper systematically analyzed the dynamic changes in formation residual oil and pressure field in different development stages through a combination of numerical simulation and field tests. Based on the simulation results, the profile control and flooding control technology plans were designed and optimized accordingly. The main conclusions are as follows:
- The system reveals the dynamic variation laws of the residual oil saturation and pressure field in the strata, and clarifies the significant correlation between the pressure change amplitude and the change in oil saturation. After a period of exploitation, different degrees of pressure drop and reduction in saturation will occur in each layer. In the horizons with a relatively large pressure change amplitude, the change in oil saturation is also more obvious. Among them, the central and northern parts of the study block are the key profile control areas.
- A model was established according to the actual geological conditions of Block M. With the aim of cost-effective profile control, the optimal profile control plan was selected by using different types of profile control agents. The results of field application show that after the implementation of the profile control measures, the daily oil increment of the well group is remarkable. During the test period, the cumulative oil increment has reached 100 tons, and the total expected oil increment can reach 190 tons. The input–output ratio is as high as 1:2.1, meeting the expected goals.
- The methods and achievements of this study provide important technical references and support for the efficient and long-term development of similar highly water-cut and heterogeneous complex oil reservoirs, and have important guiding significance for the subsequent adjustment, potential tapping, stable production and efficiency improvement of oilfields. In future work, based on the existing numerical simulation and field tests, data fusion technology can be used to integrate geological, engineering and production data. By applying methods such as decision trees and cluster analysis, more intelligent and automated profile control and water shutoff technology solutions can be explored, thereby enhancing the development efficiency and economic benefits of high water cut and strongly heterogeneous reservoirs. At the same time, by integrating geological, engineering and production data, more intelligent and automated profile control and water shutoff schemes can be explored, thereby enhancing the development efficiency and economic benefits of high water cut and heterogeneous reservoirs.
Author Contributions
Writing—original draft, H.X.; writing—review and editing, H.J.; conceptualization, Y.H.; methodology, W.L.; validation, Y.H. and W.L.; formal analysis, R.Y.; investigation, R.C.; visualization, C.Y.; supervision, H.J.; project administration, H.J.; funding acquisition, H.J. All authors have read and agreed to the published version of the manuscript.
Funding
This research was funded by the National Natural Science Foundation of China (No: 52274028) & Open Fund of Hubei Key Laboratory of Oil and Gas Drilling and Production Engineering (Yangtze University) (NO. YQZC202401).
Data Availability Statement
The original contributions presented in this study are included in the article. Further inquiries can be directed to the corresponding authors.
Acknowledgments
We thank China University of Petroleum (Beijing) for the support of the project experimental equipment. Thank Gudong Oil Production Plant, Shengli Oilfield for supporting the experimental materials of the project.
Conflicts of Interest
Authors Yuanyuan He, Wanting Li, Ruiyi Yang, Rong Chen and Chenggao Yi were employed by Research Institute of Petroleum Exploration and Development, PetroChina. The remaining authors declare that the research was conducted in the absence of any commercial or financial relationships that could be construed as a potential conflict of interest.
References
- Hamdoon, A.; Mohammed, M.A.A.; Elraies, K.A. A review of Chan plot application and recent advanced models for diagnosing excessive water production. Rud.-Geološko-Naft. Zb. 2024, 39, 149–163. [Google Scholar]
- Asuaje, M.; Rincón, N.; Ratkovich, N.; Pinilla, A.; Nieto, R. Water Inflow Controller Devices as a Solution for Production for Mature Oil Fields: A Literature Review. Processes 2025, 13, 144. [Google Scholar] [CrossRef]
- Li, X.; Jiang, X.; Hopman, H. A review on predicting critical collapse pressure of flexible risers for ultra-deep oil and gas production. Appl. Ocean. Res. 2018, 80, 1–10. [Google Scholar]
- Wang, J.; Zhou, H.; Sun, Q.; Lin, H.; Yang, L.; Ao, L. The Characteristics of Water Cut Rise in Oil Wells of Narrow Banded Reservoirs and Their Influencing Factors. Xinjiang Oil & Gas. 2022, 18, 77–81. [Google Scholar]
- Liu, Z.; Liu, T.; Hao, J.; Sun, B.; Wang, J.; Wei, D.; Zhou, P. Analysis of the main controlling factors for water production and prediction of water-gas ratio using logging data in the He 8 aquifer reservoir in the Qingshimao area, Ordos Basin. Nat. Gas Geosci. 2025, 36, 761–772. [Google Scholar]
- Liu, Y. Current situation and prospect of key exploitation technologies for water control and oil stabilization in water-driven oilfields in Bohai during high water-cut stage. China Offshore Oil Gas 2025, 37, 177–186. [Google Scholar]
- Li, Y.; Li, Y.; Peng, Y.; Yu, Y. Water shutoff and profile control in China over 60 years. Oil Drill. Prod. Technol. 2019, 41, 773–787. [Google Scholar]
- Zheng, M. Collection of Papers on Water Shutoff and Profile Control Technology in Low Permeability Oil-Field; Petroleum Industry Press: Beijing, China, 2018. [Google Scholar]
- Chen, C.; Wang, H.; Liu, Q. Influence of a Crosslinked Polymer Profile-Control Agent on Oil Reservoir Permeability. Chem. Technol. Fuels Oils 2017, 53, 135–139. [Google Scholar] [CrossRef]
- Cao, W.; Xie, K.; Lu, X.; Liu, Y.; Zhang, Y. Effect of profile-control oil-displacement agent on increasing oil recovery and its mechanism. Fuel 2019, 237, 1151–1160. [Google Scholar]
- Zhou, Z.; Zhao, J.; Zhou, T.; Huang, Y. Study on in-depth profile control system of low-permeability reservoir in block H of Daqing oil field. J. Pet. Sci. Eng. 2017, 157, 1192–1196. [Google Scholar]
- Zhang, S.; Lv, Q.; Wang, J.; Liu, L.; Yu, C.; Ji, Y.; Wu, Y.; Hu, H.; Tao, D.; Zhang, M.; et al. Research and practice on deep development technology through flow field regulation in reservoirs with medium-high permeability and high water cut in Shengli Oilfield. Pet. Geol. Recovery Effic. 2025, 32, 88–101. [Google Scholar]
- Li, Z.; Guo, C.; Wang, J.; Huang, Y.; Yan, P.; Chen, L. New understanding of remaining oil distribution in oil reservoirs at extra-high water-cut stage:a case of Upper Ng3 sand group in Zhongyi area, Gudao Oilfield. Pet. Geol. Recovery Effic. 2019, 26, 19–26. [Google Scholar]
- Wu, Y.; Chen, W.; Hu, M.; Dai, C.; Zhao, M.; He, L. Application of dispersed particle gel to inhibit surfactant adsorption on sand. J. Surfactants Deterg. 2017, 20, 863–871. [Google Scholar] [CrossRef]
- Wang, L.; Long, Y.; Ding, H.; Geng, J.; Bai, B. Mechanically robust re-crosslinkable polymeric hydrogels for water management of void space conduits containing reservoirs. Chem. Eng. J. 2017, 317, 952–960. [Google Scholar] [CrossRef]
- Zhang, C.; Zhang, Y.; Rao, D.; Chen, Y.; Lu, X.; Lv, F. Synthesis and performance evaluation of a novel selective water-plugging agent. Mod. Chem. Ind. 2023, 43 (Suppl. S1), 200–204. [Google Scholar]
- Tang, H.; Chen, P.; Xu, G. Research and application of chemical water plugging technology in horizontal wells across different reservoir types in Jiangsu Oilfield. Complex Hydrocarb. Reserv. 2025, 18, 250–256. [Google Scholar]
- Li, Y.; Zhao, Q.; Lyu, Q.; Xue, Z.; Cao, X.; Liu, Z. Evaluation technology and practice of continental shale oil development in China. Pet. Explor. Dev. 2022, 49, 1098–1109. [Google Scholar] [CrossRef]
- Guo, Y.; Zhao, L.; Lv, P.; Tian, W.; Gao, W.; Li, D. Study on the policy boundary of rational development in high water cut period of medium and low permeability conglomerate reservoir. IOP Conf. Ser. Earth Environ. Sci. 2018, 208, 012090. [Google Scholar]
- Kuzina, M.A.; Kartsev, D.D.; Stratonovich, A.V.; Levkin, P.A. Organogels versus Hydrogels: Advantages, Challenges, and Applications. Adv. Funct. Mater. 2023, 33, 2301421. [Google Scholar] [CrossRef]
- Eelkema, R.; Pich, A. Pros and Cons: Supramolecular or Macromolecular: What Is Best for Functional Hydrogels with Advanced Properties? Adv. Mater. 2020, 32, 1906012. [Google Scholar] [CrossRef]
- Tongwa, P.; Baojun, B. A more superior preformed particle gel with potential application for conformance control in mature oilfields. J. Pet. Explor. Prod. Technol. 2014, 5, 201–210. [Google Scholar] [CrossRef]
- Liu, H.; Zhou, M.; Wu, J.; Lu, H.; Zheng, J.; Peng, T. Performance evaluation and application of modified urea–formaldehyde resin water shutoff agent. J. Pet. Explor. Prod. Technol. 2017, 7, 155–160. [Google Scholar] [CrossRef]
- Gazem, A.; Krishna, S. Synergistic enhancement of oil recovery: Integrating anionic-nonionic surfactant mixturesSi02 nanoparticles, and polymer solutions for optimized crude oil extraction. Petroleum 2025, 11, 102–112. [Google Scholar] [CrossRef]
- Mandal, M.; Kumar, R.P.; Ojha, K. Impact assessment of polymer, cross-linker, and nanoparticles on gelation kinetics and properties of silica nanocomposite hydrogel for water shut-off treatment in harsh reservoir conditions. J. Mol. Liq. 2024, 411, 125746. [Google Scholar] [CrossRef]
- Ilavya, A.; Rathwa, P.; Paine, S.; Makwana, M.; Bera, A. Gelation studies of nanographene oxide-augmented nanocomposite polymer gel systems for water shutoff technique in oil reservoirs. J. Mol. Liq. 2025, 421, 126928. [Google Scholar] [CrossRef]
- Xu, H.; Jiang, H.; Wang, J.; Zhao, K.; Zhang, L. Research on the Adaptability of Deep Profile Control and Drive with Polymer Microspheres in Low-Permeability Oil Reservoirs. J. Yan’an Univ. 2024, 43, 54–58. [Google Scholar]
- Li, L.; Ali, A.M.; Zhao, Z.; Zhang, H. Temperature-sensitive and amphiphilic silica nanoparticle-stabilized Pickering emulsion for water shutoff. Colloids Surf. A Physicochem. Eng. Asp. 2023, 677, 132293. [Google Scholar] [CrossRef]
- Ding, R.; Zhang, S.; Zhang, L.; Lv, H.; Li, P.; Zhu, C. Influence of well pattern connectivity on profile control effect of ASP flooding. Pet. Geol. Eng. 2022, 36, 119–122+126. [Google Scholar]
- Song, Y.; Chen, L.; Zeng, H.; Lu, X.; Huang, F.; Zhang, Z. Study on Water Flooding Law of Fractured-Vuggy Reservoirs and Optimization of Profile Control Injection Parameters. Contemp. Chem. Ind. 2025, 54, 1175–1181. [Google Scholar]
- Wang, X.; Zhang, F.; Li, S.; Dou, L.; Liu, Y.; Ren, X.; Chen, D.; Zhao, W. The Architectural Surfaces Characteristics of Sandy Braided River Reservoirs, Case Study in Gudong Oil Field, China. Geofluids 2021, 2021, 8821711. [Google Scholar] [CrossRef]
- Xu, H.; Jiang, H.; Wang, J. Optimal Design of Polymer Gel Profile Control for Gaskule E31 Deep Reservoir. In Proceedings of the ASME 41st International Conference on Ocean, Offshore and Arctic Engineering, OMAE 2022, Hamburg, Germany, 5–10 June 2022; Volume 10, p. V010T11A019. [Google Scholar]
- Wang, S.; Feng, Q.; Song, Y. Preferential flow path classification method based on injection profile data-taking Gudong oilfield as an example. Pet. Geol. Recovery Effic. 2013, 20, 99–102+118. [Google Scholar]
- Xu, H.; Jiang, H.; Wang, J. Research on the Evaluation and Optimization Design Technology of Profile Control Potential in Block M of Gudong Oilfield. In Proceedings of the 2022 International Conference on Oil and Gas Field Exploration and Development (2022 IFEDC), Urumqi, China, 16–18 August 2022. [Google Scholar]
- Yuan, F.; Yu, Q.; Chen, X.; Guo, S.; Zhao, F.; Xu, H.; Li, F. Progress in enhanced oil recovery technologies through chemical flooding in high-temperature and high-salinity reservoirs in Shengli Oilfield. Pet. Geol. Recovery Effic. 2024, 31, 199–208. [Google Scholar]
- Li, Q. Reservoir Science: A Multi-Coupling Communication Platform to Promote Energy Transformation, Climate Change and Environmental Protection. Reserv. Sci. 2025, 1, 1–2. [Google Scholar]
- Li, Q.; Wu, J.; Li, Q.; Wang, F.; Cheng, Y. Sediment Instability Caused by Gas Production from Hydrate-Bearing Sediment in Northern South China Sea by Horizontal Wellbore: Sensitivity Analysis. Nat. Resour. Res. 2025, 34, 1667–1699. [Google Scholar] [CrossRef]


Disclaimer/Publisher’s Note: The statements, opinions and data contained in all publications are solely those of the individual author(s) and contributor(s) and not of MDPI and/or the editor(s). MDPI and/or the editor(s) disclaim responsibility for any injury to people or property resulting from any ideas, methods, instructions or products referred to in the content. |
© 2025 by the authors. Licensee MDPI, Basel, Switzerland. This article is an open access article distributed under the terms and conditions of the Creative Commons Attribution (CC BY) license (https://creativecommons.org/licenses/by/4.0/).