Article

Microscopic Mechanism of Moisture Affecting Methane Adsorption and Desorption in Coal by Low-Field NMR Relaxation

1
Department of Mining Engineering, Shanxi Institute of Energy, Jinzhong 030600, China
2
College of Mining Engineering, Taiyuan University of Technology, Taiyuan 030024, China
*
Author to whom correspondence should be addressed.
Processes 2025, 13(10), 3113; https://doi.org/10.3390/pr13103113
Submission received: 28 August 2025 / Revised: 22 September 2025 / Accepted: 27 September 2025 / Published: 28 September 2025

Abstract

Moisture in coal seams significantly impacts methane adsorption/desorption, yet its microscopic mechanism in intact coal remains poorly characterized due to methodological limitations. This study introduces a novel approach that integrates low-field nuclear magnetic resonance (LF-NMR) with volumetric analysis to quantify, in real-time, the effect of moisture on methane dynamics in intact coal samples. The results quantitatively demonstrate that micropores (relative specific surface area > 700 m2/cm3) are the primary adsorption sites, accounting for over 95% of the stored gas. Moisture drastically reduces the adsorption capacity (by ~72% at 0.29 MPa and ~57% at 1.83 MPa) and inhibits the desorption process, evidenced by a strong linear decrease in desorption ratio (DR) (R2 = 0.906) and a sharp exponential drop in the initial desorption rate (R2 = 0.999) with increasing moisture content. The findings provide a mechanistic understanding that is crucial for optimizing coalbed methane (CBM) recovery and enhancing strategies for outburst prevention and methane emission mitigation. The results reveal distinct adsorption and desorption features of intact coal compared with coal powder, which can be useful in total methane utilization and mining safety enhancement.

Graphical Abstract

1. Introduction

Moisture is widely present in coal seams at different concentrations, and it has been found to affect the methane adsorption and desorption capacities of coal by many researchers [1,2,3,4]. Methane is a greenhouse gas and high-quality fossil fuel and often poses a threat to the safety of underground mining. Therefore, the impact of water on coalbed methane (CBM) production [5], coal and gas outburst prevention [6], and coal mine methane (CMM) emissions should be investigated. This paper aims to propose a new, real-time method of determining the moisture effect on methane adsorption and desorption based on commonly used experimental equipment and new instruments.
Studies regarding methane adsorption and desorption in water-containing coal are common [7,8], and in most of these studies, experiments were conducted under different equilibrium pressures and water contents. However, these studies mainly focused on coal powder and briquettes, and raw coal samples have rarely been studied. In addition, considering the limitations of adsorption and desorption instruments, the studies are limited to the adsorption concentration and desorption volume. Miao et al. proved that a certain moisture threshold exists for coal powder, and the adsorption amount will remain stable with a moisture content above this value [4]. However, processing pulverized coal means destroying the coal macrostructure. The correlation between the internal structure of intact coal and gas adsorption/desorption is often neglected. Therefore, it is necessary to further examine suitable experimental methods and research topics.
Many researchers have implemented traditional instruments to acquire the inner coal structure. Low-temperature nitrogen adsorption and desorption tests and mercury injection methods are quite common [9,10,11]. The specific surface area (SSA), pore diameter, and volume can be characterized by these methods. Low-field nuclear magnetic resonance (LF-NMR) technology is superior because it is a noncontact, nondestructive, and quantitative approach. It has been adopted for borehole logging for a long time in the petroleum industry [12]. LF-NMR works well in analyzing hydrogen-containing fluids in porous media, especially in rocks and coals [13]. Inner structure properties, such as the pore distribution, can also be acquired.
In this research, low-temperature nitrogen adsorption and desorption measurements are conducted to characterize the physical properties of coal. During methane adsorption and desorption tests with a 3H-2000PHD gas adsorption analyzer, LF-NMR tests are conducted to analyze the fluid distribution and migration. This study is mainly innovative in the following three aspects:
1.
The adsorption and desorption results acquired by LF-NMR and gas adsorption analysis can be mutually verified. LF-NMR can achieve a more accurate quantification of methane in coal compared with the 3H-2000PHD analyzer using the volumetric method and is nondestructive, fast, and accurate.
2.
Many existing studies mainly involve experiments on coal powder or briquettes. Although micropores are barely affected, macrostructure destruction results in deviation from the actual situation. Therefore, samples are from raw coal and are not pulverized in this work.
3.
Analyzing gas adsorption and desorption in moist coal samples with LF-NMR technology has not been conducted in other studies before, and this kind of sampling and method is in line with the on-site conditions. In addition to the desorption rate and quantity, the methane distribution variation in coal during desorption can be determined, contributing to revealing the moisture mechanism from the microscopic perspective.

2. Materials and Methods

2.1. Sample Preparation

Coal was collected from the No. 3 coal seam of the Lower Permian series in the Sihe colliery, Qinshui Basin, Jincheng City, Shanxi Province of China. Figure 1 shows the sampling location and preparation process of the samples. Proximate analysis of the coal and measurement of the apparent density, isothermal adsorption of methane, and vitrinite reflectance followed Chinese National Standards GB/T 212-2008 [14], GB/T 19560-2008 [15], and GB/T 8899-2013 [16], respectively. The physical parameters of the coal in this study are listed in Table 1.
Samples with close physical properties were selected to minimize the error. They are cylindrical, with a diameter and height of 50 mm. The mass of the samples was measured using an electronic balance (b) after 12 h in an electrothermal drying oven (a). Samples were placed in a vacuum saturation device (c) for wetting. Then, they were sealed and kept in a thermostat for preservation. The water contents of samples 4, 5, and 6 are 0.65%, 1.02%, and 1.92%, respectively. Powdered samples A and B from the same raw coal are prepared by a polisher.

2.2. Experimental Setup

The instruments used in this work comprise the following:
  • ASAP 2460 surface area system from Micromeritics Instrument Corporation, Shanghai, China, and
  • MacroMR12-150H-I LF-NMR system from Niumag Corporation, Suzhou City of China, and
  • 3H-2000PHD automatic high-pressure adsorption and desorption analyzer from Beishide Instrument Corporation in Beijing, China.
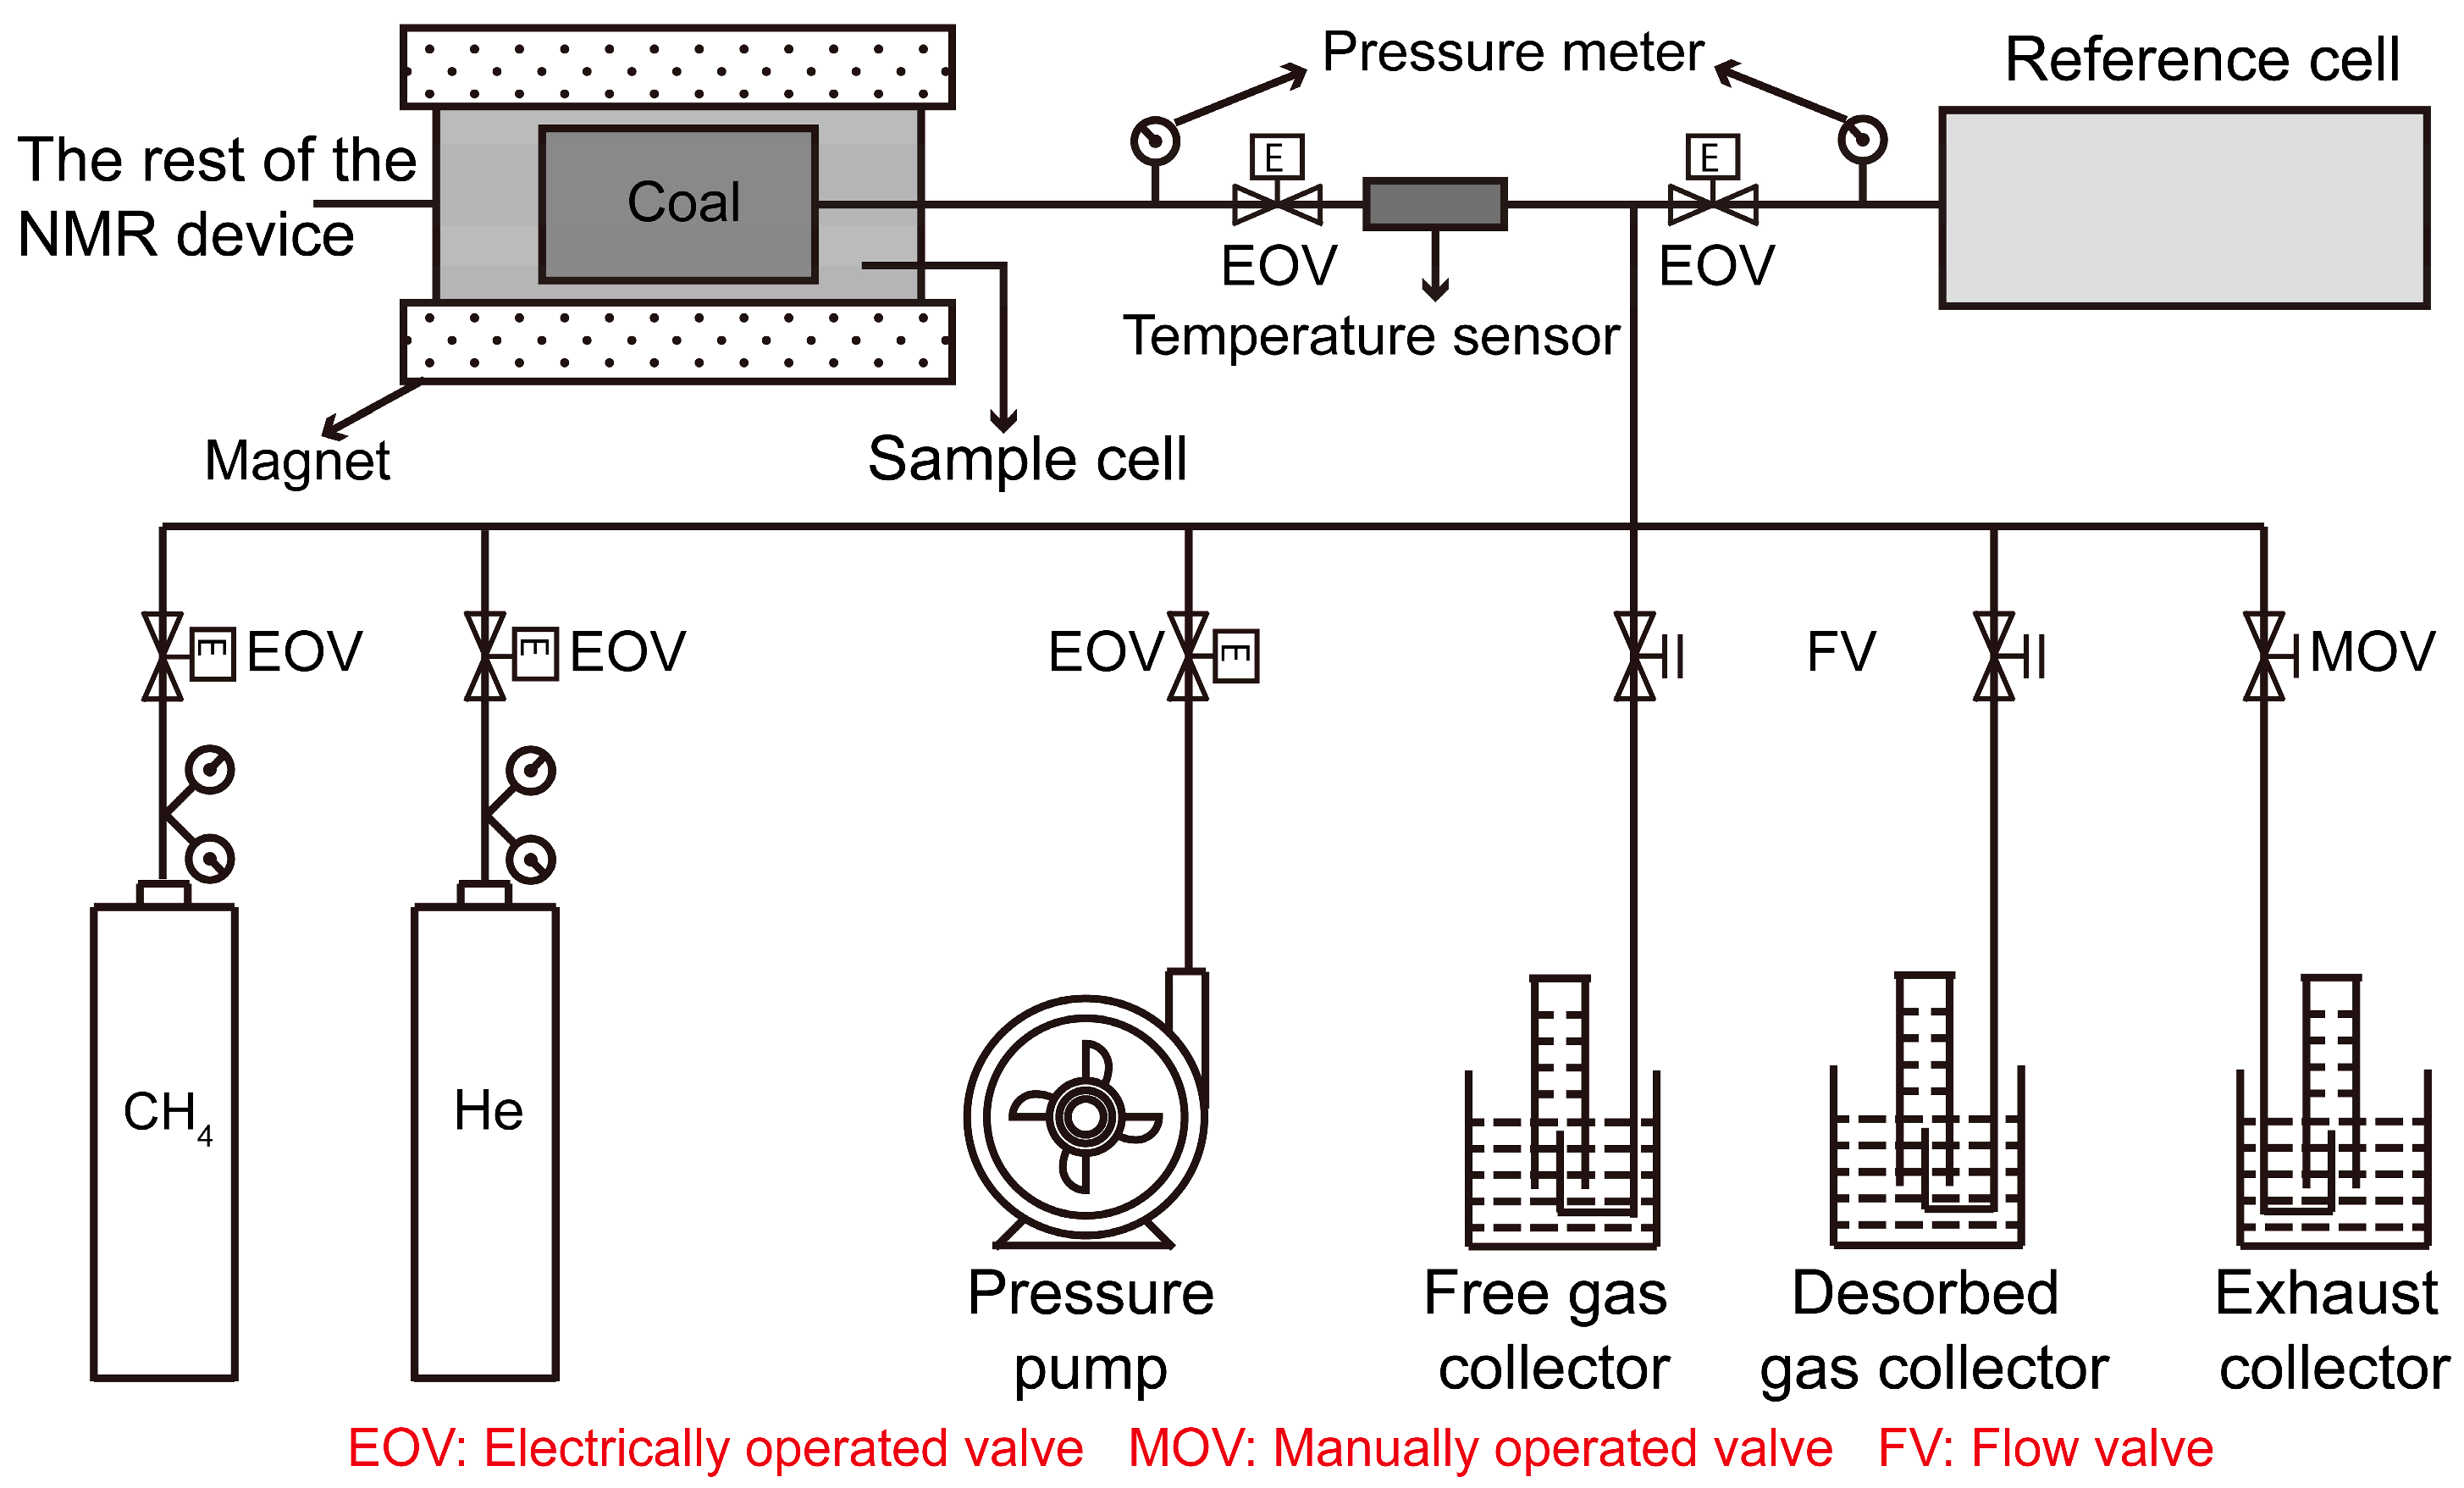
Figure 2 displays a schematic of the experimental system, which consists of the LF-NMR system and 3H-2000PHD analyzer. The basic parameters of the LF-NMR apparatus are as follows: resonance frequency of 21 MHz, magnetic strength of 0.3 T, and coil diameter of 60 mm. The Carr–Purcell–Meiboom–Gill (CPMG) sequence is selected to acquire the transverse relaxation time (T2). The number of echoes is set at 18000 to acquire enough valid information with a high signal-to-noise ratio. The sampling time and echo spacing are 64 and 0.3 ms, respectively.
The 3H-2000PHD analyzer consists of three desorption collectors. The pump is used to pressurize and vacuumize the gas. Coal samples are placed in the sample cell, which is made of nonmetallic materials. Two pressure gauges are used for methane pressure measurement. The temperature of the sample cell is kept at 298.15 K. The analyzer is connected to a computer with built-in software that controls the valves and pumps for automatic operation.

2.3. Experimental Methods

  • Low-temperature nitrogen measurements were conducted twice to ensure consistency. Samples A and B are powdered samples from the same raw coal, with a mass of about 0.1 g and particle size less than 80 mesh.
  • The theoretical basis and steps of volumetric analysis have previously been discussed by many other researchers [17,18,19]. After the pressure tightness was tested, helium was used to assess the gas tightness and measure the reference and sample cell and void volumes. The experiment was then automatically conducted by the built-in program, and the amount of methane adsorption can be calculated under different equilibrium pressures. A flow meter was used to measure the desorption rate and amount. Desorption was considered to be terminated if the desorption amount was smaller than 1 mL within 10 min.
  • The T2 spectra before methane adsorption are the base signals. Sample 1 (dry) was used to acquire the linear relation between the LF-NMR and volumetric results. Samples 2 (dry) and 3 (water-saturated) were used for methane adsorption under pressures of 0.29, 0.62, 0.89, 1.22, 1.53, and 1.83 MPa. For samples 2 and 3, LF-NMR measurements were conducted before and during adsorption and after reaching adsorption equilibrium pressures of 0.29, 0.62, 0.89, 1.22, 1.53, and 1.83 MPa. For samples 2–6, the LF-NMR results were recorded at 1 and 60 min after desorption began.
Note that the LF-NMR method has high repeatability and wide applicability to coal rock samples, but there are also some limitations or precautions to be taken to ensure good results. 1. Avoid samples containing a large amount of paramagnetic substances that can cause rapid signal attenuation; 2. To ensure signal-to-noise ratio, the sample size and diameter generally do not exceed 3.8 cm. 3. During the experiment, pay attention to the consistency of environmental temperature and instrument parameters.

2.4. Basic Principle of LF-NMR

When hydrogen protons are exposed to a static magnetic field and a vertical oscillating magnetic field, the NMR phenomenon appears. Methane is a kind of hydrogen-containing fluid that can be detected by LF-NMR. Once the oscillating magnetic field is stopped, the signal will decay exponentially over time. Generally, the transverse relaxation time is used to describe the signal attenuation regularity. Transverse relaxation includes free, surface, and diffuse relaxation, which can be expressed as follows:
1 T 2 = 1 T 2 B + 1 T 2 S + 1 T 2 D ,
where subscripts B, S, and D indicate free, surface, and diffuse relaxation, respectively.
Free relaxation, small enough to be neglected when the viscosity is low, is determined by the physical properties of the fluid (e.g., chemical composition, viscosity). The viscosity of methane is 1.1067 × 10⁻⁶ Pa·s which is quite small, making the free relaxation negligible. The static magnetic field makes the effect of diffuse relaxation ignorable. And because of nanoscale pores, surface relaxation plays a major role in relaxation, and Equation (1) thus becomes:
1 T 2 1 T 2 S = ρ   S V ,
where ρ is the relaxation rate of the surface, S is the pore surface area, and V is the pore volume.
Then, the coal inner structure is theoretically related to the T2 distribution, and the relaxation time is positively correlated with the pore size. The ordinate values are proportional to the amount of hydrogen protons and thus the mass of fluids (e.g., methane and water).

3. Results

3.1. Results Obtained with the ASAP 2460

3.1.1. Analysis of Low-Temperature Nitrogen Isotherms

In this research, pores are classified by their size: (a) pores with widths <10 nm are micropores, (b) pores with widths between 10 and 100 nm are transition pores, (c) pores with widths between 100 and 1000 nm are mesopores, and (d) pores with widths exceeding 1000 nm are macropores [20].
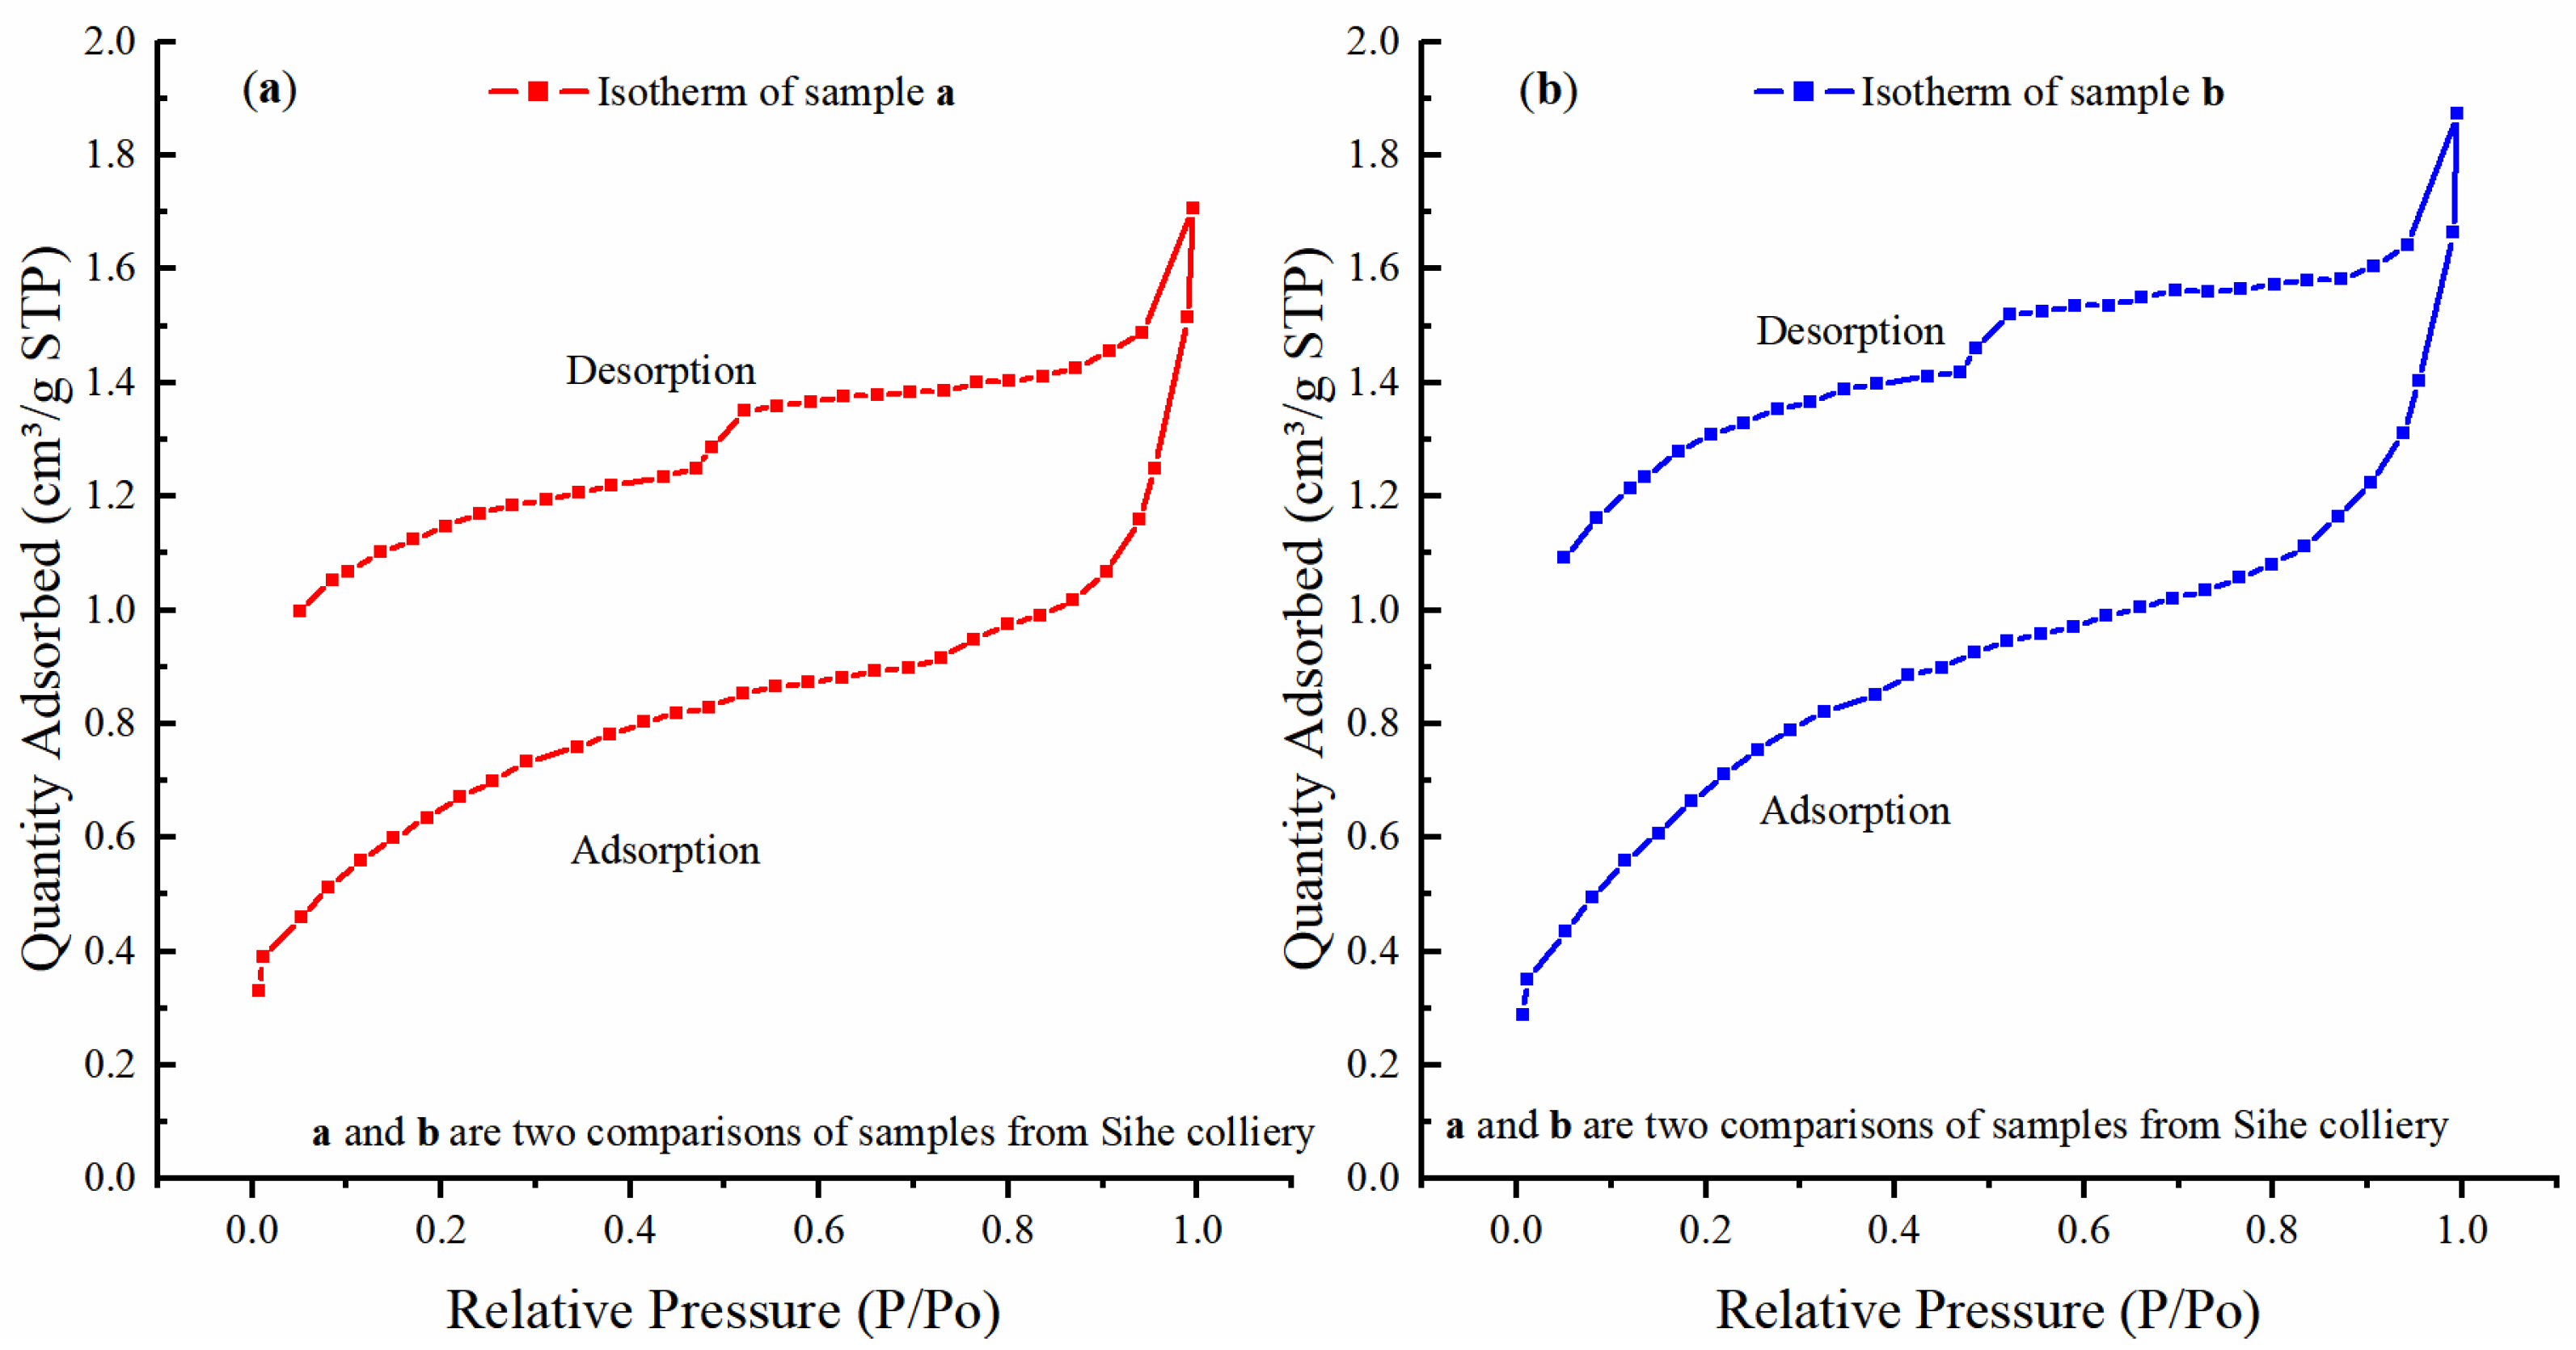
In the low-temperature nitrogen isotherms of Figure 3, hysteresis loops of the desorption curve can be observed, which may be caused by the ink bottle pore and complex pore network model. The loops indicate that there are a large number of open pores, suggesting good pore connectivity.
The desorption curve resembles types H3 and H4 hysteresis loops in the original International Union of Pure and Applied Chemistry (IUPAC) classification of 1985, indicating that the pores mainly exhibit plate-like patterns as well as other geometries. The sudden drops in the desorption branch located near a P/Po value of 0.55 suggest that the sample contains many ink bottle pores. The drastic reductions from P/Po ~0.9–1 indicate well-developed macropores and mesopores.
The steep increase in the adsorption branch at low P/Po values is due to micropore filling, showing a highly developed microporous system.

3.1.2. Analysis of the Pore Structure

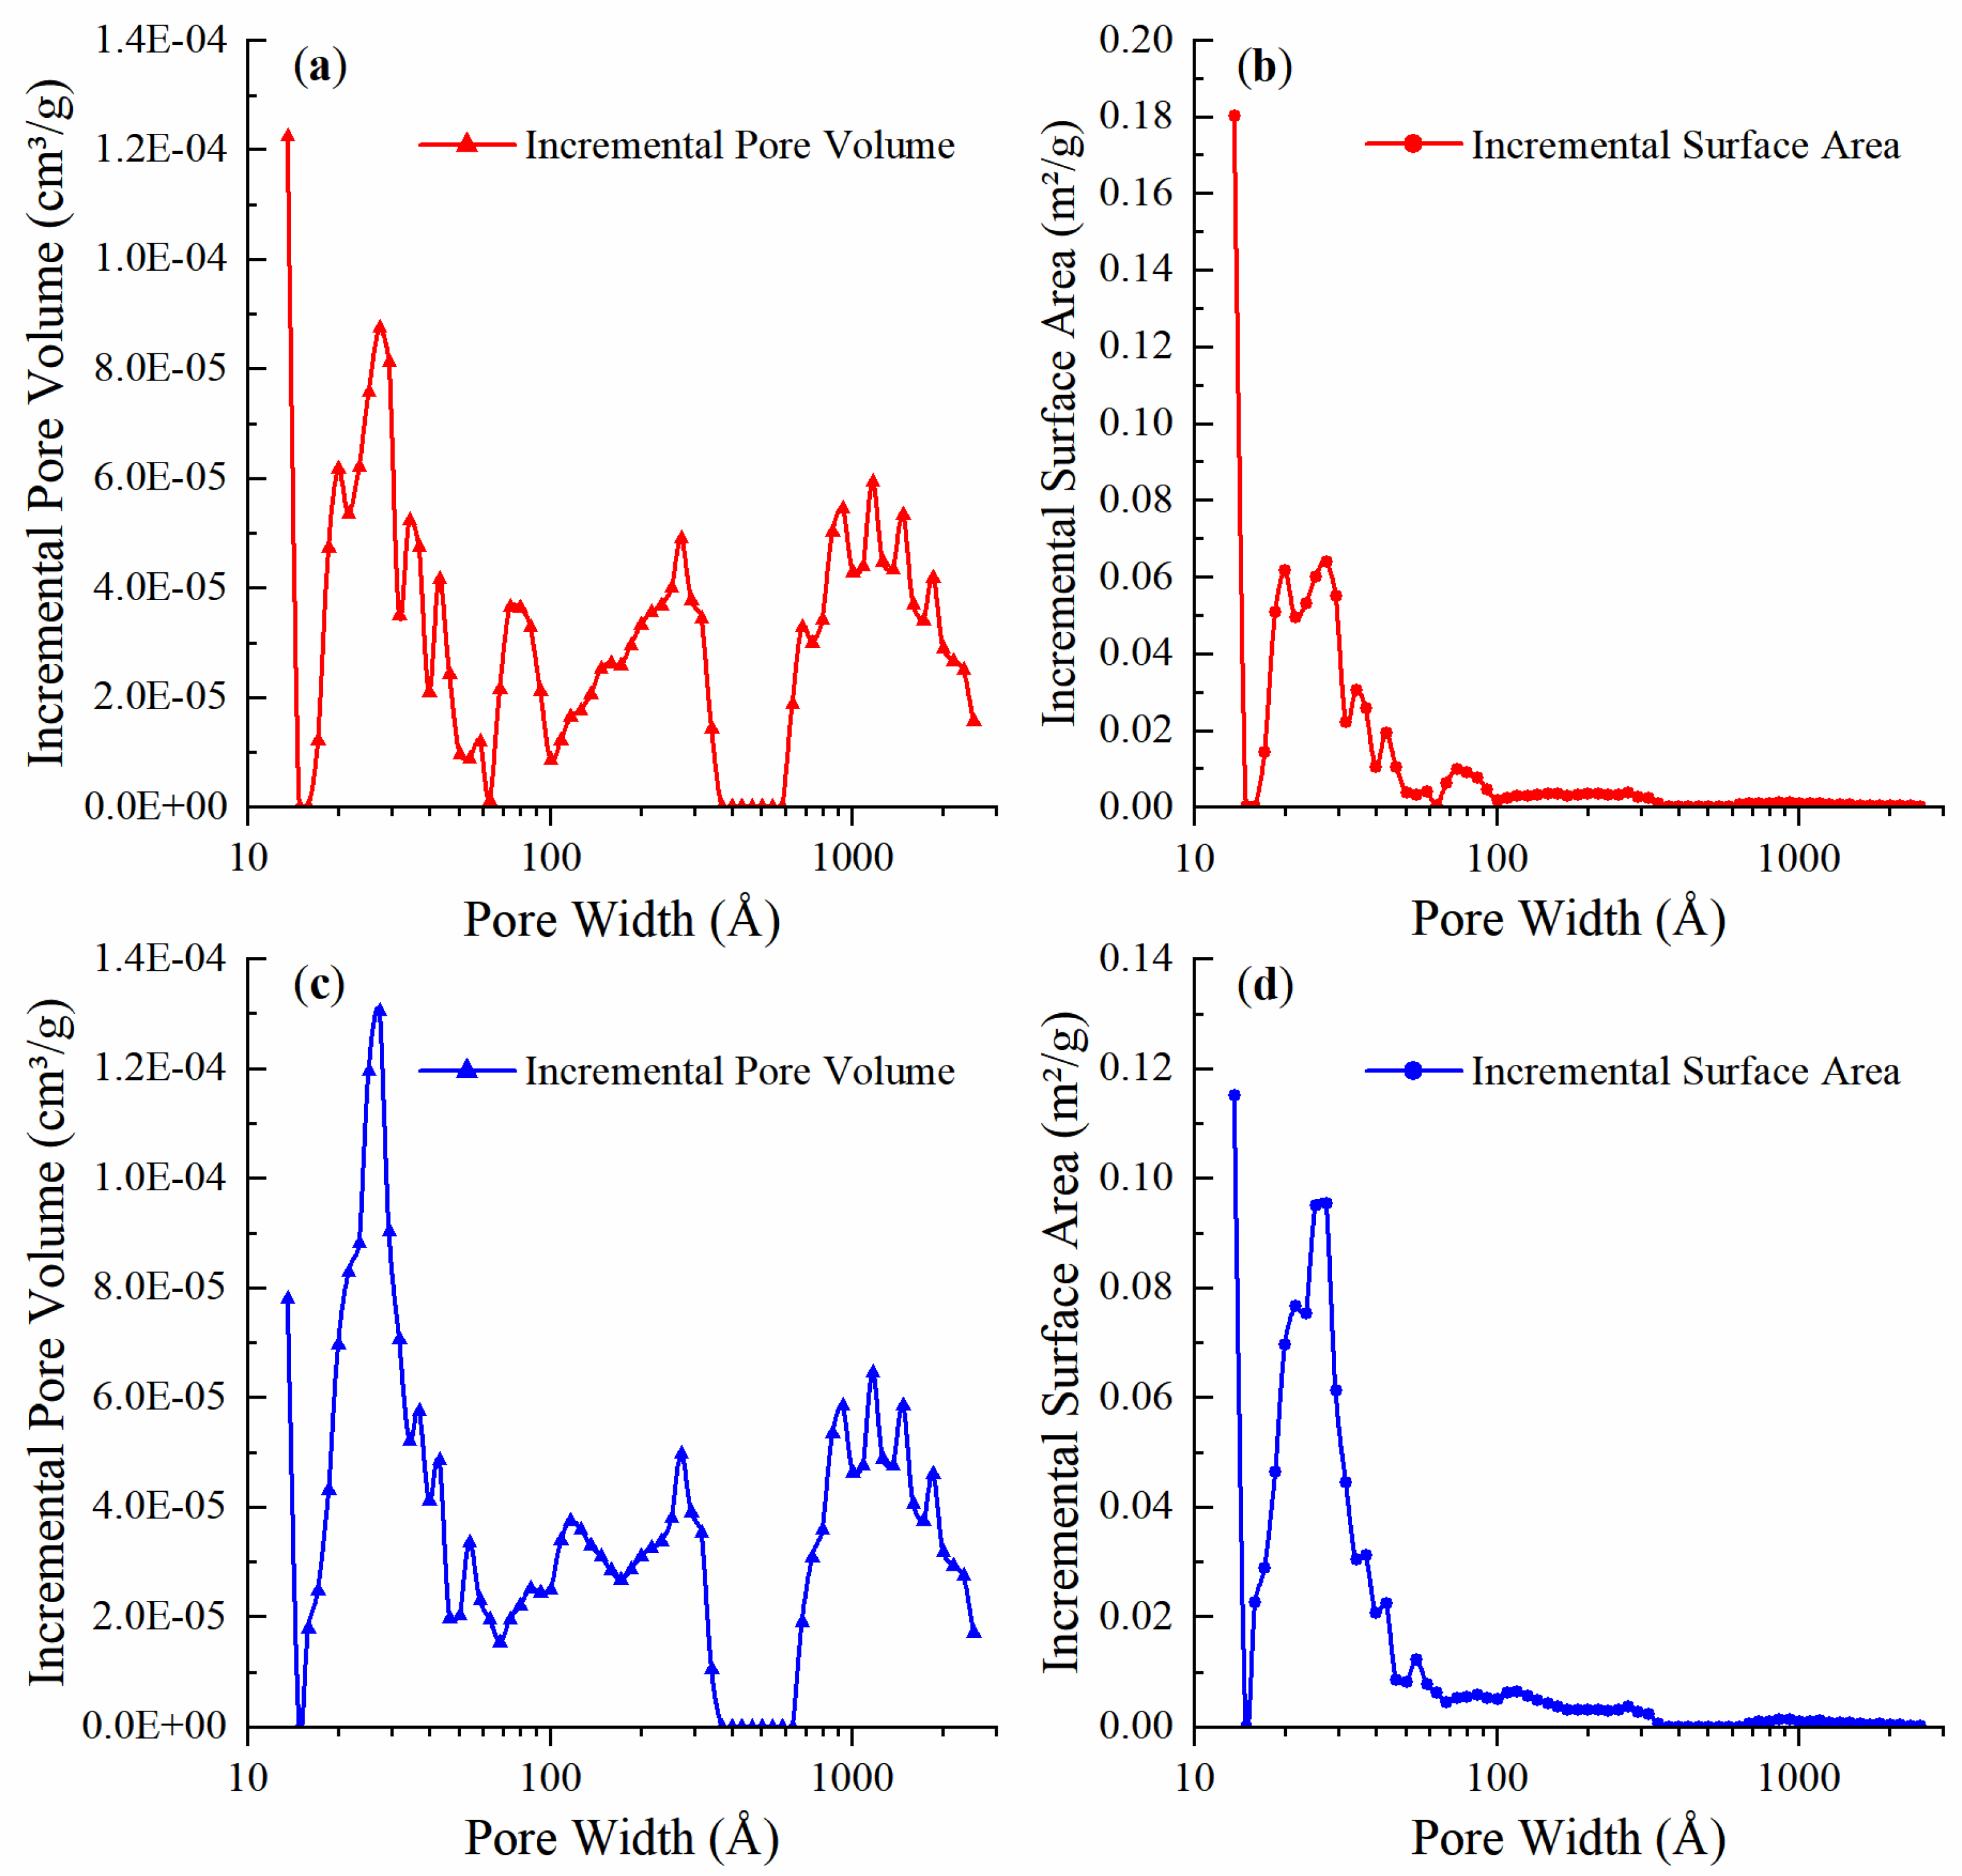
The results are shown in Figure 4 and Table 2. Figure 4 and Table 2 reveal that the SSA of micropores accounts for most of the total SSA, and transition pores and mesopores occupy more than 50% of the total pore volume with a small SSA. Considering that both SSA and pore volume only reflect some of the pore structure features, the relative specific surface area (RSSA) is proposed. The equation is as follows:
R S S A = S S A V ,
where V is the pore volume (cm3).
Its physical meaning is the SSA per unit pore volume, and its unit is m2/cm3. RSSA comprehensively reflects the complexity of pores at corresponding pore sizes by combining SSA and pore volume. The RSSA results in Table 2 demonstrate the unparalleled role of micropores in the internal structure of coal.
The RSSA values provide a quantitative metric to evaluate the adsorption potential of different pore classes. As presented in Table 2, the RSSA of micropores (diameter < 10 nm) for samples a and b are 755.66 and 728.85 m2/cm3, respectively. These values are an order of magnitude higher than those of transition pores (10–100 nm) and two orders of magnitude higher than mesopores (100–300 nm). This immense RSSA quantitatively confirms that micropores are the primary contributors to the coal’s specific surface area and are therefore the dominant sites for methane adsorption, offering vastly more surface area per unit volume than larger pores.
In summary, the results obtained with the ASAP 2460 indicate that the anthracite in this study has a high adsorption capacity, and the pore structure suggests a good permeability.

3.2. Relationship Between the Amplitude and Methane Quantity

Sample 1 was placed in the sample cell to conduct isothermal adsorption tests. After reaching different equilibrium pressures, the LF-NMR results were recorded. The methane content under standard conditions can be determined using Equation (4):
C v = p 1 v 1 z 1 m R T p 2 v 2 z 2 m R T 22.4 1000 ,
where z1 and z2 are compression factors, m is the mass of the coal samples, R is the ideal gas constant, which equals 8.3144 J/(mol·K), T is the thermodynamic temperature (K), v1 is the volume of the reference cell, v2 is the volume of the sample cell, and p1 and p2 are gas pressures.
The compression factor is equal to pv/nRT. Since the adsorbed gas is not an ideal gas, when the gas pressure changes from p1 to p2 at a constant temperature, the value of z will change. By combining the equation and calculation, the values of z1 and z2 can be obtained.
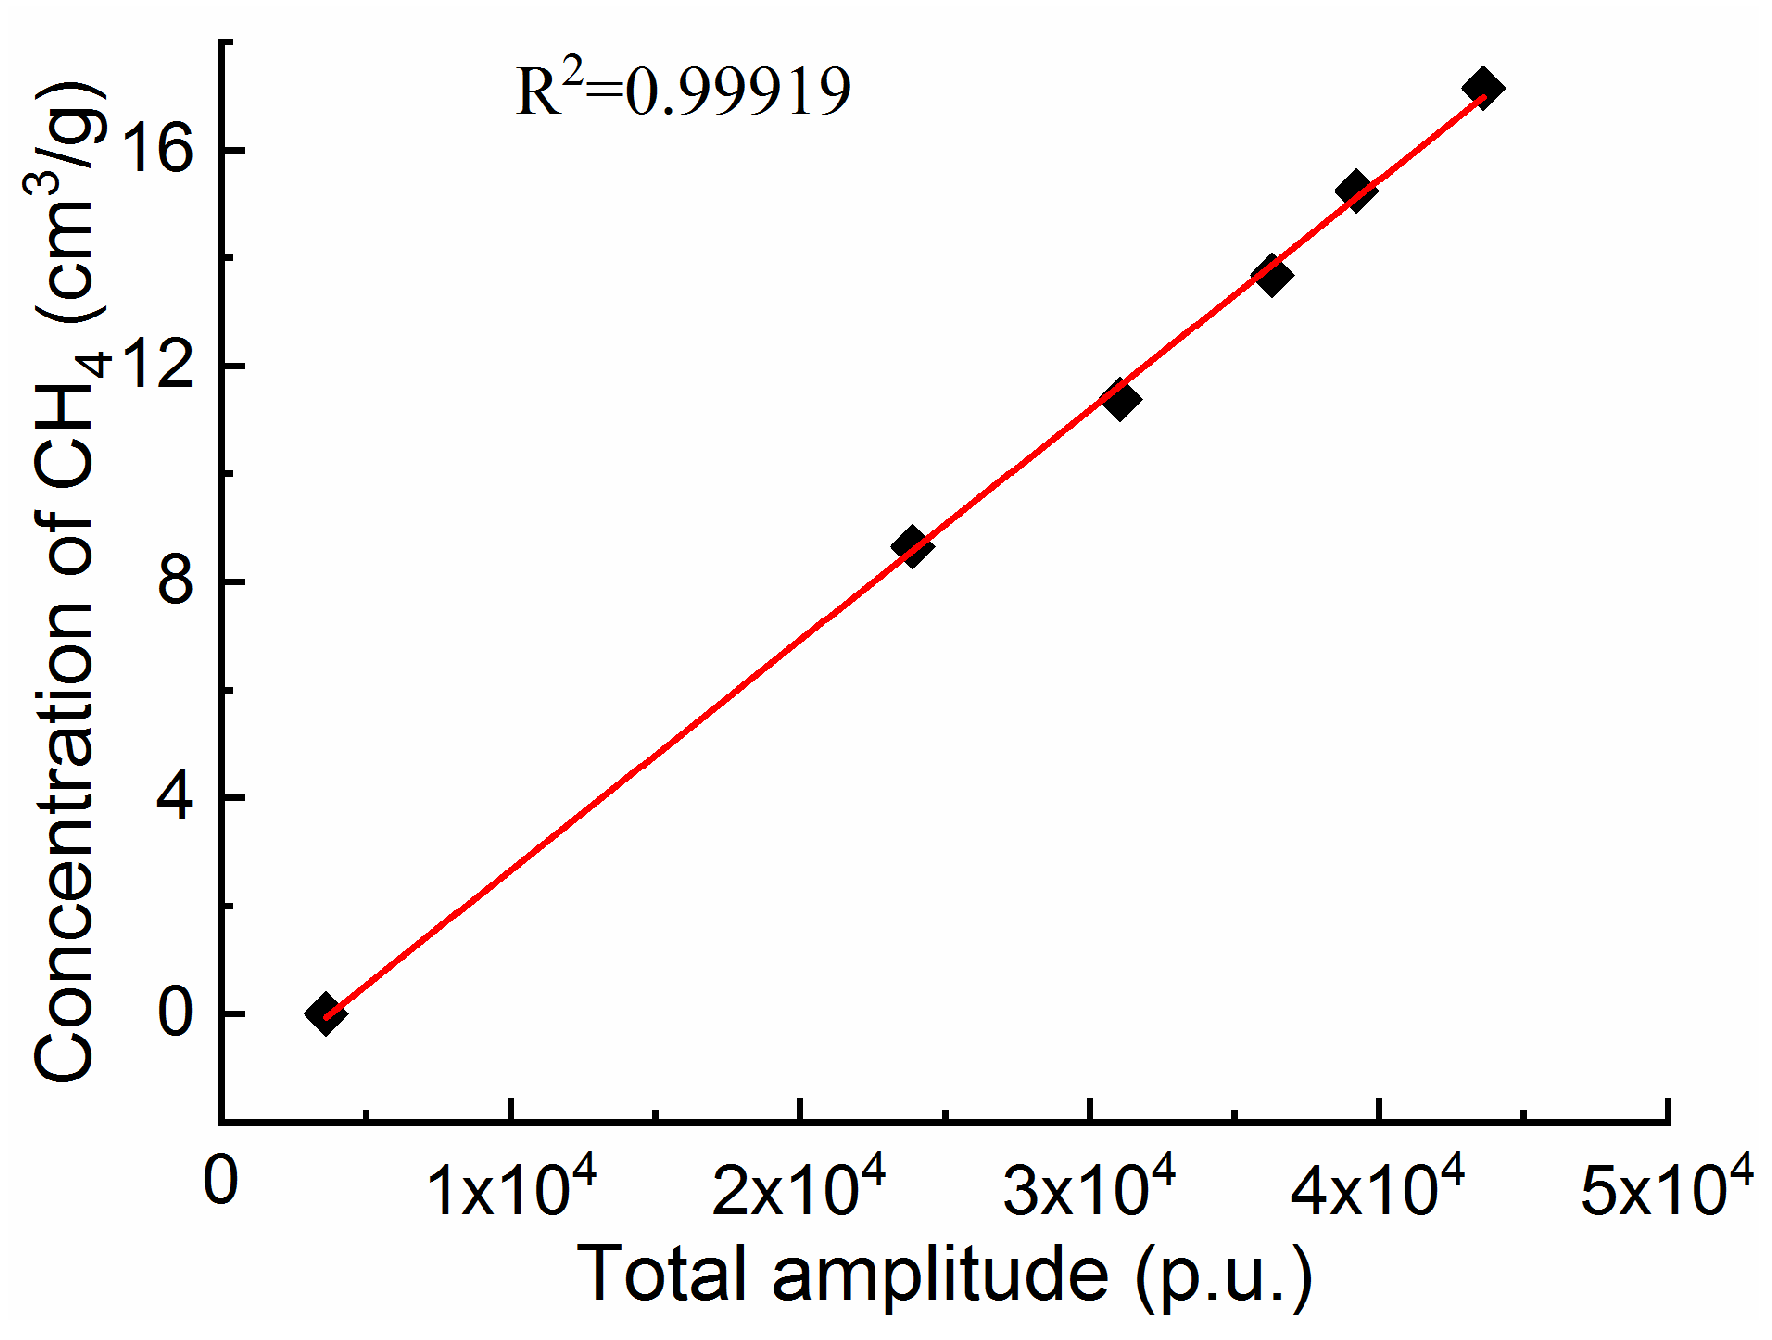
The adsorption test and linear fitting results are shown in Figure 5.
Figure 5 reveals a high degree of correlation between Cv and Ta, which also verifies the validity of the LF-NMR method. The equation is as follows:
C v = 4.258 × 1 0 4 T a 1.60046 ,
where Cv is the methane content and Ta is the sum of the amplitudes of each relaxation result.
Equation (5) is used to calculate the methane amount in coal in the following procedure.

3.3. Methane Adsorption for Dry and Water-Saturated Coals

Micropores are the main sites for gas adsorption [21]. Three states can be used to describe the occurrence of methane in coal: (a) dissolved methane in coal, (b) adsorbed methane in pores, (c) free methane in the relatively large pores and fractures [22,23,24].
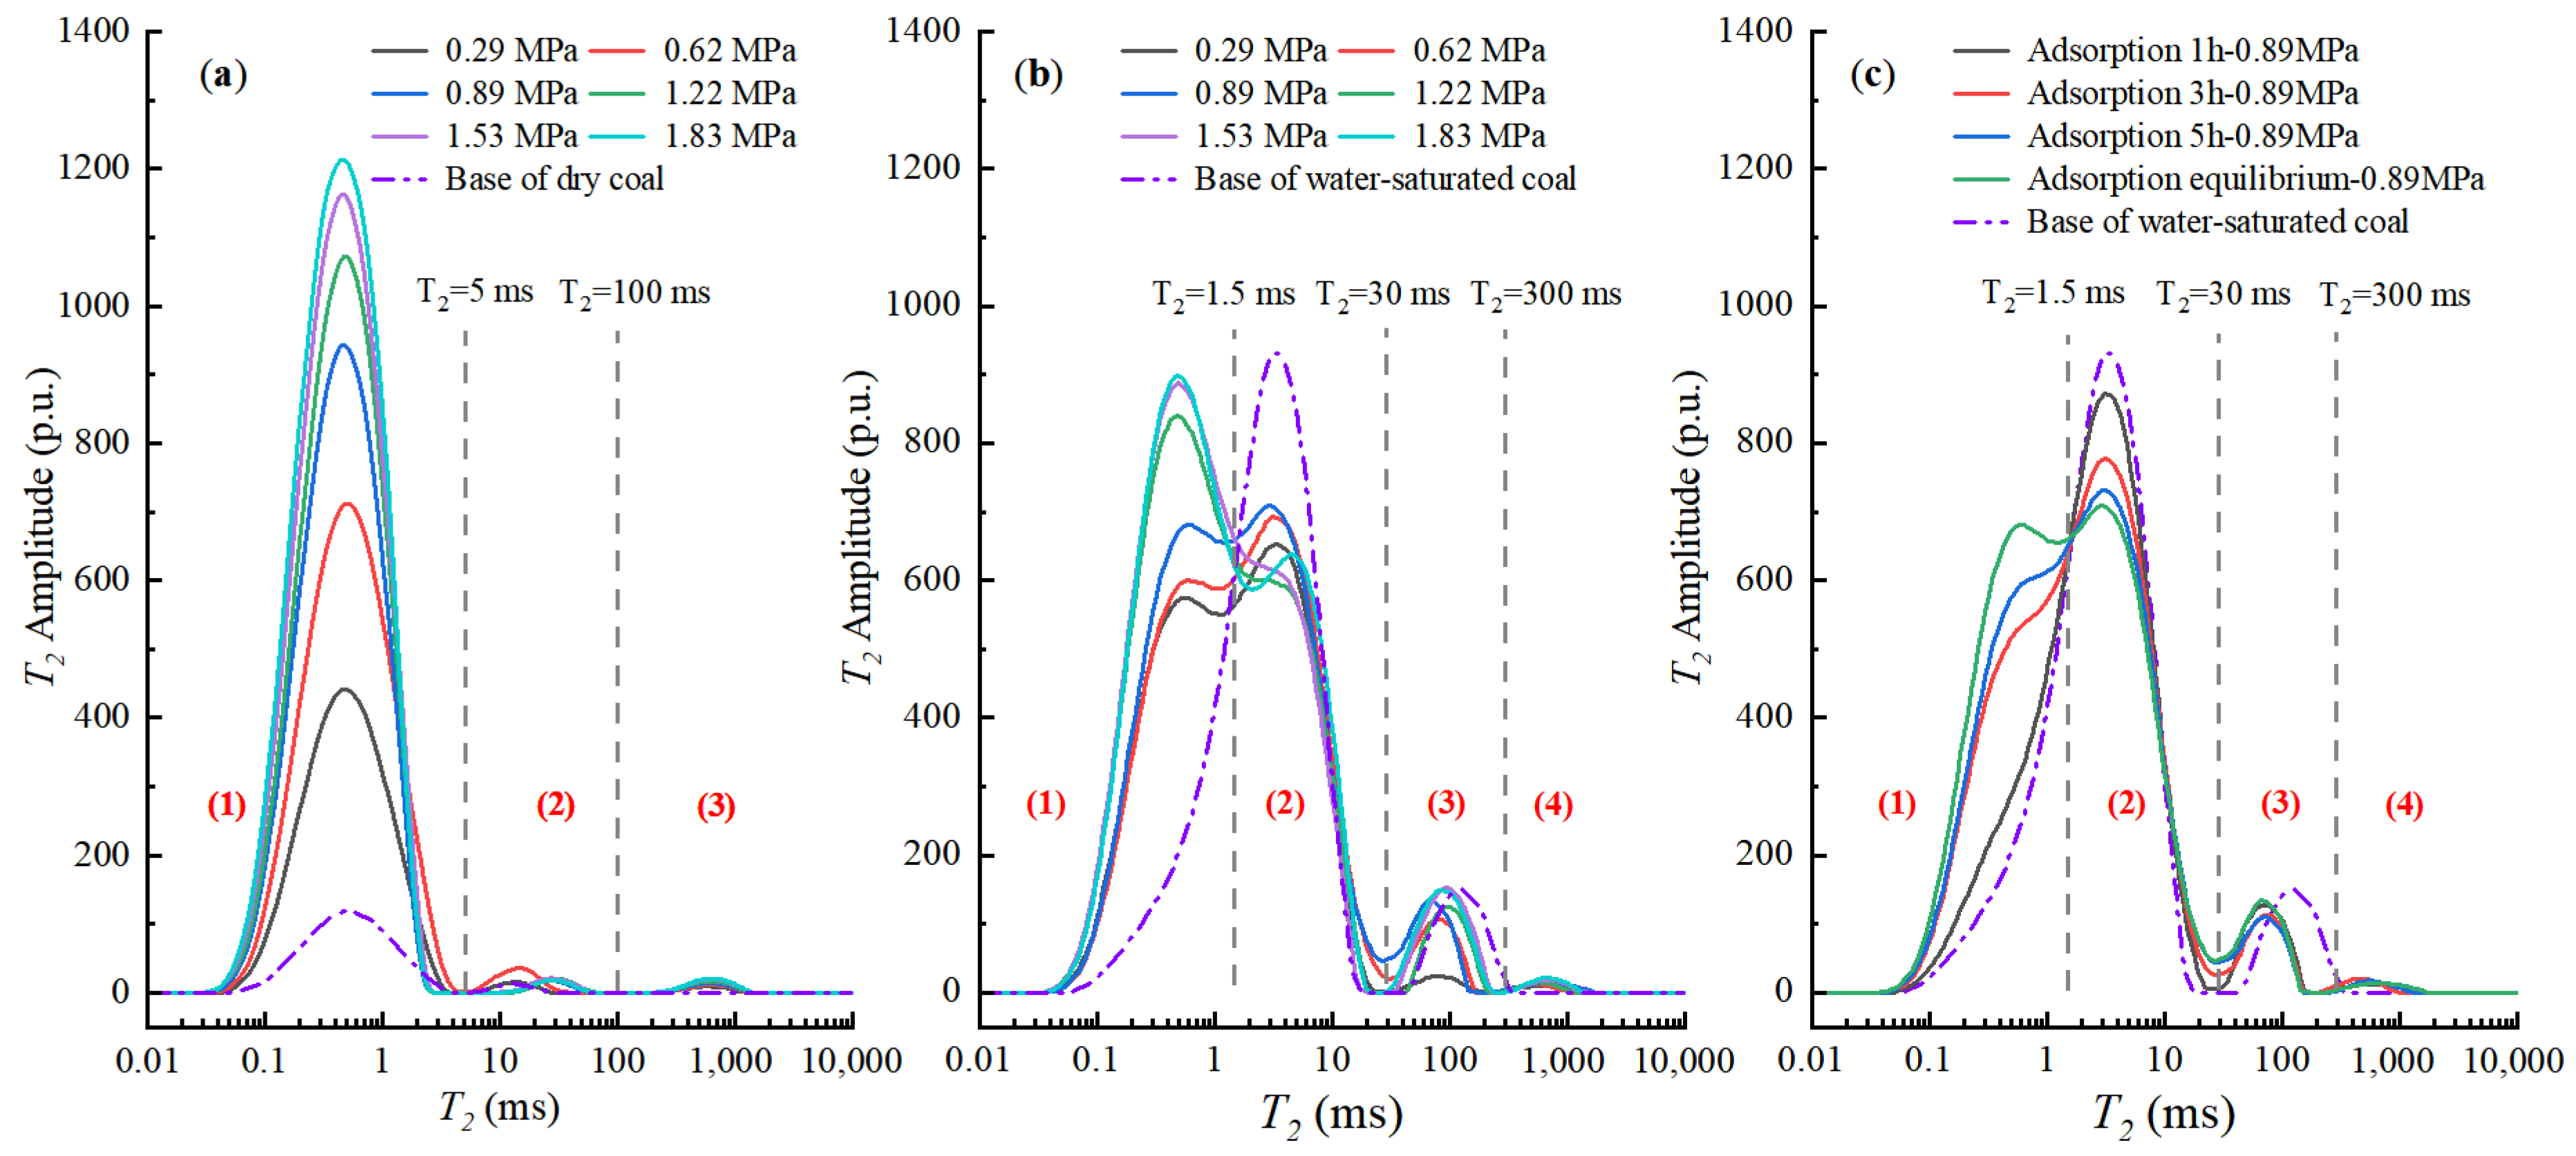
Figure 6a shows the T2 spectra of dry coal at the different pressures. Region one corresponds to methane in the adsorption state. Region two is the free methane in coal, and region three corresponds to the methane between the coal and sample cell. The peaks in region one are drastically higher than those in region two regardless of the gas pressure. The area of the peaks in region two suggests that free methane only accounts for a small part of the total gas in coal. As shown in Figure 6a, the signal amplitude in region one (adsorbed methane) accounts for over 95% of the total amplitude across all pressure levels. For instance, at the equilibrium pressure of 1.83 MPa, the integrated amplitude of region one constitutes 96.7% of the total signal, quantitatively confirming that the adsorbed phase in micropores is the overwhelmingly dominant state of methane in coal, while free gas in larger pores (region two) contributes less than 3.3%. This quantitative distribution of methane states (>96% adsorbed) directly correlates with the pore structure characteristics revealed by the ASAP 2460 analysis, where micropores constitute 92.65% of the total SSA (Table 2). This agreement between independent methods (LF-NMR and low-temperature N2 adsorption) robustly confirms that adsorption primarily occurs in micropores, while the contribution of meso- and macropores to storage capacity is minimal, though their role as migration pathways remains crucial.
The base of water-saturated coal in Figure 6b displays the water distribution in coal. Water is present in a broader range of pores, and the majority of water occurs in transition pores. As adsorption begins, new peaks appear in region one within the range of 0–1.5 ms. The peaks in region two decline with increasing pressure, while the peaks in region one increase. The most notable growth in region one occurs with the pressure increasing from 0.89 to 1.22 MPa, indicating that there is a pressure threshold for a large amount of methane to enter smaller pores in water-saturated coal.
Figure 6c shows the T2 spectra of water-saturated coal for different adsorption times at 0.89 MPa. Figure 6c proves that an interaction occurs between methane and water. With the adsorption of methane, some water also migrates into smaller pores, and this is a relatively slow process.
The blocking effect of water for methane adsorption can be verified in the two aspects below.
  • The span of the main peaks (the peaks in region one of Figure 6a and the peaks in regions one and two of Figure 6b) suggests that methane exists in a wider range in water-saturated coals, reflecting the difficulty for methane to be absorbed by micropores.
  • The signal amplitude of the wet sample is much lower than that of the dry sample, reflecting the reduction in adsorption capacity.
Two factors contribute to the blocking effect of water: on the one hand, water molecules are more preferably adsorbed onto coal, leaving fewer sites for methane [25]; on the other hand, the presence of water causes capillary forces in the relatively larger pores, resulting in methane migration difficulties.
The methane amount in coal can be calculated by Equation (5). The amplitude of the base should be subtracted first. The adsorption ratio is defined as the concentration of wet coal divided by that of dry coal. The relative error of the methane concentrations from LF-NMR and the 3H-2000PHD analyzer is calculated to assess the validity of LF-NMR. Table 3 contains detailed results of the two methods. The LF-NMR test results are close to those of the volumetric method, with the highest relative deviation being −2.58%. The adsorption ratio ηa can be used to quantify the effect of moisture. The ratio is only 28.4% at 0.29 MPa. As the pressure increases to 1.83 MPa, the ratio increases to 43.29%.
The methane concentration results from the 3H-2000PHD analyzer and LF-NMR are fitted by adopting the Langmuir theory:
C = V L P P + P L
where C is the methane concentration, VL is the maximum adsorption capacity of coal (cm3/g), and PL is the Langmuir pressure (MPa).
According to the LF-NMR calculations based on Figure 6c, the concentration of methane adsorbed in the water-saturated sample increases from 0.515 cm3/g at 1 h to 2.429 cm3/g at 3 h and then to 2.767 cm3/g at 5 h. This proves that adsorption onto water-saturated coal is a decelerated process.
Table 4 presents the error analysis of two types of methods. The table proves that the two methods have high consistency in determining the adsorption capacity of samples in different states.

3.4. Methane Desorption for Moist Coals

Figure 7a–d correspond to the LF-NMR desorption tests at moisture levels of 0.65%, 1.02%, 1.92%, and 3.09%, respectively. Considering that the base spectrum of dry coal in Figure 6a is quite limited, the base spectra in Figure 7a–d can be roughly considered as the distributions of the different water contents in coal. As mentioned above, water mainly occurs in transition pores. The range of the main peaks is expanding, from 0.046–5.17 ms at 0.65% to 0.035–9.01 ms at 1.02%, and the main peaks are then located between 0.037 and 25.529 ms at 1.92%. For the water-saturated sample, some water is located in mesopores between T2 = 41.504 ms and T2 = 333.129 ms. This implies that, with increasing moisture, the range of water occurrence is increasing. In addition, the base of the water-saturated sample demonstrates a good pore connectivity at T2 = 16.832 ms.
The ranges of the main peaks increase with increasing moisture, demonstrating that moisture expands the pore size range of methane adsorption. Interestingly, Figure 7a is similar to Figure 6a, although they represent two different processes. Two conclusions can be drawn: (a) to a large extent, desorption at a low moisture level can be viewed as the reverse process of adsorption [26,27,28]; (b) a relatively low moisture level has little effect on desorption.
Comparing the spectra at 1 and 0 min in Figure 7a, the change in the main peak is quite apparent, indicating that desorption in the micropores plays a significant role. In the T2 range of 0.046–2.768 ms that corresponds to micropores, the signal amplitude notably drops at 1 min, implying that desorption inhibition is quite limited at a low moisture. Desorption at T2 = 8.407 ms is also observed. When the moisture level becomes 1.92%, the drop in signal amplitude at 0.48 ms is insignificant, suggesting that the blocking effect is substantial. For the water-saturated sample, the decline in signal amplitude in the micropore range is the lowest.
In Figure 7a, the spectrum at 60 min exceeds that at 1 min in the range of 1.703–3.917 ms, indicating that little water and methane move to larger pores. In Figure 7b,c, the corresponding ranges are 2.248–8.407 ms and 2.097–14.65 ms, respectively. The largest change between the spectra at 60 and 1 min is that water and methane move to larger pores at 1.482 ms. The differences between the spectra at 1 and 60 min in Figure 7b–d show that (a) the desorption amounts after 1 min are greatly reduced compared with those at 1 min, (b) the migration of water and methane from micropores to larger pores cannot be neglected, and (c) the migration difficulty increases with increasing moisture.

4. Discussion

4.1. Moisture Effect

The fitting results are shown in Figure 8. The adjusted R-square implies a high fitting degree. The fitting results prove that the maximum adsorption capacity (VL) declines in water-saturated coal. Research shows that PL reflects the difficulty of coal adsorption. The increase in PL is very large, meaning that methane adsorption becomes more difficult in the presence of water. Moisture can greatly decrease the adsorption capacity of coal, and the high fitting degree indicates that the Langmuir theory works well in characterizing methane adsorption in moist coals.
By subtracting the base amplitude from the total amplitude, the amplitude of methane can be acquired. Consequently, the desorption amounts in 1 and 60 min are determined. The results are plotted in Figure 9. The desorption ratio (DR) is the proportion of the desorption amount to the total adsorption amount. In Figure 9a, the goodness of fit is 0.90633. The quantitative impact of this blocking effect on desorption is evident. The desorption ratio exhibits a strong negative linear correlation with moisture content. The reasons for the highest DR at a moisture content of 0.65% are as follows: (a) the blocking effect is relatively weak according to Figure 7a; (b) the effect of adsorption competition between methane and water is relatively strong.
The ratio of the desorption amount in 1 min to that in 60 min is adopted to evaluate the desorption capacity of coal in a short time. More strikingly, the ratio of the desorption amount in 1 min to that in 60 min (D~1 min~/D~60 min~) shows a near-perfect negative exponential decline (R2 = 0.99945), underscoring that moisture drastically impedes the initial rapid desorption phase, which is critical for gas outburst dynamics and CBM production. The ratio experiences a considerable decrease, especially at moisture contents higher than 1.02%. The decrease in DR indicates the increase in remaining methane in coal, verifying the promoting role of moisture in weakening methane desorption.
In Figure 9c, the initial desorption rate decreases linearly with moisture, and the goodness of fit is 0.94974. Among all the desorption indicators, the desorption rate is quite remarkable. Figure 9 shows that the desorption rate is the highest in the beginning and then drastically declines over time. The more moisture there is, the shorter the time required for the desorption rate to decline to a certain level.
The fitting results in Figure 9d reflect the linear decrease in desorption amount. Figure 9c,d jointly validate the very notable inhibitory effect of moisture.
The mechanism of the inhibitory effect of moisture on methane desorption can be explained in the three aspects below:
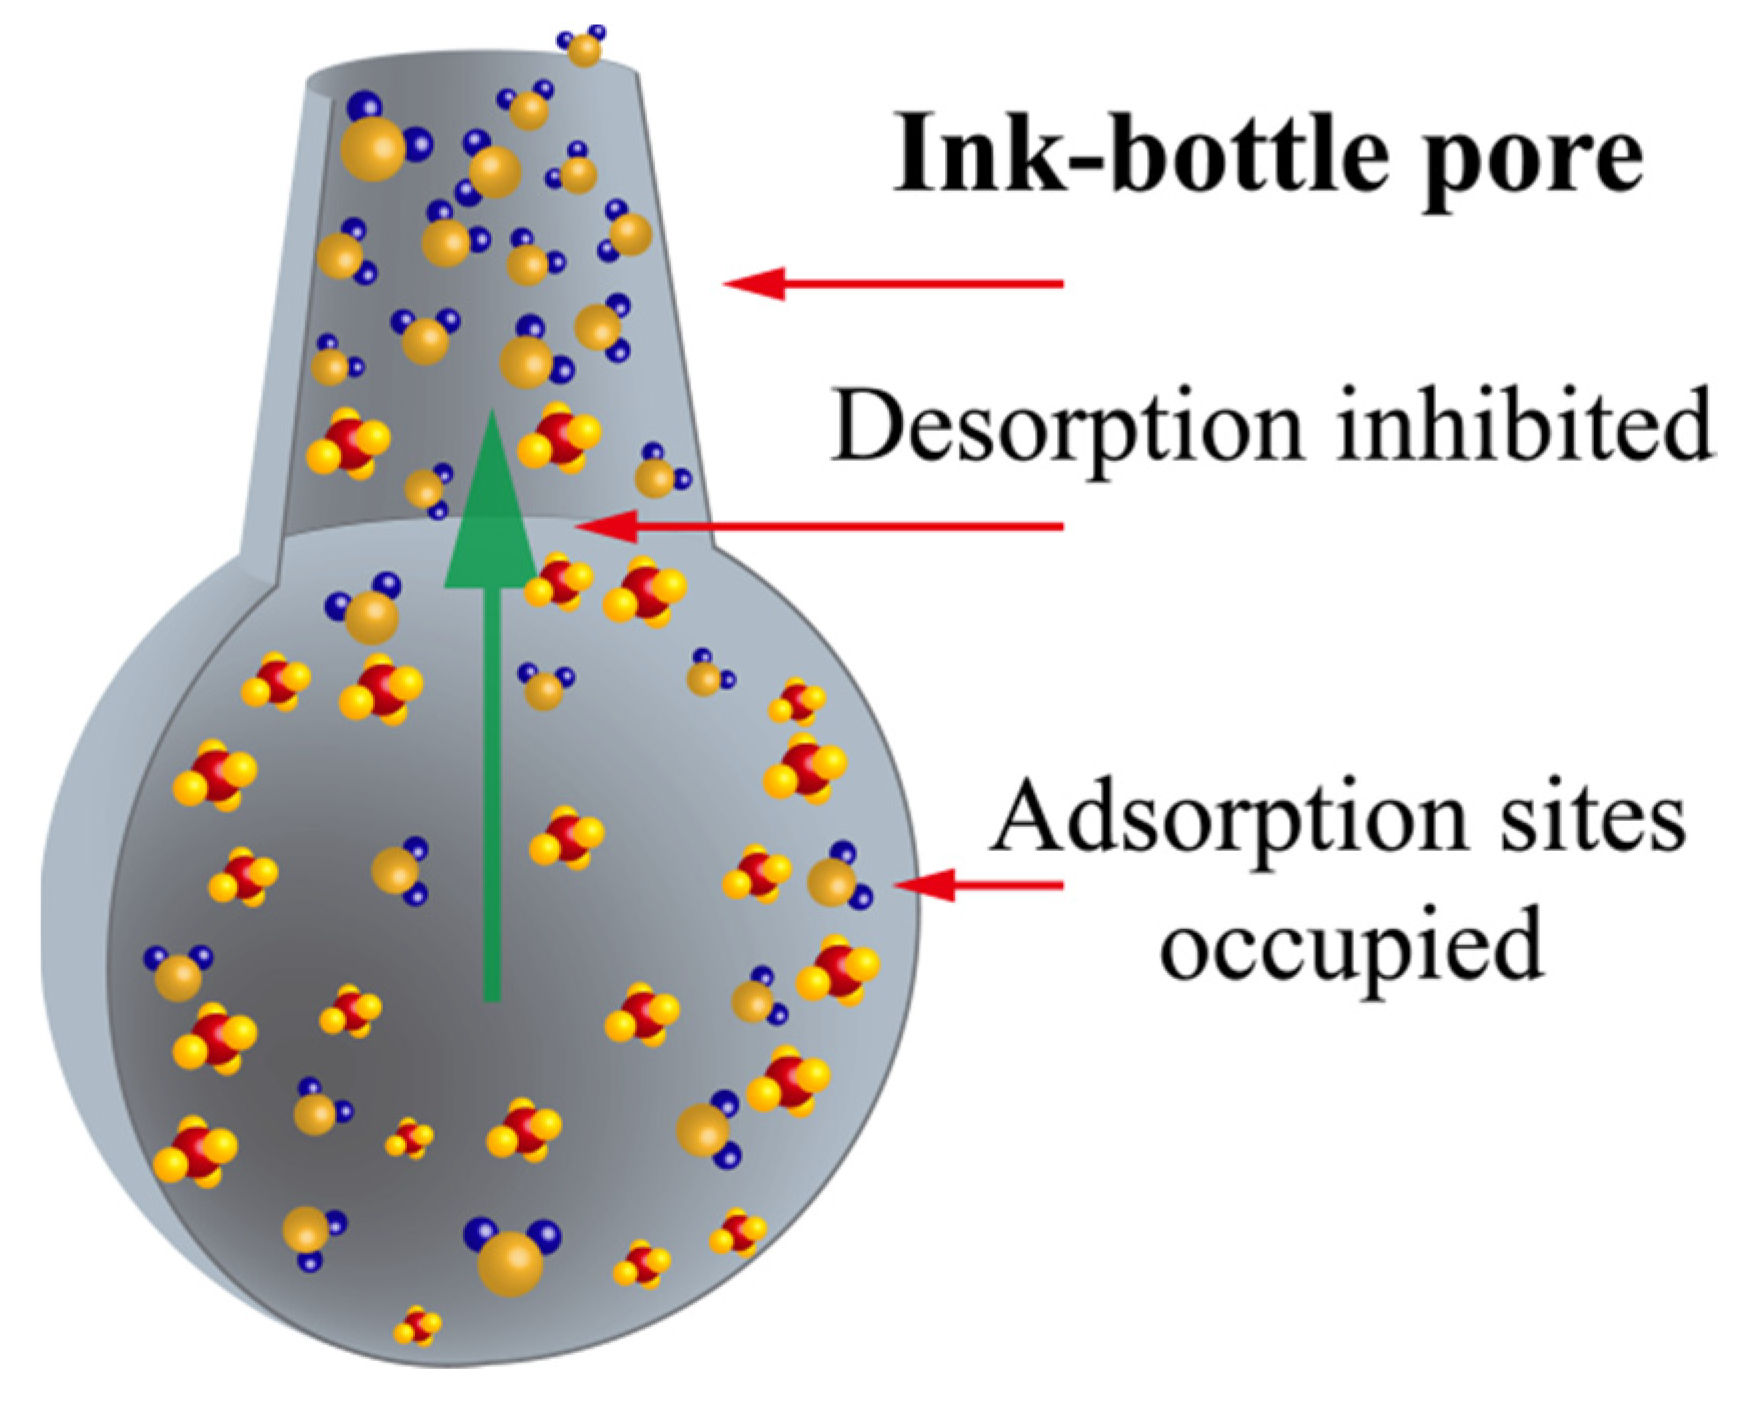
  • As previously mentioned and as shown in Figure 10, a large number of ink bottle pores are present in coal. Considering their particular shape, the micropores that are essential for both adsorption and desorption can easily be blocked by water molecules.
  • The adsorption capacity can be notably reduced by water, owing to the adsorption competition effect (mainly in micropores) and capillary forces (in transition pores and mesopores) caused by water. Then, the methane amount involved in desorption will be reduced.
  • Pores that are suitable for methane migration and diffusion in dry coals can retain methane in moist coals, meaning less space and therefore greater difficulty for methane migration and diffusion.
From the macroscopic perspective, the functions of pores are either changed or reduced, and the channels for desorption and migration are blocked. As a result, the desorption rate and amount are considerably reduced with increasing moisture.

4.2. Field Application

The findings in this work provide a better and more detailed understanding of the distribution and migration of water and methane in coal and can be constructive in CBM recovery, coal and gas outburst prevention, and CMM emission reduction.
1.
CBM recovery
In view of the role of micropores in adsorption and desorption, the key to improving CBM production is to reduce the water content, or at least to prevent a moisture increase. Moreover, it is crucial to promote the connectivity of meso- and macropores.
2.
Outburst prevention
It is widely accepted that gas greatly contributes to outbursts. The function of methane in a possible outburst is to provide expansion energy, which is closely related to the gas pressure and gas desorption rate and amount. The increase in moisture in coal seams would undoubtedly lower the possibility of an outburst.
3.
CMM emission
CMM is one of the top three major sources of methane emissions in China [29]. Ventilation air methane, which accounts for approximately 70% of the methane emissions from underground mining, occurs at low concentrations, and it is difficult to directly utilize. In addition, the discharge of untreated methane aggravates the severity of the greenhouse effect. Increasing the water content can achieve good results. Water injection into coal seams can be effective in methane emission mitigation at a low cost and with few engineering difficulties.

4.3. Practical Integration of LF-NMR Monitoring in CBM Operations

The LF-NMR technique presented in this study offers a nondestructive and quantitative means to monitor methane adsorption/desorption dynamics and moisture distribution in coal seams in real time. To integrate this method into existing CBM operations, the following approaches are recommended:
1.
Downhole NMR Logging Tools: Compact, robust LF-NMR probes can be deployed in boreholes for in situ assessment of coal seam moisture and gas content. This can complement existing well-logging suites (e.g., resistivity, acoustic) to provide direct indicators of gas saturation and mobility.
2.
Laboratory-to-Field Calibration: Establish correlation models between LF-NMR responses and core-scale gas/water content measurements. These models can then be used to interpret field NMR data, reducing reliance on invasive coring.
3.
Monitoring Enhanced CBM Recovery: During enhanced recovery operations (e.g., CO2 injection, nitrogen flushing), LF-NMR can be used to track fluid displacement, methane desorption efficiency, and moisture redistribution, providing real-time feedback for process optimization.

4.4. Potential for Numerical Modeling Integration

While this study provides critical experimental insights into the microscopic mechanism of moisture affecting methane dynamics, integrating numerical modeling in future work could significantly enhance the predictive capability and theoretical depth. The quantitative data obtained here, particularly the pore structure parameters from low-temperature N2 adsorption and the real-time methane/water distribution from LF-NMR, serve as an excellent foundation for model development and validation.
Potential modeling approaches include:
Multi-Component Adsorption/Diffusion Models: The Langmuir model fitting in this work (Figure 8) is a starting point. More advanced models, such as those based on the density functional theory (DFT) or incorporating competitive adsorption between CH4 and H2O molecules, could be employed to better simulate the observed adsorption hysteresis and the decelerated desorption kinetics in moist coal.
Upscaling to Field Performance: A calibrated numerical model, validated against our laboratory-scale LF-NMR data, could be upscaled to simulate gas and water production behavior at the field scale. This would be a powerful tool for forecasting CBM well performance under different geological conditions and designing optimal production strategies that account for the profound impact of moisture.

5. Conclusions

This study investigates the pore structure of anthracite using an ASAP 2460 system, and methane adsorption/desorption is analyzed by adopting LF-NMR technology and the volumetric method.
  • This paper verifies both the qualitative and quantitative reliability of LF-NMR technology in obtaining the methane state and amount in coal. The T2 amplitude exhibits a notable linear correlation with the methane quantity, and the errors compared with the results from the 3H-2000PHD analyzer are negligible.
  • The SSA, RSSA, and T2 spectra of the dry sample reveal highly developed micropores in the coal, and the significance of micropores in methane adsorption and desorption is proven. Moisture in coal can expand the pore size range for methane adsorption. The adsorption amount in meso- and macropores is quite limited, but their role in methane diffusion cannot be neglected, which facilitates adsorption and desorption. Pores in all pore size ranges are indispensable for adsorption and desorption.
  • The moisture effect in inhibiting methane desorption consists of reducing the methane amount and desorption rate. Moisture can not only inhibit methane migration but can also change the function of pores. The ratio of the desorption amount in 1 min vs. that in 60 min can be adopted as an indicator in evaluating the effect of moisture.
  • An accurate and reliable understanding of the moisture mechanism will have a profound impact on CMM utilization, greenhouse gas emission reduction, and underground mining safety enhancement.

Author Contributions

Conceptualization, Q.L. and L.Z.; methodology, Q.L. and L.Z.; software, L.Z.; validation, Q.L. and Z.Z.; funding acquisition, Q.L. and G.F.; writing—original draft, Q.L.; investigation, L.Z.; supervision, L.Z.; writing—review and editing, L.Z., G.F., Z.Z. and Z.L.; data curation, J.C.; resources, J.C.; project administration, J.C.; Formal analysis, G.F. All authors have read and agreed to the published version of the manuscript.

Funding

This research was funded by the Young Scholar Program (Category A Continuation Funding) of National Natural Science Foundation of China (Grant No. 52525401) and Youth Project of Shanxi Basic Research Program (Grant No. 202303021212292).

Data Availability Statement

The data used to support the findings of this study are available from the corresponding author upon request.

Conflicts of Interest

The authors declare no conflicts of interest.

References

  1. Wang, F.; Liang, Y.; Li, X.; Li, L.; Li, J.; Chen, Y. Orthogonal Experimental Study on Multifactor Conditions for Gas Desorption in Coal. Adv. Civ. Eng. 2019, 2019, 3028721. [Google Scholar] [CrossRef]
  2. Li, Y.; Zhai, C.; Xu, J.; Yu, X.; Sun, Y.; Cong, Y.; Tang, W.; Zheng, Y. Effects of steam treatment on the internal moisture and physicochemical structure of coal and their implications for coalbed methane recovery. Energy 2023, 270, 126866. [Google Scholar] [CrossRef]
  3. Jiang, J.; Peng, H.; Cheng, Y.; Wang, L.; Wang, C.; Ju, S. Effect of moisture on time-varying diffusion properties of methane in low-rank coal. Transp. Porous Media 2023, 146, 617–638. [Google Scholar] [CrossRef]
  4. Miao, Y.; Luan, G.; Zhao, C.; Li, Y. Molecular Simulation of Methane Adsorption Behavior on Coal: Effects of Maturity and Moisture Content. J. Energy Resour. Technol 2023, 145, 052602. [Google Scholar] [CrossRef]
  5. Wang, Y.; Yuan, B.; Hu, Y. Recent progress in improving the yield of microbially enhanced coalbed methane production. Energy Rep. 2023, 9, 2810–2819. [Google Scholar] [CrossRef]
  6. Dreger, M.; Celary, P. The outburst probability index (Ww) as a new tool in the coal seam outburst hazard forecasting. J. Sustain. Min. 2024, 23, 55–60. [Google Scholar] [CrossRef]
  7. Zhang, L.; Ren, T.; Aziz, N. Influences of temperature and moisture on coal sorption characteristics of a bituminous coal from the Sydney Basin, Australia. Int. J. Oil Gas Coal Technol. 2014, 8, 62–78. [Google Scholar] [CrossRef]
  8. Wang, L.; Liu, M.; Li, J.; Sun, Y.; Lv, B.; Ma, X.; Zhou, M.; Zhang, J. Investigation of methane adsorption mechanism in Low-Rank bituminous coal considering internal water Distribution: A molecular simulation and experimental study. Chem. Eng. J. 2024, 495, 153562. [Google Scholar] [CrossRef]
  9. Sun, W.; Liang, Y.; Li, Q.; Li, Z.; Zhao, Z.; Zheng, X.; Wang, M.; Liu, S.; Wu, Z. Experimental study on effects of tetrahydrofuran soaking on pore structure and gas adsorption and desorption characteristics of coal. Powder Technol. 2024, 445, 120117. [Google Scholar] [CrossRef]
  10. Zhao, L.; Ni, G.; Sun, L.; Qian, S.; Shang, L.; Kai, D.; Xie, J.; Gang, W. Effect of ionic liquid treatment on pore structure and fractal characteristics of low rank coal. Fuel 2020, 262, 116513. [Google Scholar] [CrossRef]
  11. Jiang, X.; Miao, B.; Zhang, J.; Xi, D.; Qin, Z.; Vandeginste, V. Quantitative Characterization of Pore-Fracture Structures in Coal Reservoirs by Using Mercury Injection-Removal Curves and Permeability Variation under Their Constraints. Processes 2024, 12, 1434. [Google Scholar] [CrossRef]
  12. Zhang, P.; Lu, S.; Li, J.; Chen, C.; Xue, H.; Zhang, J. Petrophysical characterization of oil-bearing shales by low-field nuclear magnetic resonance (NMR). Mar. Petrol. Geol. 2018, 89, 775–785. [Google Scholar] [CrossRef]
  13. Cai, Y.; Zhai, C.; Yu, X.; Sun, Y.; Xu, J.; Zheng, Y.; Cong, Y.; Li, Y.; Chen, A.; Xu, H.; et al. Quantitative characterization of water transport and wetting patterns in coal using LF-NMR and FTIR techniques. Fuel 2023, 350, 128790. [Google Scholar] [CrossRef]
  14. GB/T 212-2008; Proximate Analysis of Coal. Standards Press of China: Beijing, China, 2008.
  15. GB/T 19560-2008; Experimental Method of High-Pressure Isothermal Adsorption to Coal. Standards Press of China: Beijing, China, 2008.
  16. GB/T 8899-2013; Determination of Maceral Group Composition and Minerals in Coal. Standards Press of China: Beijing, China, 2013.
  17. Busch, A.; Gensterblum, Y. CBM and CO2-ECBM related sorption processes in coal: A review. Int. J. Coal Geol. 2011, 87, 49–71. [Google Scholar] [CrossRef]
  18. Krooss, B.V.; Van Bergen, F.; Gensterblum, Y.; Siemons, N.; Pagnier, H.J.M.; David, P. High-pressure methane and carbon dioxide adsorption on dry and moisture-equilibrated Pennsylvanian coals. Int. J. Coal Geol. 2002, 51, 69–92. [Google Scholar] [CrossRef]
  19. Siemons, N.; Wolf, K.-H.A.A.; Bruining, J. Interpretation of carbon dioxide diffusion behavior in coals. Int. J. Coal Geol. 2007, 72, 315–324. [Google Scholar] [CrossRef]
  20. Zheng, S.; Yao, Y.; Elsworth, D.; Wang, B.; Liu, Y. A novel pore size classification method of coals: Investigation based on NMR relaxation. J. Nat. Gas Sci. Eng. 2020, 81, 103466. [Google Scholar] [CrossRef]
  21. Shan, C.; Zhang, T.; Guo, J.; Zhang, Z.; Yang, Y. Characterization of the micropore systems in high-rank coal reservoirs of the southern Sichuan Basin, China. AAPG Bull. 2015, 99, 2099–2119. [Google Scholar] [CrossRef]
  22. Qin, W.; Xu, J. Horizontal Subzone Characteristics and Methane Seepage Properties of the Gas Flowing Fracture Zone above the Gob. Adv. Civ. Eng. 2018, 2018, 9071578. [Google Scholar] [CrossRef]
  23. Li, J.; Li, B.; Ren, C.; Zhang, Y.; Wang, B. An adsorption model for evaluating methane adsorption capacity in shale under various pressures and moisture. J. Nat. Gas Sci. Eng. 2020, 81, 103426. [Google Scholar] [CrossRef]
  24. He, X.; Cheng, Y.; Hu, B.; Wang, Z.; Wang, C.; Yi, M.; Wang, L. Effects of coal pore structure on methane-coal sorption hysteresis: An experimental investigation based on fractal analysis and hysteresis evaluation. Fuel 2020, 269, 117438. [Google Scholar] [CrossRef]
  25. Gensterblum, Y.; Busch, A.; Krooss, B.M. Molecular concept and experimental evidence of competitive adsorption of H2O, CO2 and CH4 on organic material. Fuel 2014, 115, 581–588. [Google Scholar] [CrossRef]
  26. Talapatra, A.; Karim, M.M. The influence of moisture content on coal deformation and coal permeability during coalbed methane (CBM) production in wet reservoirs. J. Pet. Explor. Prod. Technol. 2020, 10, 1907–1920. [Google Scholar] [CrossRef]
  27. Wang, M.; Zhang, D. Influences of moisture on adsorption and desorption of methane on gas shales. Energ. Sources Part A 2020, 46, 12556–12574. [Google Scholar] [CrossRef]
  28. Zhou, D.; Liu, Z.; Feng, Z.; Shen, Y.; Wu, Y. The study of the local area density homogenization effect of meso-structures in coal during methane adsorption. J. Pet. Sci. Eng. 2020, 191, 107141. [Google Scholar] [CrossRef]
  29. Cheewaphongphan, P.; Chatani, S.; Saigusa, N. Exploring gaps between bottom-up and top-down emission estimates based on uncertainties in multiple emission inventories: A case study on CH4 emissions in China. Sustainability 2019, 11, 2054. [Google Scholar] [CrossRef]
Figure 1. Coal sample preparation.
Processes 13 03113 g001
Figure 2. Schematic of the experimental system.
Processes 13 03113 g002
Figure 3. Low-temperature nitrogen adsorption/desorption isotherms of two samples: (a) sample a; (b) sample b.
Processes 13 03113 g003
Figure 4. (a): Incremental pore volume vs. pore width of sample a. (b): Incremental surface area vs. pore width of sample a. (c): Incremental pore volume vs. pore width of sample b. (d): Incremental surface area vs. pore width of sample b.
Processes 13 03113 g004
Figure 5. Linear fitting between the methane concentration and the sum of the T2 amplitude.
Processes 13 03113 g005
Figure 6. T2 spectra of (a) dry sample under the different adsorption equilibrium pressures, (b) water-saturated sample under the different adsorption equilibrium pressures, and (c) water-saturated sample for the different adsorption times at 0.89 MPa.
Processes 13 03113 g006
Figure 7. T2 spectra for desorption with moisture levels of (a) 0.65%, (b) 1.02%, (c) 1.92%, (d) 3.09%.
Processes 13 03113 g007
Figure 8. Langmuir fitting of the adsorption capacities of dry and wet coal.
Processes 13 03113 g008
Figure 9. (a): Linear fitting of the desorption ratio vs. moisture. (b): Curve fitting of D1min/D60min vs. moisture. (c): Linear fitting of the initial desorption rate vs. moisture. (d) Linear fitting of the desorption amount vs. moisture.
Processes 13 03113 g009
Figure 10. Schematic of the moisture effect in micropores.
Processes 13 03113 g010
Table 1. Physical parameters of samples.
ParametersValues
Moisture content0.69%
Ash content15.70%
Volatile matter content5.68%
Fixed carbon79.87%
Apparent density1.48 g/cm3
Table 2. Results of the pore volume, SSA, and RSSA.
SamplesItemsDiameter
(<10 nm)
Diameter
(10–100 nm)
Diameter
(100–300 nm)
Sample aPore volume (cm3)0.00100.000680.00050
SSA (m2)0.755660.053000.00691
Pore volume ratio (%)45.8731.1922.94
SSA ratio (%)92.656.50.85
RSSA (m2/cm3)755.6677.9413.82
Sample bPore volume (cm3)0.001240.000750.00054
SSA (m2)0.903770.06790.00755
Pore volume ratio (%)49.0129.6421.34
SSA ratio (%)92.296.930.77
RSSA (m2/cm3)728.8590.5313.98
Table 3. Adsorption results by the volumetric method and LF-NMR.
P (MPa)Dry SampleWet Sample
Cv1 (cm3/g)T1Cn1 (cm3/g)Cv2 (cm3/g)T2Cn2 (cm3/g)
0.294.3313,710.3924.2371.246596.6151.208
0.628.1222,925.5958.1612.689963.1012.642
0.8910.2127,508.51610.1133.8812,762.2653.834
1.2211.9231,439.28511.7864.9315,238.3424.888
1.5313.5234,949.52713.2815.7817,070.7585.668
1.8314.4137,029.01114.1666.2318,173.076.138
Cv1 and Cv2 are the methane quantities in coal determined by the analyzer. Cn1 and Cn2 are the results from the LF-NMR method. Td and Tm are the sums of the amplitudes of methane in the dry and wet samples, respectively. ηa is the adsorption ratio, and D is the relative error of the LF-NMR method compared with the volumetric method. The subscripts ‘1’ and ‘2’ represent the results of the dry and wet samples, respectively.
Table 4. Relative error analysis of the LF-NMR method compared to the volumetric method.
ηa = Cn2/Cn1
(%)
D = (CnCv)/Cv (%)
D1D2
28.51−2.148−2.58
32.370.505−1.42
37.91−0.95−1.19
41.47−1.124−0.85
42.68−1.768−1.94
43.33−1.693−1.48
Disclaimer/Publisher’s Note: The statements, opinions and data contained in all publications are solely those of the individual author(s) and contributor(s) and not of MDPI and/or the editor(s). MDPI and/or the editor(s) disclaim responsibility for any injury to people or property resulting from any ideas, methods, instructions or products referred to in the content.