Abstract
Using Excel and its Solver feature, a novel method of analyzing the component reactions of an overall reaction is outlined. As an example, autothermal reforming (300–700 °C) of acetic acid (AA), a significant component of pyrolysis oil, was considered. The overall reaction can be viewed as comprising five individual reactions: reforming, oxidation, water–gas shift, reverse Boudouard, and methanation. A laboratory apparatus was set up in which acetic acid, air, and water were continuously fed to a BASF dual-layer catalytic reactor in plug flow at 1 atm. For this setup, it is easy to construct a material balance in Excel in which five factors, fi, are defined which represent the fraction of reactant going to each of the individual five reactions. Using the Solver feature of Excel, it can readily be determined which of the five factors fi produce the best match of the calculated exit gas composition with the measured gas concentrations for CO, CO2, H2, CH4, and O2. Furthermore, a program such as GasEq or Aspen can then be used to calculate the theoretical equilibrium gas composition at a given condition. Using this equilibrium gas composition and Solver, the individual (fi)equilb can be calculated. Thus, the ratio fi/(fi)equilb is an indication of how close each component reaction is to equilibrium. In this way, an idea is gained of which of the individual component reactions need to be improved or inhibited or if operating parameters should be adjusted. For the specific case of autothermal reforming of acetic acid, the steam reforming reaction requires at least 600 °C to approach equilibrium. In contrast, the oxidation reaction goes to equilibrium throughout the temperature range, completely consuming oxygen. The water–gas shift reaction appears to approach equilibrium to the extent of 71–90% throughout the temperature range. The reverse Boudouard reaction is favored at lower temperatures; in fact, coking was predicted and found at the low temperature of 300 °C.
1. Introduction
The desirability, if not the necessity, of a supply of renewable liquid transportation fuel has been amply expounded upon in the literature [1,2,3,4,5,6]. These particular papers consider the approach in which crop residue is converted into more readily transportable pyrolysis oil which can then be processed economically at a large central facility by means of reforming into CO and H2 and thence into liquid transportation fuel by Fischer Tropsch synthesis. Indeed, recent papers [7,8] have shown that the energy budget and economics of this tact are favorable. In another instance, related to biodiesel manufacture, the autothermal reforming of by-product glycerol produced from transesterification of triglycerides has been studied [9]. In this process, the resulting syngas can be used as feedstock to a methanol synthesis process, thus opening up the possibility of recycling back to the transesterification step.
Autothermal reforming (ATR) of an organic, as contrasted with conventional stream reforming, presents the economic advantage of close and efficient coupling of the heat-producing oxidation reaction of the organic with the endothermic-reforming reaction which produces CO and H2 [10]. The autothermal reforming of an oxygenated organic of general empirical formula CnHmOk in which the organic is reacted with oxygen and steam might be represented loosely as
The gas produced consists of a mixture of CO, CO2, H2, and CH4, along with the possibility that coke may have been produced. These species might be viewed as having been formed from some combination of the five following independent reactions:
Reforming CnHmOk + (n-k)H2O = nCO + (n + 0.5m − k)H2
Oxidation CnHmOk + (0.5n + 0.25m − 0.5k)O2 = nCO + 0.5mH2O
Water–gas shift CO + H2O = CO2 + H2
Reverse Boudouard CO = 0.5CO2 + 0.5C
Methanation CO + 3H2 = CH4 + H2O
The additional reactions
and
representing the combustion of H2 and oxidation of CO are imbedded in Equations (1)–(5), e.g., Equations (6) and (7) can be produced by a linear combination of Equations (1)–(3). Therefore, Equations (1)–(5) appear to be an independent set of equations, defining at least a large portion of the chemistry of autothermal reforming.
It must be acknowledged that the choice of these 5 equations would appear to be cloaked in arbitrariness. For example, it would be possible to eliminate reaction (3) and replace it with reaction (7) and still obtain a well-defined system of equations. However, in support of the choice of reaction (3), Ref. [11] states that in combustion reactions involving carbon, hydrogen, and oxygen, it is typically seen that (a) oxygen will oxidize carbon to CO, (b) remaining oxygen then oxidizes hydrogen to water, and (c) if any further oxygen remains, it will oxidize CO to CO2. At the moment, reactions 1–5 appear to produce reasonable results when compared to equilibrium.
A material balance spreadsheet in Excel is first prepared. In this material balance, five input parameters, fi, are provided. They are each associated with reactions 1–5 and are defined as follows:
- f1—fraction of available organic (AA, in this case) going to reaction 1;
- f2—fraction of available organic (AA, in this case) going to reaction 2;
- f3—fraction of generated CO going to reaction 3;
- f4—fraction of generated CO going to reaction 4;
- f5—fraction of generated CO going to reaction 5;
- 1–f1–f2—fraction organic remaining (unreacted);
- 1–f3–f4–f5—fraction of generated CO remaining (unreacted).
For example, f1 is the fraction of organic, CnHmOk, which goes to the steam reforming reaction, Equation (1). Similarly, f3 is the fraction of CO which is generated by reactions 1 and 2 which goes to the water–gas shift reaction, Equation (3), etc. The stoichiometry of the reactions can be readily set up in Excel in terms of the five parameters fi. Then, using the Solver feature of Excel in a parameter identification mode, the unique fi factors for each of the five reactions can be found to almost exactly match the experimental exit gas composition. As a next step, the equilibrium gas composition for the given operating condition is calculated using software such as Aspen or Gaseq. This equilibrium gas composition, along with AA conversion and coking predictions, is then used as the input to the material balance spreadsheet. Solver is then used to calculate the equilibrium fi fraction for each of the component reactions, (fi)equil. The ratio fi1/(fi)equil is then computed to obtain the extent of approach to equilibrium of the individual component reactions. In this way, it is possible to see how each of the reactions 1–5 is affected by a change in operating conditions, e.g., temperature, space velocity, H2O/C ratio, and O2/C ratio.
This more detailed knowledge of the reactions can permit more effective manipulation of process conditions and catalytic choices to achieve optimized yields and gas composition as well as checking for data inconsistencies. Dorazio and Castaldi [12] have formulated a kinetic approach to autothermal reforming of tetradecane (as a model compound) using 58 reactions and the simulation software KINTECUS [13]. Their kinetics model was aimed at having predictive capability. Our approach is greatly simplified and does not have predictive capability but rather is meant to provide diagnostic information.
The objective of this work was to develop an easy-to-use method with which to determine, for a given overall reaction, the approach to equilibrium of each of its individual constituent reactions. As an example case, the autothermal reforming acetic acid (a significant component of pyrolysis oil) was selected. A series of experiments were performed in our lab in which acetic acid was reacted with air and steam over a BASF dual-layer autothermal reforming catalyst. Off-gas composition was analyzed as a function of reaction temperature, H2O/C, and O2/C mole ratios in the feed.
The method involves setting up the reaction stoichiometry in an Excel spreadsheet and then using the Solver tool of Excel to match the empirically determined gas analysis and coking results. The method presented here, which, to the authors’ knowledge is novel, is an alternative to the method which employes the “extent of reaction” [14]. In the later method, simultaneous linear equations are set up and solved. In the method used here, the utility of the spreadsheet is employed and yields a more intuitive approach for rapid optimization and rapidly gauging how close a given component reaction is to equilibrium. The method, of course, is applicable to any overall reaction comprising sub-reactions.
2. Experimental
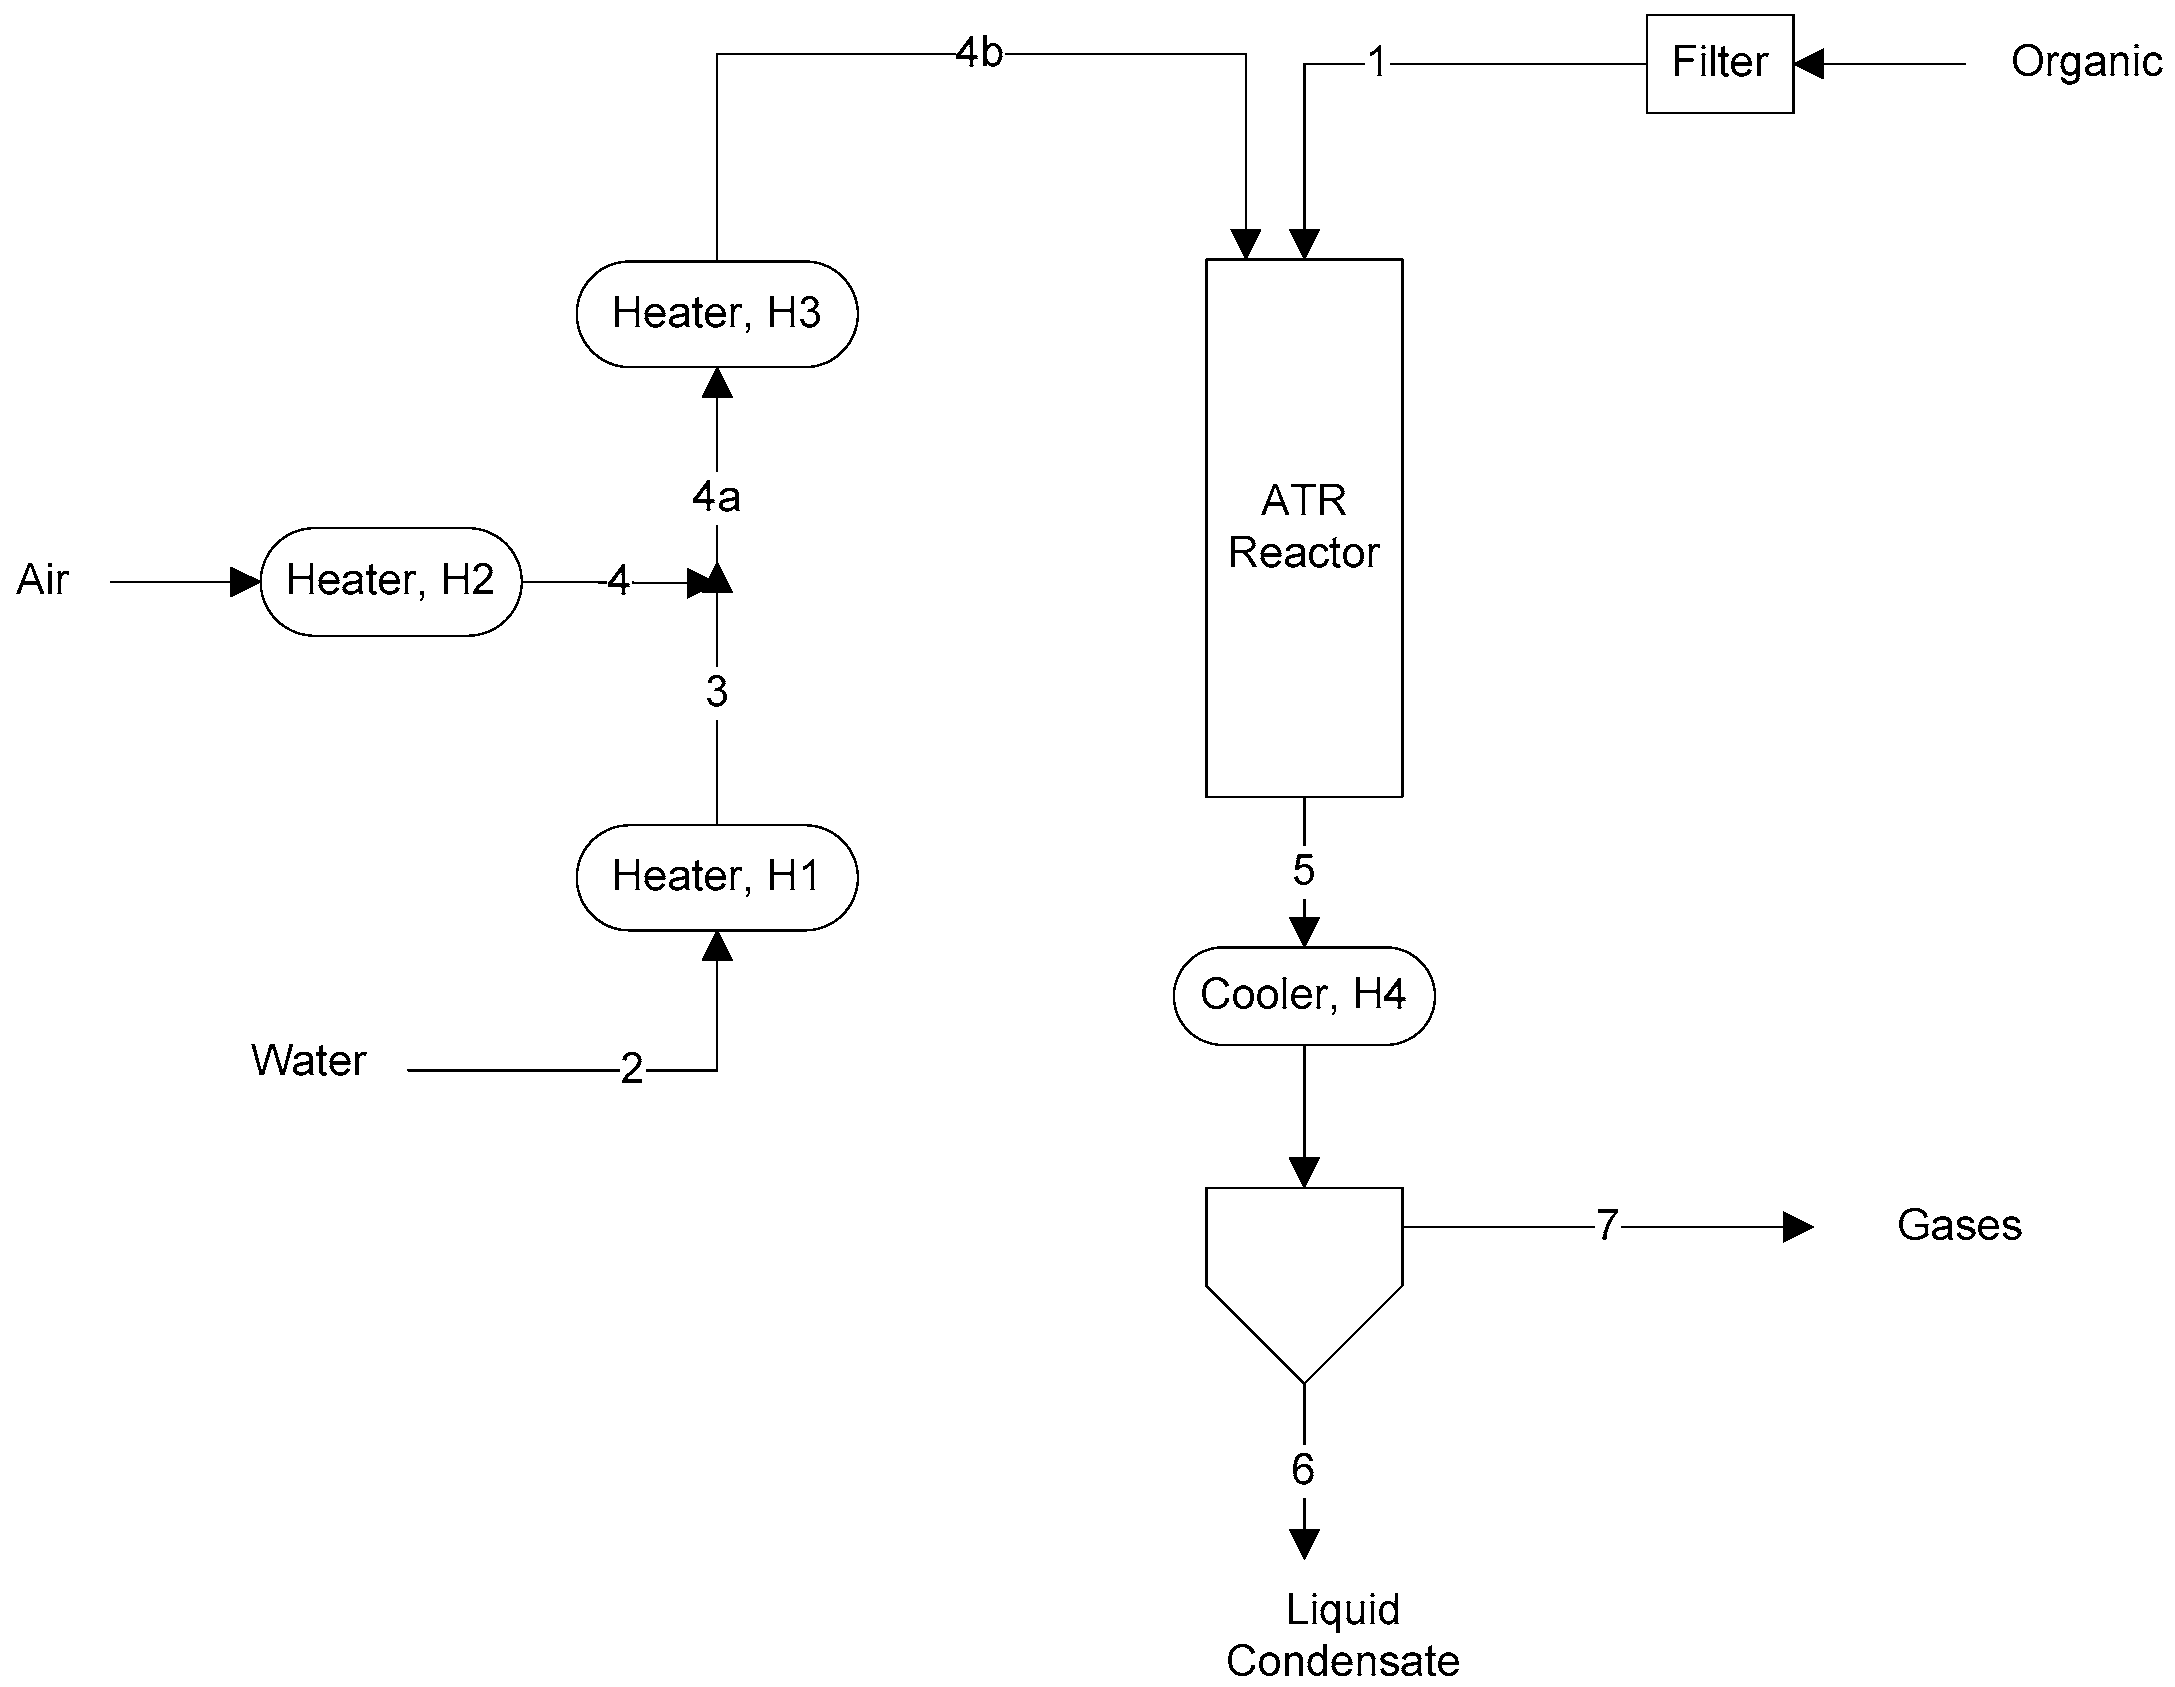
A schematic of the apparatus used in the experiments is shown in Figure 1. Stream numbers are indicated. The cooler condensed and removed water and unreacted acetic acid. Exit gas from the condenser was analyzed by a Shimadzu GC-14B (North America) gas chromatograph using two capillary columns (MS-5A and HP-Plot Q) and a thermal conductivity detector.
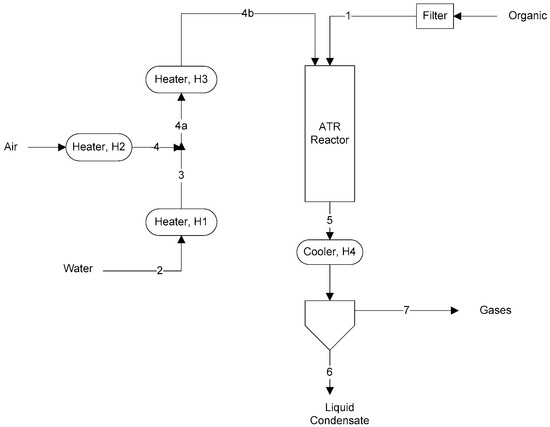
Figure 1.
ATR schematic and stream numbers.
The catalyst used was a BASF Pt and Rh/Pt ATR dual-layer honeycomb ATR catalyst with the designation RM47 and having a proprietary composition for catalyzing both the oxidation and reforming reactions. The catalyst was wash-coated on a cordierite monolith (400 cpsi) with 1–4% precious metal on a zirconia support. The separation distance between the nozzle tip which delivered organic and gases and the top of the catalyst honeycomb was 2 inches. Reactor temperature was measured by a thermocouple placed 0.25 inches above the top of the catalyst.
The effect of each parameter was studied by varying the selected parameter while maintaining the remaining parameters remained unchanged. Catalyst was reduced prior to each run in a 10% H2/N2 mixture at 500 °C. HPLC pumps were used for the input of water and acetic acid while Bronkhorst flow controllers were used to control gas flow rate. Unreacted AA was determined by the use of nitrogen as a tracer gas to determine yields and carbon balance. Coking (if any) was estimated by weighing the catalyst honeycomb before and after the run.
3. Calculations
A material balance spreadsheet of the process was prepared in Excel, in which the 5 parameters, fi, (constrained to be between 0 and 1) are used in constructing the stoichiometry. The Solver tool of Excel is used to adjust the five fi for each reaction to minimize the sum of the difference in the squares between experimental and calculated gas compositions (on a N2, H2O, and acetic acid free basis). The constraint precision was 0.00000001 and the Option “All Methods” was used in the Solver feature. We never experienced a convergence problem.
3.1. Determination of the Factors fi
For the example case of acetic acid, in Equations (1) and (2), n = 2, m = 4, and k = 2, so that the reforming and oxidation equations become
The unique case of acetic acid, where n = 2 and k = 2, causes the coefficient on H2O to become zero in Equation (1) resulting in a simple decomposition. Equations (1) and (2) are multiplied by factors f1 and f2, both being in the range 0 to 1. Therefore, 1– f1–f2 equals the fraction of unreacted oxygenated organic (in this case AA). Equations (3)–(5) are multiplied, respectively, by factors f3, f4, and f5 (each in the range of 0–1), such that 1–f3–f4–f5 = equals the fraction of unreacted CO (in the range 0–1).
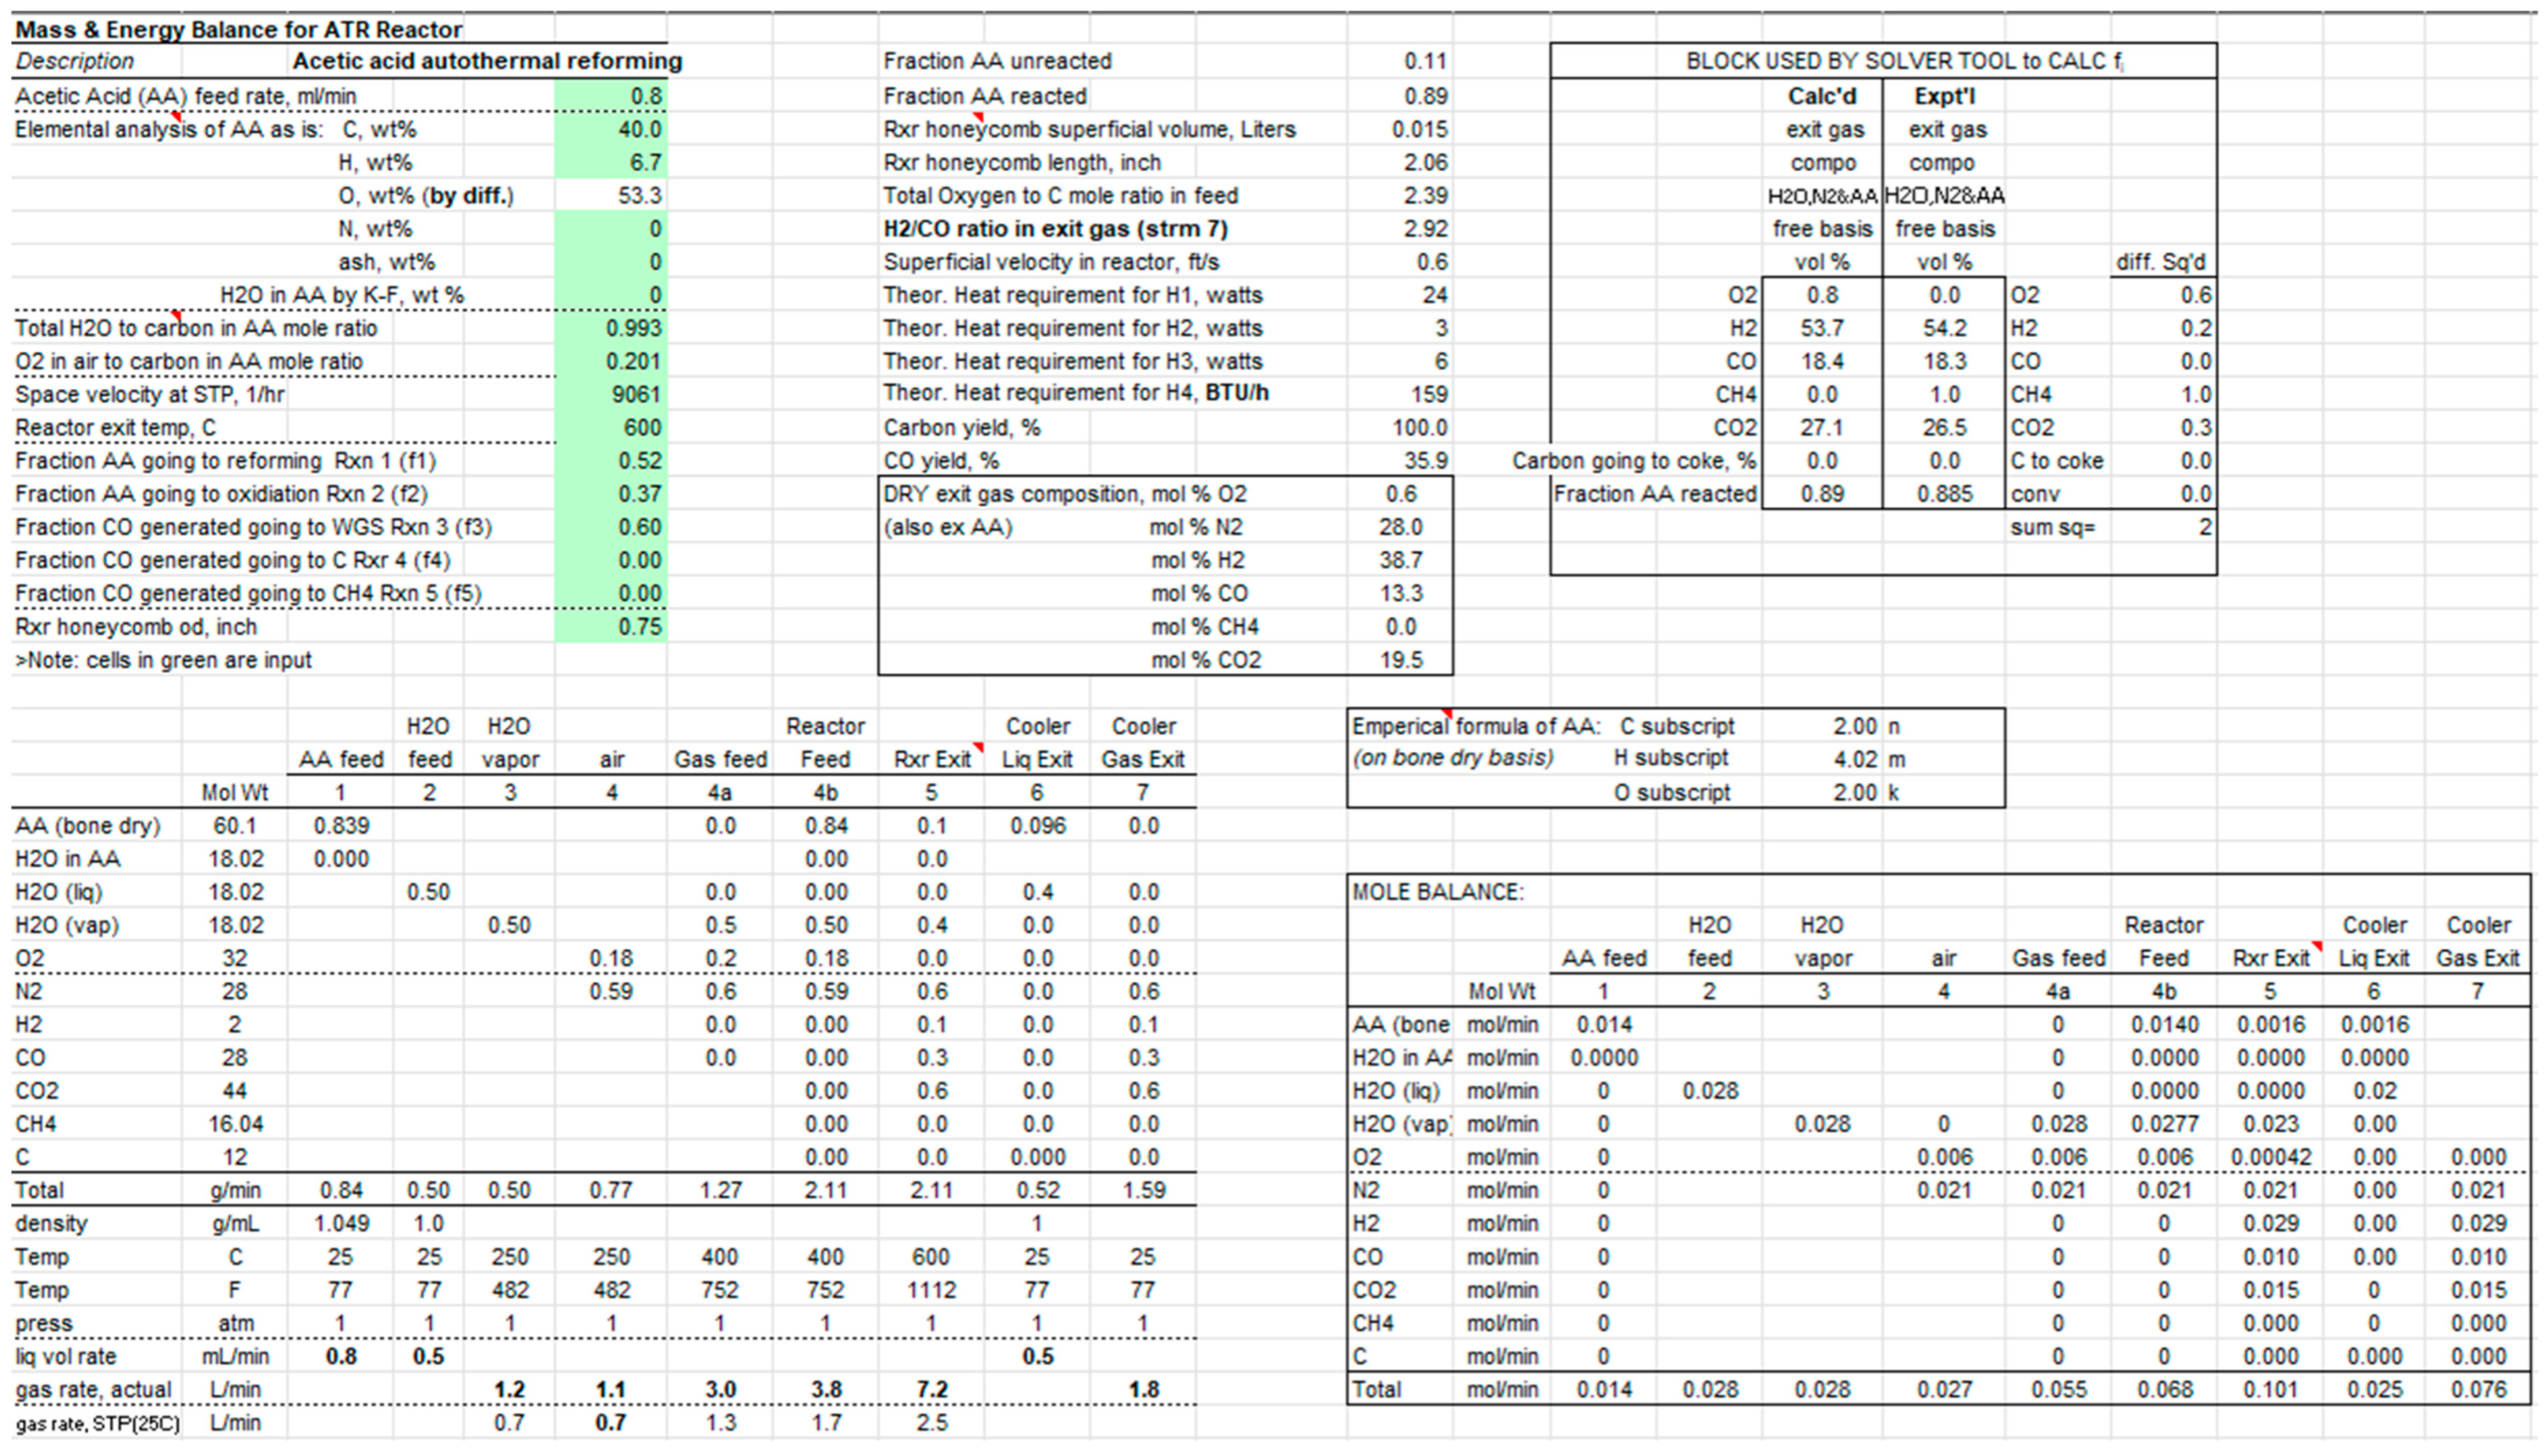
An example of the material balance at 600 °C is shown in Scheme 1. Usually, it is more convenient to conduct the material balance in terms of moles, also shown. For Stream numbers, refer to Figure 1. For a given operating condition, the experimentally determined gas composition is compared to the calculated one. The multiplying factors, fi, subject to being 0 ≤ fi ≤ 1, are chosen by Solver in Excel so as to minimize the sum of the square of the differences between calculated and measured O2, H2, CO, CH4, and Scheme 1. For the operating conditions of the run in Scheme 1, the factors fi (1 to 5) were found to be 0.52, 0.37, 0.60, 0.00, and 0.00, respectively.
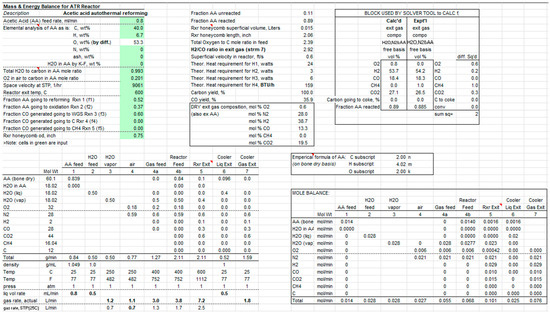
Scheme 1.
Mass and energy balance for the ATR reactor.
3.2. Determining the Approach to Equilibrium
For a given set of operating conditions (i.e., temperature, O2/C and H2O/C mole ratios), the equilibrium gas composition was calculated using GasEq [15]. Using these equilibrium gas compositions, the (fi)equil of each of the reactions, Equations (1)–(5), can be calculated. The experimental factor fi, previously calculated from experimental data, can then be compared to the equilibrium, (fi)equil. The ratio fi1/(fi)equil gives the extent approach to equilibrium for each of the reactions. Determination of the ratio fi1/(fi)equil for each reaction gives an indication how well the catalyst is functioning as well as which component reaction may need to be enhanced or suppressed.
4. Results and Conclusions
Throughout this study, gas hourly space velocity (GHSV) was fixed at about 9061 1/h. GHSV was calculated based on the whole volume of the honeycomb. Scans of the three operating parameters of temperature, H2O/C, or O2/C were made in which the other two parameters were held constant. This is illustrated in Table 1. The ratios “H2O/C” and “O2/C” are the mole ratios of moles of water injected to moles of carbon in the acetic acid and moles of O2 in the air feed to the moles of carbon in the acetic acid, respectively.

Table 1.
Parameter scans (all scans at a space velocity at STP of 9061 h−1).
4.1. Determination of fi
The factors fi for each of the component reactions, Equations (1)–(5), which provided the best least mean square matching of the calculated and experimental gas compositions for the scans outlined in Table 1 are shown in Table 2.

Table 2.
Calculation of fi for temperature, H2O/C ratio, and O2/C ratio scans.
4.2. Closeness of Solver Fit to Data and Indication of Possible Experimental Error
Typically, fi s can be found which produce a very close match of calculated gas analysis with the data: see, for example, Table 3 at temperatures of 500 °C and 700 °C. For these cases, as well as 600 °C, very close agreement is found. However, at 300° C, a discrepancy between the calculated and experimental gas analysis is observed. A discrepancy was also observed at 400 °C. A discrepancy would indicate a repeat of the experiment. Unfortunately, this was not possible in this case. For the cases of 300 °C and 400 °C, where some discrepancy between the solver calculations and the experimental gas data occurred, it was also found that closure of the experimental elemental material balance did not occur.

Table 3.
Comparison of solver-calculated exit gas analysis to experimental measurements for total H2O-to-C-in-AA mole ratio = 0.993 and O2-in-air-to-C-in-AA mole ratio = 0.3020.
4.3. Experimental Results
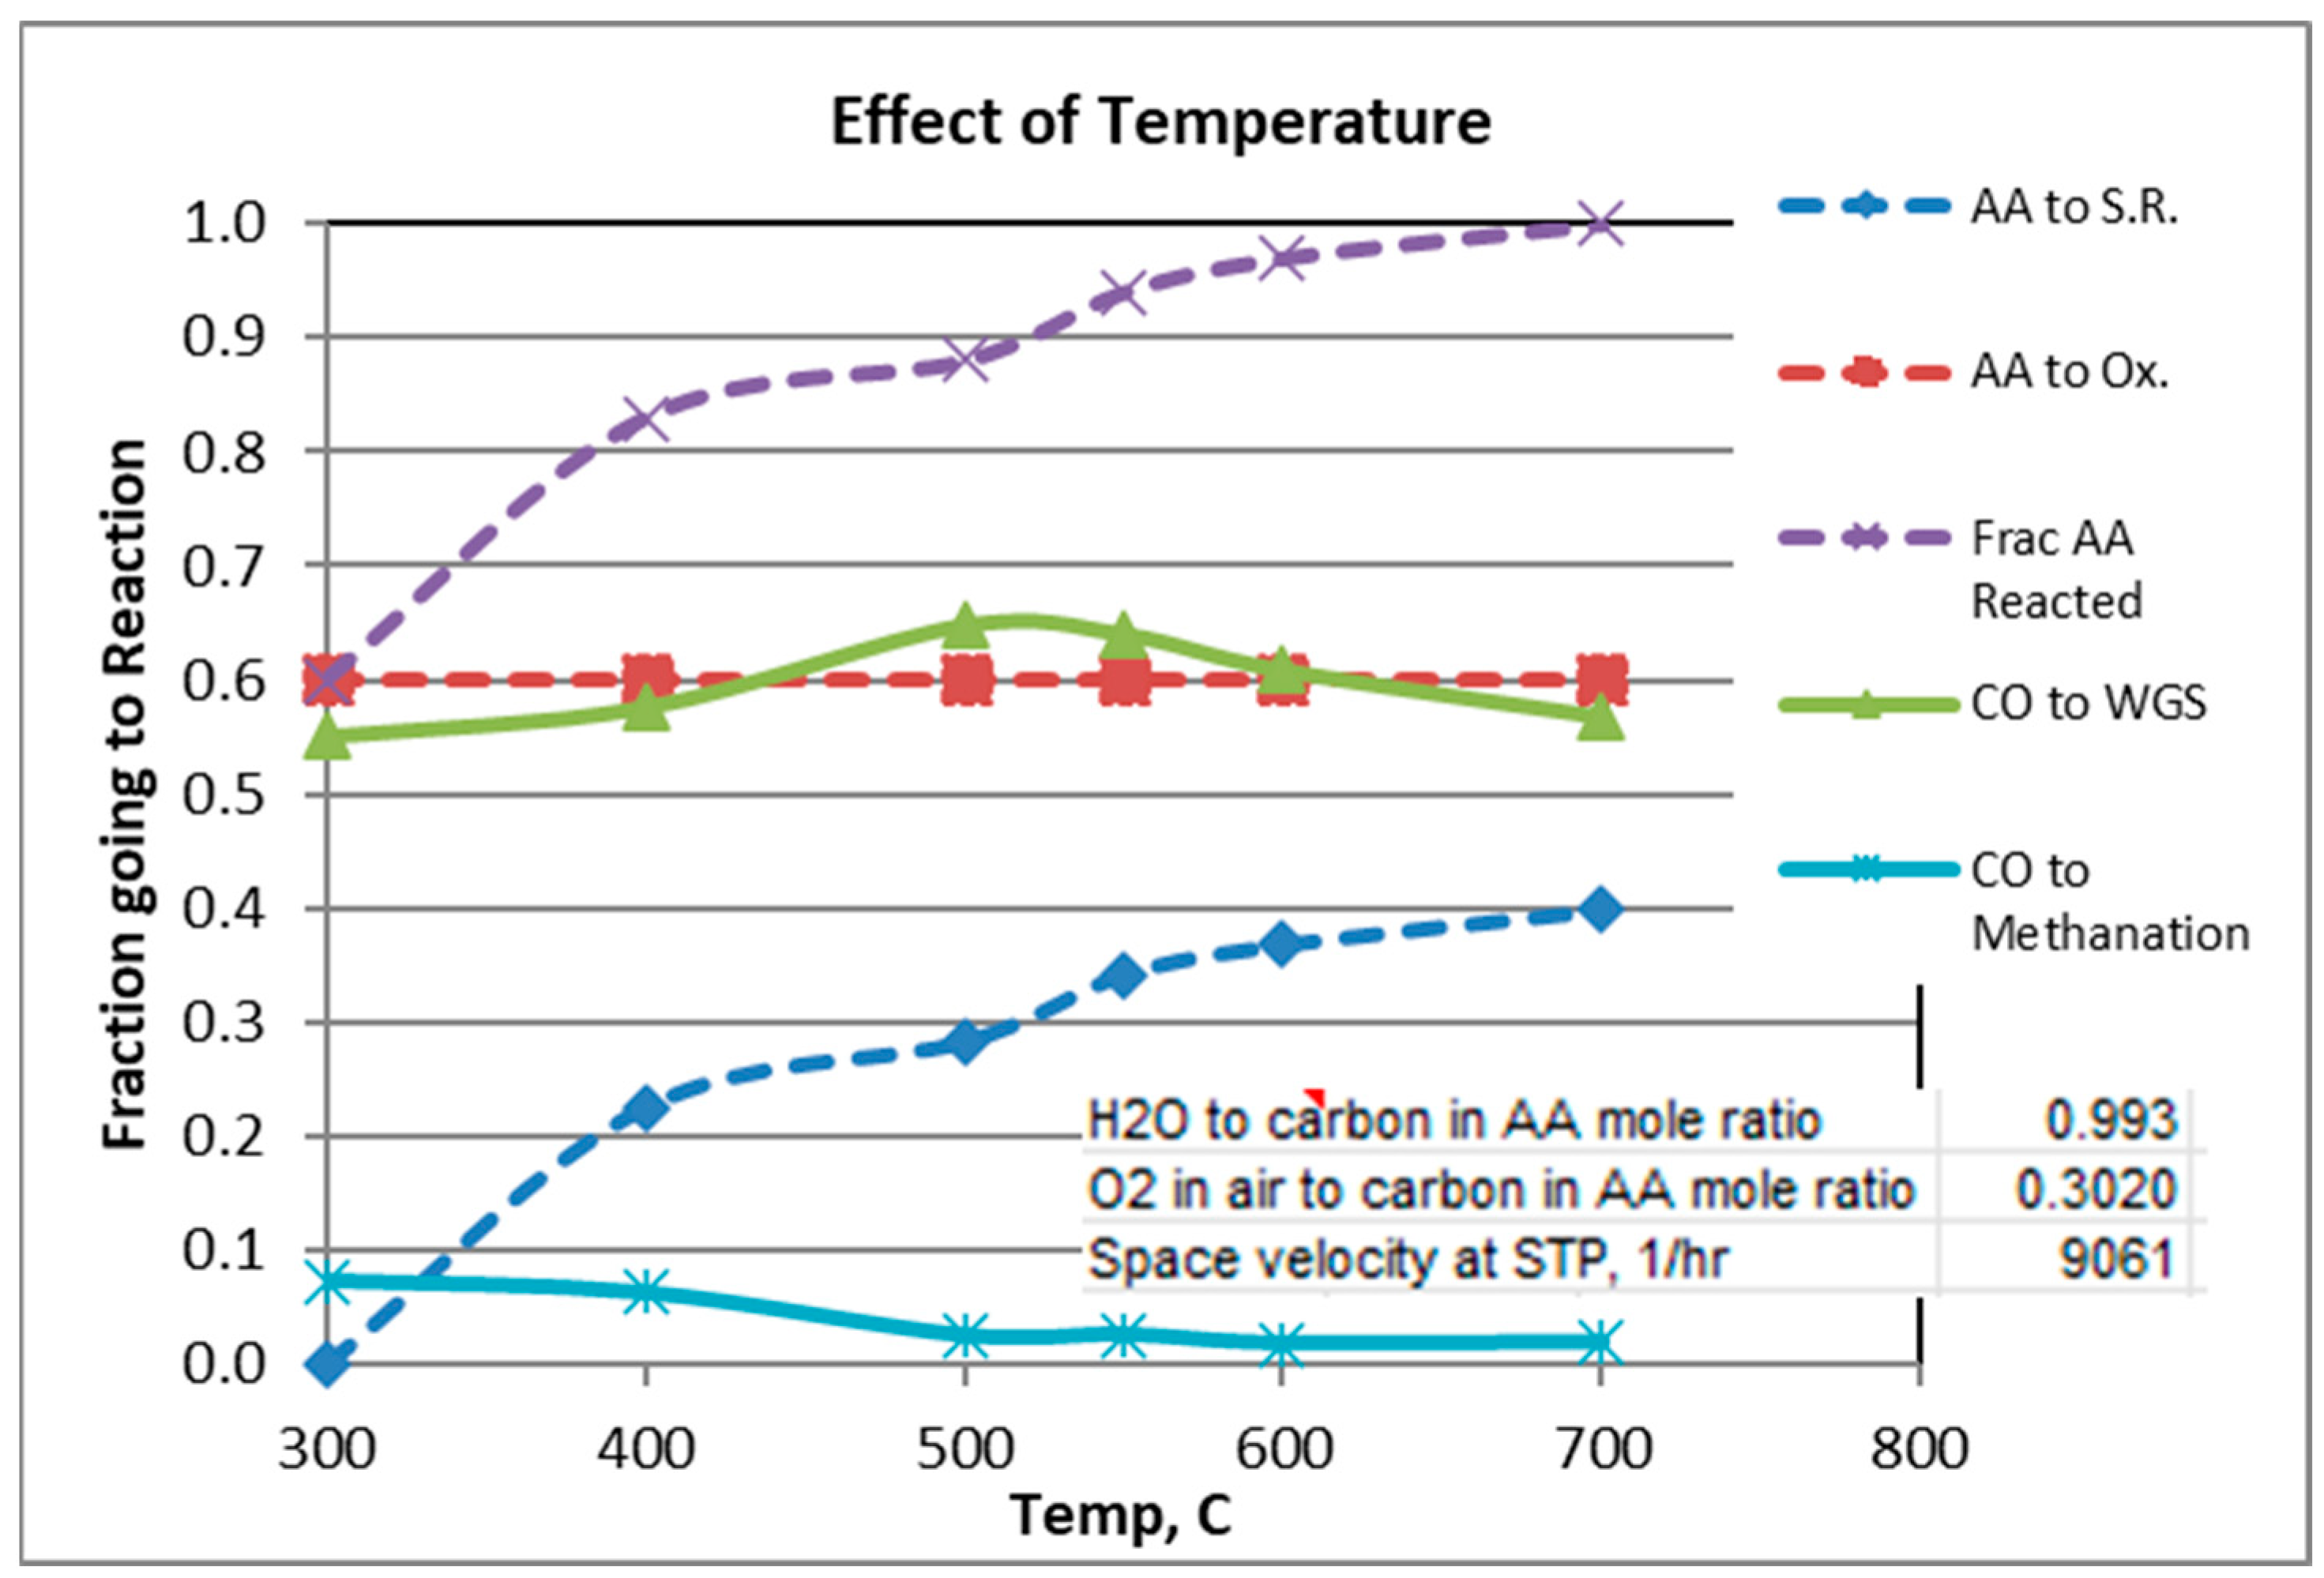
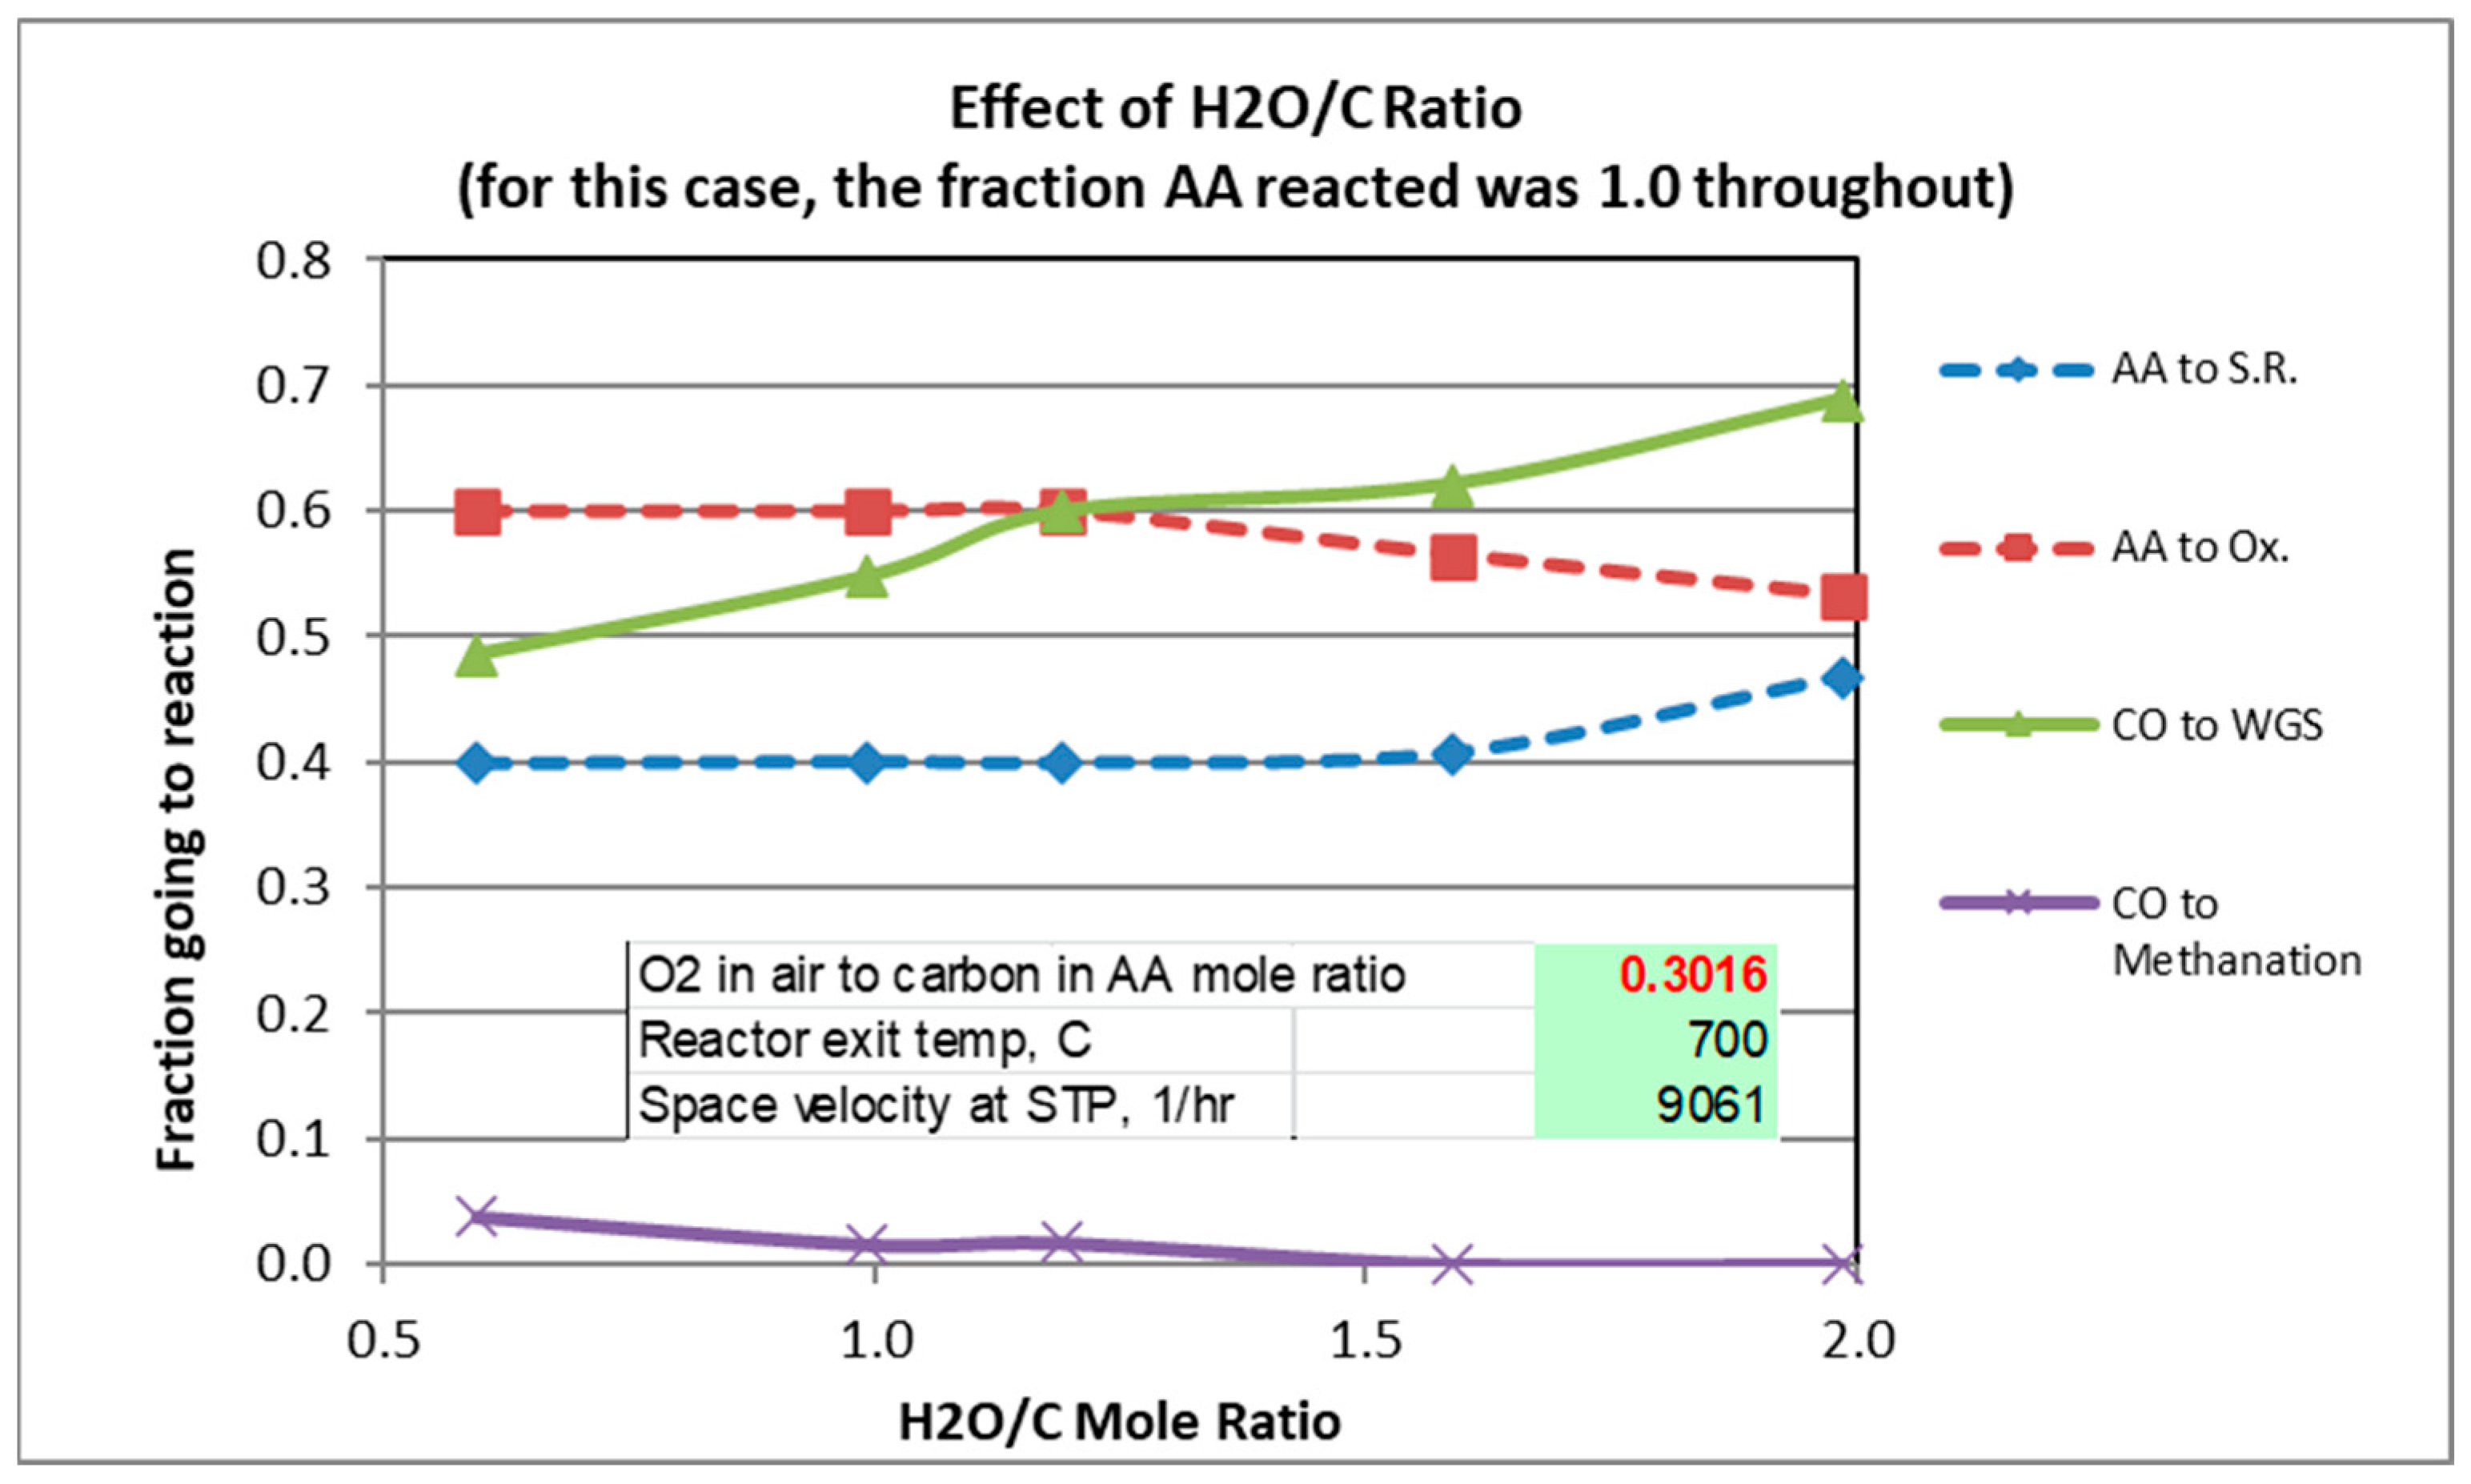
The gas analysis plotted in the graphs are those calculated from Solver. Figure 2, Figure 3 and Figure 4 show experimental results for the factors fi (Equations (1)–(5)) for scans of temperature, H2O/C mole ratio, and O2/C mole ratio. The reverse Boudouard reaction, which produces carbon coking, was not found to occur, except for the runs in which the temperature was 300 °C and 400 °C. For these runs, the fractions of CO which went to the Boudouard reaction were 0.12 and 0.02, respectively.
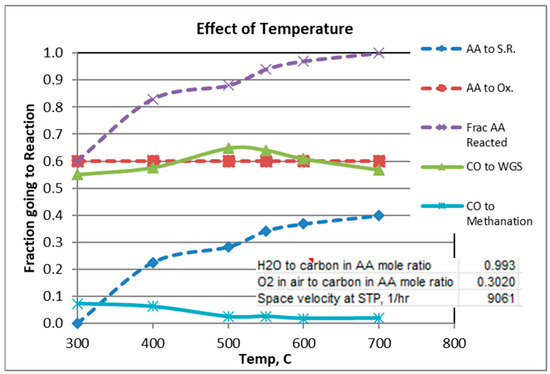
Figure 2.
Effect of Temperature.
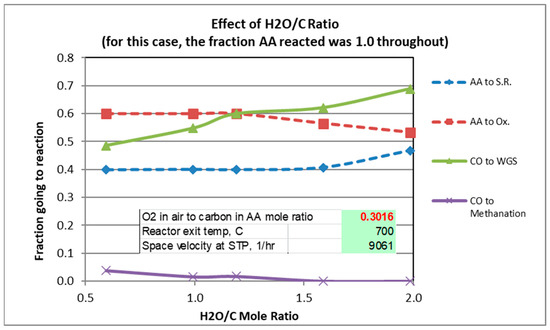
Figure 3.
Effect of H2O/C Ratio.
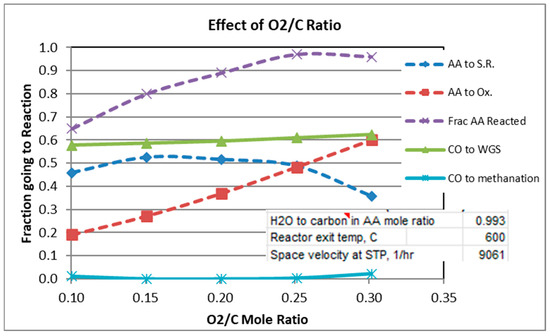
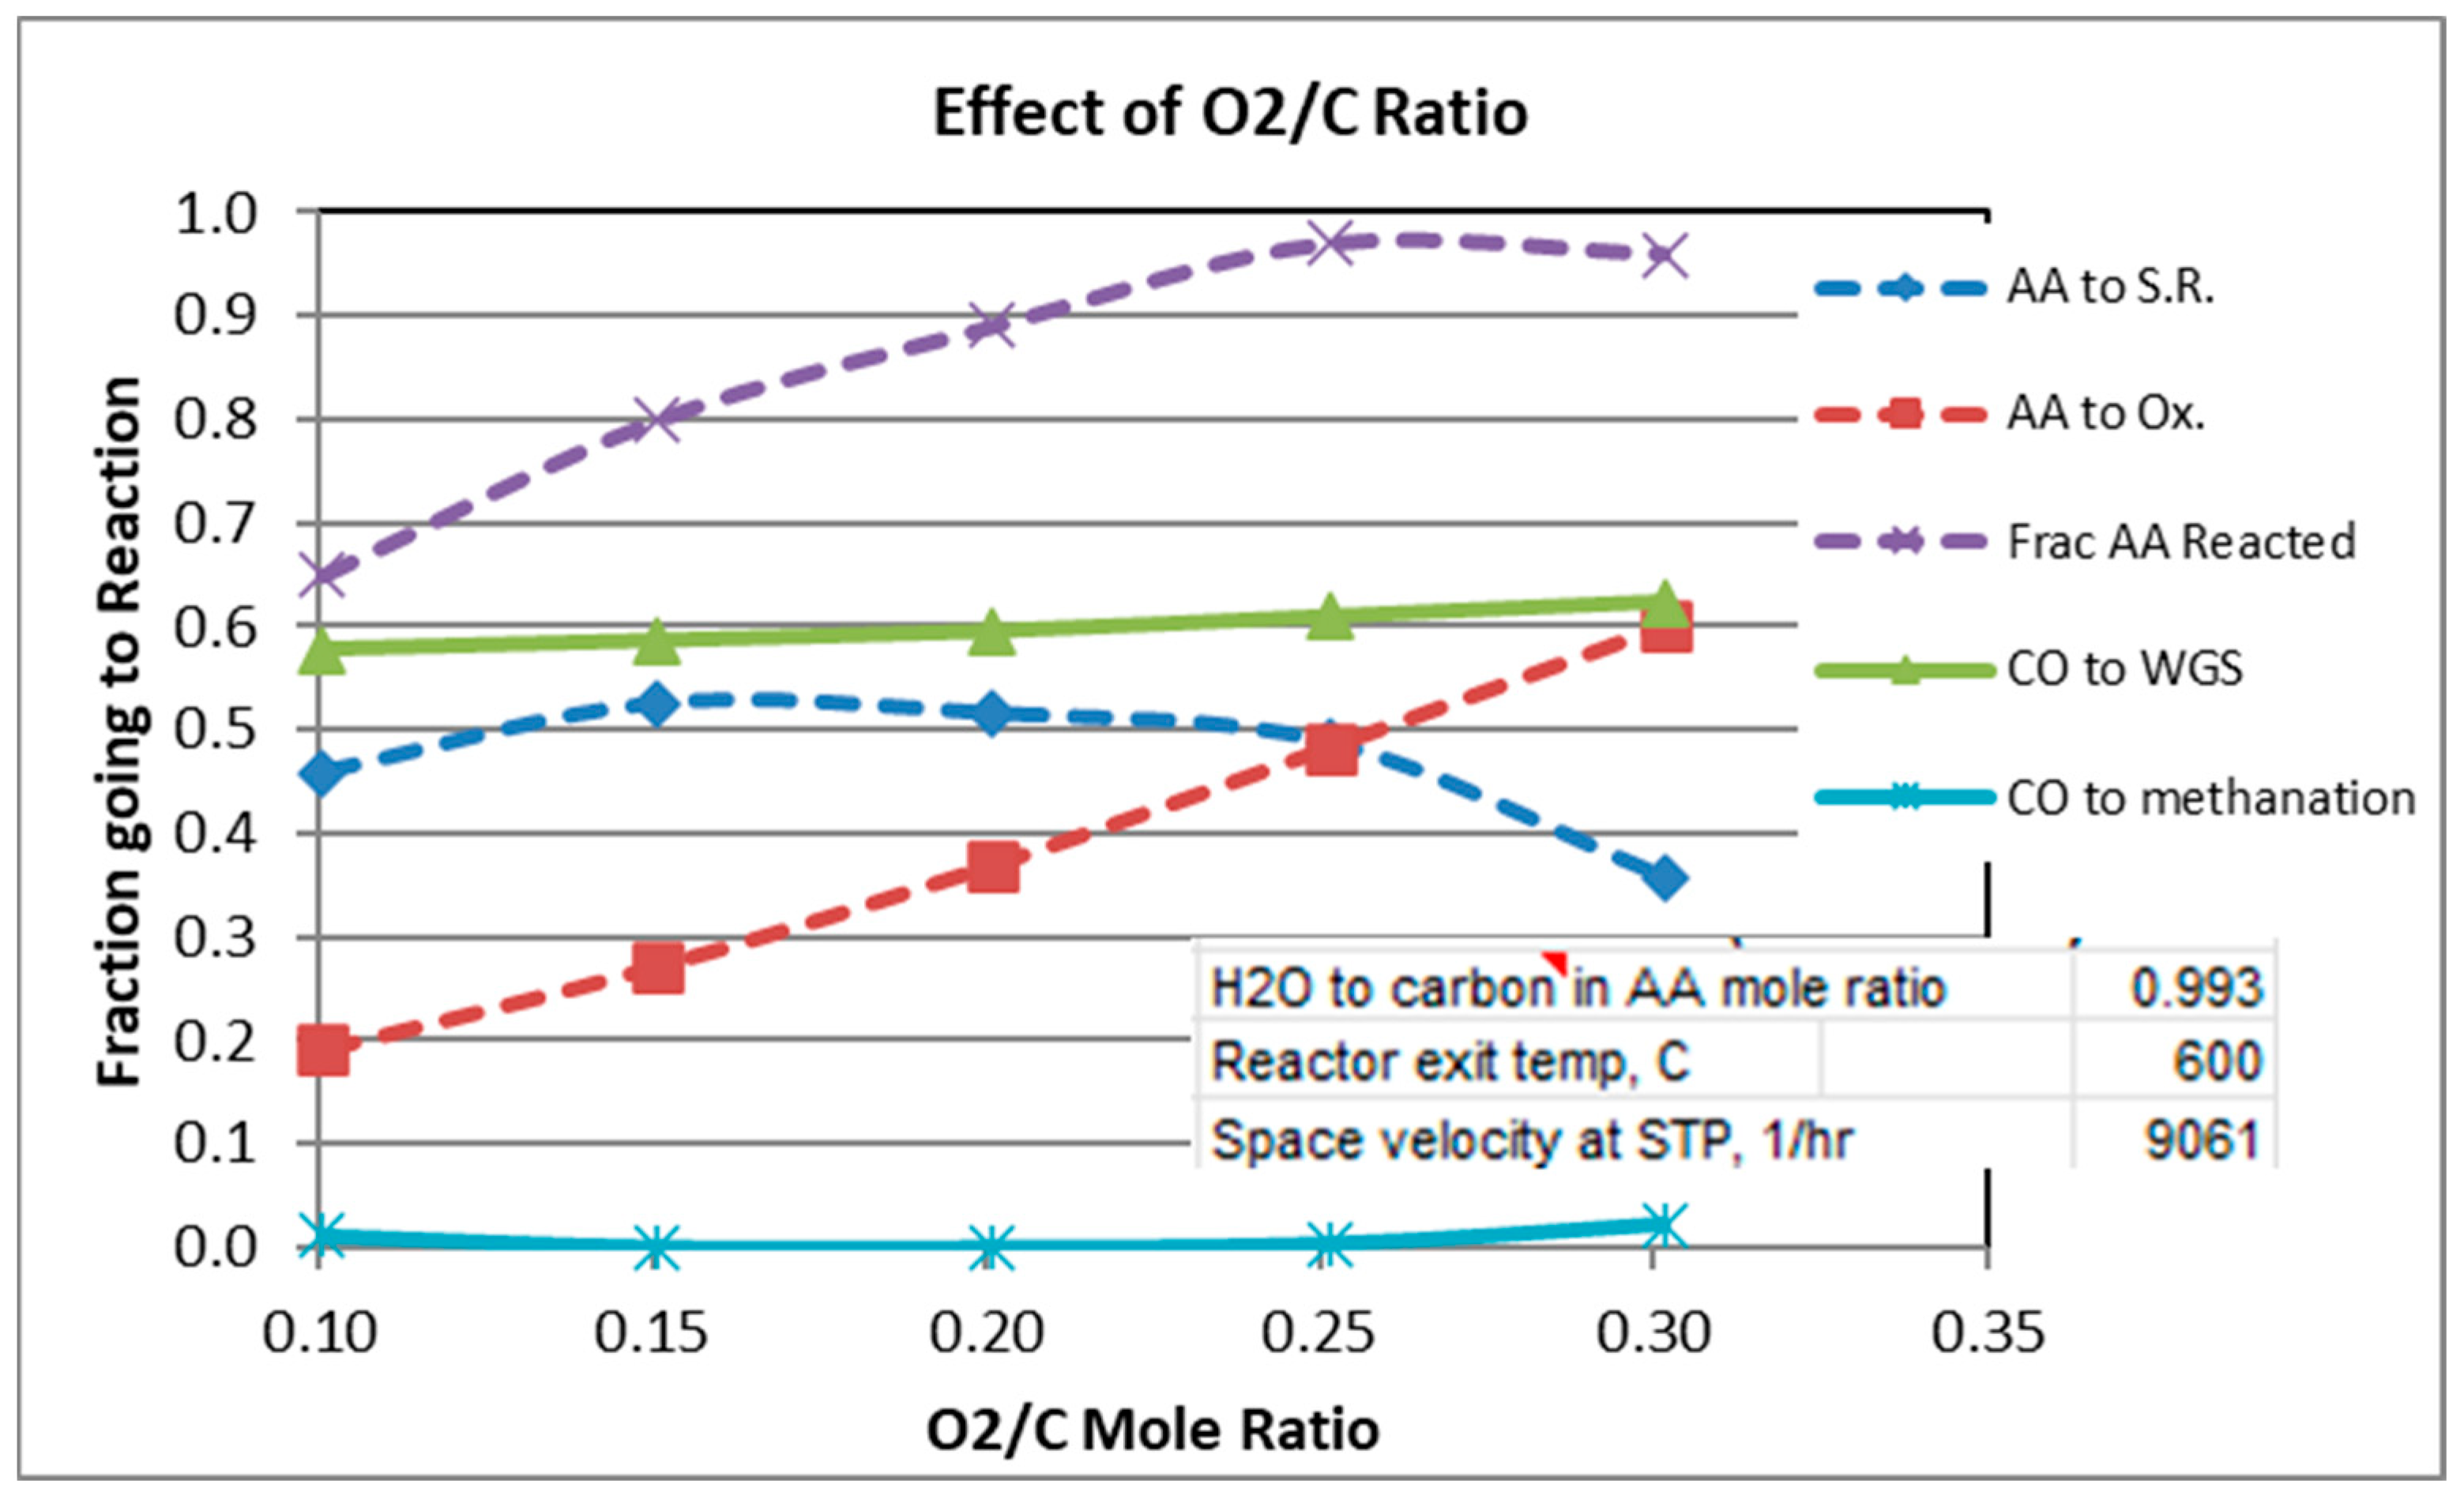
Figure 4.
Effect of O2/C Ratio.
Figure 2 shows that a temperature of at least 600 °C is needed to obtain >95% conversion of AA. In order to guarantee high AA conversion for the scans of H2O/C and O2/C, temperature was held constant at 600 °C or 700 °C, respectively (see Figure 3 and Figure 4).
For a mole ratio of O2/C of 0.302, Figure 2 and Figure 3 indicate that the fraction of AA consumed by the oxidation reaction is typically 0.52 to 0.6 for the conditions considered. Figure 4 shows, not surprisingly, the strong dependence of the extent of AA going to oxidation as a function of the O2/C ratio. Also note from Figure 4 that at 600 °C and O2/C mole ratio of at least an 0.25 is needed to react at least 95% of the acetic acid (at 600 °C).
4.4. Comparison of Experimental to Equilibrium Gas Compositions
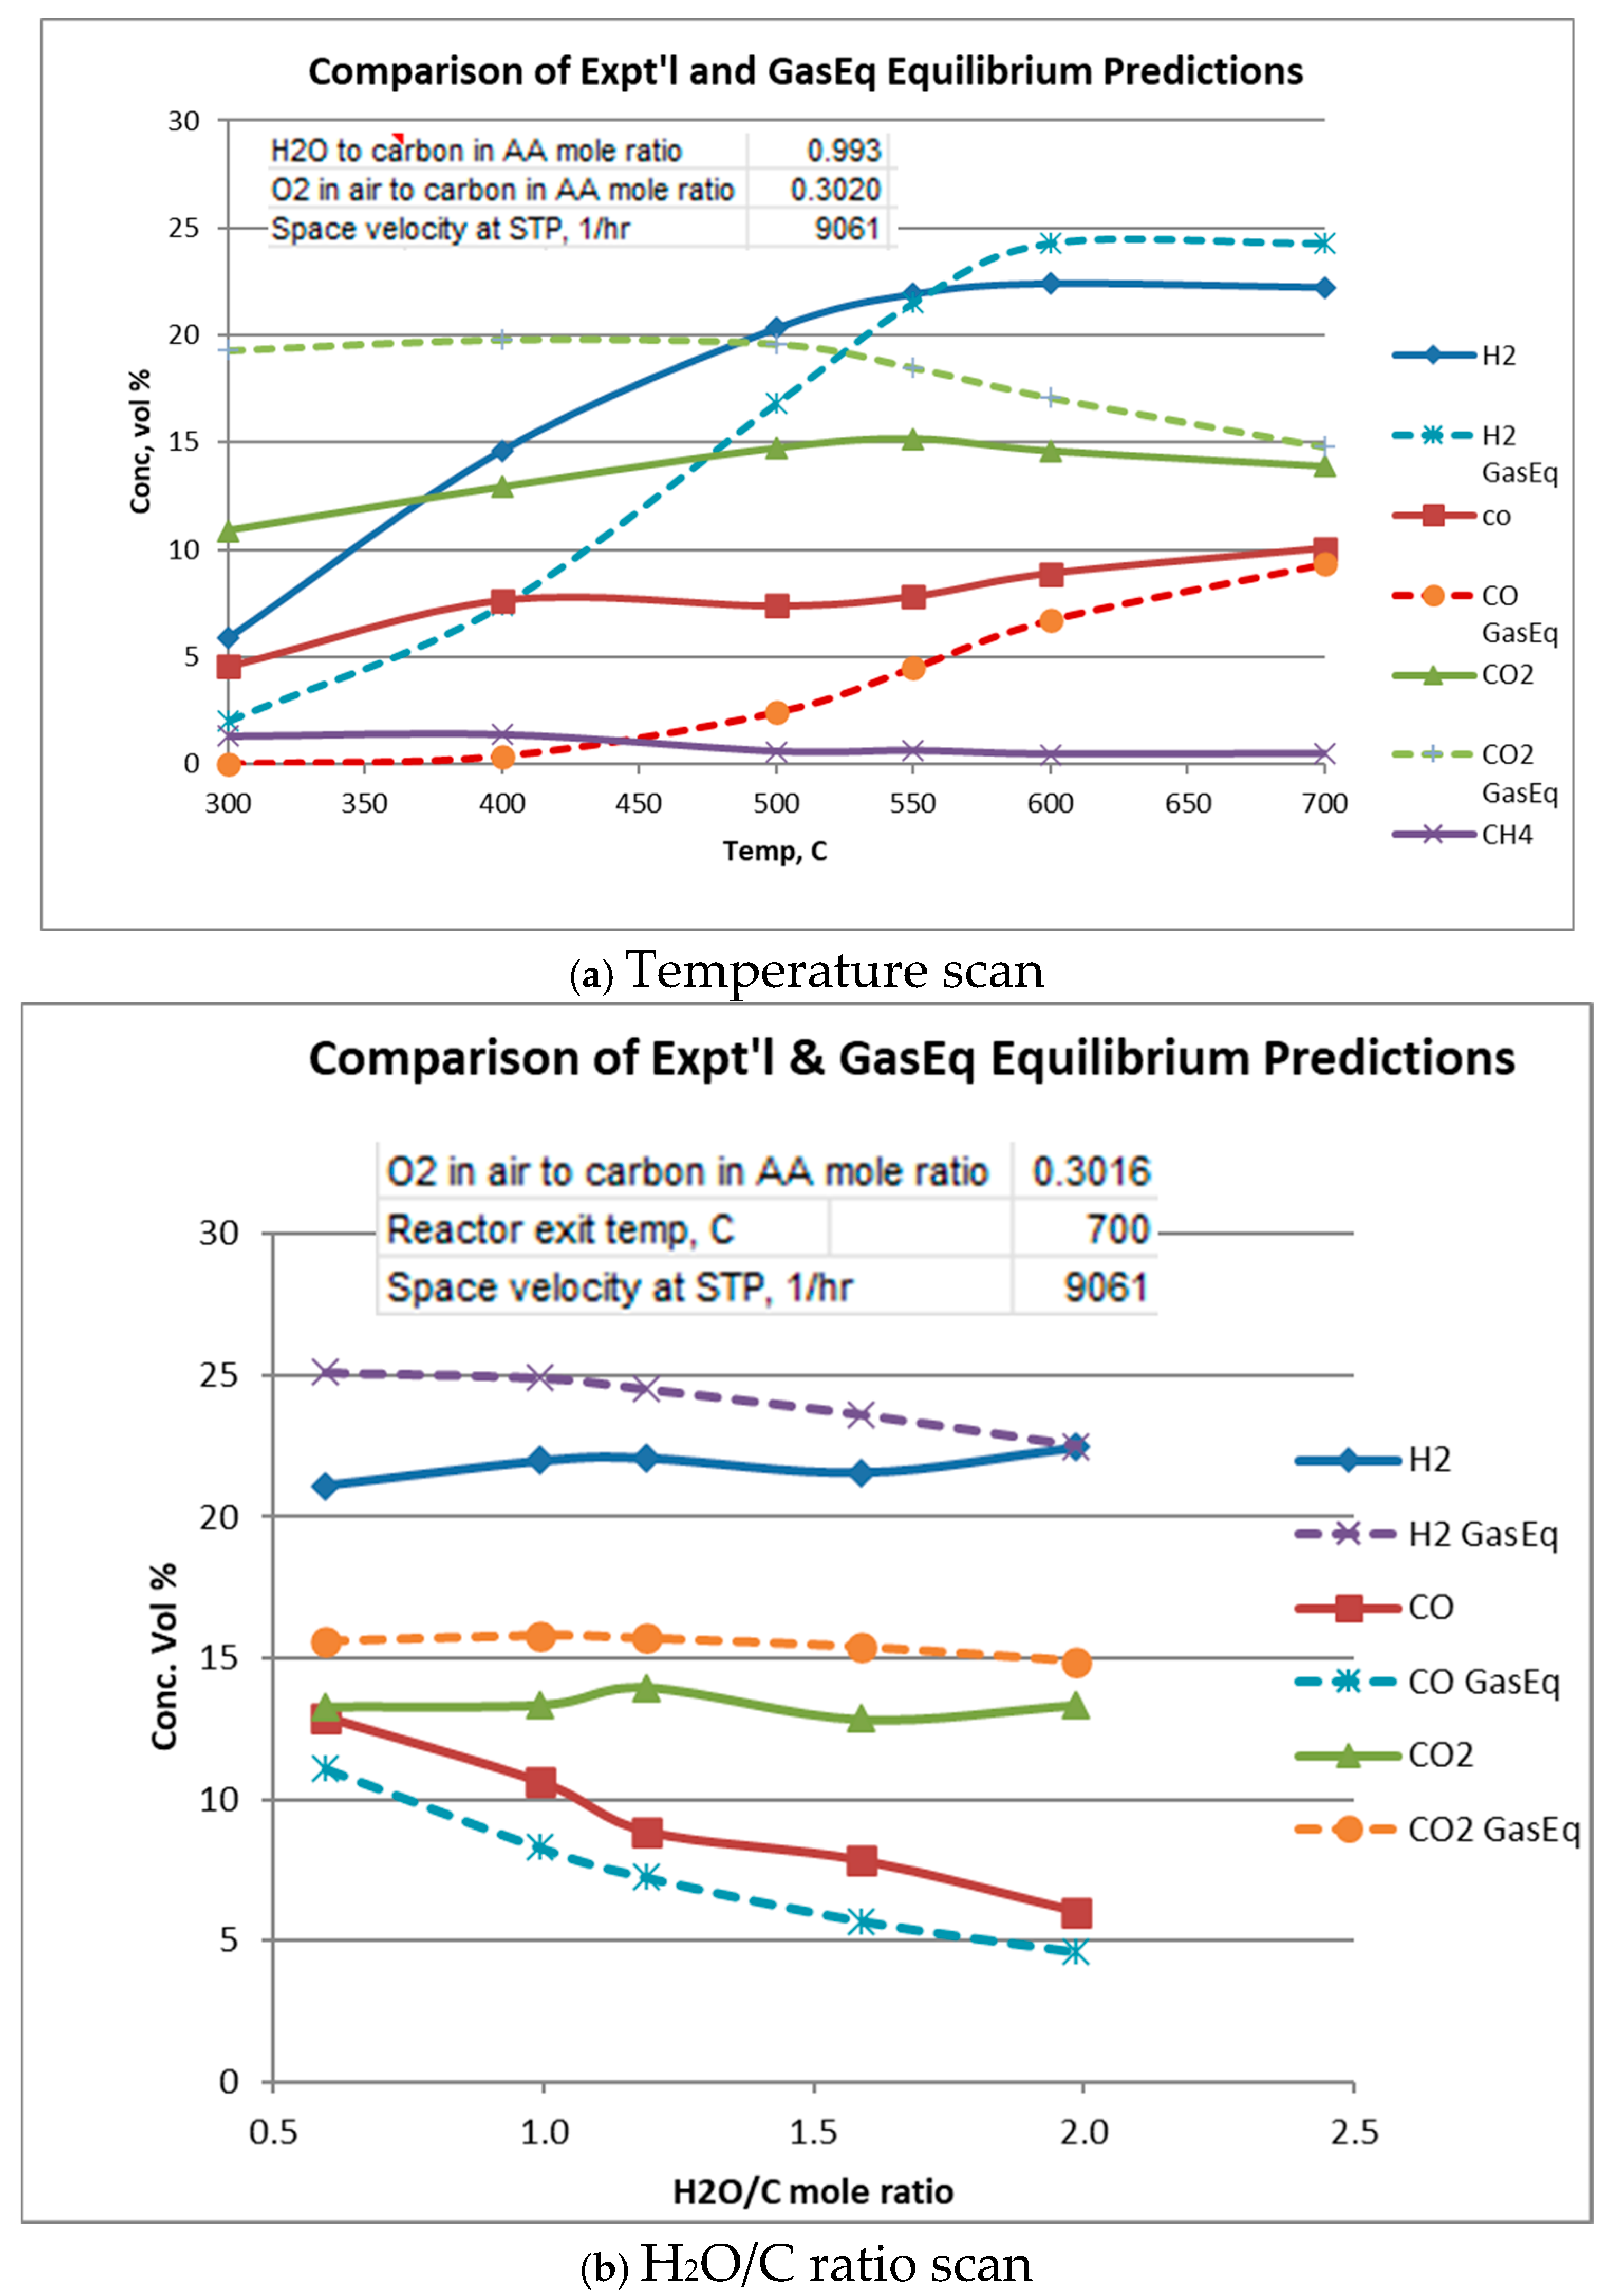
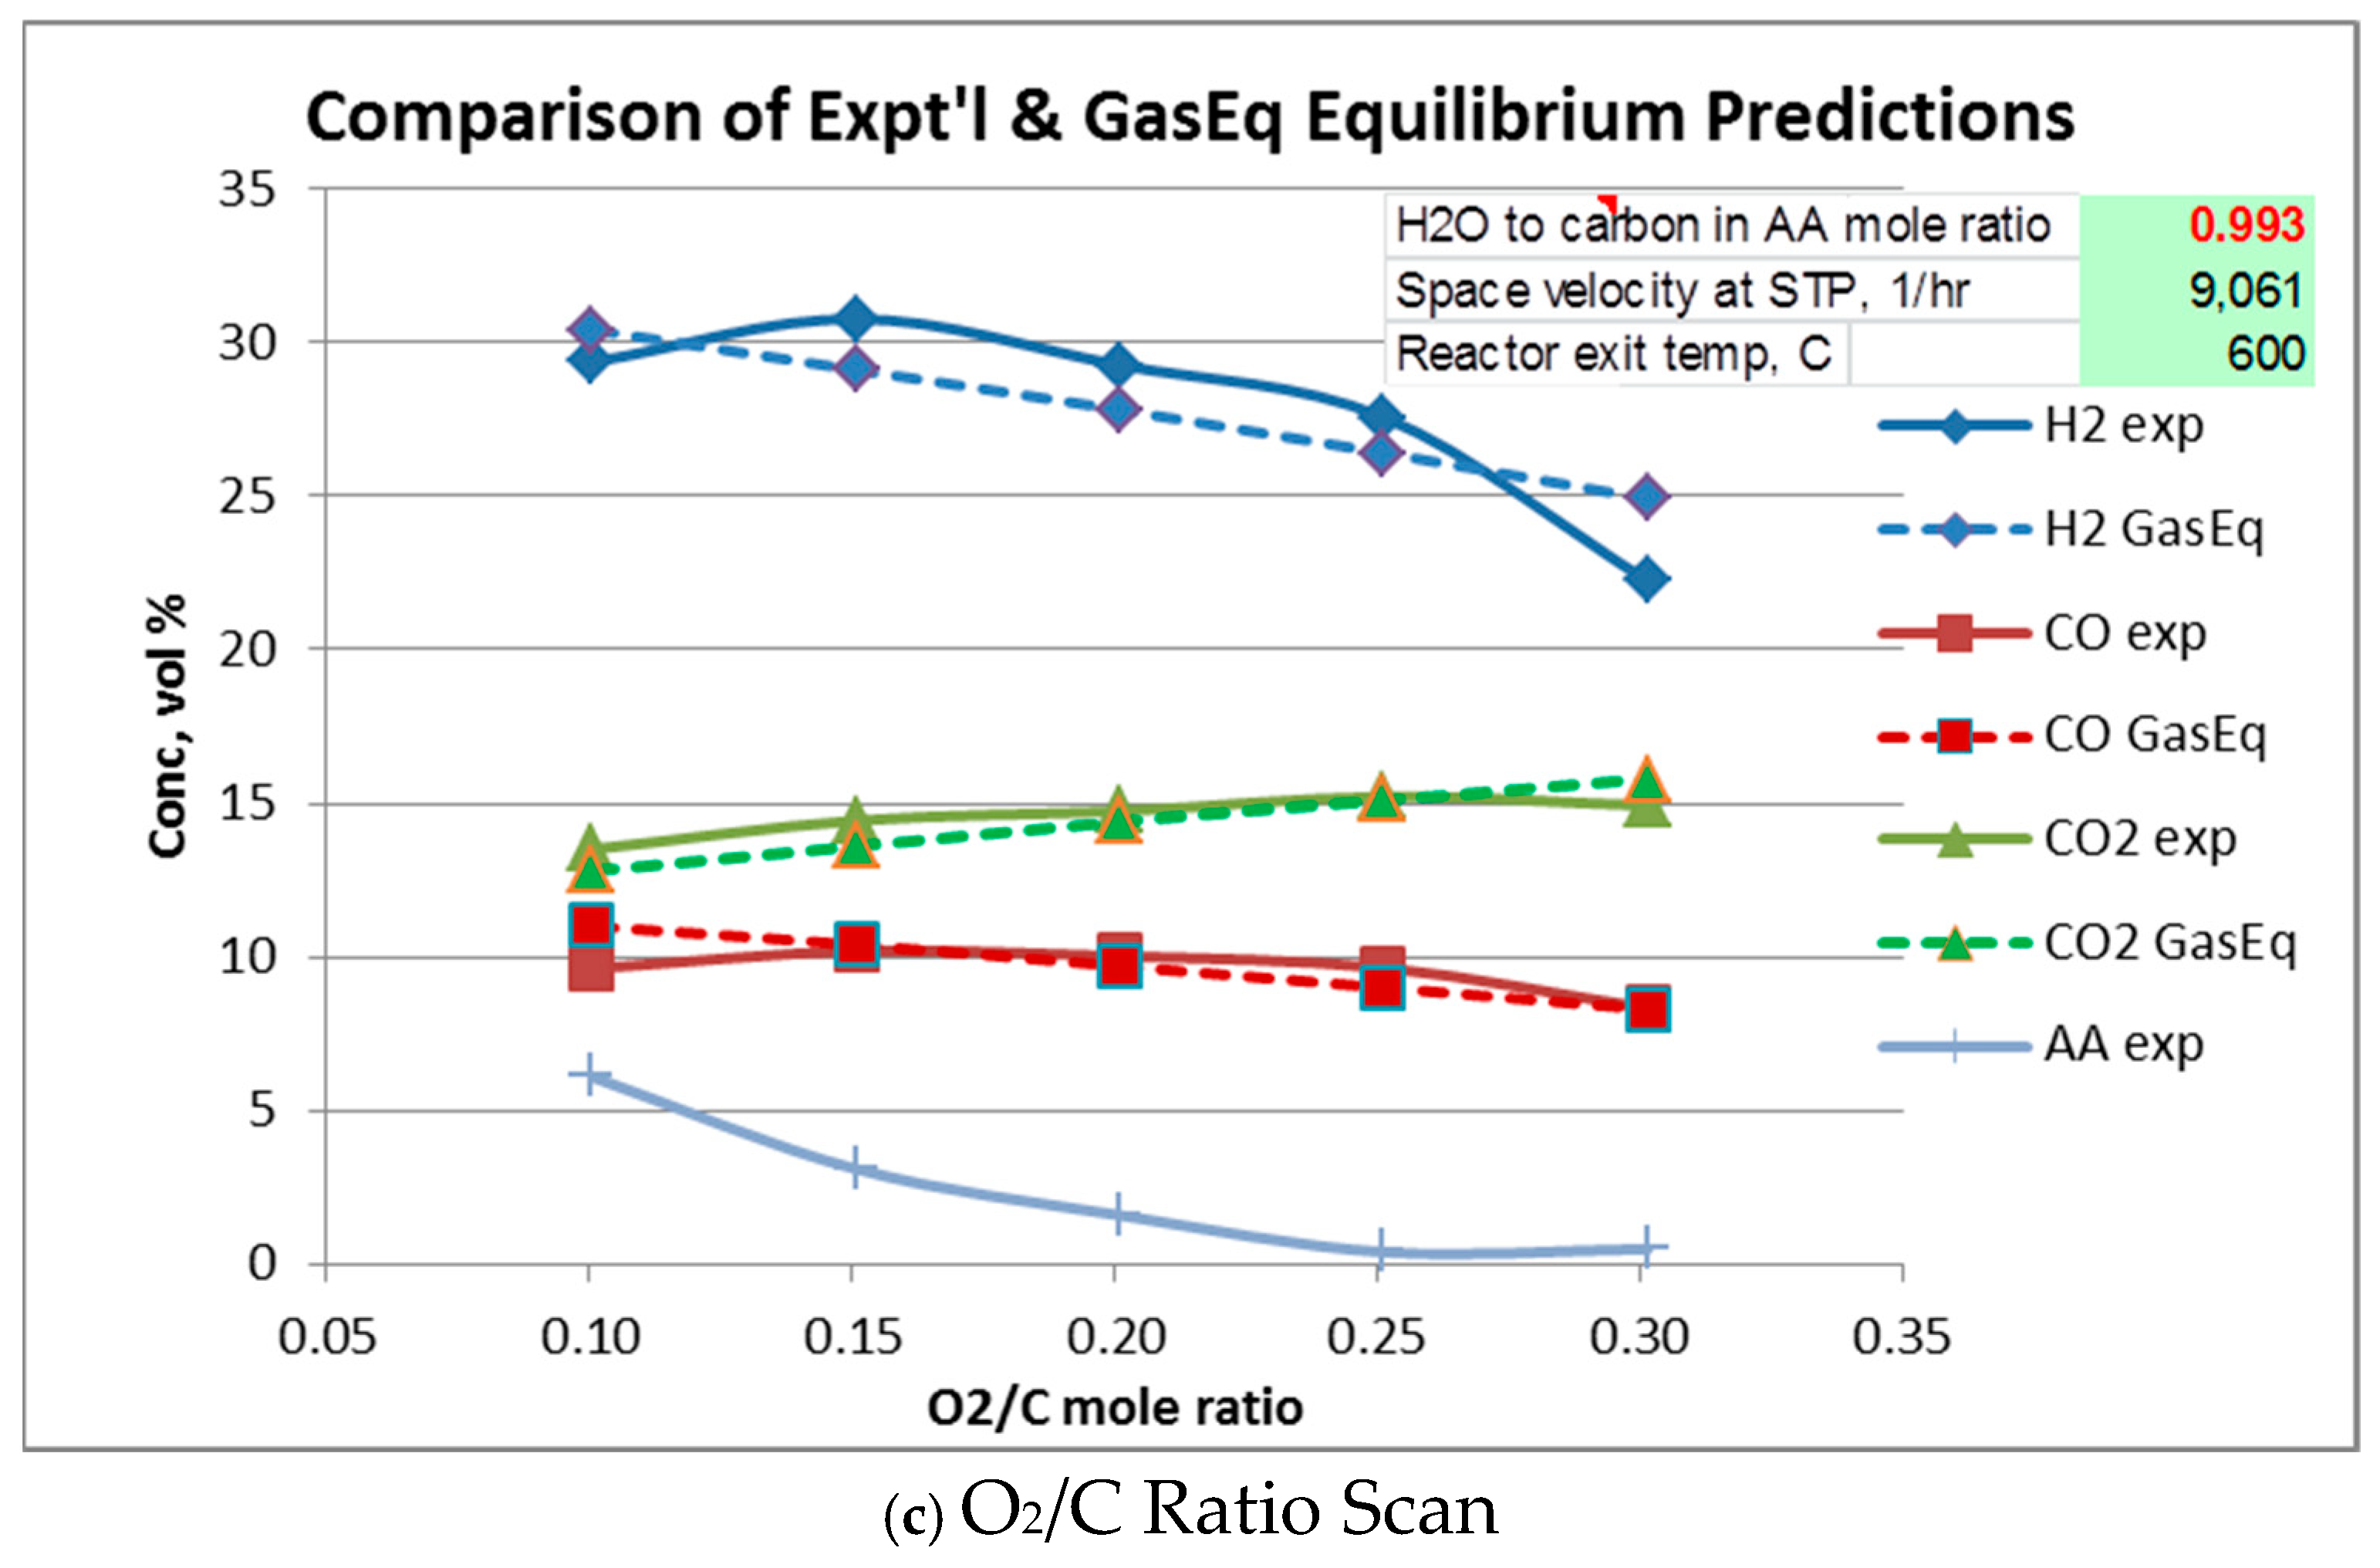
Equilibrium gas compositions for each operating condition were calculated from Gaseq [14]. Comparison of experimental with equilibrium compositions are shown in Figure 5a–c. In these figures, Gas composition is given “as-is”, i.e., in the presence of water vapor, N2, and acetic acid. Water vapor and N2 are not plotted. In all cases, acetic acid at equilibrium is predicted to be completely reacted so its equilibrium value throughout is zero.
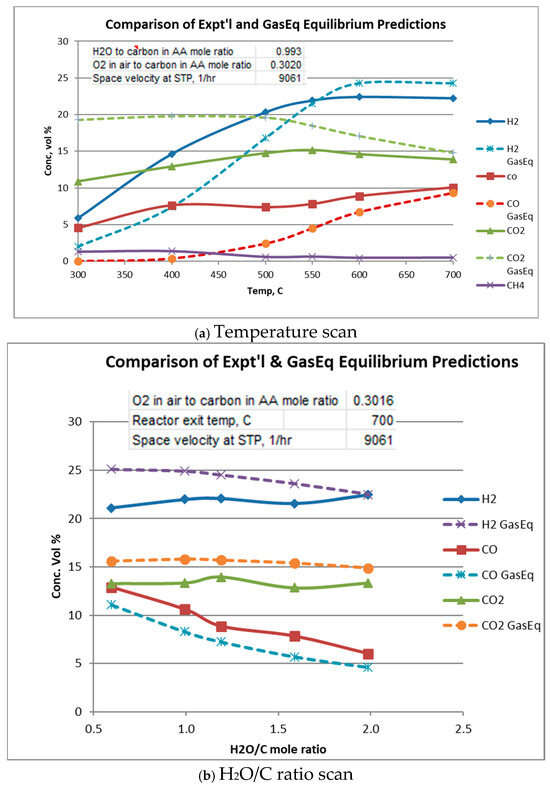
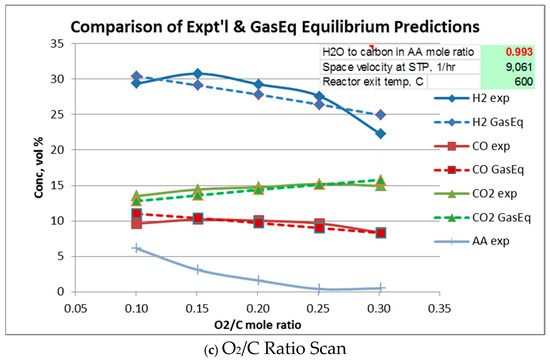
Figure 5.
Comparison of experimental and equilibrium exit gas composition.
Figure 5a plots experimental and equilibrium gas compositions as a function of temperature for the indicated space velocity and H2O/C and O2/C ratios. From Figure 5a it is seen that at low temperatures, H2 and CO concentrations are higher than their equilibrium values, while CO2 and CH4 concentrations are lower than equilibrium. This suggests that the “subsequent” CO and H2 consuming reactions, i.e., water–gas shift, reverse Boudouard, and methanation lag behind the oxidation and reforming reactions. It is also seen that acetic acid is not completely reacted until about 600 to 700 °C, although equilibrium (not plotted) predicts acetic acid to be at zero concentration.
4.5. Calculation of (fi)equil
The equilibrium gas concentrations obtained from GasEq for a set of specific conditions (temperature, H2O/C ratio, and O2/C ratio) are introduced into the Excel spreadsheet. Solver is then used to calculate the fraction of reactant going to reactions 1 through 5 at equilibrium, i.e., (fi)equil. The ratio fi/(fi)equil gives the extent approach to equilibrium for the given reaction, where fi is the experimental fraction going to reaction “i”.
For the temperature scan runs (300 °C to 700 °C, see Table 2), the experimental fi factors are compared with those that were calculated from the equilibrium gas composition, (fi)equil. Table 4 gives the results. For example, for T = 400 °F, for the reforming reaction f1 = 0.23 (see Table 2) and for the equilibrium gas composition, (f1)equil = 0.40, so that the approach to equilibrium for the reforming reaction, reaction 1, is 0.23/0.40 = 0.58 or 58%. For the oxidation reaction, Equation (2), at any of the temperatures in the range 300–700 °C, the calculated f2 = 0.6 but it is also found that (f2)equil = 0.6, so that f2/(f2)equil = 1.0 or the extent of approach to equilibrium of the oxidation reaction is 100%. In fact, the oxidation reaction goes to completion, completely consuming the limiting reagent, oxygen, over the temperature range 300–700 °C.

Table 4.
Approach of reaction to equilibrium (expressed as %), 100fi1/(fi)equil for temperature scan runs in which total H2O-to-carbon-in-AA mole ratio = 0.993; O2-in-air-to-carbon-in-AA mole ratio = 0.3020; space velocity at STP, 1/h = 9061.
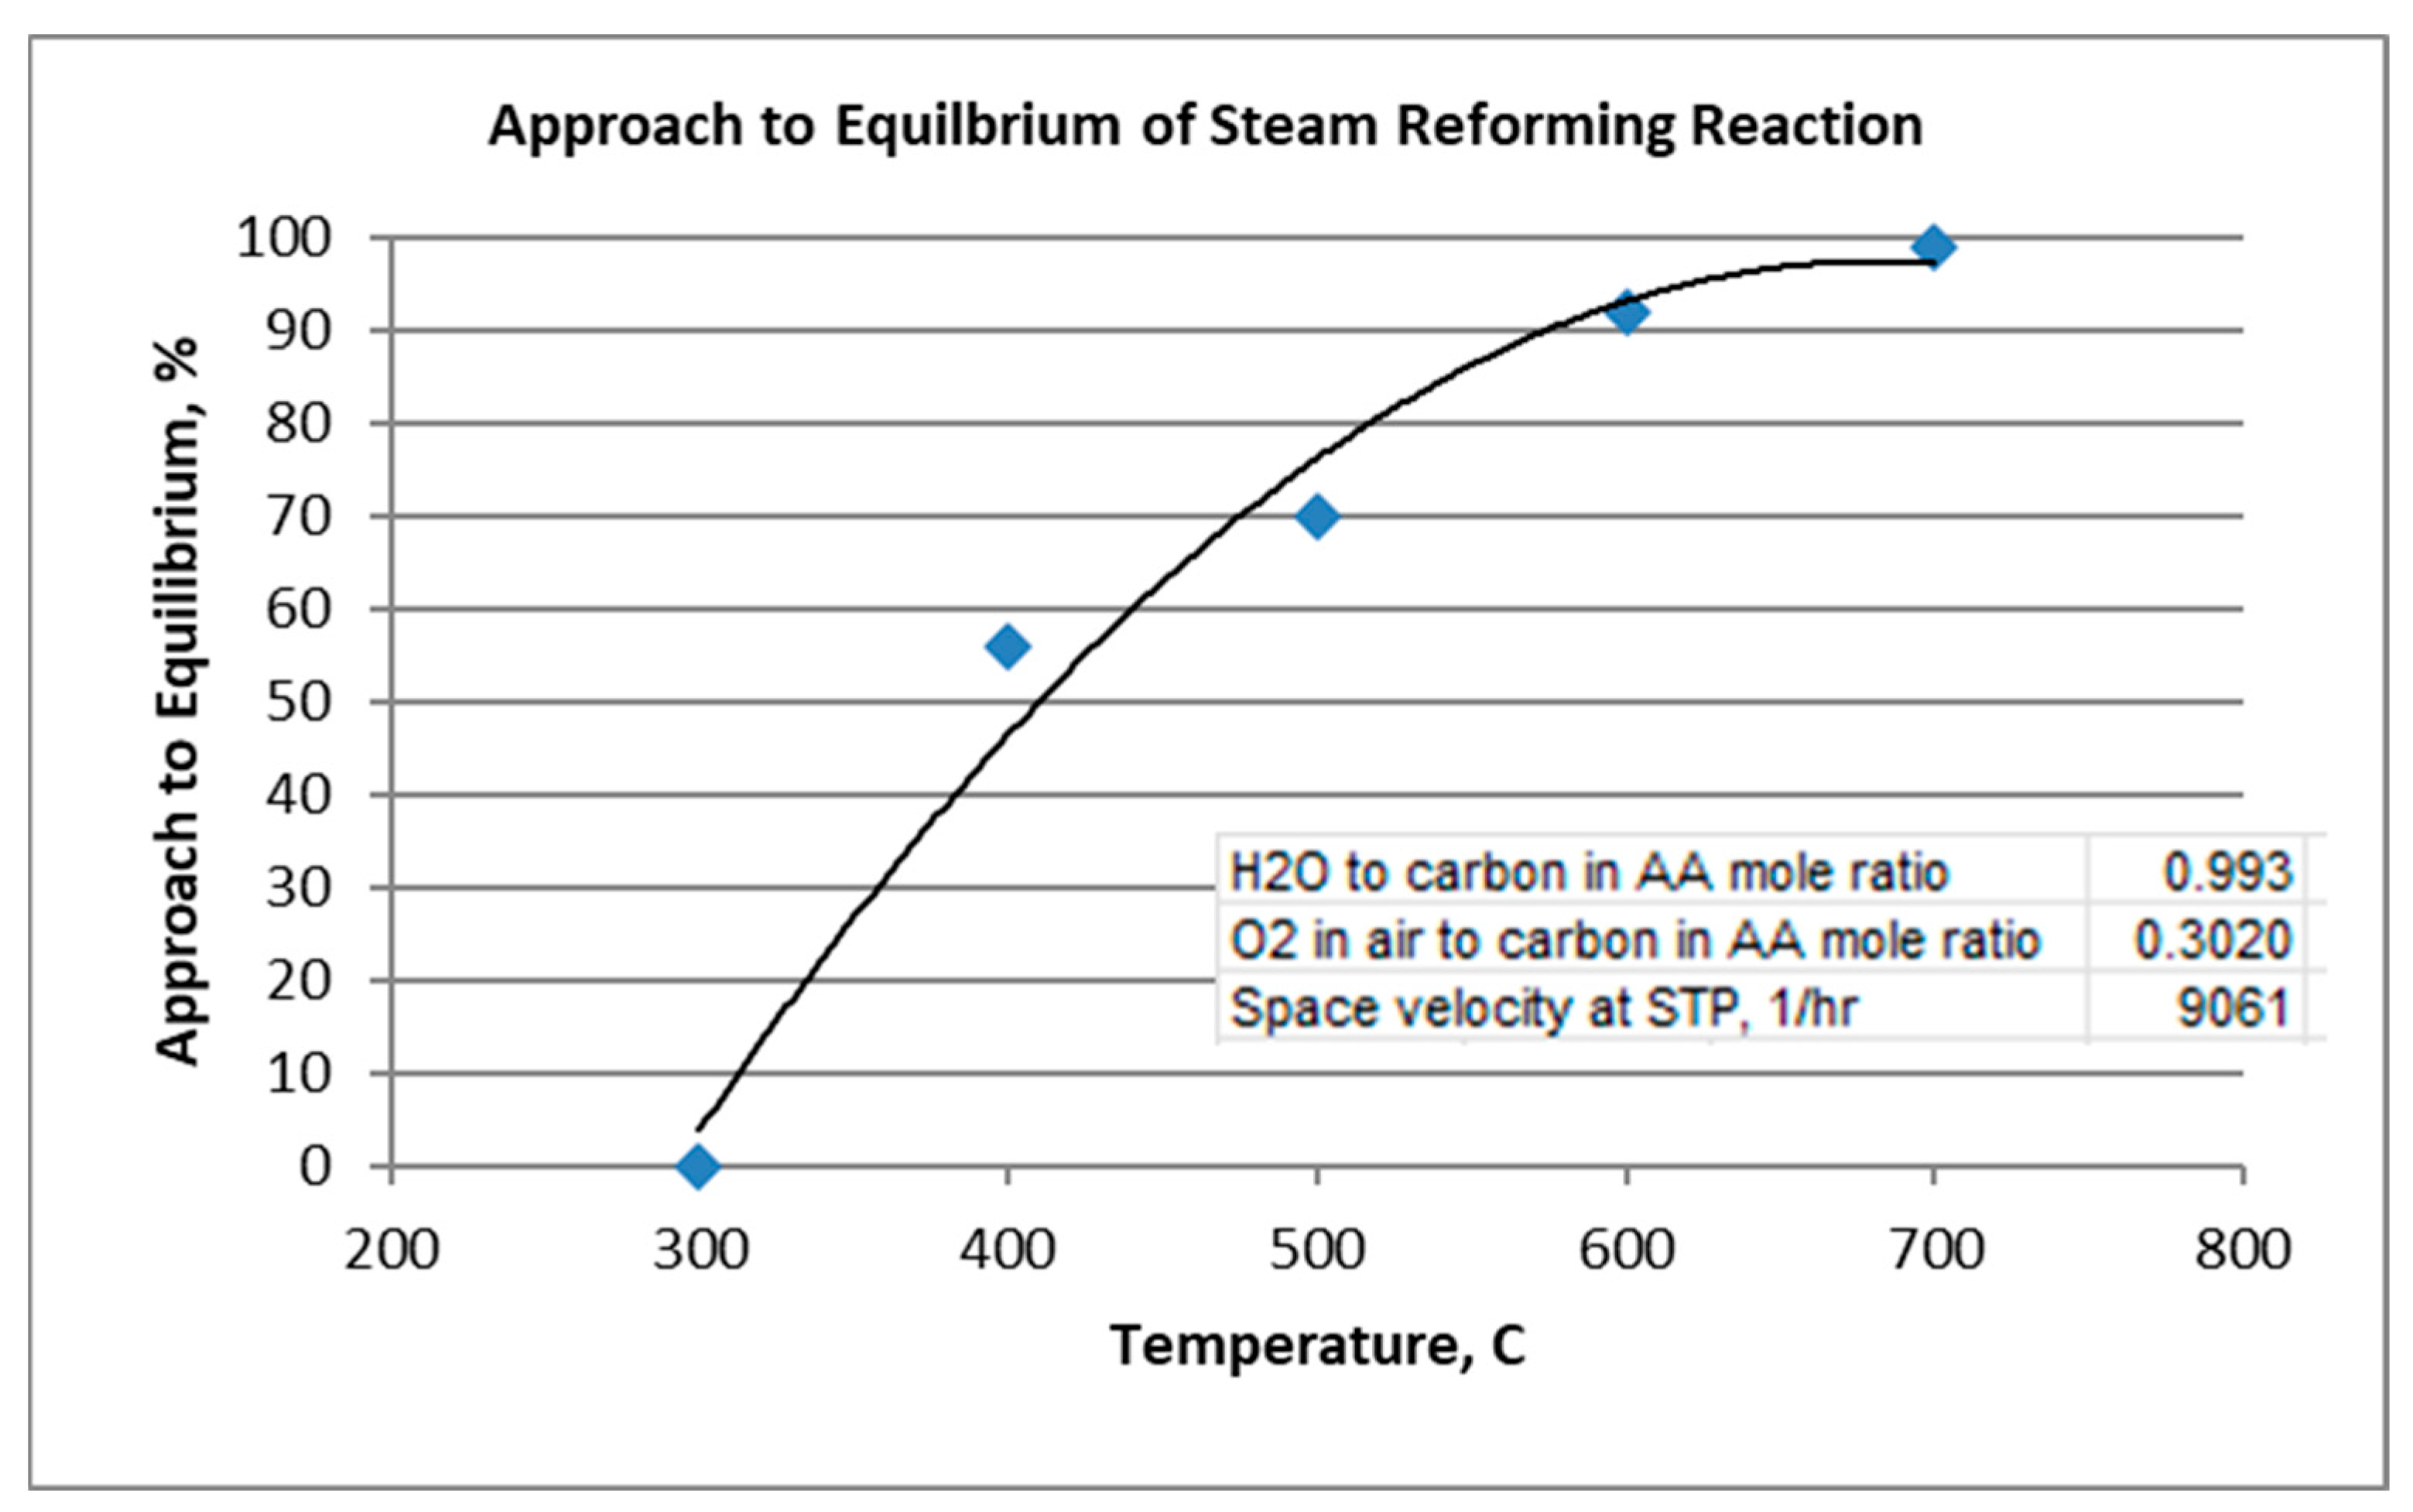
For the given conditions, note that steam reforming reaction, Equation (1), requires at least 600 °C to approach equilibrium. As mentioned, the oxidation reaction, Equation (2), goes to equilibrium throughout the temperature range. The water–gas shift reaction, Equation (3), appears to approach equilibrium to the extent of 71–90% throughout the temperature range. As the reverse Boudouard reaction is favored at lower temperatures, coking was predicted and found at the low temperature of 300 °C. More coking was experimentally indicated than predicted by equilibrium, resulting in an extent of approach to equilibrium greater than 100%. At 400 °C and above, no coking was predicted at equilibrium, although indicated experimentally at 400 °C.
The approach to equilibrium of the steam reforming reaction is plotted in Figure 6.
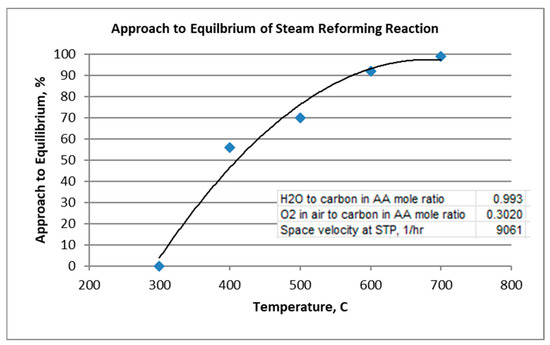
Figure 6.
Approach to Equilibrium of Steam Reforming Reaction.
In summary, these results indicate that the oxidation catalyst of the dual-layer BASF catalyst is functioning at equilibrium over the temperature range. Also, the WGS reaction occurs to a reasonable extent over the temperature range. Methane production is reasonably suppressed. This analysis shows that the catalyst for the reforming reaction, which produces H2, should be improved or space velocity reduced if operation at temperatures lower than 600 °C is desired. The data also suggest that the effect of space velocity (i.e., residence time) should be examined in the low-temperature region (300–500 °C). With a low enough space velocity, it may be possible to operate at 400 °C. This could have implications for extended catalyst life.
5. Conclusions
5.1. General
- A method of determining the fraction reactant going to a component reaction of an overall reaction has been outlined.
- Using this method and knowledge of the theoretical equilibrium composition, it is possible to determine the approach of the component reactions to equilibrium.
- This method can be used to check for data consistency.
- Of course, as complete as possible a roster of the important constituent reactions needs to be included in the analysis.
5.2. Specific to the ATR of Acetic Acid (for the Experimental Space Investigated)
- 5.
- A temperature of at least 600 °C is needed for a significant level of the steam reforming reaction, Equation (1), to occur. This is contrasted with the oxidation reaction, Equation (2), which goes to completion of the limiting reagent, oxygen, over the temperature range 300–700 °C.
- 6.
- If the temperature is in the range 600–700 °C, 40 to 50% of the AA goes to the steam reforming reaction, Equation (1), with a >90% approach to equilibrium.
- 7.
- Of the CO formed, 70–90% goes to the water–gas shift reaction, Equation (3), with an approach to equilibrium of typically > 80% over the temperature range 300–700 °C.
- 8.
- Coking was predicted to occur at low temperatures. At 300 °C, run #16, coking was experimentally found as well as predicted by equilibrium calculations. The amount of coking experimentally found at 300 C and 400 °C was greater than equilibrium. This could be due to the higher than equilibrium CO concentration at the low temperatures. At 400 C, coking was indicated experimentally but not predicted from equilibrium calculations. Above 500 °C, no coking was indicated experimentally or from equilibrium calculations.
- 9.
- An O2/C mole ratio of at least an 0.25 is needed to react at least 95% of the acetic acid (at 600 °C).
- 10.
- For the limited experimental space investigated for steam reforming of acetic acid with the specific BASF dual-layer catalyst at a space velocity of 9061 1/h (STP), optimum operating condition was found to be 700 °C, H2O/C mole ratio = 1.0, and O2/C mole ratio = 0.30. For this operating condition, the CO yield is 44% and the H2/CO mole ratio is 2.0.
Author Contributions
J.M., concept, write up, calculations; Y.L., concept, experimental; J.H., experimental; B.C., concept, calculations, experimental; A.L., funding, guidance; A.L., funding, guidance. All authors have read and agreed to the published version of the manuscript.
Funding
U.S. DOE Office of Biomass Program (Grant No. DE-FG36-08GO18162) and U.S. Office of Secretary of Defense (through Contract No.W15QKN-05-D-0011-0065).
Data Availability Statement
The original contributions presented in this study are included in the article. Further inquiries can be directed to the corresponding authors.
Acknowledgments
The authors would like to thank the NJCMCS lab at Stevens Institute of Technology for supporting this research and BASF Catalysts LLC for providing the catalysts used in this study. The authors are grateful to Robert J. Farrauto, formerly of BASF LLC, and now at Columbia University, for very helpful discussions and suggestions and also thank Michael J. McCarthy of FMC Corp. for suggesting the format for the material balance.
Conflicts of Interest
The authors declare no conflicts of interest.
References
- Brown, R.C. Thermochemical Processing of Biomass: Conversion Into Fuels, Chemicals and Power; Wiley Series in Renewable Resource; John Wiley & Sons: Hoboken, NJ, USA, 2011; Volume xiv, 330p. [Google Scholar]
- Elliot, D. Historical developments in hydroprocessing bio-oils. Energy Fuels 2007, 21, 1792. [Google Scholar] [CrossRef]
- Larson, E.; Haiming, J. Biomass conversion to Fischer-Tropsch liquids: Preliminary energy balances. In Proceedings of the 4th Biomass Conference of the Americas, Oakland, CA, USA, 29 August–2 September 1999; Elsevier Science, Ltd.: Amsterdam, The Netherlands, 1999. [Google Scholar]
- Laser, M.; Jin, H.; Jayawardhana, K.; Dale, B.E.; Lynd, L.R. Projected mature technology senarios for conversion of cellulosic biomass to ethanol with coproduction of thermochemical fuels, power, and/or animal feed protein. Biofels Bioprod. Bioref. 2009, 3, 231–246. [Google Scholar] [CrossRef]
- Mullen, C.; Boateng, A.A. Chemical composition of bio-oils produced by fast pyrolysis of two energy crops. Energy Fuels 2008, 22, 2104–2109. [Google Scholar] [CrossRef]
- Wright, M.; Brown, R.C.; Boating, A.A. Distributed processing of biomass to bio-oil for subseqent production of Fischer-Tropsch liquids. Biofels Bioprod. Bioref. 2008, 2, 229. [Google Scholar]
- Manganaro, J.; Chen, B.; Adeosun, J.; Lakhapatri, S.; Favetta, D.; Lawal, A.; Farrauto, R.; Dorazio, L.; Rosse, D.J. Conversion of Residual Biomass into Liquid Transportation Fuel: An Energy Analysis. Energy Fuels 2011, 25, 2711–2720. [Google Scholar] [CrossRef]
- Manganaro, J.; Lawal, A. Economics of thermochemical conversion of crop residue to liquid transportation fuel. Energy Fuels 2012, 26, 2442–2453. [Google Scholar] [CrossRef]
- Liu, Y.; Farrauto, R.; Lawal, A. Autothermal reforming of glycerol in a dual layer monolith catalyst. Chem. Eng. Sci. 2013, 89, 31–39. [Google Scholar] [CrossRef]
- Bartholomew, C.; Farrauto, R.J. Fundamentals of Industrial Catalytic Processes, 2nd ed.; John Wiley: Hoboken, NJ, USA, 2006. [Google Scholar]
- Carter, J.; Altman, D. High Temperature Equilibrium. In Combustion Processes; Lewis, B., Pease, R.N., Taylor, H.S., Eds.; Princeton University Press: Princeton, NJ, USA, 1956. [Google Scholar]
- Dorazio, L.; Castaldi, M.J. Autothermal reforming of tetradecane (C14H30): A mechanistic approach. Catal. Today 2008, 136, 273. [Google Scholar] [CrossRef]
- KINTECUS. Available online: http://www.kintecus.com/ (accessed on 26 September 2025).
- Mann, U. Principals of Chemical Reactor Design, 2nd ed.; John Wiley: Hoboken, NJ, USA, 2009. [Google Scholar]
- Gaseq. Available online: https://gaseq.software.informer.com/#google_vignette (accessed on 26 September 2025).
Disclaimer/Publisher’s Note: The statements, opinions and data contained in all publications are solely those of the individual author(s) and contributor(s) and not of MDPI and/or the editor(s). MDPI and/or the editor(s) disclaim responsibility for any injury to people or property resulting from any ideas, methods, instructions or products referred to in the content. |
© 2025 by the authors. Licensee MDPI, Basel, Switzerland. This article is an open access article distributed under the terms and conditions of the Creative Commons Attribution (CC BY) license (https://creativecommons.org/licenses/by/4.0/).

