1. Introduction
With the continuous and rapid development of China’s economy, energy demand has increased steeply. While China’s oil and gas resource reserves are buried deep, it is extremely difficult to exploit. According to statistics, more than 30% of China’s remaining oil and gas is buried in deep layers, which can only be exploited unconventionally. The amount of recoverable oil and gas resources is three times that of conventional oil and gas resources [
1]. Oil and gas resources located deep underground are often found in complex geological conditions, such as intricate formations, multi-pressure systems, complicated oil–gas–water relationships, steep and high structures, extremely thick composite salt layers, as well as high temperatures and pressures.
These conditions make it challenging to understand and predict reservoir behavior. Additional challenges include issues like drill string getting stuck during drilling, well leakage, overflow, stuck drills, broken drilling tools, and other frequent, complex underground accidents. Moreover, since the drill bit operates underground, it is impossible to directly observe its working conditions or the structure of the surrounding rock layers. The formation is complex, with varying rock, gas, and liquid layers. Ultimately, all these factors elevate safety risks and costs. Regulators mandate real-time monitoring plans for critical drilling operations to ensure safety. In this context, the ability to measure downhole drilling parameters continuously and analyze them at the surface is crucial for proactive risk mitigation. Emerging “intelligent drilling” technologies—including Measurement While Drilling (MWD), Logging While Drilling (LWD), and managed-pressure drilling (MPD)—provide partial solutions by capturing certain downhole parameters and transmitting them via mud-pulse or wired drill pipe telemetry [
2]. However, an integrated system that simultaneously monitors the full suite of mechanical parameters (e.g., torque, bending moment, weight-on-bit) and provides automated risk assessment remains underdeveloped. To address these challenges, it is essential to perform real-time safety monitoring of parameter changes during the drilling process. This allows for the adjustment of drilling parameters based on those changes to ensure safe drilling operations [
3,
4,
5].
This critical endeavor proposed an integrated model that incorporates the underground risk prevention and control system as an effective means to solve complex downhole surface and underground which will help prevent frequent accidents. By collecting various downhole and surface real-time information during the drilling process, we can predict the risks that may occur during the drilling process and provide measures to reduce or eliminate the risks. The downhole module houses multi-parameter sensors on the BHA and near-bit tools, plus onboard electronics for data pre-processing and encoding. The Bottom Hole Assembly (BHA), which is the lower section of the drill string including the drill bit, stabilizers, drill collars, and measurement tools, plays a vital role in transferring weight to the bit, stabilizing the wellbore trajectory, and collecting real-time drilling data. This unit measures nine key parameters (downhole annular and drill string pressure, torque, bending moment, rotational speed, vibration, bit inclination, azimuth, etc.), with real-time power provided by a mud turbine or batteries [
6]. The data are transmitted to the surface in real time using advanced telemetry: we utilize both high-speed acoustic telemetry (e.g., SLB’s Stream technology) and an optional wired drill pipe network [
7]. At the surface, received data enters a preprocessing pipeline that filters noise and interpolates missing samples. The processed data feeds into the second module: a real-time risk prevention optimization machine learning and physics-based models to detect anomalies (stick-slip, surge pressure, lost circulation) and predict impending hazards. The platform provides visual dashboards and automated alarms so rig operators can adjust drilling parameters or activate blowout preventers immediately. Acoustic telemetry and wired drill pipe (WDP) differ fundamentally in performance and cost. WDP offers the highest bandwidth up to several Mbps, low latency, and robust data integrity, making it ideal for advanced applications such as high-resolution seismic-while-drilling, complex downhole automation, or real-time AI-assisted optimization. However, its deployment requires specialized pipe joints, additional rig handling procedures, and significant upfront capital investment, meaning its economic justification is strongest in high-value wells (deepwater, HPHT, or extended-reach projects) where decision quality directly impacts cost and safety.
Acoustic telemetry, by contrast, is much more cost-effective to deploy since it leverages standard drill pipe and downhole tools without requiring specialized infrastructure. It provides moderate data rates, e.g., hundreds of bps to a few kbps, which are sufficient for transmitting key drilling parameters, risk indicators, and processed AI features. The trade-off is that acoustic signals are more susceptible to attenuation and noise, limiting range and bandwidth compared to WDP. As a result, acoustic telemetry is often preferred for land and mid-cost offshore wells where operational budgets are tighter but reliable real-time monitoring remains essential. In practice, the choice between the two is driven by a cost–benefit analysis. If the well complexity and potential non-productive time savings justify the higher upfront costs, operators lean toward WDP. Otherwise, acoustic telemetry provides a pragmatic balance between affordability and sufficient functionality.
In a word, this integrated model can effectively solve the problem of safe drilling of complex deep wells and greatly improve the drilling time and efficiency while reducing the complexity time rate, especially to help speed up the exploration and development of complex wells such as deep and ultra-deep wells, keeping intact the safety protocols. This paper makes several contributions. We conducted a comprehensive literature review on drilling risk assessment, which provides a detailed theoretical framework, then downhole drill parameters and data transmission were performed depending on real-time data by using optimization software powered by AI (OptiDrill AI Suite, version 3.2.1, DrillingTech Inc.). To validate the design, we performed extensive ground testing (pressure/vibration calibration) and a field deployment on an operational well. Results show the system meets real-time requirements and effectively predicts risk events. We conclude by critically discussing the system’s engineering performance, limitations, and future improvements. Our goal is to demonstrate a practical, field-ready approach for enhancing drilling safety via intelligent downhole monitoring and control.
2. Drilling Risk Assessment: A Detailed Theoretical Framework
Drilling risk assessment evaluates the likelihood and impact of downhole hazards (e.g., kicks, stuck pipe, blowouts) during a wellbore operation. Traditionally, risk has been managed via safety margins on mud weight and monitoring of well control indicators such as drilling margin, equivalent circulating density [
2]. However, complex deep formations often exhibit dynamic changes that static margins cannot anticipate. Contemporary research emphasizes real-time risk monitoring: capturing drilling parameters and using data analytics to forecast incidents. The contemporary studies [
8,
9] highlight that integrating real-time monitoring into drilling can significantly reduce downtime and prevent accidents. For example, they note that anomaly detection algorithms track deviations in torque, pressure, and penetration rate to flag issues like bit wear or formation changes. Fault-prediction models then analyzes historical and live data to forecast the timing of future drilling problems. Similarly, a probabilistic model combining hydraulic analysis with data-driven inversion was developed to continuously assess wellbore pressure balance and alert when kick risk rises [
8]. Machine learning has been applied for risk classification, such as using neural networks to distinguish normal drilling states from precursors to kicks. Industry practice now often includes statistical well control charts and real-time pore-pressure estimation (e.g., using MWD/LWD data) to support decisions. The consensus is that richer data enable smarter risk assessment: continuous parameter streams allow detection of subtle signs (e.g., small pressure-while-drilling fluctuations) before they escalate.
Nevertheless, many existing approaches rely on a limited set of indicators (e.g., mud weight vs. pore pressure) or off-line analysis. A truly comprehensive risk control requires wider parameter coverage and automatic interpretation. For instance, drilled string bending moments and vibration can signal differential sticking or impending tool fatigue, but these are seldom included in standard risk models. Recent studies call for multi-parameter fusion: coupling mechanical measurements (torque, WOB, vibration) with hydraulic parameters to more accurately infer downhole conditions. In the present work, we adopt this multi-dimensional philosophy, relying on real-time data through an integrated AI-powered logic.
The AI model was designed as a hybrid deep learning framework, combining Convolutional Neural Networks (CNNs) for localized feature extraction with Long Short-Term Memory (LSTM) networks to capture sequential dependencies in drilling dynamics. This architecture is particularly suited for recognizing the subtle, time-evolving precursors of risks such as kicks and stuck pipe. The training dataset integrated historical well logs, real-time rig telemetry from over 30 wells, and laboratory-scale test-rig simulations.
To address the scarcity of rare but critical events, such as kicks, we applied data augmentation, physics-informed simulations, and Generative Adversarial Networks (GANs) to generate realistic synthetic sequences. A cost-sensitive training strategy was also used, penalizing misclassification of hazardous events more heavily to improve recall. This ensured the model remained sensitive to rare events while maintaining robust overall performance, achieving predictive accuracy above 85% in validation.
Intelligent Measurement Technologies
The backbone of our system is advanced downhole measurement hardware. State-of-the-art MWD/LWD tools already measure standard parameters like inclination, azimuth, temperature, and mud pressure. We verified and expanded this to mechanical parameters using optimization via AI-powered tool. For example, we incorporate strain-gauge torque and bending moment sensors in the drill collar near the bit. Vibration and shock are captured by a three-axis MEMS accelerometer module in the bottom-hole assembly, similar to commercial downhole shock/vibration sensors. A pressure while drilling (PWD) sputter (high-temp quartz gauge) measures annular pressure at bit. An optical or rotary encoder on the BHA shaft measures bit RPM. All these sensors are rated for >150 °C and 100 MPa, matching deep-well conditions.
The sensors used in the system were selected and rated based on the requirements of high-pressure, high-temperature (HPHT) drilling environments. Specifically, the pressure sensors are rated up to 100 MPa and the temperature sensors up to 150 °C. These ratings were determined by aligning with the typical operating envelope of deep and ultra-deep wells as well as industry standards for downhole instrumentation. Laboratory qualification tests were conducted under controlled conditions to validate sensor robustness against thermal and pressure cycling. The sensors demonstrated stable calibration, linearity, and response times across the tested range, with no permanent degradation observed. While slight transient increases in signal noise were detected at extreme conditions (above ~145 °C), these remained within the manufacturer’s error tolerances and did not affect measurement reliability. During field deployment, the tool operated under downhole conditions of 59.2 MPa and 115 °C, which, although below the maximum rated capacity, confirmed stable performance without anomalies. The laboratory validation provides confidence that the system can reliably operate at the rated extremes of 100 MPa and 150 °C, ensuring suitability for HPHT applications.
The pressure sensors used in the system have a resolution of 0.01 MPa, ensuring high sensitivity to subtle pressure fluctuations. The response time of these sensors is less than 100 milliseconds, enabling near-instantaneous detection of dynamic changes in downhole conditions. The sensors are designed to operate reliably in harsh drilling environments, with an effective temperature range from −20 °C to 150 °C. Additionally, the system’s sampling frequency is 10 Hz for pressure measurements and 50 Hz for vibration data, allowing for precise, real-time monitoring of mechanical and hydraulic events. These enhancements not only ensure the reliability of the collected data but also support the replicability and scalability of the proposed dual-loop risk control system in various drilling environments.
Measurement While Drilling (MWD) refers to the real-time acquisition of directional, inclination, and tool face data during drilling operations. Pressure While Drilling (PWD) is a complementary system that monitors downhole pressure conditions, essential for early detection of formation instability and pressure anomalies. Equivalent Circulating Density (ECD) represents the effective density of the drilling fluid when accounting for dynamic pressure losses in the annulus and is critical for managing wellbore pressure. Mechanical Specific Energy (MSE) is a calculated metric that indicates the mechanical energy required to remove a unit volume of rock, serving as a key indicator of bit performance and formation hardness. The term LZrpm is Lateral Zero-rate Rotation Per Minute. It describes lateral vibrations occurring even when surface rotation is absent, often signaling torsional stick-slip or inefficient energy transfer at the bit.
3. Analysis of Downhole Parameters and Data Transmission
3.1. Downhole Parameter Measurement and Data Transmission System While Drilling
The downhole risk prevention and control system is an advanced drilling technology designed to reduce drilling risks and enhance drilling efficiency. The system consists of two main components: downhole parameter measurement tools and surface risk analysis and assessment software. The downhole tools are responsible for measuring dynamic parameters and processing and transmitting data, while the surface monitoring system receives and decodes the data sent from below. The working principle of downhole safety monitoring involves using the downhole measurement tools to monitor various drilling parameters in real time, including downhole drilling pressure, bending moment, torque, intra-pipe pressure, annular pressure, vibration, and well deviation. Engineering and mechanical parameters, such as orientation and rotational speed, are also transmitted to the surface. The surface risk analysis and assessment software integrate these surface logging and downhole measurement parameters to conduct a comprehensive analysis of downhole risks. It monitors the status of downhole drilling tools and wellbore conditions in real time, ensuring the safety of the drill string and wellbore, reducing drilling complexity, and providing technical support for drilling safety.
Regarding the selection of the nine specific engineering/mechanical parameters, the chosen parameters were selected based on their direct relevance to the study’s objectives and their significant impact on the performance and quality outcomes of the engineering process under investigation. For instance, while parameters such as cutting speed, feed rate, and depth of cut are commonly analyzed due to their influence on surface finish and material removal rate, other parameters like tool nose radius and cutting environment (e.g., dry vs. lubricated conditions) can also affect machining outcomes. However, the latter were not included in this study to maintain a focused scope and due to constraints related to experimental design and resource availability [
10,
11]. They identified key drilling parameters, including mud weight and annular velocity, as significant contributors to the model’s accuracy. Their findings suggest that these parameters are critical for real-time monitoring and risk assessment during drilling operations.
Additionally, while surface roughness (Ra) is a standard measure for assessing finish quality, other parameters like Rz or Rq could provide complementary insights. Nonetheless, Ra was selected for its widespread acceptance and ease of measurement, facilitating comparison with existing literature. By concentrating on these nine parameters, the study aims to provide a comprehensive yet manageable analysis that aligns with the research goals. Future work could expand upon this by incorporating additional parameters to further enhance the understanding of the engineering process.
In this study, the downhole tool measured surface roughness (Ra) indirectly through high-frequency vibration and torque signal analysis rather than physical stylus contact methods that are standard in laboratory settings. The tool is equipped with tri-axial accelerometers and torque sensors, which capture micro-variations in drillstring–formation interaction. These raw signals are pre-processed to filter out noise and then subjected to feature extraction algorithms that correlate vibration amplitude distribution and torque fluctuation signatures with equivalent Ra values, based on calibration performed in controlled drilling tests. The calibration dataset was generated by drilling test coupons under representative conditions, measuring their Ra values offline using a profilometer, and mapping those values to the corresponding downhole signal features. This enables the downhole tool to estimate Ra in real time with sufficient accuracy for comparative analysis, even in the absence of direct stylus-based measurement. While this approach cannot match the nanometer-level precision of laboratory profilometers, it provides practical and continuous roughness monitoring during drilling operations.
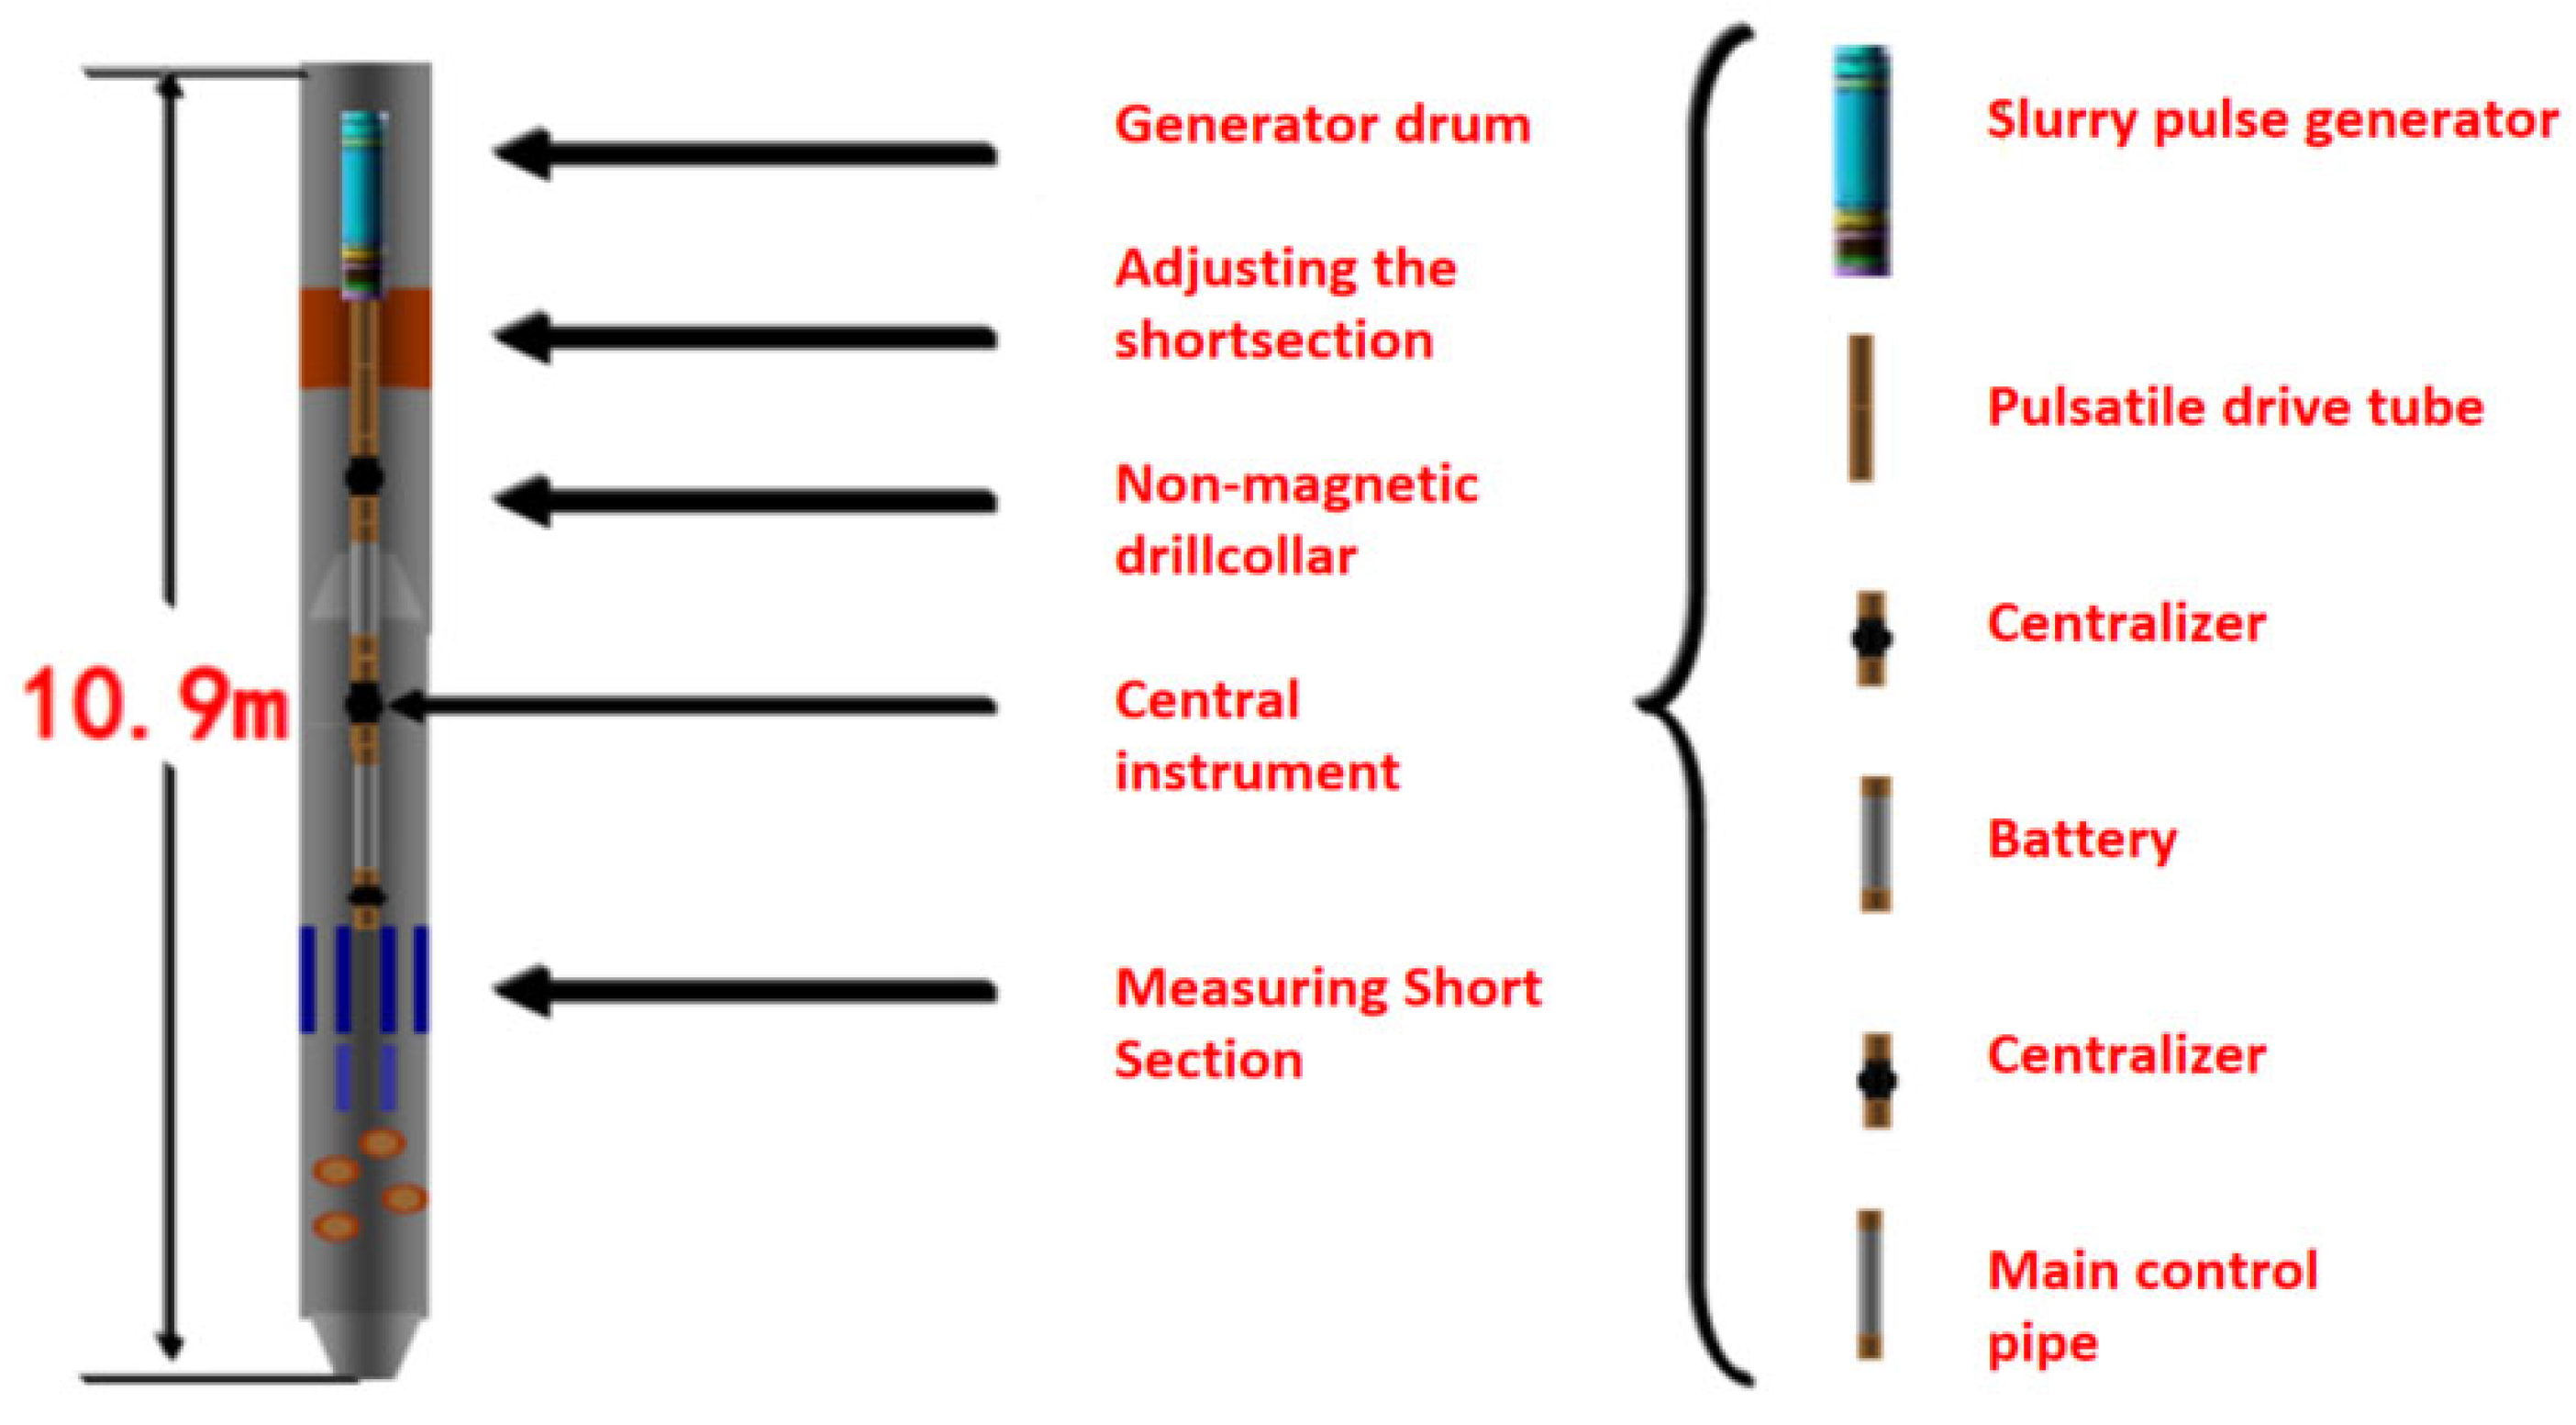
As shown in
Figure 1 the downhole component of the system primarily consists of a measurement-while-drilling (MWD) system and a data transmission-while-drilling (DTWD) system. The hardware includes a mud pulse generator, an adjustment sub, a non-magnetic drill collar, a measurement sub, and a central instrument. Among these, the mud pulse generator serves dual functions: it transmits signals and provides power to the downhole instruments. It is mainly responsible for supplying power to the pulse generator and pulse control circuit board while transmitting the signals [
12,
13]. The pulse drive tube is used to house the circuit board that controls the pulse generator’s operation and transmits signals. The battery supplies power to the lower circuit and the instrument’s sensors. The main control tube holds the system control circuit, the well inclination and azimuth measurement sensors. The generator flow tube, non-magnetic drill collar, and measuring sub-joint are connected to form a 10.9 m-long drill collar, within which weight-on-bit, bending moment, torque, vibration, and speed sensors, along with the corresponding circuit boards, are installed in the measuring sub-section.
3.2. Parameter Measurement System in Drilling Engineering
The downhole parameter measurement system during drilling primarily measures nine engineering parameters, including tension, pressure, bending, and torsion. After investigation, it has been found that mature sensors are available for measuring parameters such as rotation speed, well deviation, orientation, pressure, and vibration. However, there are currently no mature sensors available for measuring drilling weight, torque, and bending moment during drilling [
12]. To address this technical challenge, this paper proposes the use of sputtered thin-film strain gauges for direct measurement, based on research into strain mechanics measurements [
11,
14].
3.2.1. Weight on Bit and Torque Measurement Technology
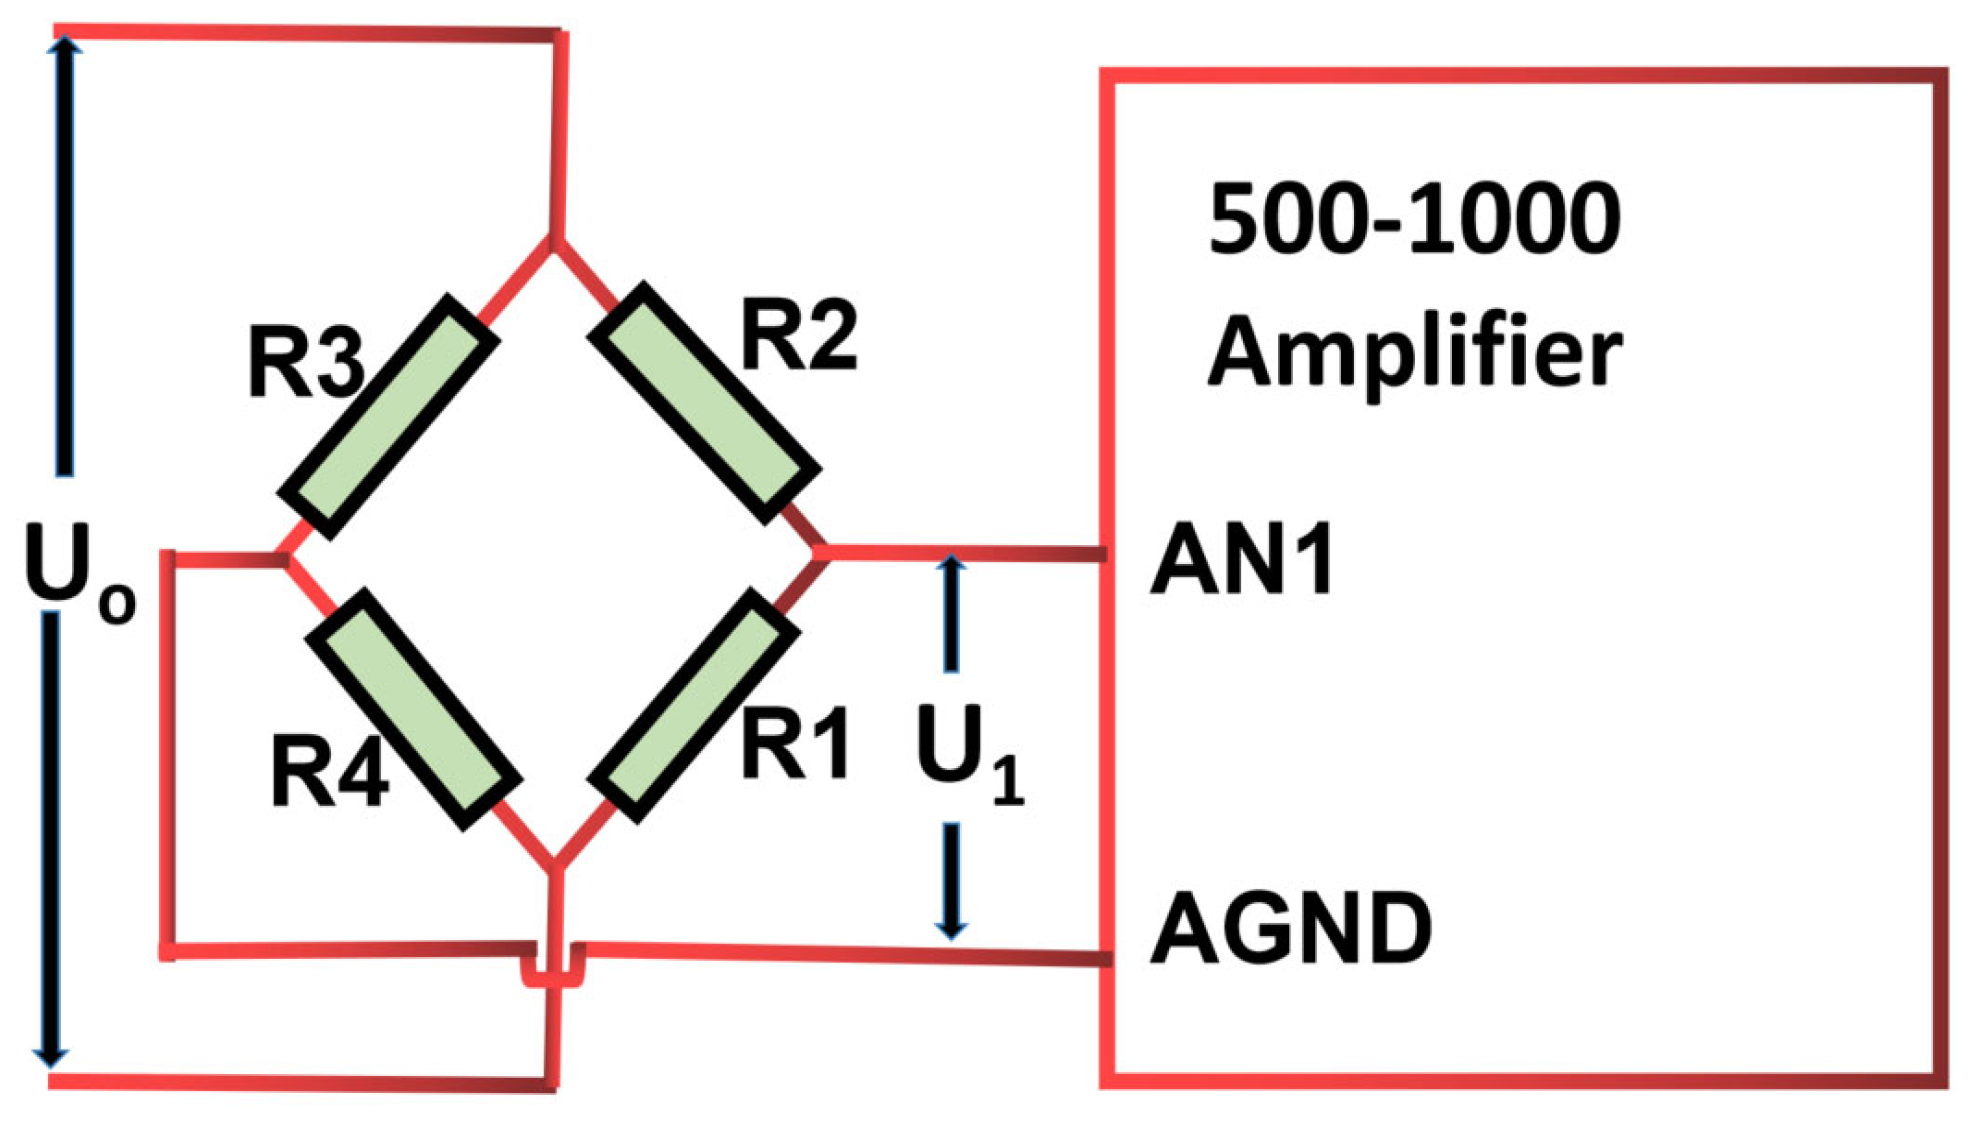
The entire process is clearly illustrated in
Figure 2 below.
As shown in
Figure 2, R1–R4 are four strain resistors of equal value. Among them, R1 and R3 are measurement resistors, while R2 and R4 serve as temperature compensation resistors [
14]. Based on the circuit loading method and the equal-bridge strain resistance measurement technique, the functional relationship between strain voltage and drilling weight can be expressed as:
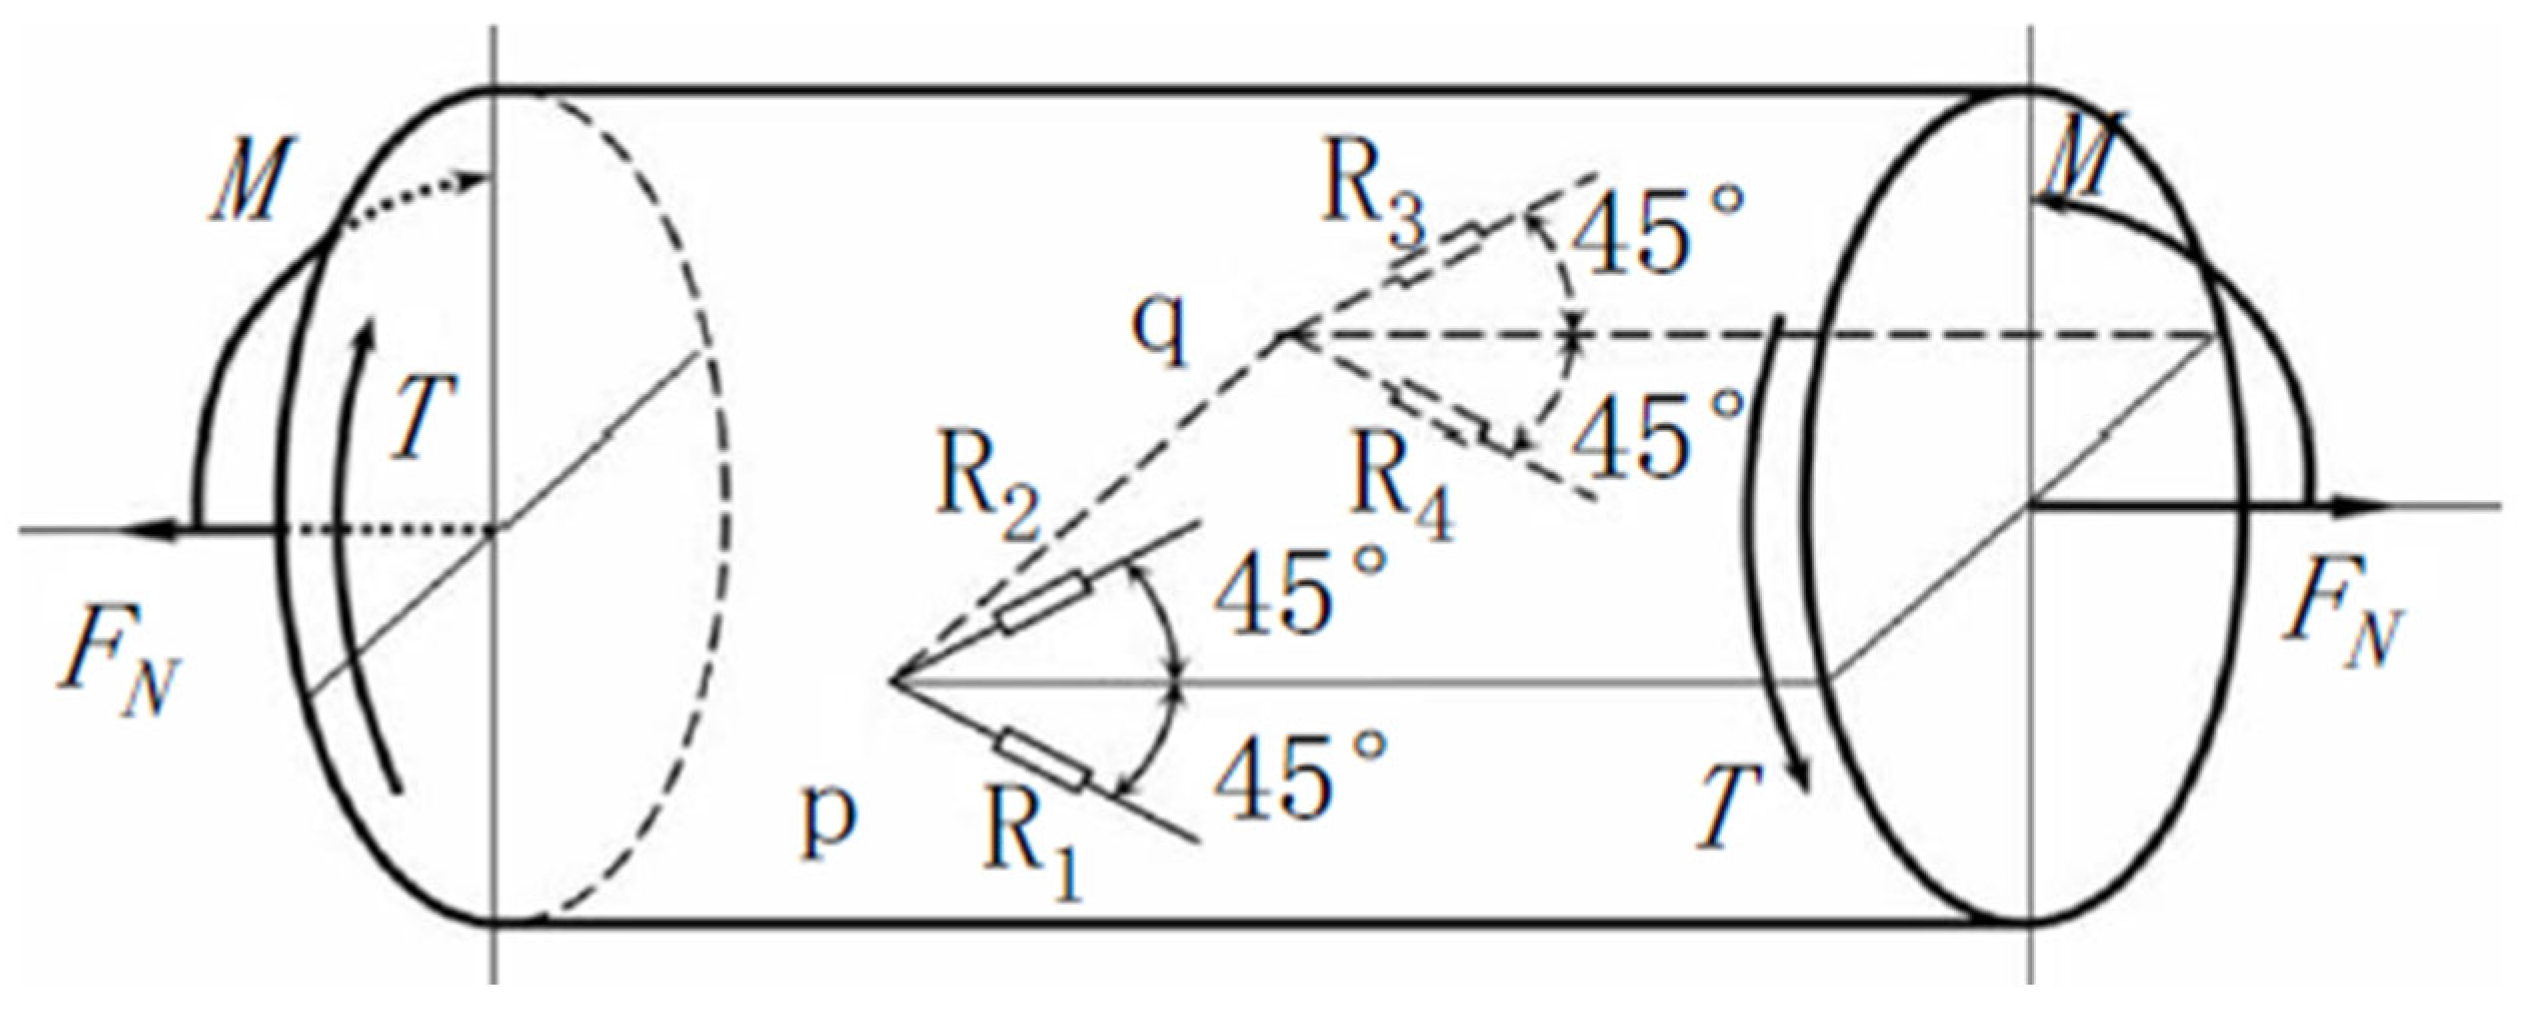
where E is the elastic modulus, μ is Poisson’s ratio, k is the sensitivity factor, D is the outer diameter, d is the inner diameter, and p1 is the initial pressure acting on the strain resistor, which can be ignored. From the above formula, the relationship between the drilling weight and the output voltage can be obtained. When measuring torque, use the circuit loading method as shown in
Figure 3:
Based on the equal-bridge strain resistance measurement method, it can be observed that the functional relationship between strain voltage and drilling weight is:
It can be deduced from the above formula that a linear relationship between torque and output voltage.
3.2.2. Bending Moment Measurement and Technology
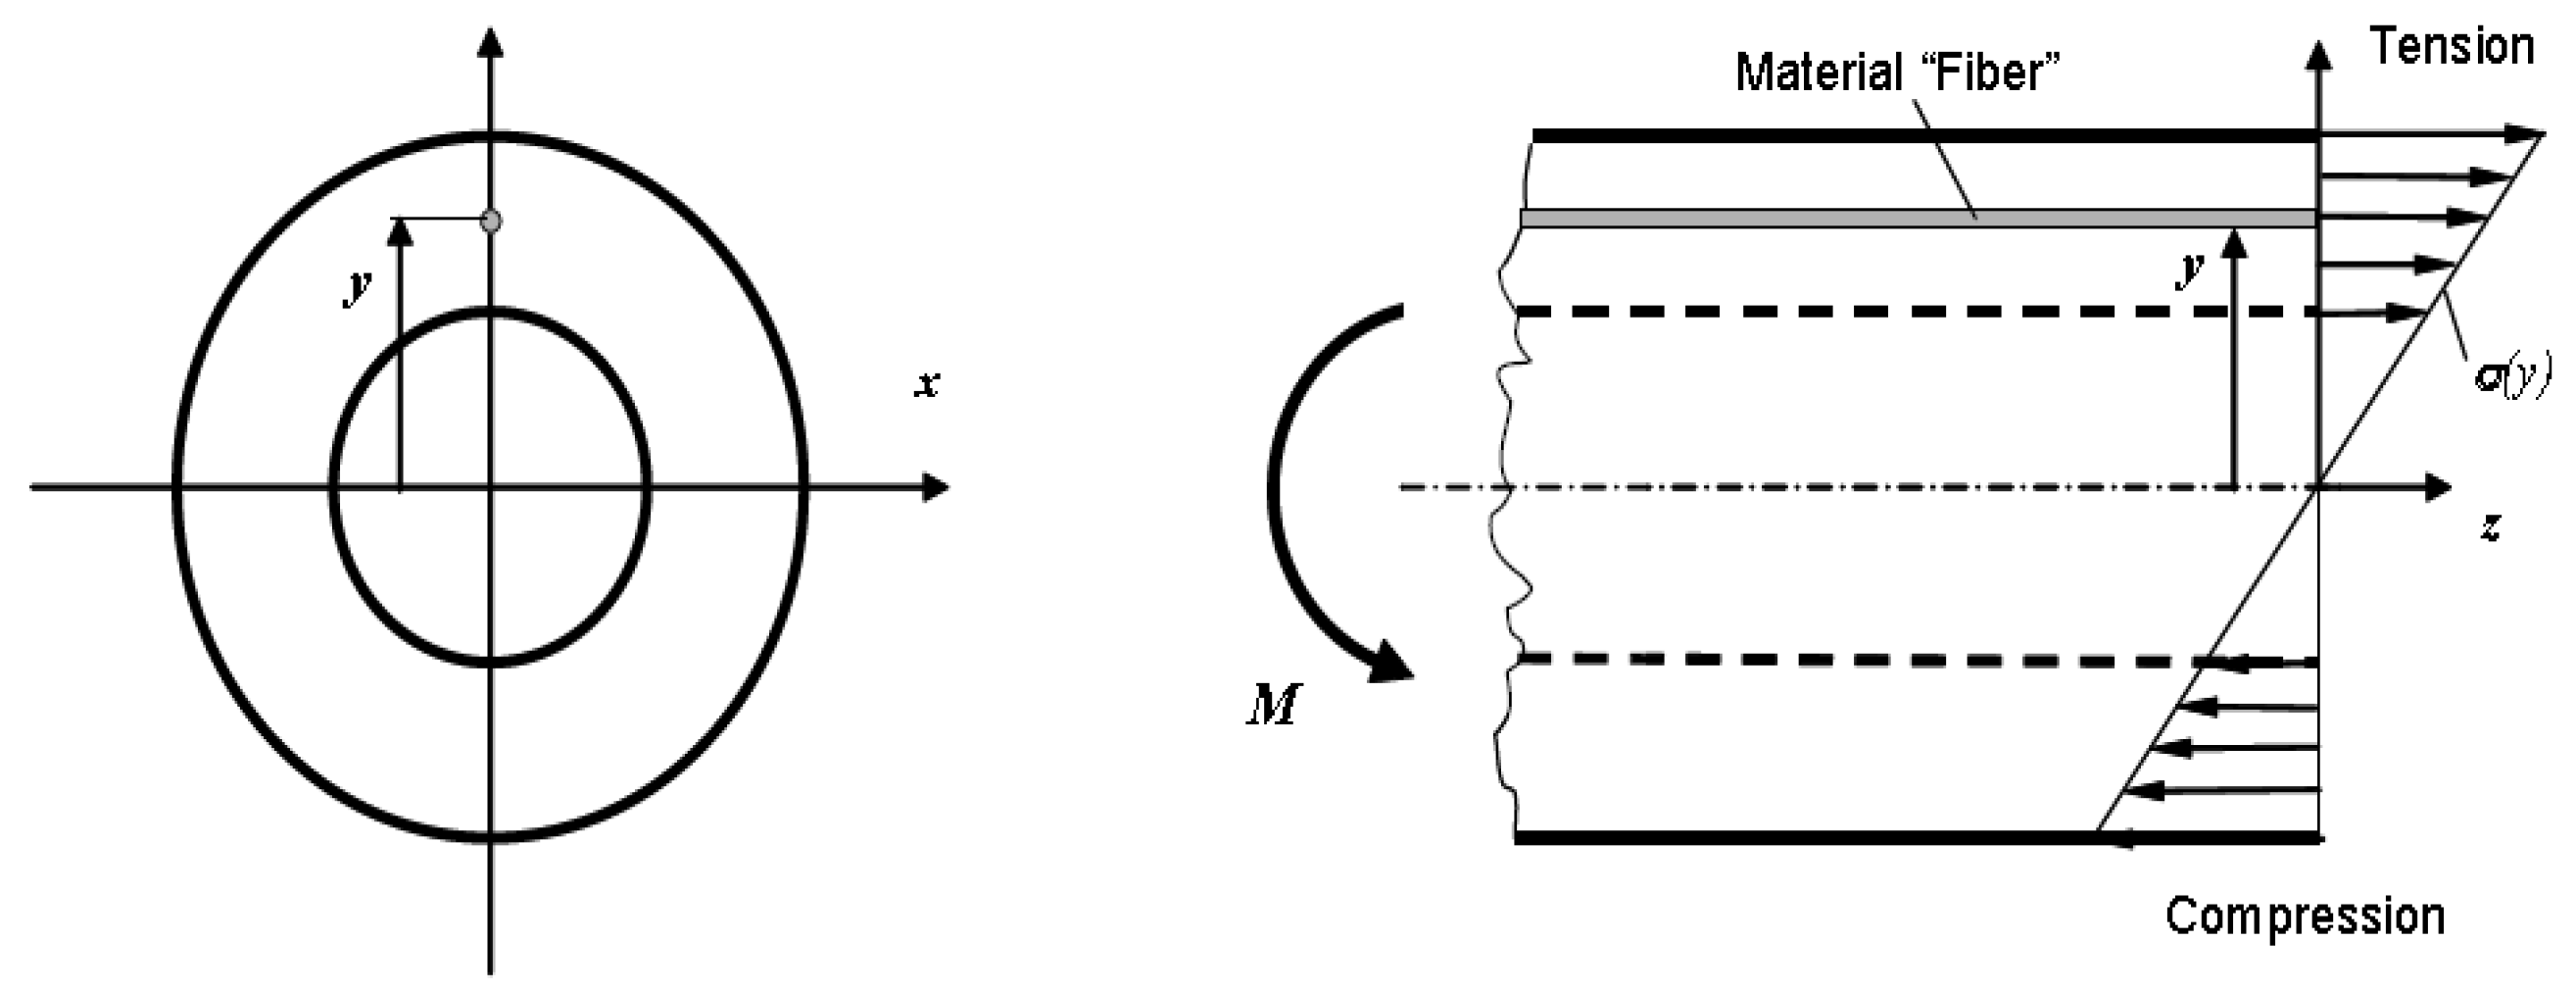
In the drill tool section, the diagram of bending stress is depicted in
Figure 4 below:
Figure 4 illustrates the magnitude of the bending stress generated by the bending moment at a specific section of the drill string. According to the bending stress formula, it can be observed that, under the influence of the bending moment M, the bending stress at a distance y from the center of the circle is:
In the formula,
M is the bending moment,
I is the moment of inertia around the section. The total bending moment suffered by the downhole drill string is composed of two parts, namely the x and y axis bending moments. The final total bending moment is the vector sum of the two axis bending moments, that is:
In drilling systems, the location of the bending moment measurement point and the position of the centralizer in the downhole drill string together determine how the bending moment responds to the drilling direction. The choice of strain gauges for the sensors directly impacts the accuracy of stress measurements. Considering the usage environment and operating conditions, the strain gauges were selected based on these factors. For this project, Karma alloy strain gauges with a resistance of 5000 ohms, small dimensions (3 mm × 3 mm), and one-dimensional tensile and shear capabilities were chosen [
15].
3.3. Data Transmission System While Drilling
3.3.1. Data Transmission
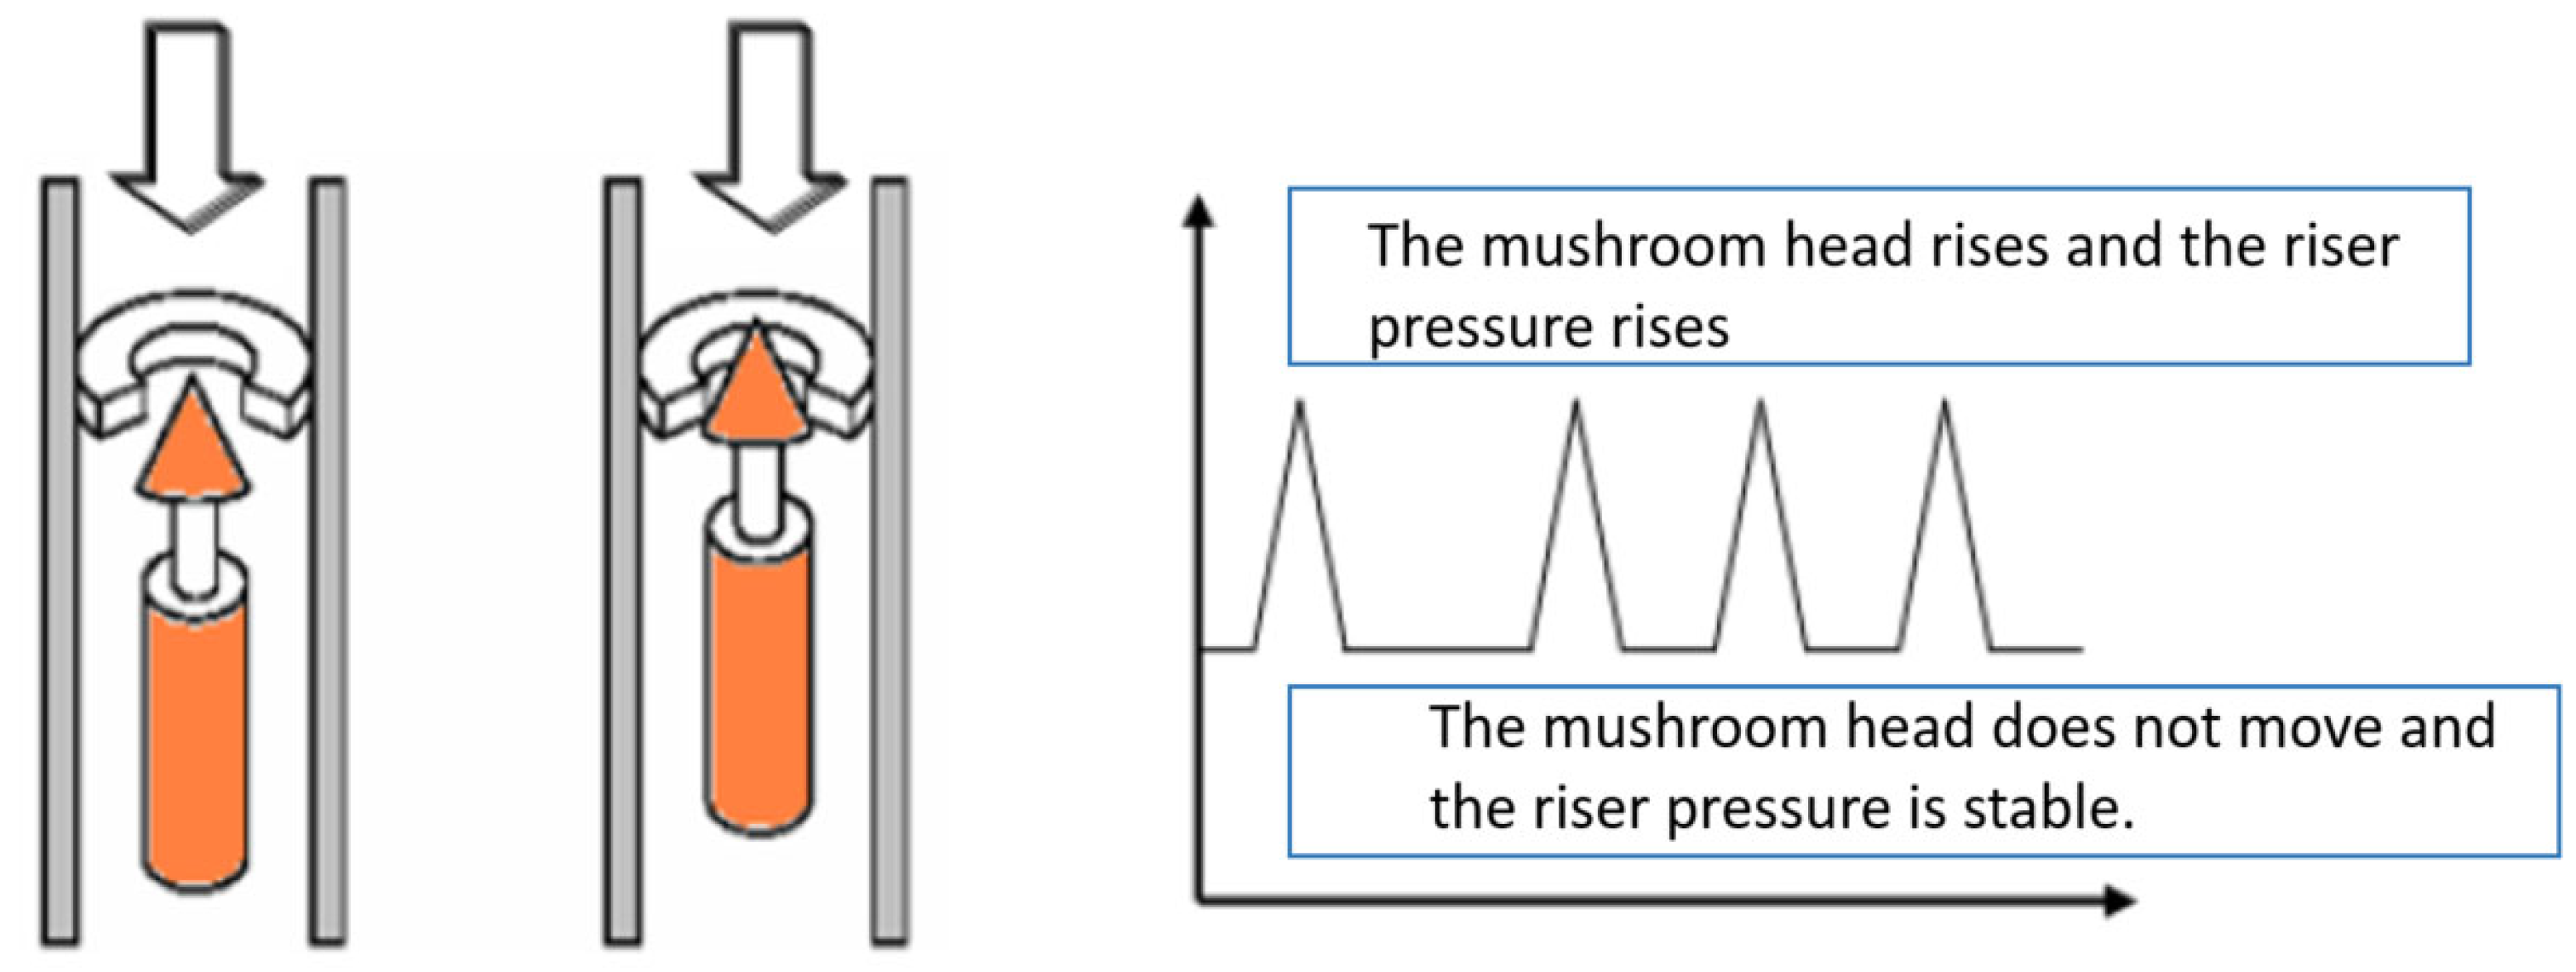
This system utilizes the most mature positive pulse method for data transmission, as illustrated in
Figure 5.
As shown in
Figure 5, during the drilling process, the drilling fluid flows from the space between the mushroom head and the restrictor ring on the signal generator to the drill bit [
16]. When the mushroom head moves upward in a specific pattern or remains stationary in the well, the gap between it and the flow-limiting ring will change accordingly. This change in gap alters the flow channel area for the drilling fluid, which in turn affects the hydraulic pressure, creating a pressure wave. As the mushroom head rises, the flow channel area decreases, and the pressure increases. When the mushroom head remains stationary, the drilling fluid pressure stays constant. If the mushroom head moves downward, the resulting pressure fluctuations are monitored by a pressure sensor installed on the riser on the surface. After decoding and filtering the data on the surface, the downhole information can be obtained [
17,
18]. In our system, sensor drift and failure are managed through a multi-layered strategy of redundancy, real-time validation, and intelligent data fusion. Each critical parameter is measured by at least two independent sensors (or derived from correlated signals), allowing cross-checking. Automated drift detection routines continuously compare incoming measurements against expected physical models (e.g., pressure–depth trend, thermal gradient, vibration thresholds) and against redundant channels. When a deviation beyond tolerance is detected, the system flags the affected sensor, dynamically down-weights its contribution, and relies on healthier sources.
For conflicting data, we employ a weighted data fusion algorithm that integrates multiple inputs using confidence scores based on recent performance, noise level, and consistency with physical models. In cases of hard disagreement, a voting mechanism ensures the most reliable measurement is selected while still logging anomalies for later engineering review. In addition, the downhole unit runs periodic self-calibration routines, and drift trends are modeled so that small degradations can be compensated in real time rather than immediately triggering a failure state. This approach ensures that the integrated system maintains robustness and reliability, even in the presence of individual sensor degradation.
3.3.2. Decoding and Encoding
To improve signal transmission quality and enhance reliability while maintaining the transmission rate, this system uses cyclic redundancy check (CRC) coding to encode and verify the signal [
19]. For error detection in data transmission, the system employs CRC-16-CCITT coding, which uses the standard polynomial x
16 + x
12 + x
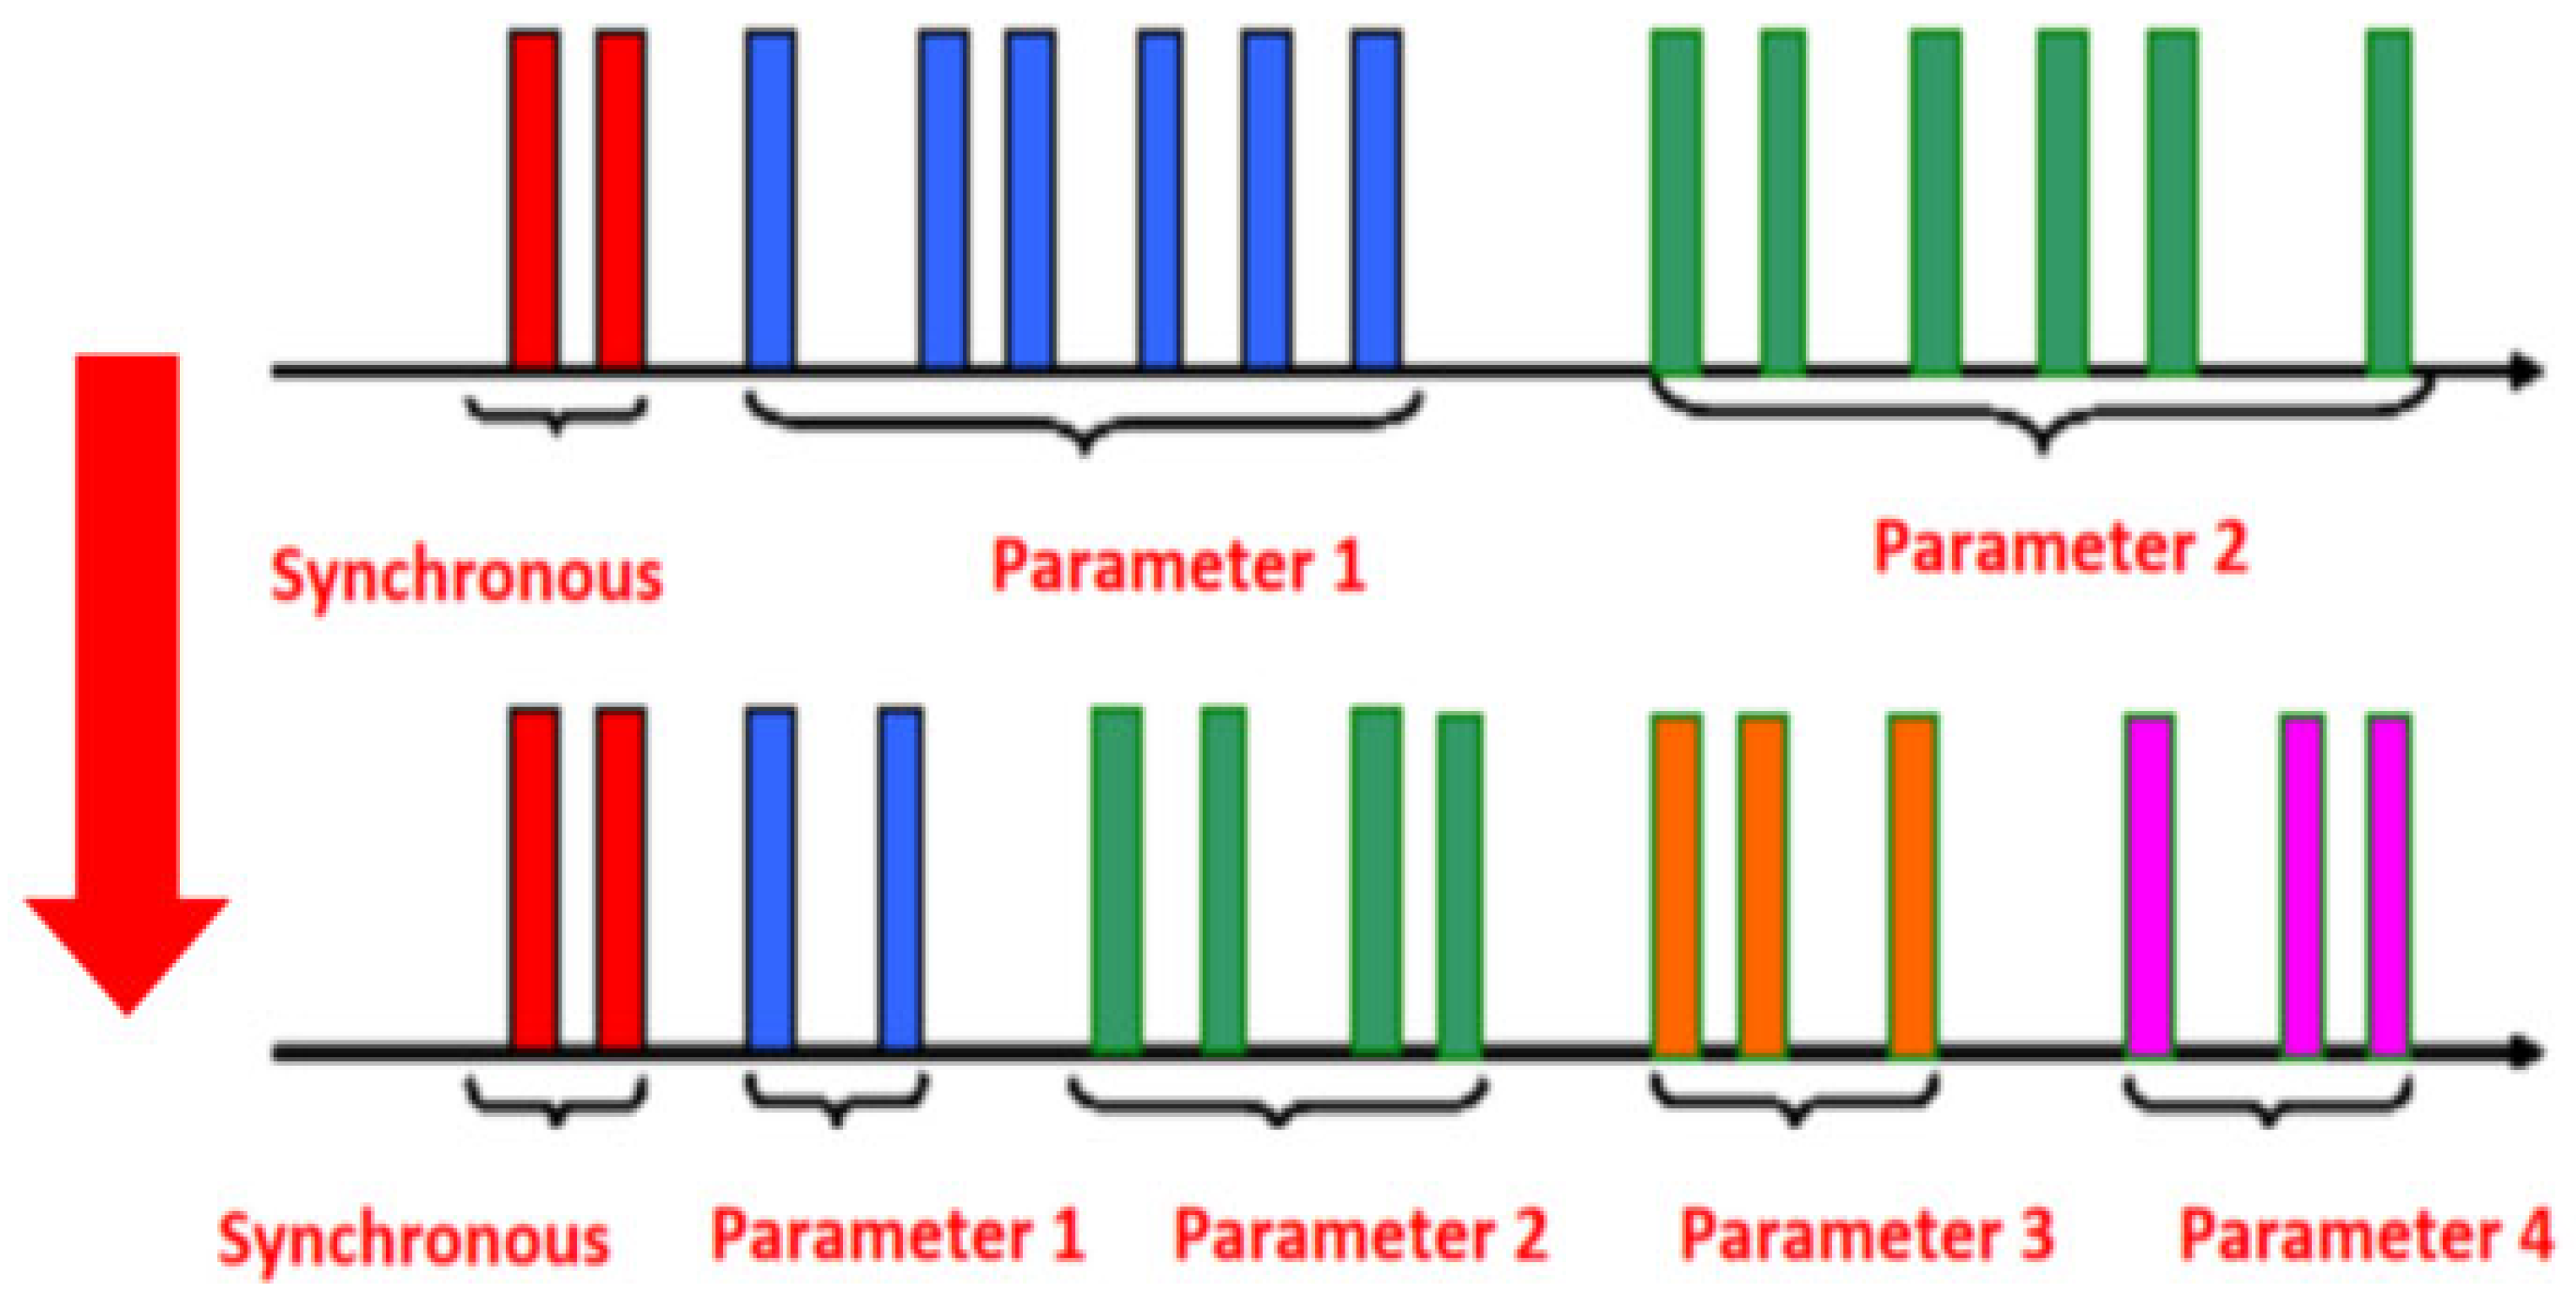
5 + 1 (hexadecimal 0 × 1021). This polynomial is widely adopted in telemetry applications due to its strong error-detection capability, computational efficiency, and proven robustness in noisy downhole environments, thereby ensuring reproducibility and reliability of the transmitted data. To meet the real-time data uploading requirements, this system employs different pulse combinations for encoding, transmitting, and decoding based on the importance and range of transmission parameters. For instance, parameters such as the well inclination and azimuth, which have high precision requirements, use 6 pulses, while parameters like vibration analysis require lower precision, use only 2 pulses (as shown in
Table 1). For parameters with less stringent accuracy requirements, a pulse sequence with fewer pulses is used. This transmission method is highlighted below in
Table 1.
As shown in
Table 1, a 2-pulse encoder provides only 55 discrete levels across the full range, which limits transmitted resolution (e.g., ≈0.93 g steps for a 0–50 g vibration range). This does not constrain the raw high-resolution measurements captured downhole; rather, it reflects a bandwidth trade-off. To ensure robustness, our system transmits compact features under normal conditions and automatically switches to higher-pulse encoding or burst transmission when anomalies are detected.
Additionally, the number of parameters carried by each synchronization code is increased to 4 (
Figure 6). Further optimizations are made to improve data transmission: the transmission data code is consolidated and shared, reducing the transmission time to 5 min. This approach ensures that the upload speed meets requirements, allowing for timely monitoring of underground parameters, real-time risk analysis, and assessment of underground working conditions [
20]. Moreover, it was suggested that calibration and flow resistance in fluid systems further support optimization of transmission fidelity [
21].
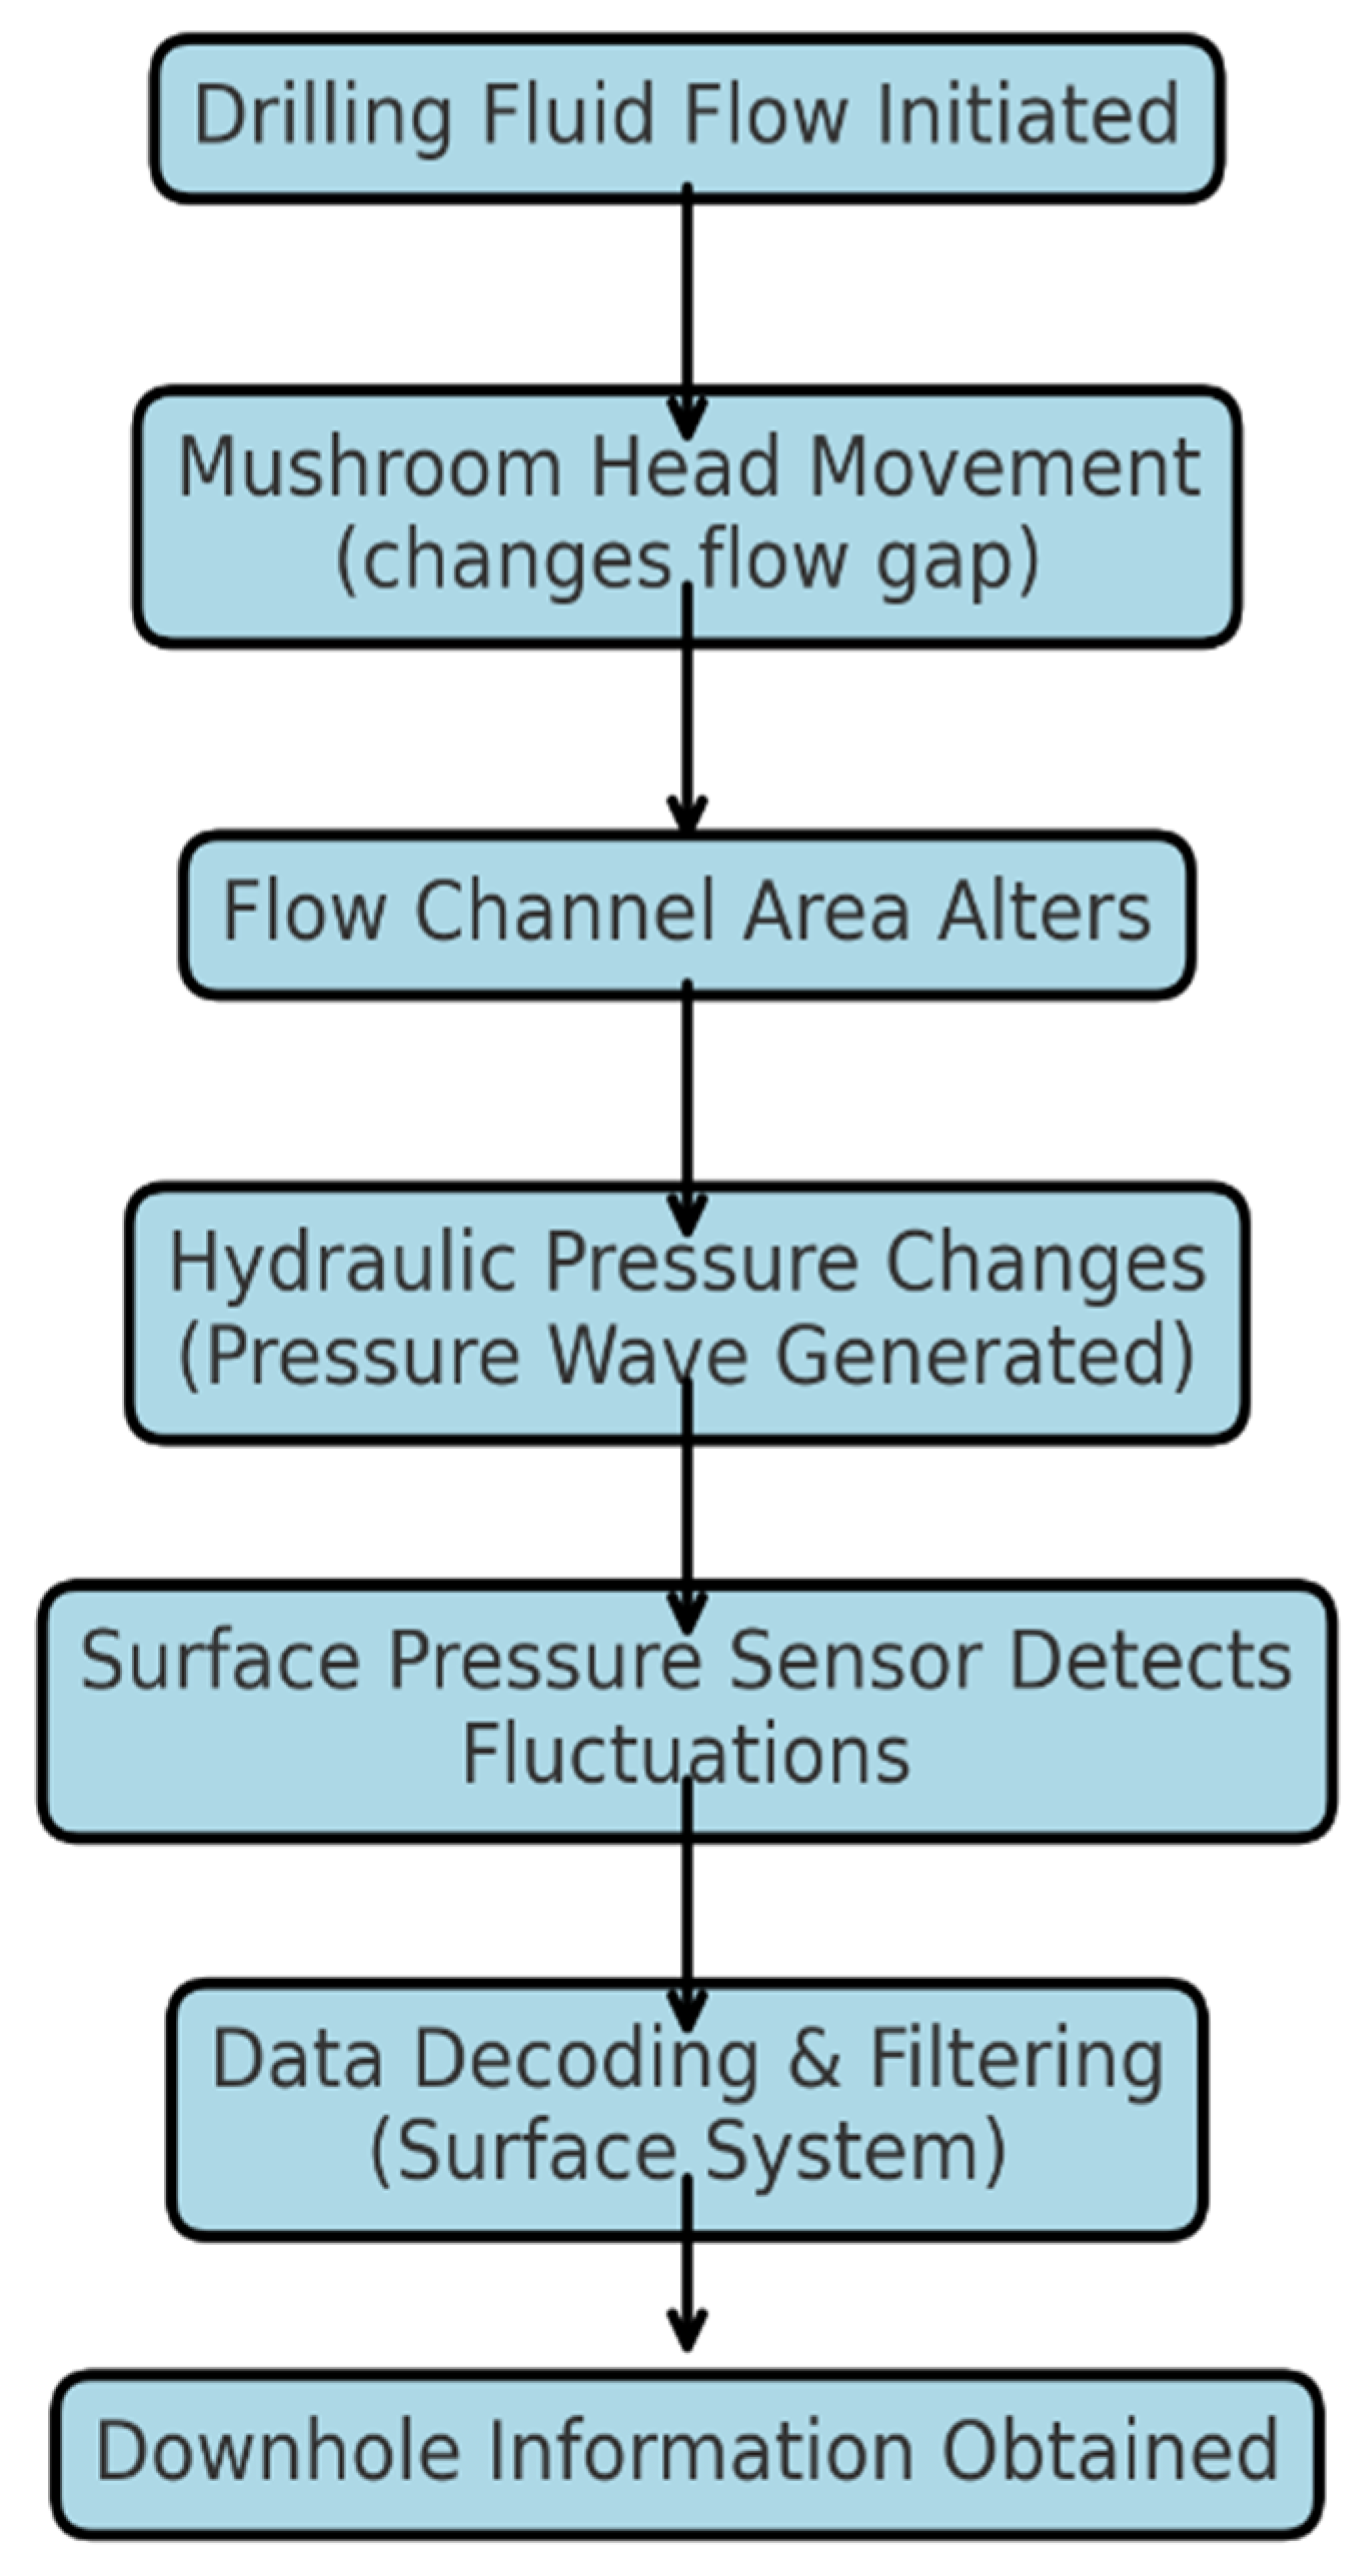
To enhance clarity, a flowchart has been included to illustrate the entire process of positive pulse data transmission during drilling. This diagram visually summarizes how hydraulic pressure pulses are generated, transmitted, and decoded at the surface to obtain downhole information (
Figure 7).
The flowchart illustrates the data transmission process during drilling using the positive pulse method. Drilling fluid flows through the signal generator, where changes in the mushroom head position alter the flow channel area, creating pressure waves. These waves are detected by surface pressure sensors, decoded, and filtered to extract downhole information. The system integrates redundancy, drift detection, and weighted data fusion to ensure reliable and accurate data transmission throughout drilling operations.
3.4. Ground Risk Prevention and Control System
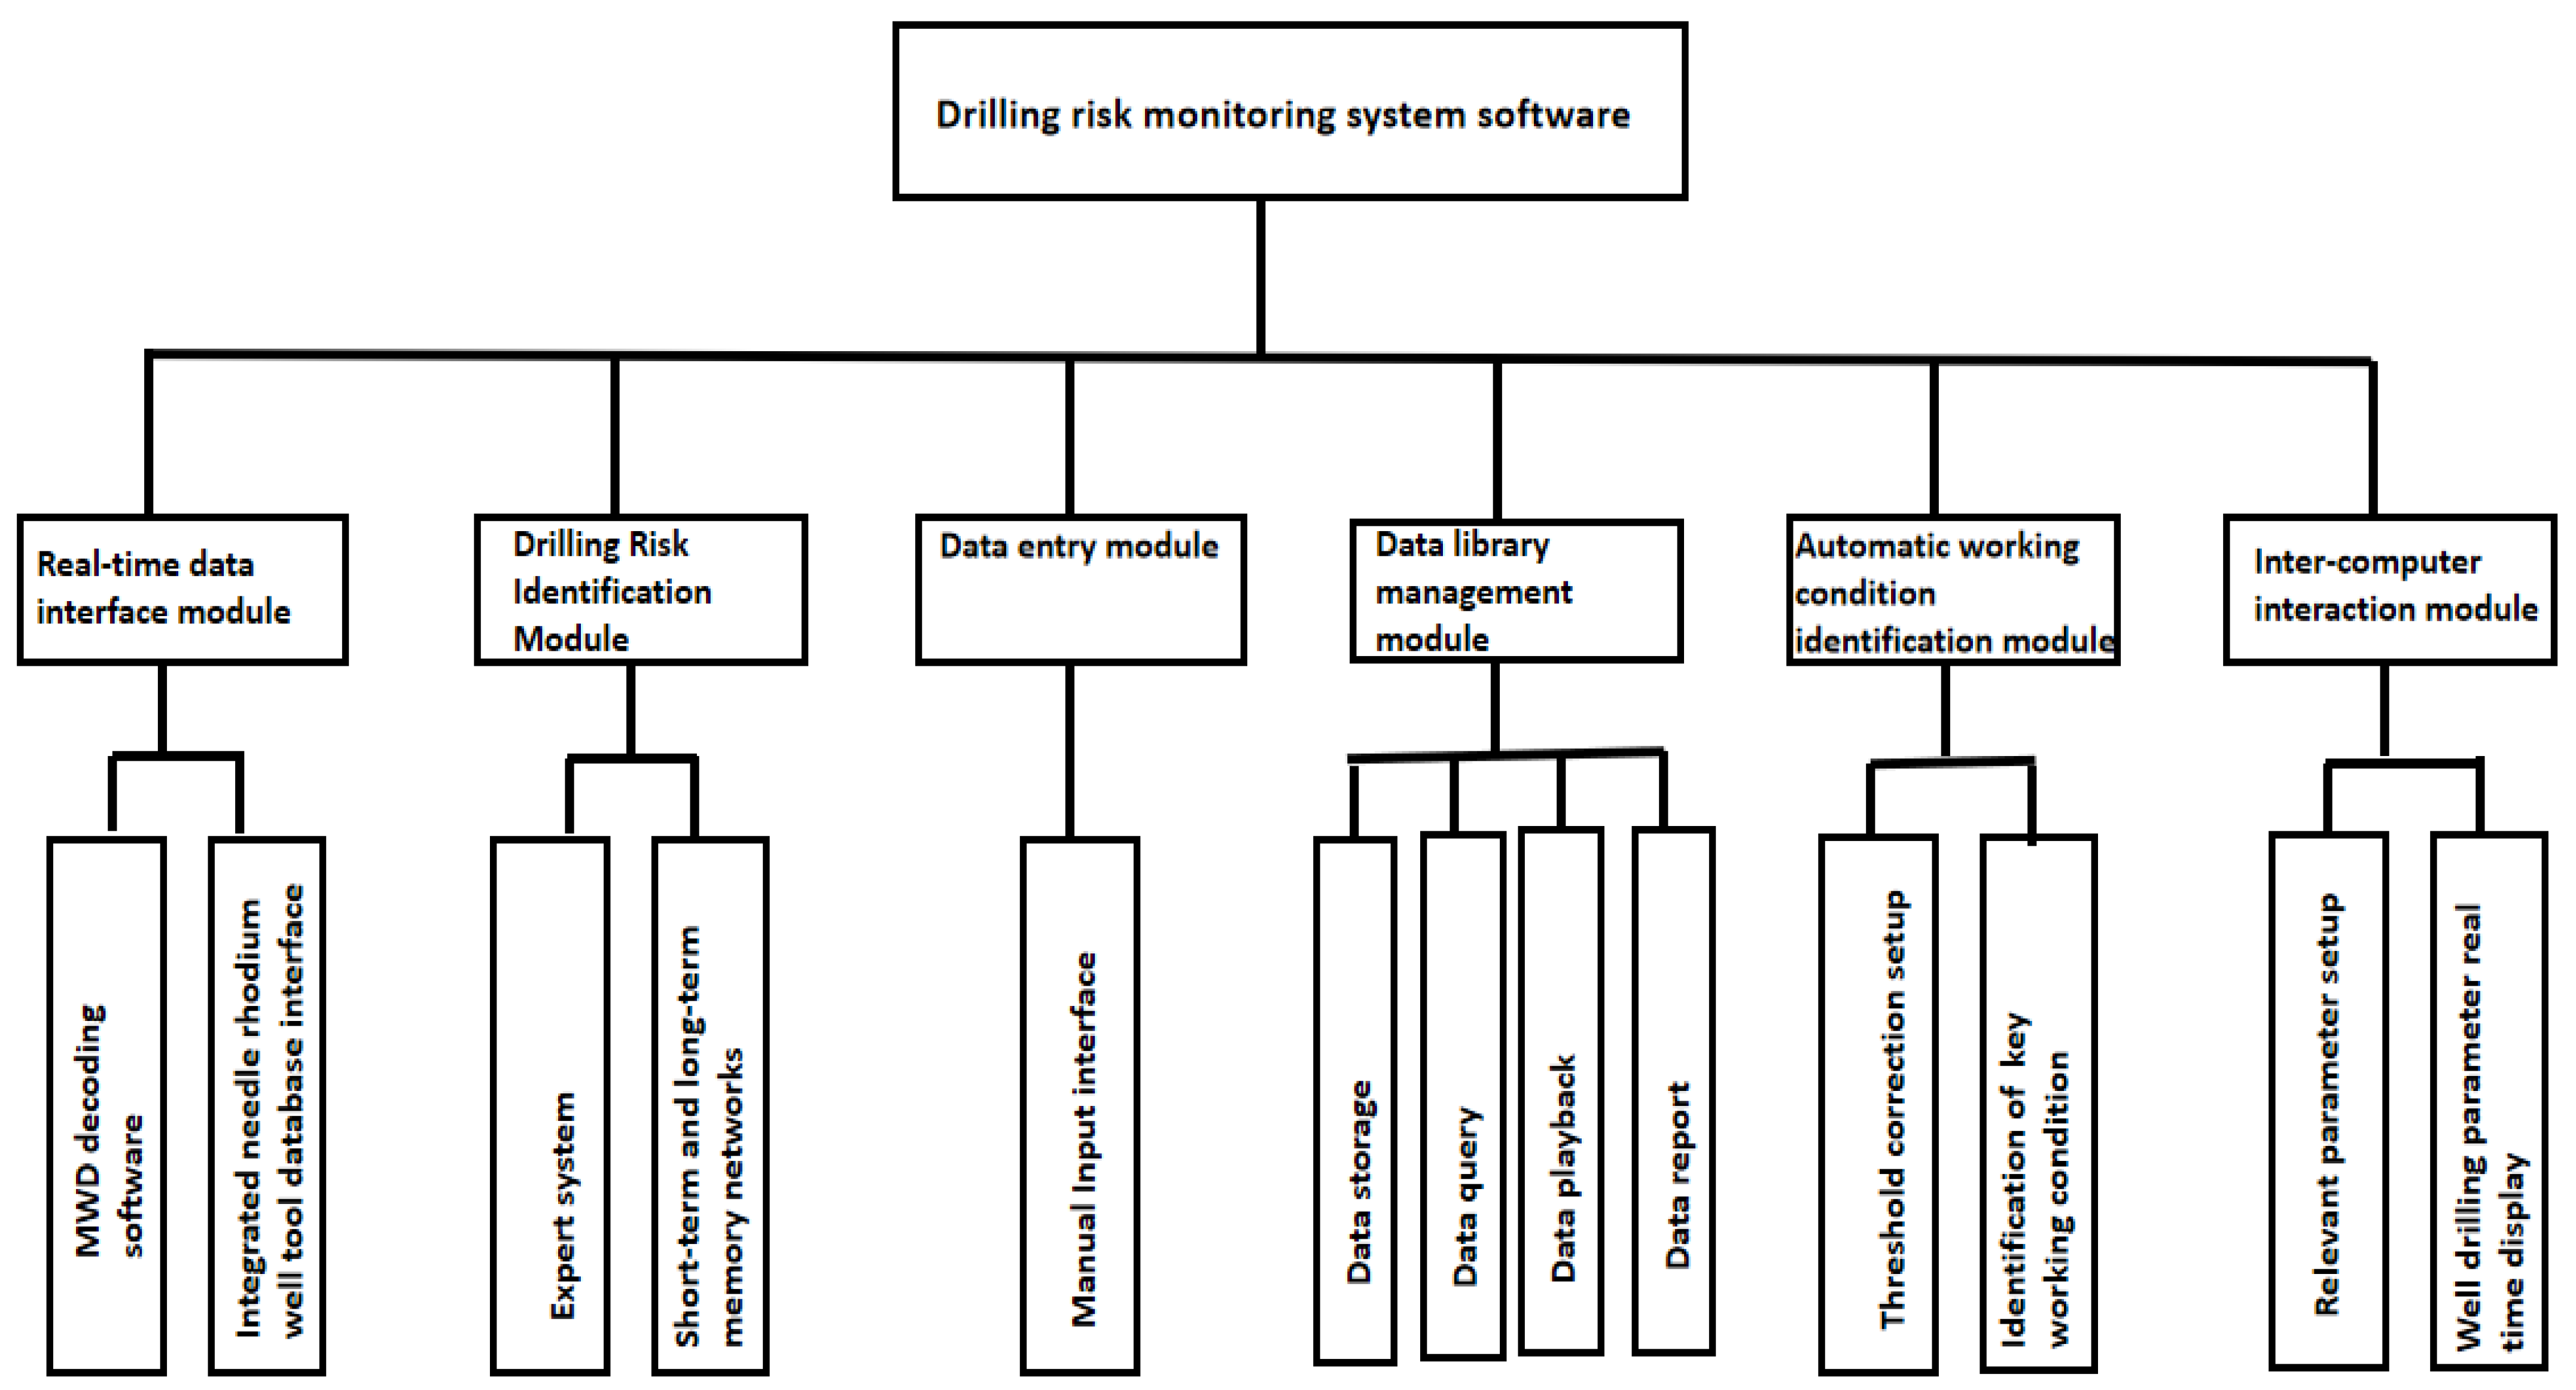
The ground risk prevention and control system comprises two components: the surface signal analysis system and the risk analysis and assessment system, as can be seen from
Figure 8. The hardware of the surface signal analysis system uses the same devices as conventional MWD, PWD, and other measurement-while-drilling instruments. The software is developed to interface with the downhole signal transmission software of the downhole risk prevention and control system. The primary function of the risk analysis and assessment system is to analyze and diagnose underground working conditions based on the measured engineering parameters. It also provides early warning signals and mitigation measures for abnormal situations [
22,
23]. It primarily consists of six core functional modules: the real-time data interface module, data entry module, drilling risk identification module, drilling database management module, automatic working condition identification module, and human–computer interaction module. Its main function is to provide optimized technical services throughout the drilling cycle. Before drilling, big data analysis and deep learning algorithms are used to conduct pre-drilling risk assessments and optimize geological and engineering designs [
4,
24]. During drilling, a real-time dynamic comparative analysis of collected engineering parameters is performed to intelligently deliver geological and engineering early warning information. This helps reduce the intensity of monitoring work and prevents safety risk accidents. After drilling, the knowledge base is updated, enabling the system to evolve into its ecosystem, forming a closed loop and creating an innovative model for intelligent early warning of drilling risks [
25].
3.5. Pre-Drilling Risk Analysis of Surface Risk Prevention and Control System
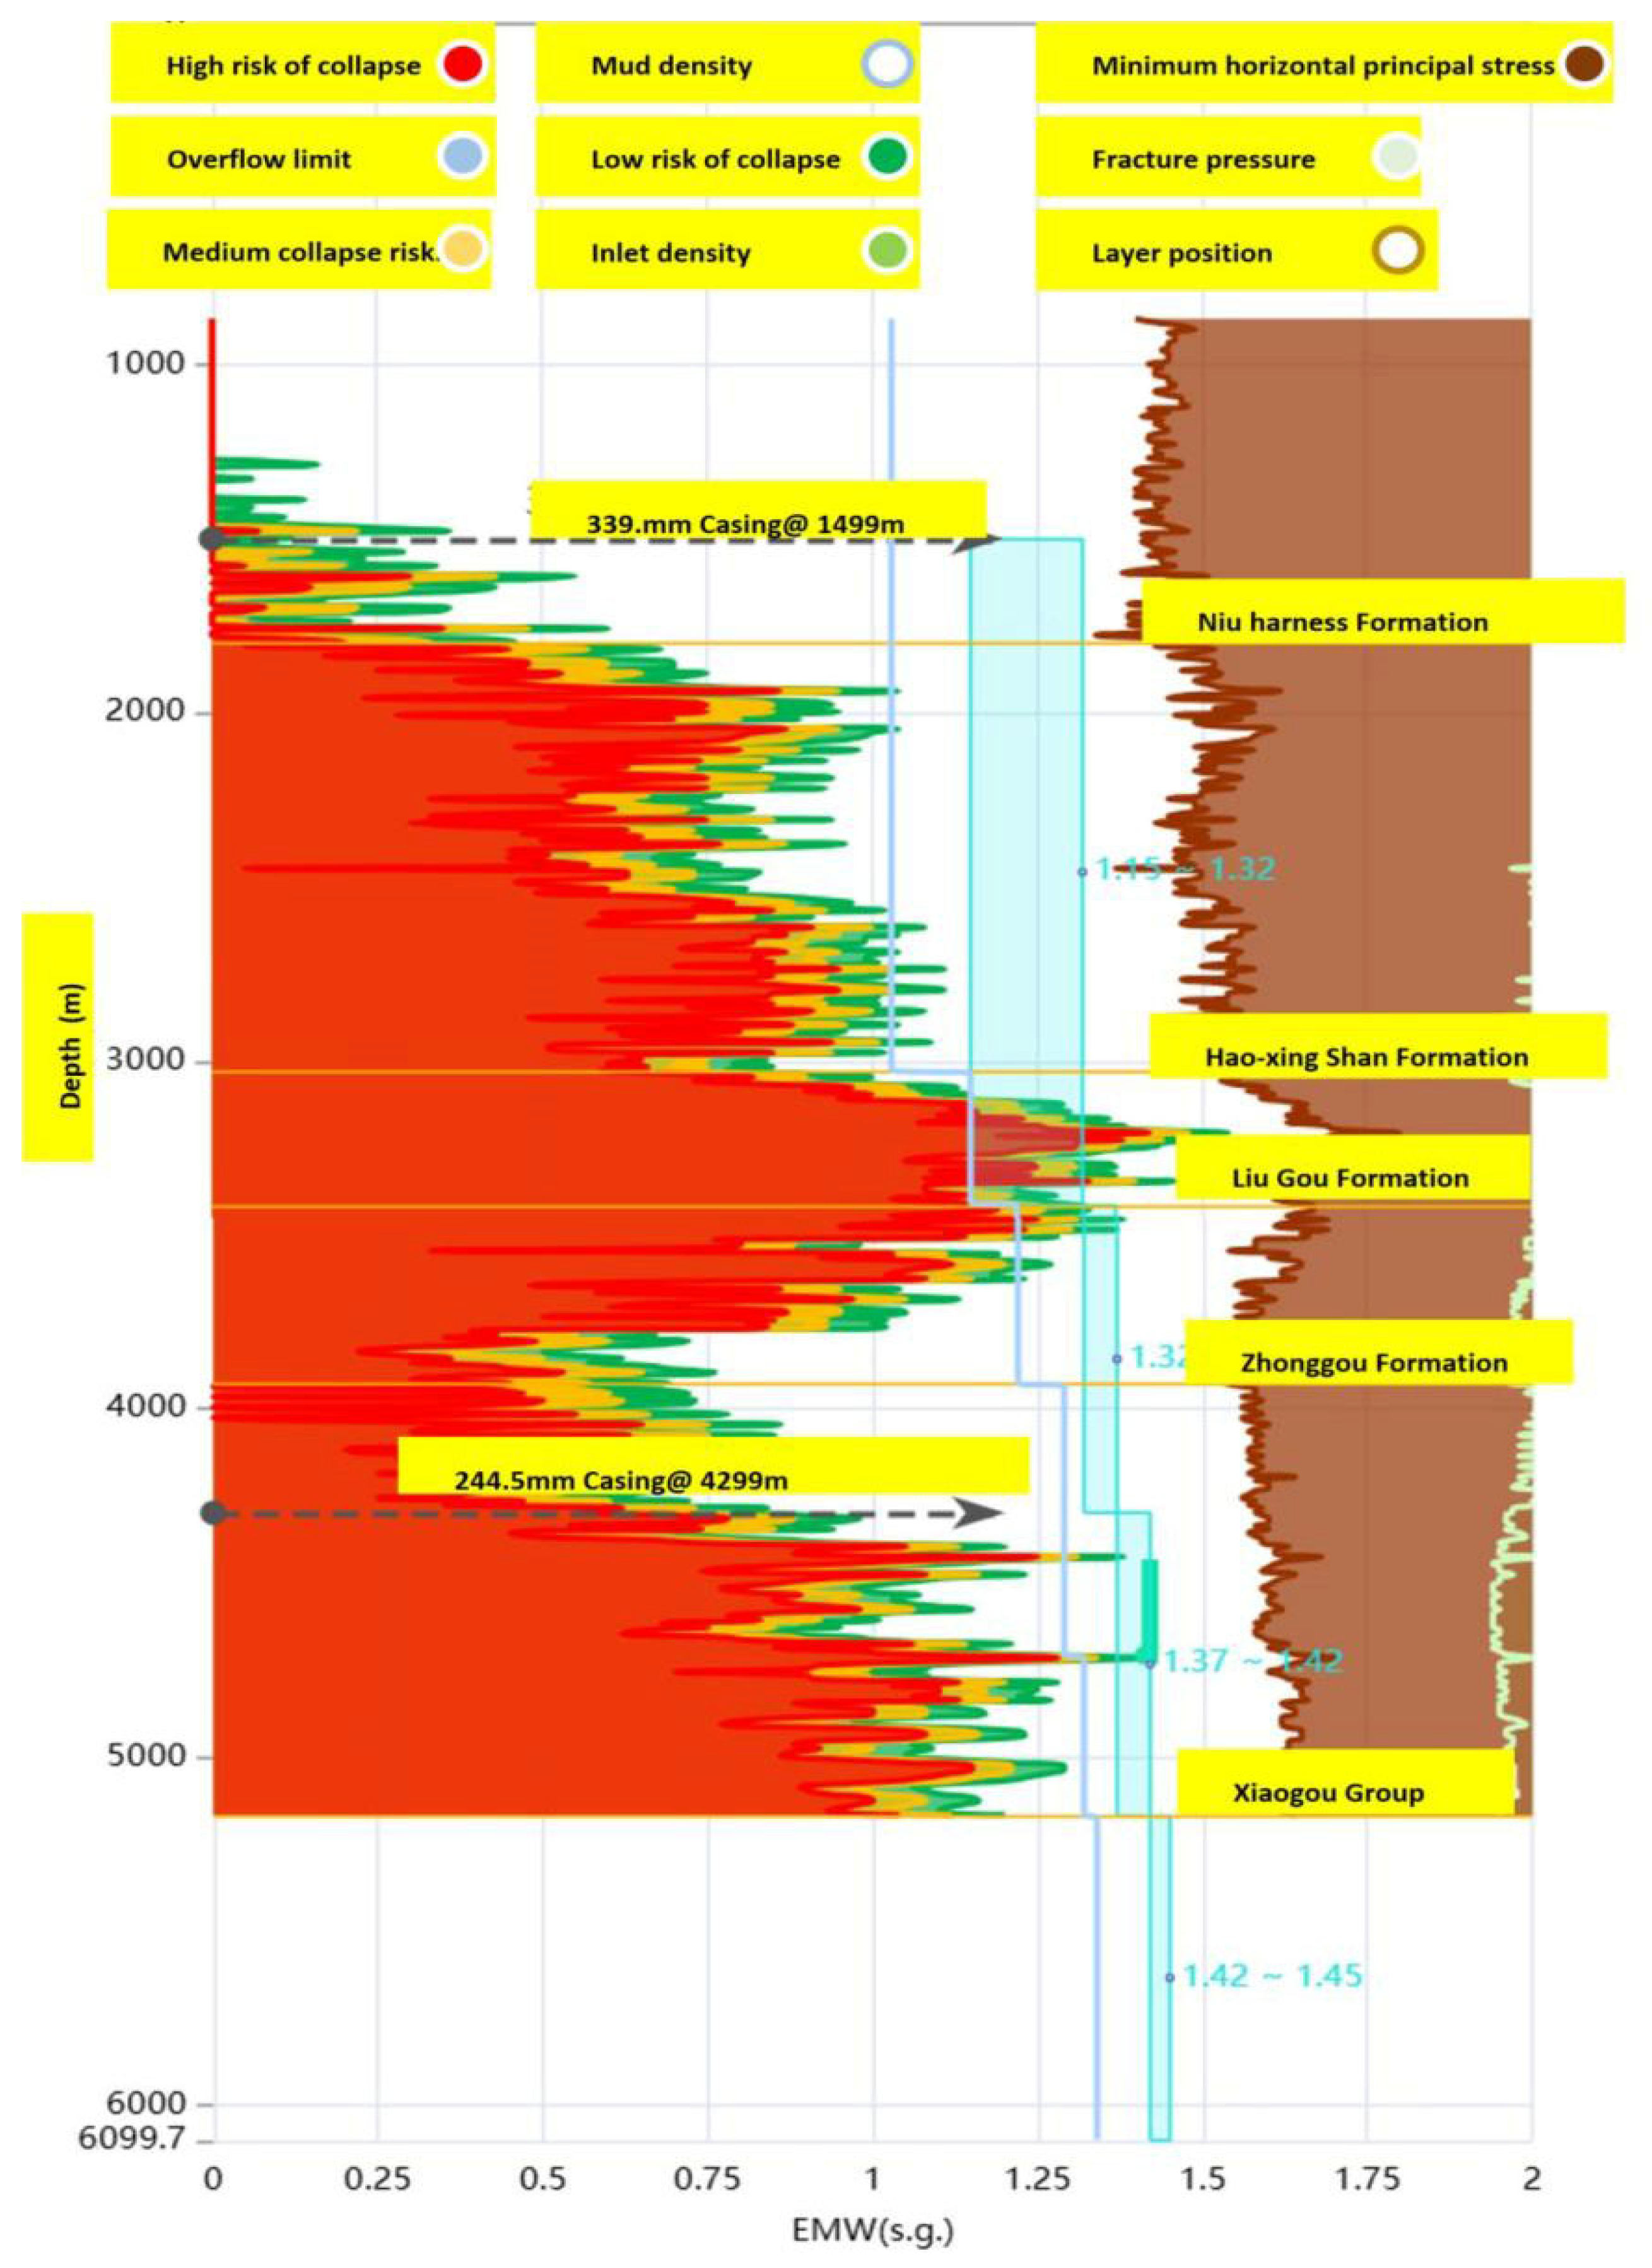
Pre-drilling risk analysis involves constructing a geo-mechanical model for the target area using its parameters before drilling. This model is combined with the design of the planned wellbore trajectory to generate profiles for pore pressure, collapse pressure, and fractured pressure intervals within the target formation. Using the pressure balance principle for the open-hole section, a safe drilling fluid density window is established, accounting for uncertainties. This window is then used to assess risks and predict the feasibility of the drilling design and construction plan [
26]. Using logging data from adjacent wells and information on actual drilling issues (such as lost circulation, overflow, and block losses), combined with the predicted stratigraphic sequence and the designed wellbore trajectory of the target well, a three-pressure profile (accounting for varying risk levels) was calculated and modeled. Additionally, the formation’s lithological components, rock compressive strength, and drillability indicators were analyzed [
27]. This pre-drilling risk profile is shown below (
Figure 9).
3.6. Surface Risk Prevention and Control System Risk Identification While Drilling
Real-time monitoring during drilling primarily involves utilizing comprehensive real-time logging data and measurement parameters from downhole engineering tools, which are integrated with the risk prevention and control system [
28] to perform the following functional monitoring:
Bottom-Hole ECD Calculations and Stability Assessment
Real-time calculations of bottom-hole equivalent circulating density (ECD) during drilling, tripping, and pumping operations are conducted using parameters such as inlet mud density, inlet temperature, formation gradient, displacement, drilling speed, and tripping speed. ECD stands for stationary equivalent static density which is used to measure pressure transmission efficiency. These calculations are compared with real-time downhole ECD measurements. When combined with the three-pressure profile, this process aids in evaluating wellbore stability and allows for timely corrections to ECD calculations, particularly in high-temperature and high-pressure environments [
8].
Friction Monitoring and Sticking Risk Assessment
Ground speed, top drive idling torque, and starting torque are compared with the torque model from pre-drilling engineering mechanics modeling to monitor friction and evaluate the risk of sticking.
Real-Time Prediction and Parameter Optimization
Real-time surface drilling parameters are used to predict bottom-hole drilling pressure, torque, and rotational speed. The drilling parameter optimization module calculates the parameters that minimize energy dissipation in real time.
Drill Bit Sensitivity Analysis
Mechanical drilling speed and downhole rotational speed are used to calculate the sensitivity of the drill bit to weight-on-bit in real time, providing a scientific basis for optimizing drilling parameters.
Analysis of Drillability and Bit Performance
Pre-drilling formation drillability modeling results, combined with real-time drilling parameters, are used to analyze bottom-hole mechanical specific energy (MSE) and assess drill bit performance.
Drilling Tool Risk Prediction
Parameters such as weight-on-bit, trajectory data, and drilling tool weight are used to calculate the neutral point position, lateral force, and bending stress, enabling the prediction of risks to drill tools.
Stick-Slip and Vibration Risk Monitoring
Downhole vibration measurements are combined with surface parameters to monitor and prevent risks such as stick-slip, drill jumping, and eddy currents.
Overflow and Leakage Risk Monitoring
Real-time inlet and outlet flow rates are analyzed to calculate the probability of overflow and to monitor risks related to overflow and leakage.
Sticking Risk Assessment During Tripping Operations
Trends in idling and starting torque are monitored to assess the risk of drill sticking. During tripping operations, the anti-sticking module is used to assist in identifying potential sticking risks.
Directional Efficiency and Inclination Analysis
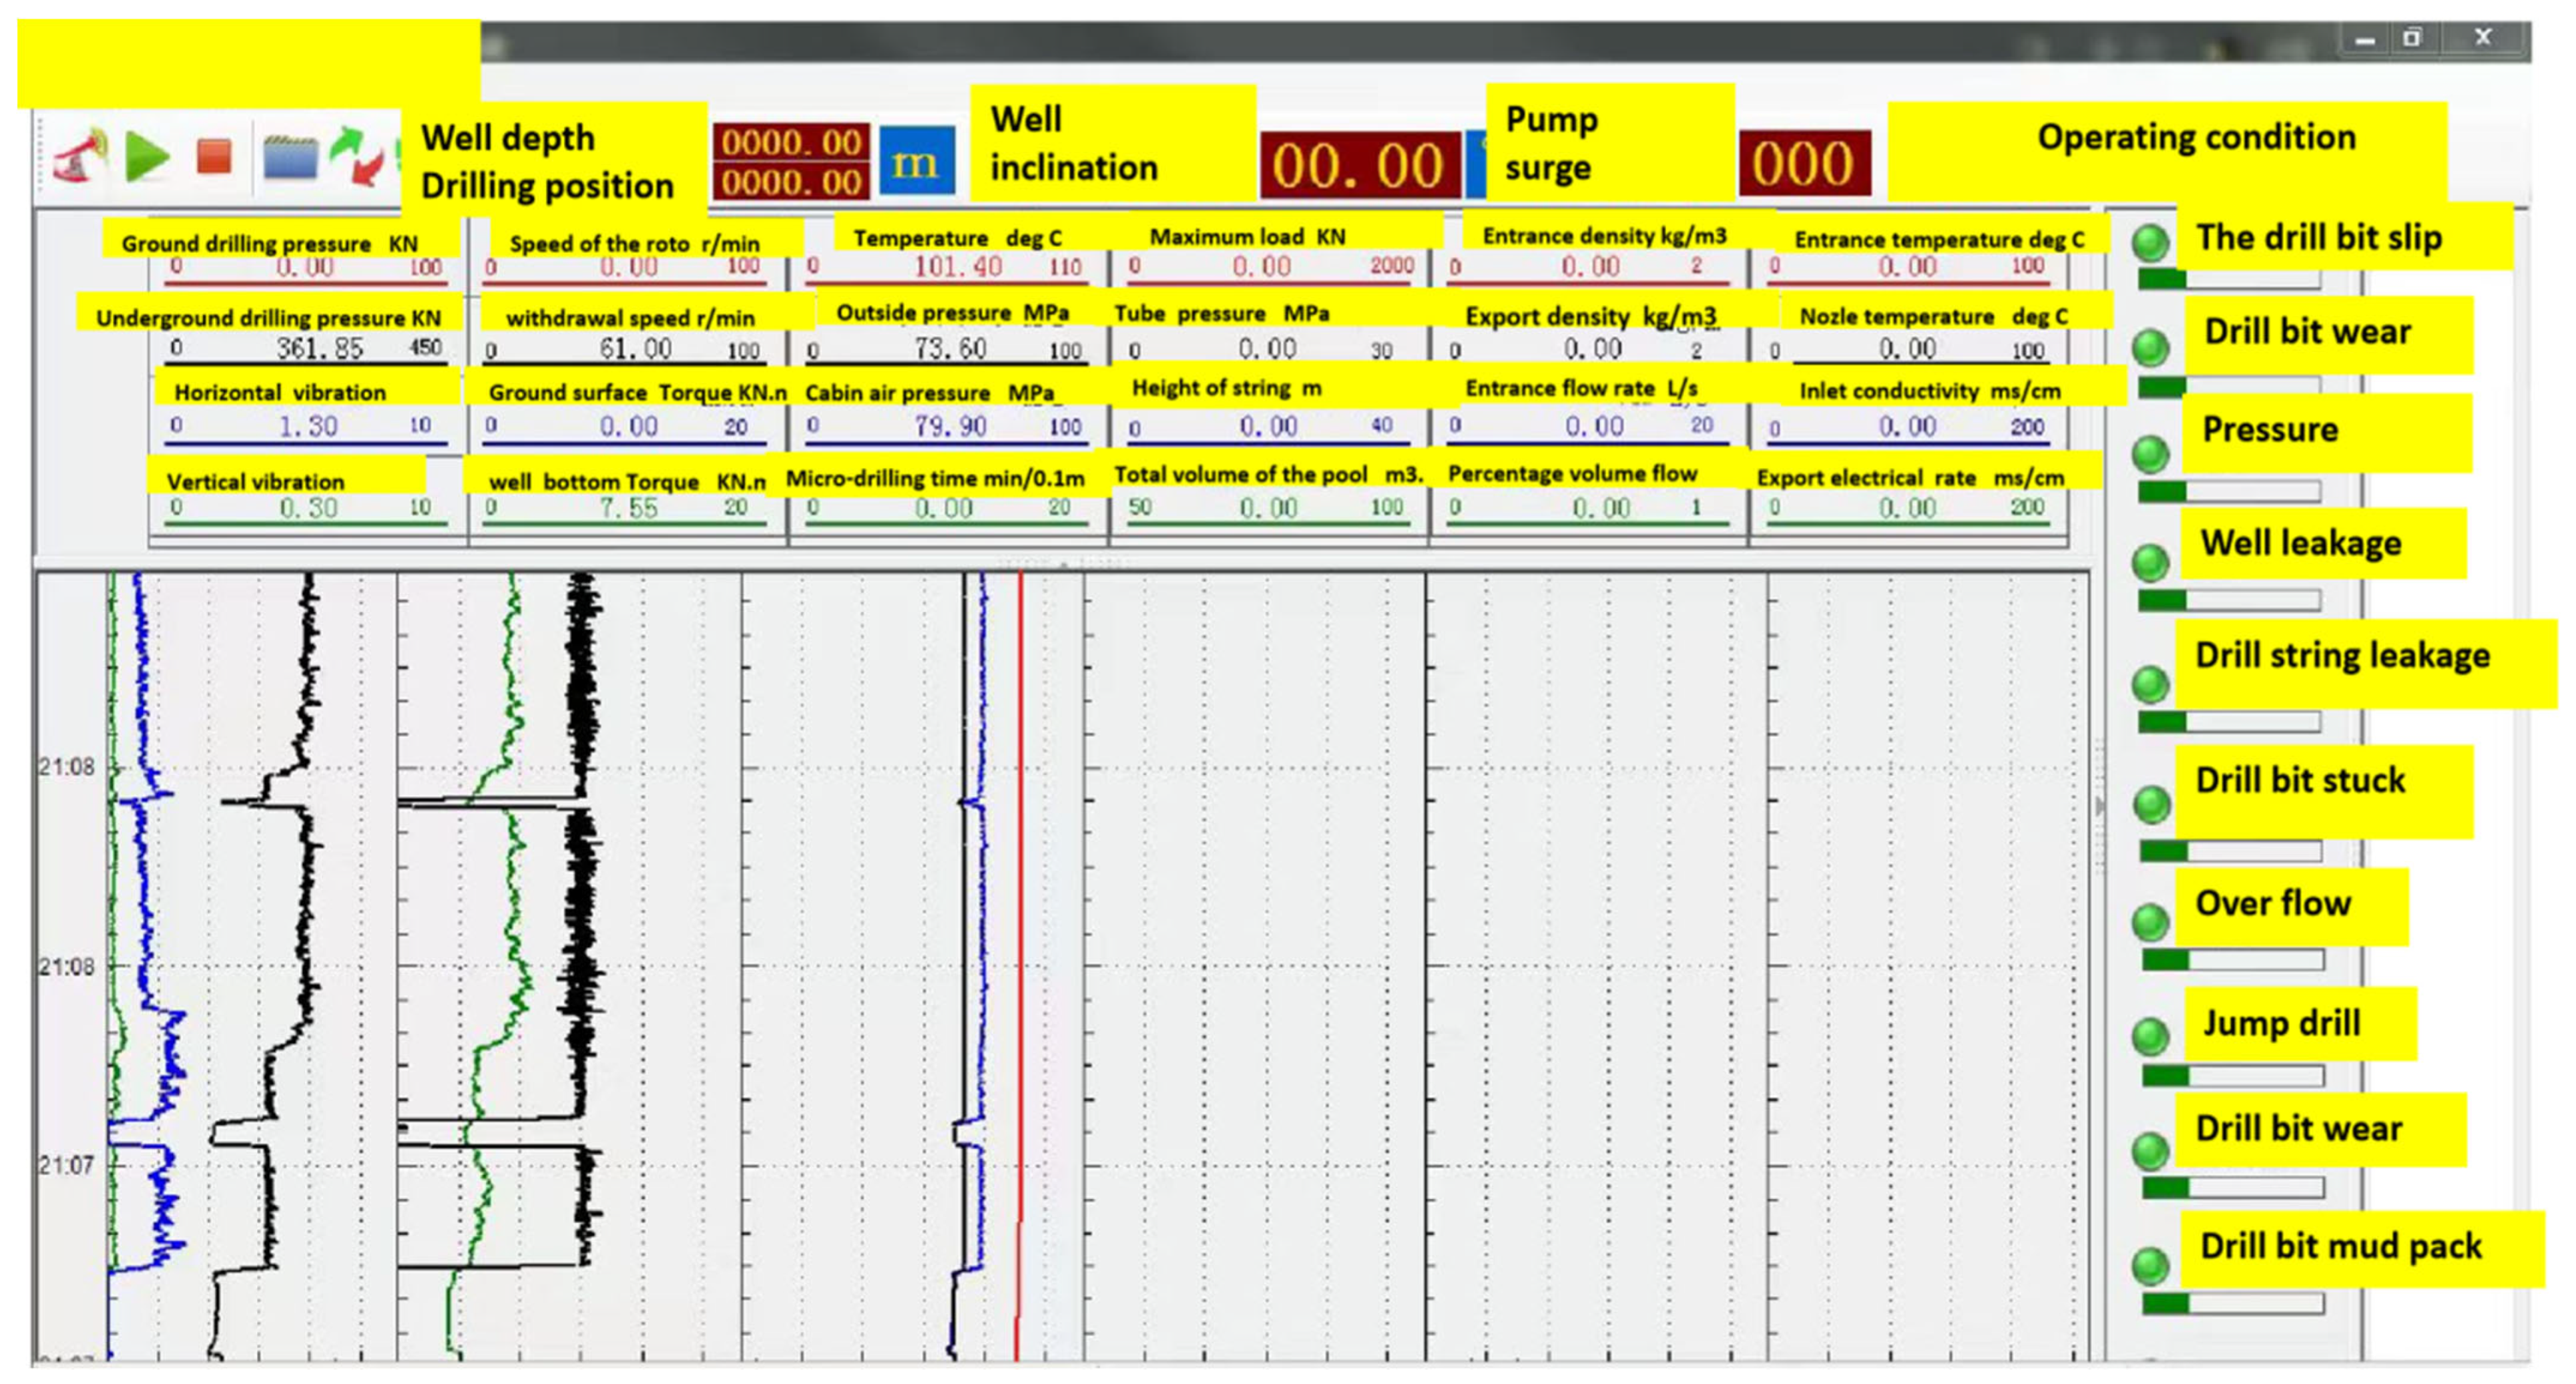
Real-time measurements of well inclination and azimuth are used to monitor directional efficiency. The system assists in analyzing trends in increasing or decreasing inclination caused by the composite drilling tool assembly [
29]. This has been exhibited in
Figure 10, taken from the software used.
3.7. Architecture of the Integrated AI-Powered Risk Evaluation Model
The integrated AI-powered risk evaluation model in this study follows a structured, multi-stage architecture designed to capture, process, and analyze downhole data in real time to provide actionable risk predictions. The system ingests multiple real-time drilling parameters including bottom-hole pressure, equivalent circulating density (ECD), weight on bit (WOB), rate of penetration (ROP), torque, and vibration signals. These inputs are sourced from downhole sensors such as MWD/PWD tools, accelerometers, and pressure sensors, as well as surface rig instrumentation. To account for noise and sensor drift, all inputs undergo preprocessing steps such as outlier filtering, normalization, and time alignment before entering the model.
The core of the architecture consists of three layers. First, a feature extraction layer transforms raw sensor data into diagnostic features such as RMS vibration, stick-slip index, pressure fluctuation profiles, and torque deviation signatures, with both time-domain and frequency-domain features computed locally. Next, a machine learning layer employs a hybrid AI framework that combines convolutional neural networks (CNNs) for pattern recognition in time-series signals with gradient boosting models for structured drilling parameters. To address the challenge of scarce “rare event” data such as kicks or stuck pipe, the framework incorporates synthetic minority oversampling (SMOTE) and physics-informed augmentation techniques. Additionally, anomaly detection models based on autoencoders are used to recognize deviations even when labeled rare-event data are limited. Finally, a decision fusion and risk scoring layer integrates outputs from the multiple models using a weighted voting mechanism that prioritizes those validated as more reliable for specific event categories—for example, CNN outputs for vibration-related risks and boosting models for hydraulic anomalies. This fusion process generates a unified risk index on a scale of 0–1, where thresholds trigger graded warnings ranging from early warning to high-risk alert.
The final outputs of the system include real-time alerts to rig operators, quantitative risk scores, and recommended control actions such as adjusting WOB, altering mud weight, or reducing ROP. These outputs are displayed on the surface control interface and simultaneously logged for post-drilling analysis. Importantly, post-drilling evaluations are automatically fed back into the training dataset, enabling continuous improvement of the model’s predictive performance. This dedicated architecture section provides clarity on the model’s design, ensuring transparency and reproducibility while highlighting how AI augments traditional drilling risk assessment through structured data fusion, rare-event handling, and adaptive feedback.
4. System Ground Testing and Field Testing
4.1. Calibration of Underground Engineering Parameter Tests
An indoor pressure test was performed on two sets of tools, maintaining a pressure of 138 MPa for 30 min. No pressure drop was observed, and both sets successfully passed the test. This test has been represented graphically in
Figure 11 given below.
Calibrate the weight-on-bit, bending moment, and torque with the following specifications:
Weight-on-bit: −150 kN to +150 kN, ±5% FS,
Torque: −20 kN·m to +20 kN·m, ±5% FS, and
Bending moment: −30 kN·m to +30 kN·m, ±5% FS.
The test results are consistent with the thermal performance evaluation of the engineered backfill system under cyclic and steady conditions [
30]. Based on the above test and calibration data, multiple conclusions can be drawn. Firstly, it represents structural reliability. Both tool sets demonstrated high mechanical reliability by withstanding high pressure (138 MPa) with no loss in integrity, indicating suitability for deep and high-pressure underground operations. Secondly, it assists in measuring accuracy. Calibration of the three key parameters, i.e., WOB (weight-on-bit), torque, and bending moment, confirms the tools are within acceptable accuracy thresholds (±5% FS), ensuring reliable data acquisition in field operations. Thirdly, the tools meet technical field-testing requirements, validating their readiness for deployment in real drilling environments. Finally, the pressure test and calibration outcomes collectively increase confidence in the data fidelity collected during downhole operations, aiding in better drilling optimization and risk mitigation. A comparison table of weight-on-bit, bending moment, and torque calibration data are illustrated below in
Table 2.
4.2. Field Test of the Underground Risk Prevention and Control System
The field tests were conducted in the Qingxi Sag of the Jiuxi Depression within the Jiuquan Basin. The Qingxi Sag, located in the western part of the Jiuquan Basin, is a prominent Cenozoic tectonic depression formed during the Himalayan orogeny. It represents one of the major hydrocarbon-bearing subunits within the basin. Characterized by a thick accumulation of Paleogene to Neogene lacustrine sediments, the sag has undergone multiple phases of tectonic activity that have influenced its stratigraphic architecture and petroleum system. Its unique structural and depositional features make it a crucial site for studying sedimentary basin evolution and hydrocarbon prospectivity in northwest China. This study focuses on the Qingxi Sag due to its well-preserved stratigraphy, complex fault systems, and active petroleum exploration, which provide a valuable framework for interpreting basin dynamics and resource potential [
9]. The target formations include the Xiagou Formation (K1g1 and K1g0) and the Chijinbao Formation (K1c). Drilling operations progressed through three stages, encountering both the Xiagou and Chijinbao Formations. The third well section presented significant challenges, including poor drillability, difficulties in prevention of deflection, risks of leakage and blowouts. offers valuable insights into the effectiveness of underground risk prevention and control systems in complex drilling environments. The lithology primarily consists of mudstones like calcareous mudstone and argillaceous dolostone, interspersed with gravelly sandstone, gritty conglomerate, and sandy mudstone. The test well’s depth ranges from 4650 m to 6100 m. Based on the formation pore pressure values, the predicted downhole pressure is between 67.493 MPa and 95.746 MPa, which meets the system’s pressure requirements.
Geomechanical modeling predicted downhole pressures in the range of 67.5–95.7 MPa. However, during the field trial, the actual measured bottom-hole pressure did not exceed 59.2 MPa, with temperatures reaching approximately 115 °C. These values fall within the tool’s certified laboratory rating of 61.4 MPa and 120.8 °C. This indicates that although the tool was designed to withstand high-pressure environments, the specific well conditions encountered during the trial did not subject it to the maximum predicted pressures. The results nonetheless validate the tool’s ability to function reliably under demanding downhole conditions.
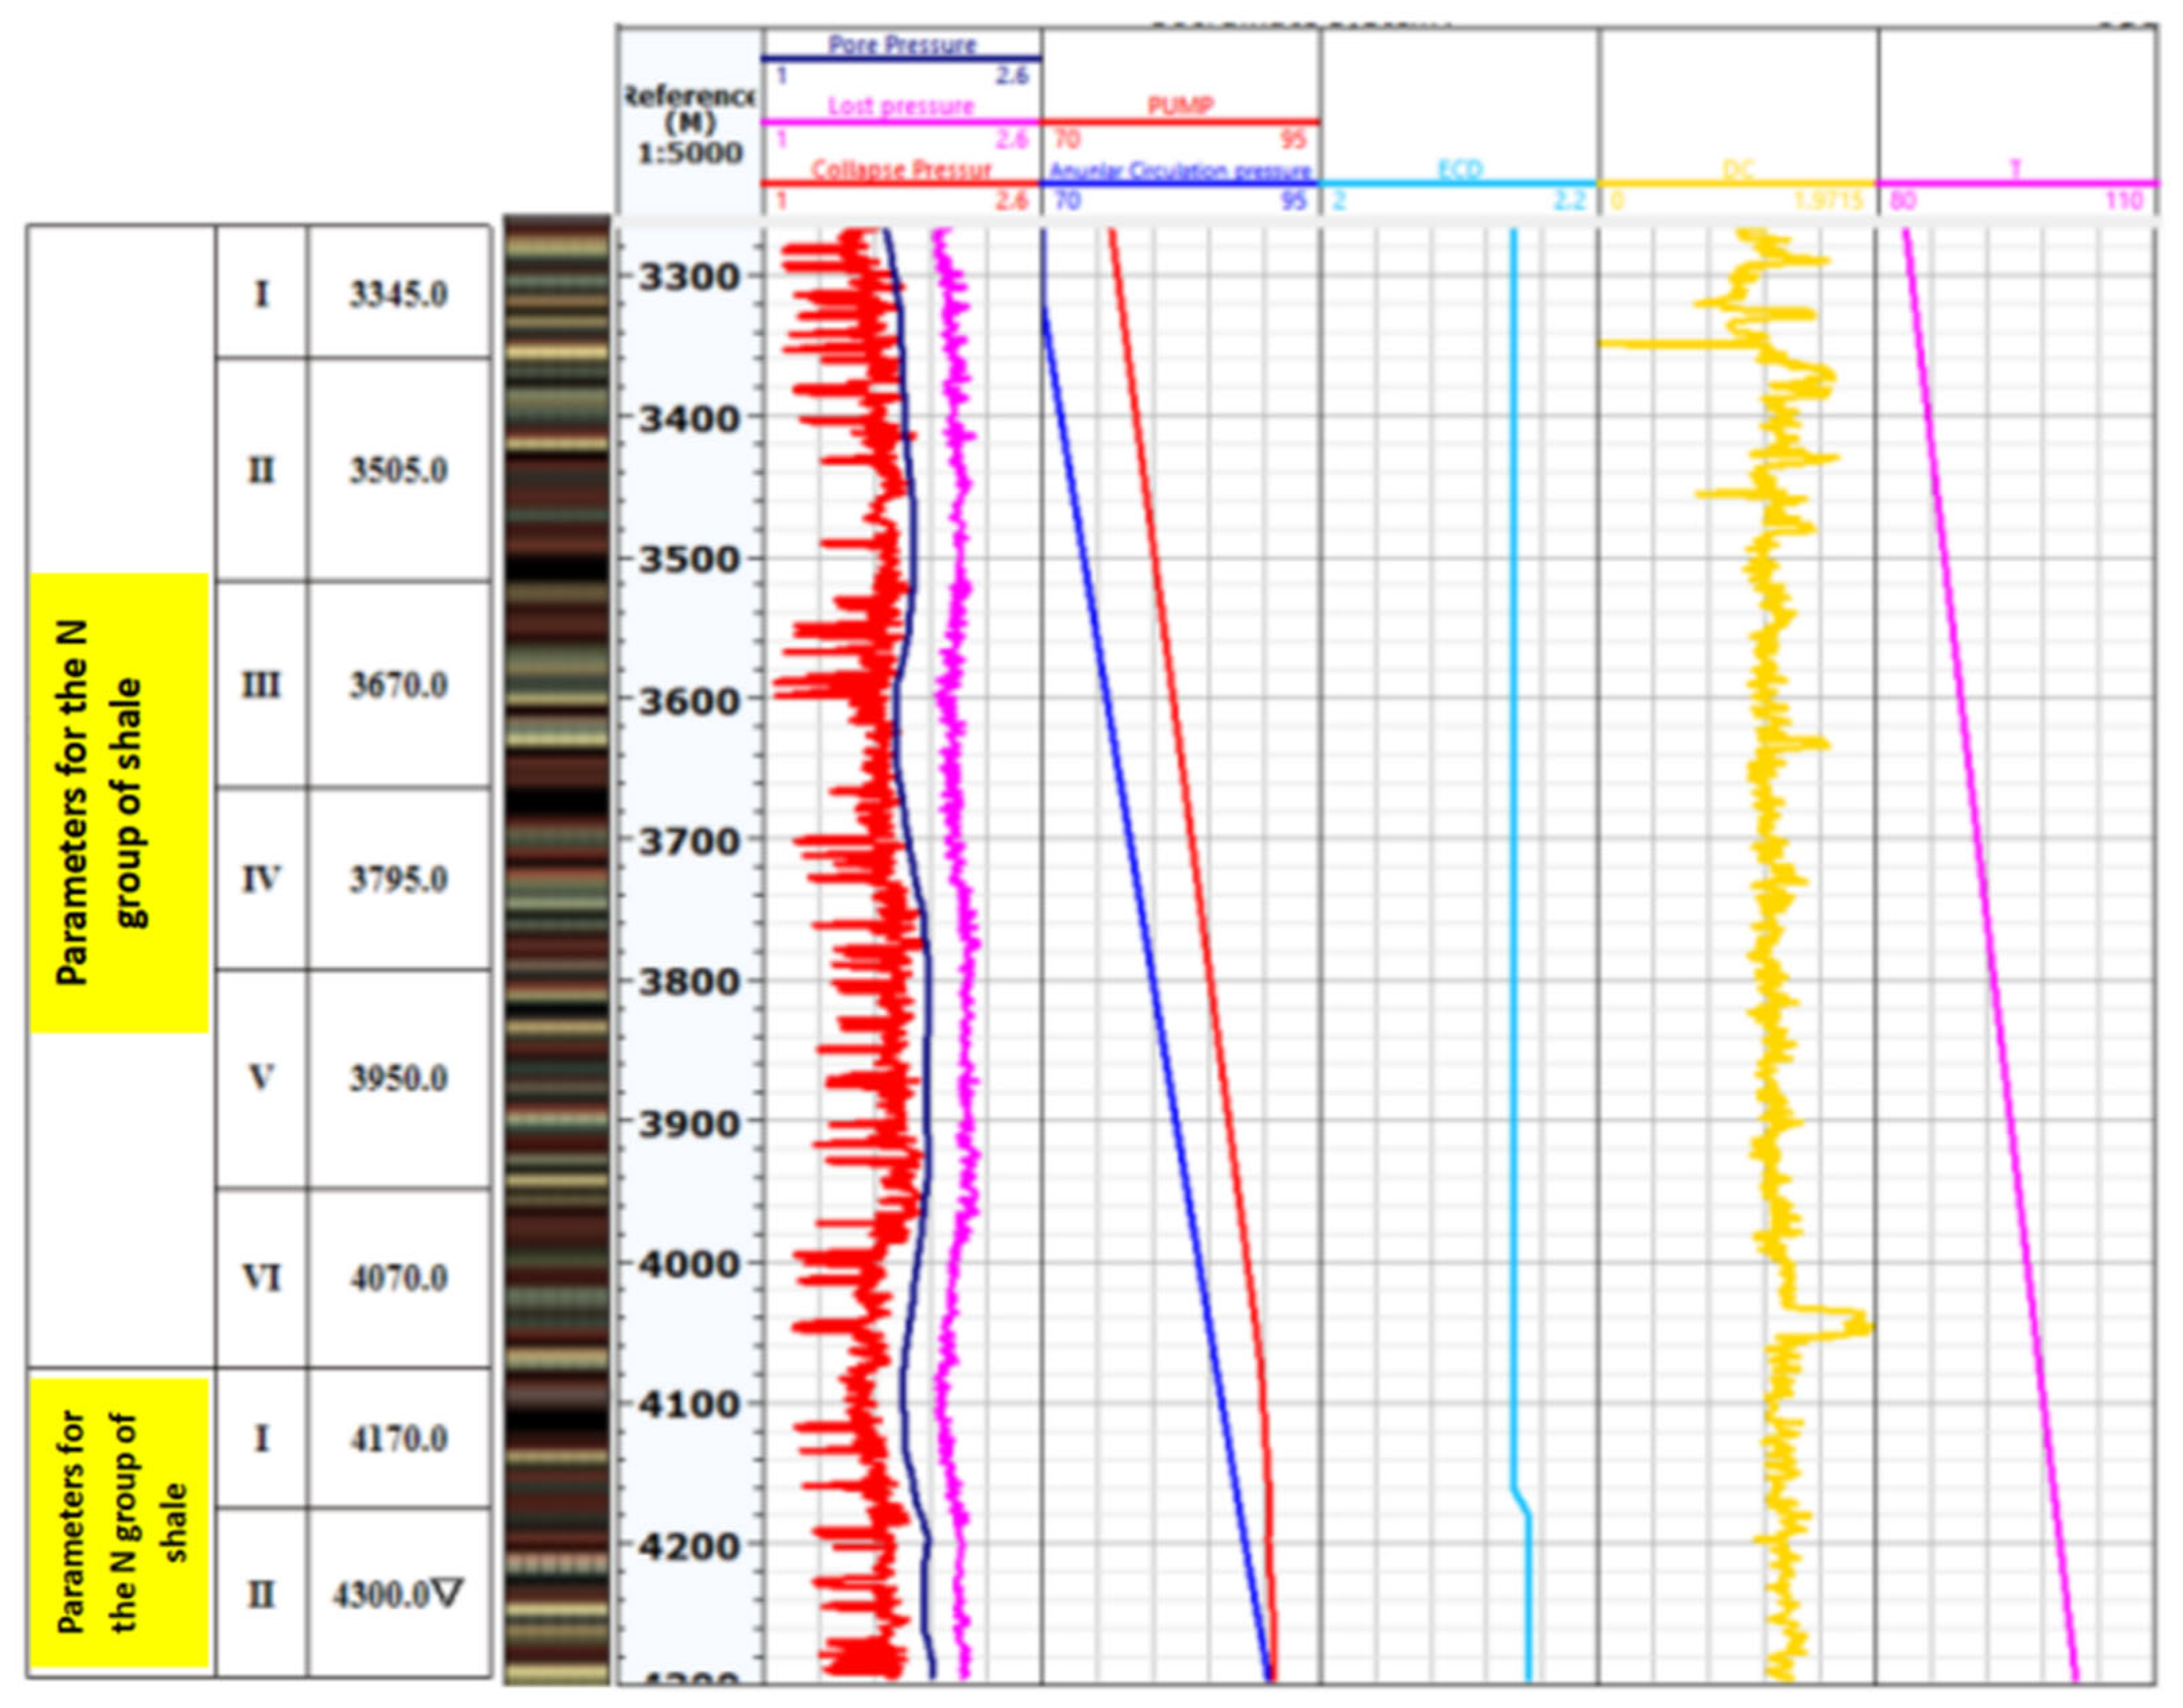
The overall test plan is structured as follows: Before drilling, the factors limiting the speed increase in adjacent wells are analyzed, and downhole inefficiency events are identified. Mechanical specific energy (MSE) curves are combined with step-by-step testing to optimize the drilling parameters, reduce inefficiencies, and improve the rate of penetration (ROP). During the drilling process, well inclination data, drill bit parameters, and the bending moment of the drill string are monitored in real time. These data are used to fit various indices of the downhole formation, adjust the software parameter model, and predict changes in the inclination trends of the drill tool assembly. The drilling parameters are optimized to improve the tool’s passive anti-deflection ability and to refine the direction of the drilling tool assembly. At the same time, bottom-hole pressure is closely monitored. Wellbore pressure modeling is applied, including equivalent circulating density (ECD) and pumping pressure tracking analysis, to provide scientific recommendations for optimizing on-site parameters such as mud density, displacement, and tripping speed.
The surface risk prevention and control system are used to analyze the difference between downhole annulus pressure and pre-drilling predictions of formation pore pressure and fracture pressure. It also compares the actual calculated drill collar (DC) values with the pre-drilling predictions. This information helps establish a risk prevention and control model to monitor and mitigate risks like overflow and lost circulation. After drilling, the damage modes of the retrieved drill bit are assessed, and findings are summarized to guide regional optimization and improve drilling efficiency. The insights gained are incorporated into a real-time closed-loop optimization process for future operations.
4.3. Pre-Drilling Risk Analysis
There may be faults or fractures in the middle section of test well K1g0 and along the unconformity interface between K1g0 and K1c. Additionally, the lower part of the Chijinbao Formation has not been drilled or exposed in adjacent wells, and there are no available geological reference materials. This introduces uncertainties and increases the well control risk, particularly the risk of transitioning from “leakage to overflow.”
Before drilling, a geo-mechanical pre-drilling model of the target area was constructed. This model, combined with the planned wellbore trajectory design, was used to develop pore pressure, collapse pressure, and fracture pressure interval profiles for the target formations. Following the pressure balance principle for open-hole sections, a safe drilling fluid density window, accounting for uncertainties, was established. Risk assessment and prediction were conducted using drilling design and construction plans.
Using the risk prevention and control system, data from adjacent wells, actual drilling challenges (such as losses, overflows, block losses) predicted stratigraphic sequences, and the designed well trajectory were analyzed. Computational modeling was performed to generate a three-pressure profile for the test wells, reflecting varying risk levels. This profile, as shown in
Figure 12, incorporates information about formation lithological components, rock compressive strength, and formation drillability indicators.
According to geo-mechanical modeling, the following well sections have a higher risk of collapse: 4400–4600 m. Additionally, the 4650–4705 m section poses a significant risk of wellbore instability, with potential hazards such as falling debris and stuck drill incidents. During drilling, particular attention should be given to maintaining the mud density within the recommended upper limit for these sections. Real-time monitoring of bottom-hole equivalent circulating density (ECD) is crucial. If debris or lumps are observed on the vibrating screen during drilling, they should be promptly collected for analysis. The mechanism behind the formation of these lumps should be assessed based on their shape and the mud density should be adjusted accordingly to mitigate further risks. Pre-drilling risk analysis provides information related to the presence of faults, fractures, and unconformities, particularly in the K1g0–K1c transition zone, introduces a high level of uncertainty. It is significant because the lack of prior drilling further elevates the risks due to insufficient geological reference data. In addition, the development of pore pressure, collapse pressure, and fracture pressure profiles based on wellbore trajectory and rock properties is instrumental. This modeling enables the definition of a safe drilling fluid density window, minimizing risks of wellbore collapse or hydraulic fracturing. Furthermore, the use of real-time equivalent circulating density (ECD) monitoring allows for dynamic responses to changing downhole conditions. Lastly, high-risk Intervals are identified. The 4400–4600 m zone is highlighted as particularly prone to wellbore collapse, while 4650–4705 m is vulnerable to instability and stuck pipe events. Focused monitoring and mitigation in these zones are critical to avoiding non-productive time (NPT) and equipment damage. From a practical standpoint, this strategy is highly applicable to high-pressure, high-temperature (HPHT) wells, frontier wells with limited geological data, deep wells where margin for error is low, and Unconventional reservoirs with high heterogeneity.
4.4. Risk Identification While Drilling
Drilling test and construction conditions.
The first drilling test section spans 4500.50–4558.50 m, covering a total footage of 58 m. The instrument signals are functioning normally, and the collection and transmission of various parameters are operating as expected. Additionally, the risk prevention and control system has not issued any warnings. Upon reaching a depth of 4558.50 m, well logging monitoring indicates a suitable display, leading to the decision to commence coring operations as indicated in
Table 3.
The second drilling test section extends from 4565.79 m to 4657 m, covering a total footage of 91.21 m. The instrument signals are functioning properly, and the collection and transmission of various parameters are operating as expected. Additionally, the risk prevention and control system has not issued any warnings. Upon reaching a depth of 4657 m, well logging monitoring indicates a suitable display, leading to the decision to begin coring operations as demonstrated in
Table 4.
Risk prediction while drilling.
The following risks were predicted and identified while the drilling process was on;
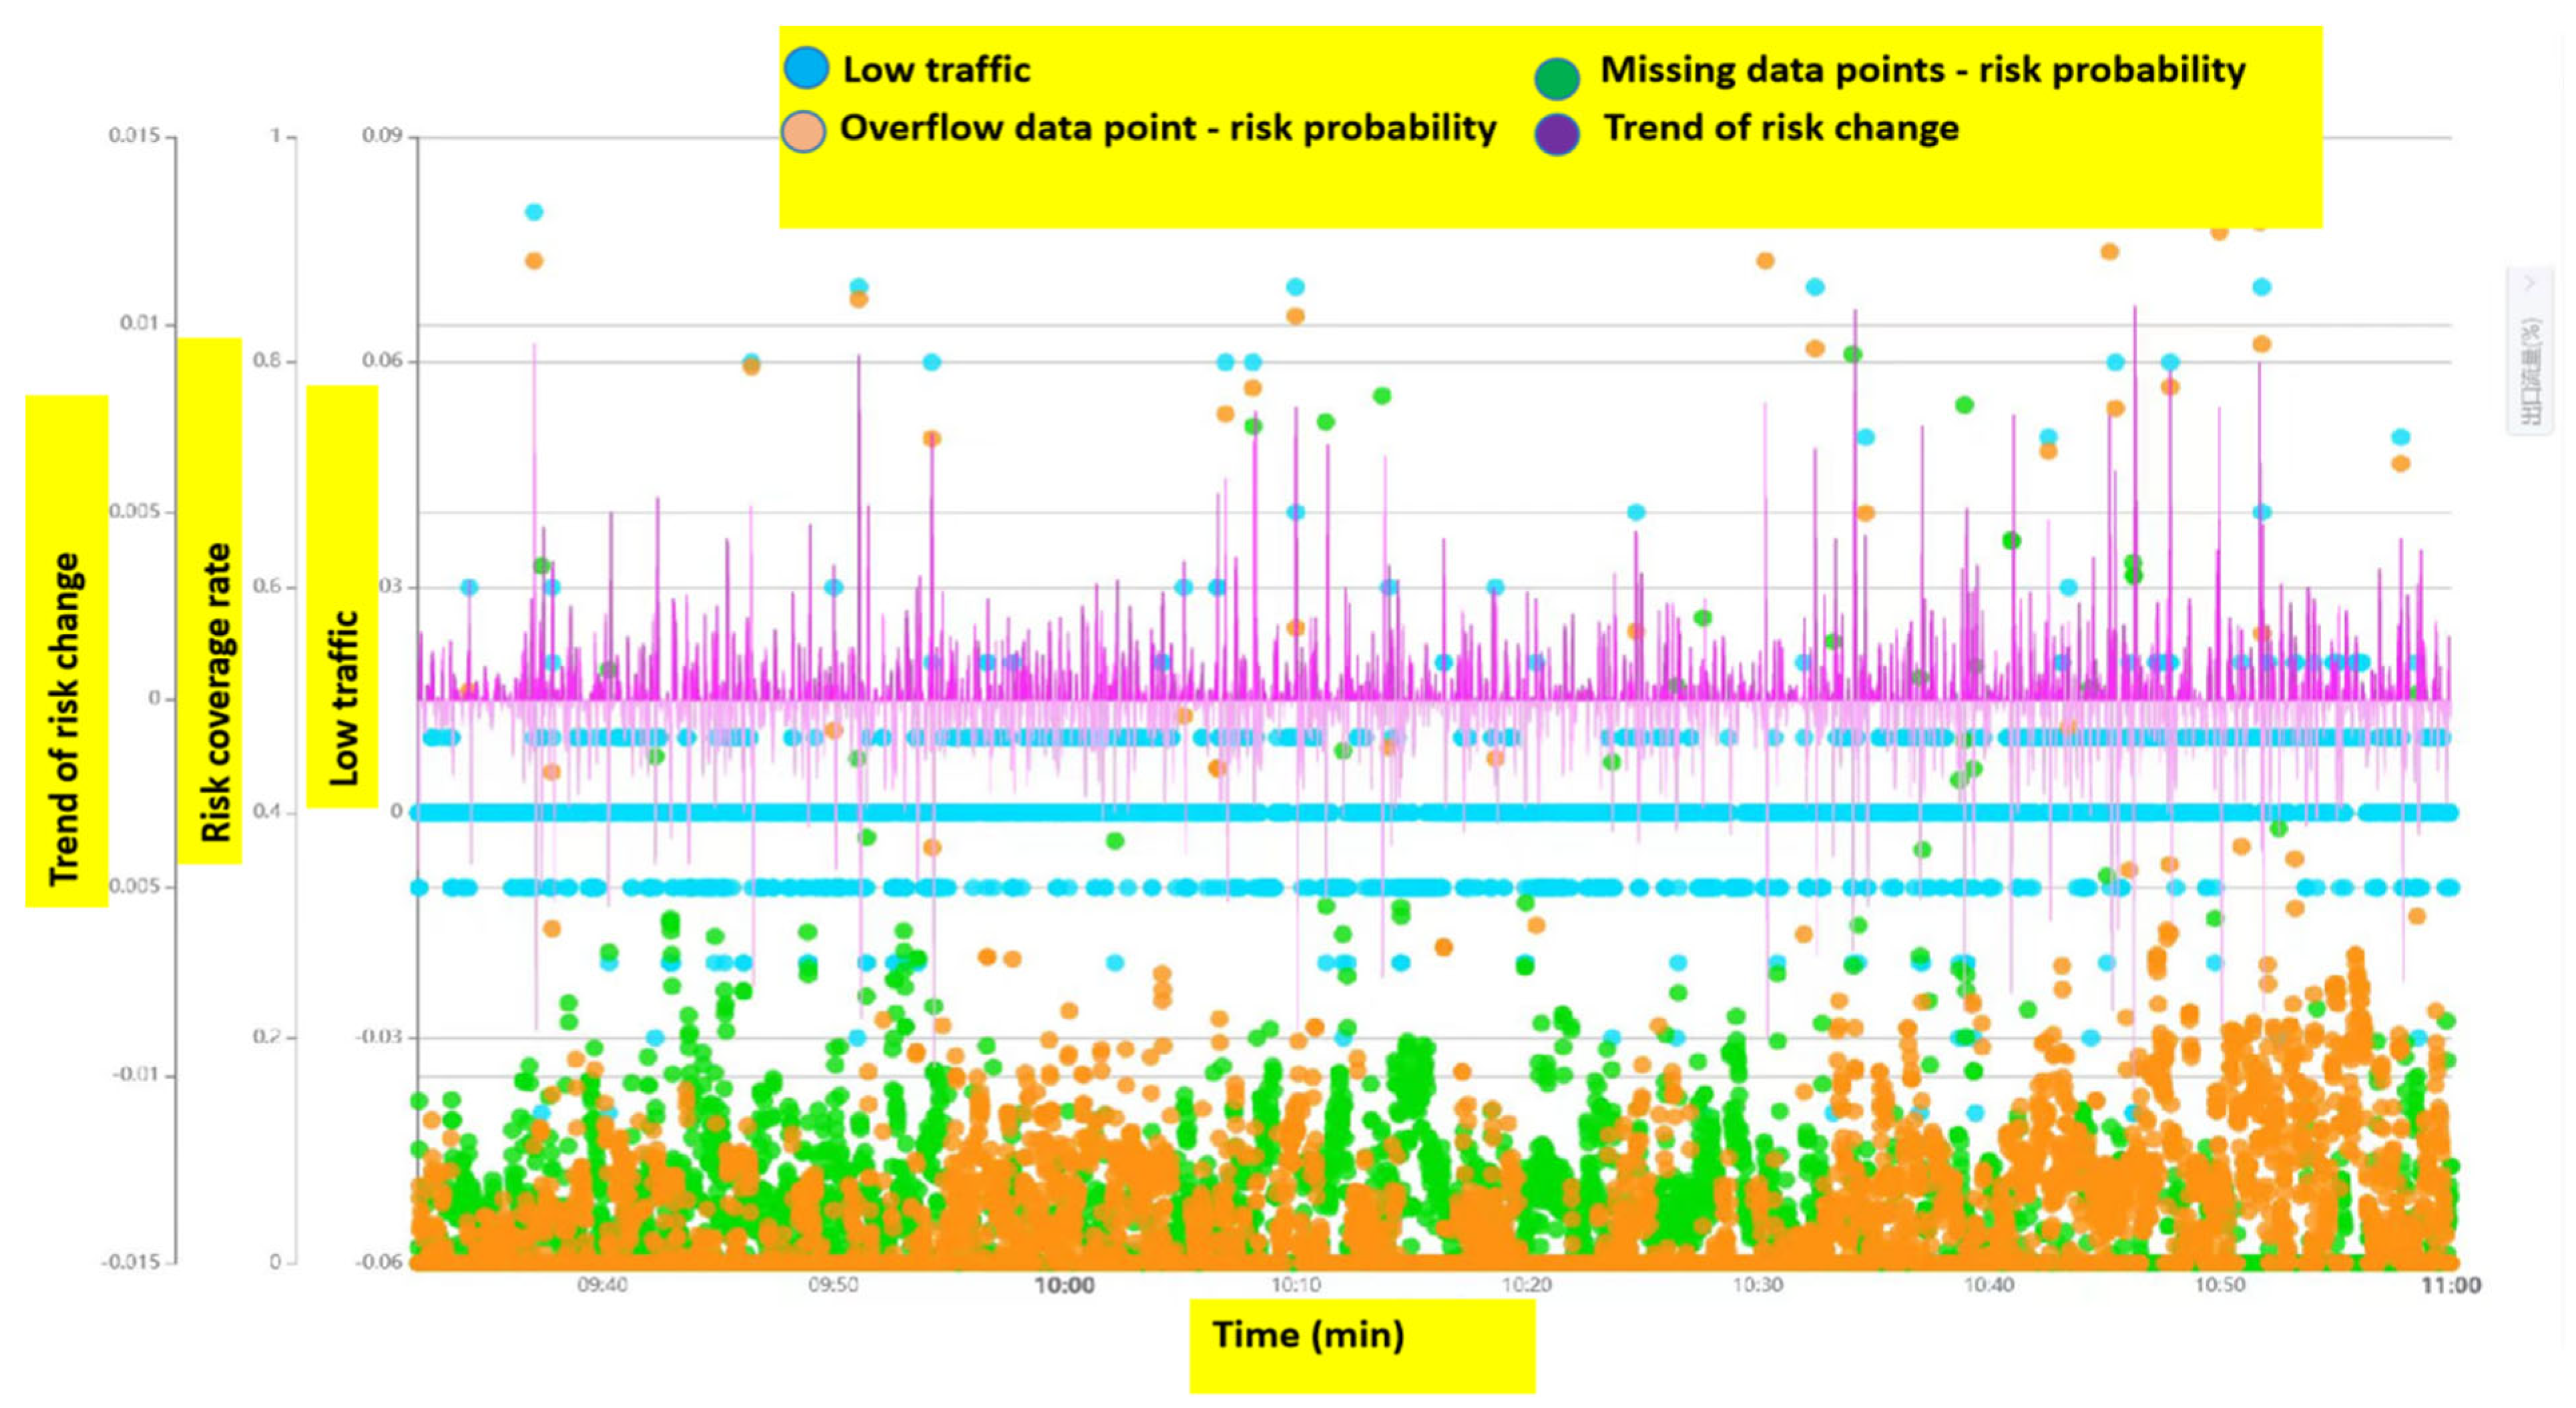
A significant amount of data on inlet and outlet flow differences and pool volume changes was collected and processed through the risk prevention and control system. The system calculated the probability of leakage and overflow risks in real time, displaying the trends as percentages. During the test, real-time monitoring charts of overflow risk indicated that the risk of drilling loss and overflow was extremely low when the pump was started, as represented in
Figure 13 below.
Based on the sensitivity analysis of pumping pressure during tripping and equivalent circulating density (ECD) during drilling, it was observed that the ECD remained below the leakage pressure threshold. As a result, a higher tripping speed could be used to enhance time efficiency and reduce cycle time while maintaining downhole safety. No leakage incidents occurred during this drilling operation.
- b.
Identification of Downhole Drilling Tool Risks
The experimental data collected during the test indicated that the tensile strength, torsional resistance, lateral force bending stress, and Von Mises Equivalent (VME) stress of the drilling tools used in Well Liuye 1H were within the design specifications. No risks related to drilling tools were identified. Additionally, there were no downhole drilling tool accidents during the actual drilling process, confirming the reliability of the tools in this test.
- c.
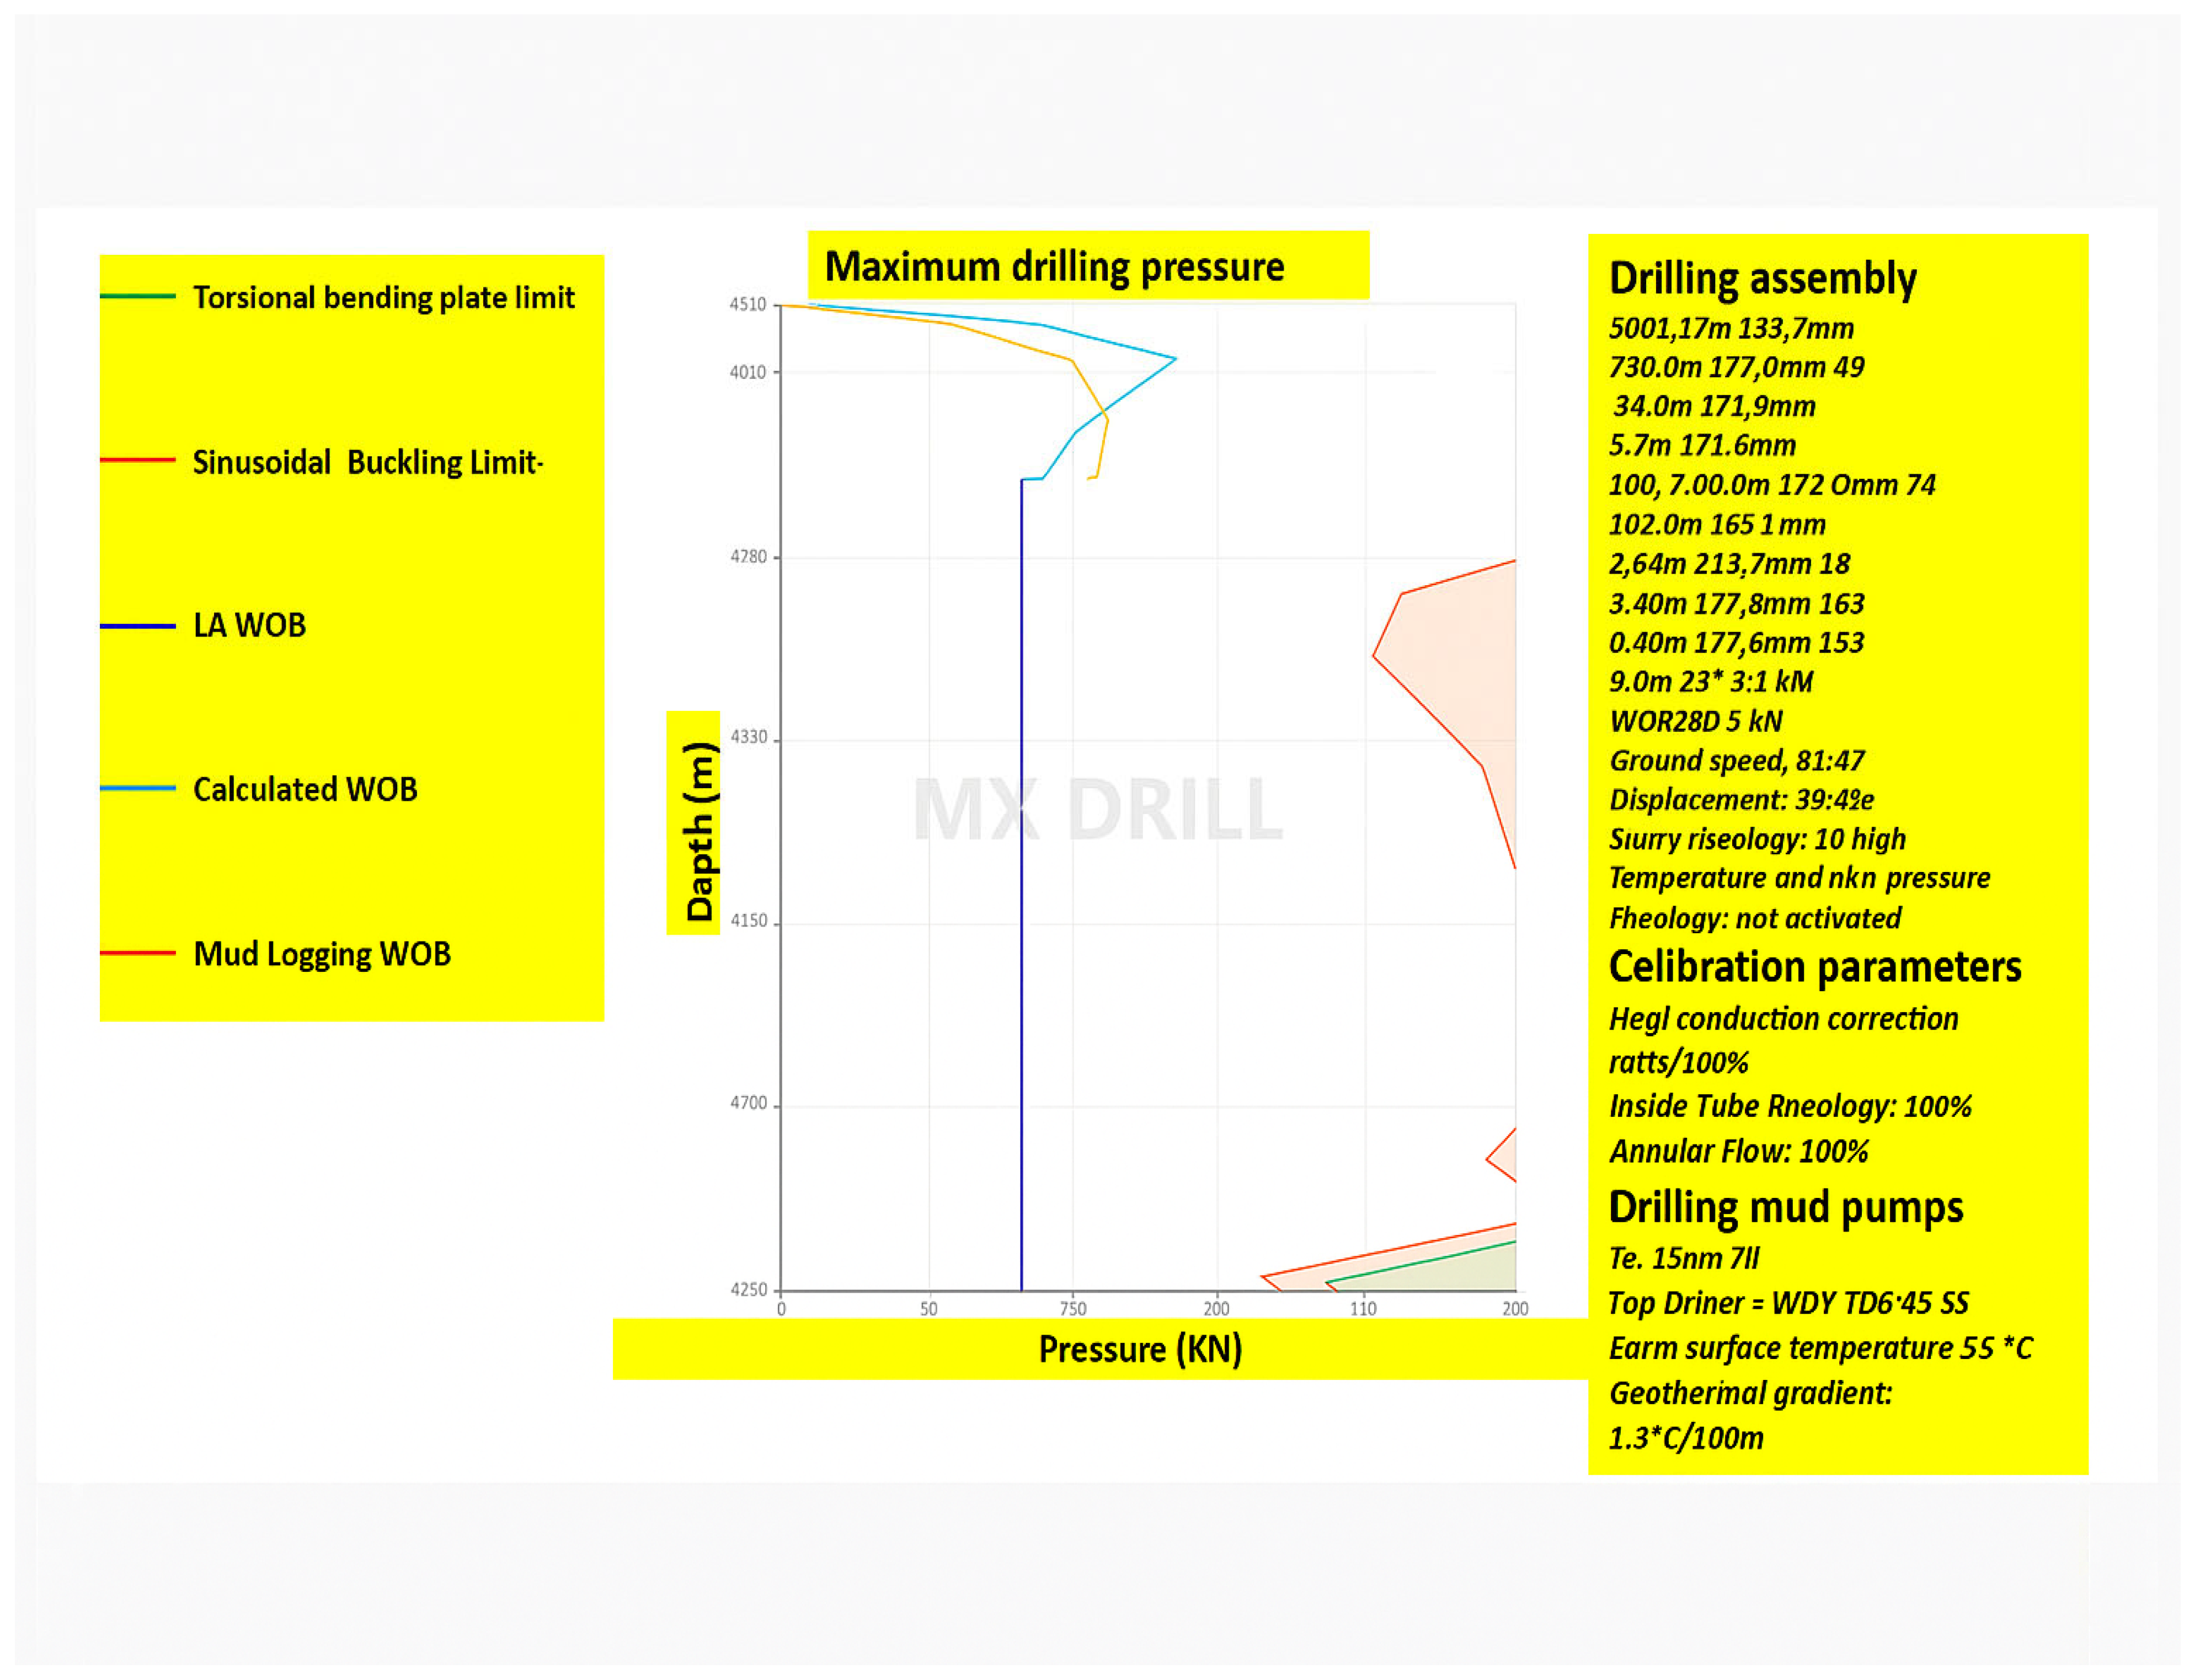
Identification of Drill Sticking Risks via Starting and Idling Torque
During drilling, tracking the trends of starting torque and idling torque differences allowed for quick and intuitive judgments about bottom-hole conditions. The test wellbore demonstrated good cleanliness, and the quality of the mud cake was high, ensuring better performance in maintaining wellbore stability and cleanliness. The friction and torque module of the downhole risk prevention and control system calculated the downhole drilling pressure in real time and compared it with surface drilling pressure. The system, combined with real-time downhole measurements of drilling pressure (represented by green dots) demonstrated high drilling pressure transmission efficiency for the test well section. This efficiency further contributed to the safe and effective progress of the drilling operation as highlighted in
Figure 14.
4.5. Post-Drilling Data Analysis
4.5.1. Drill Bit Analysis
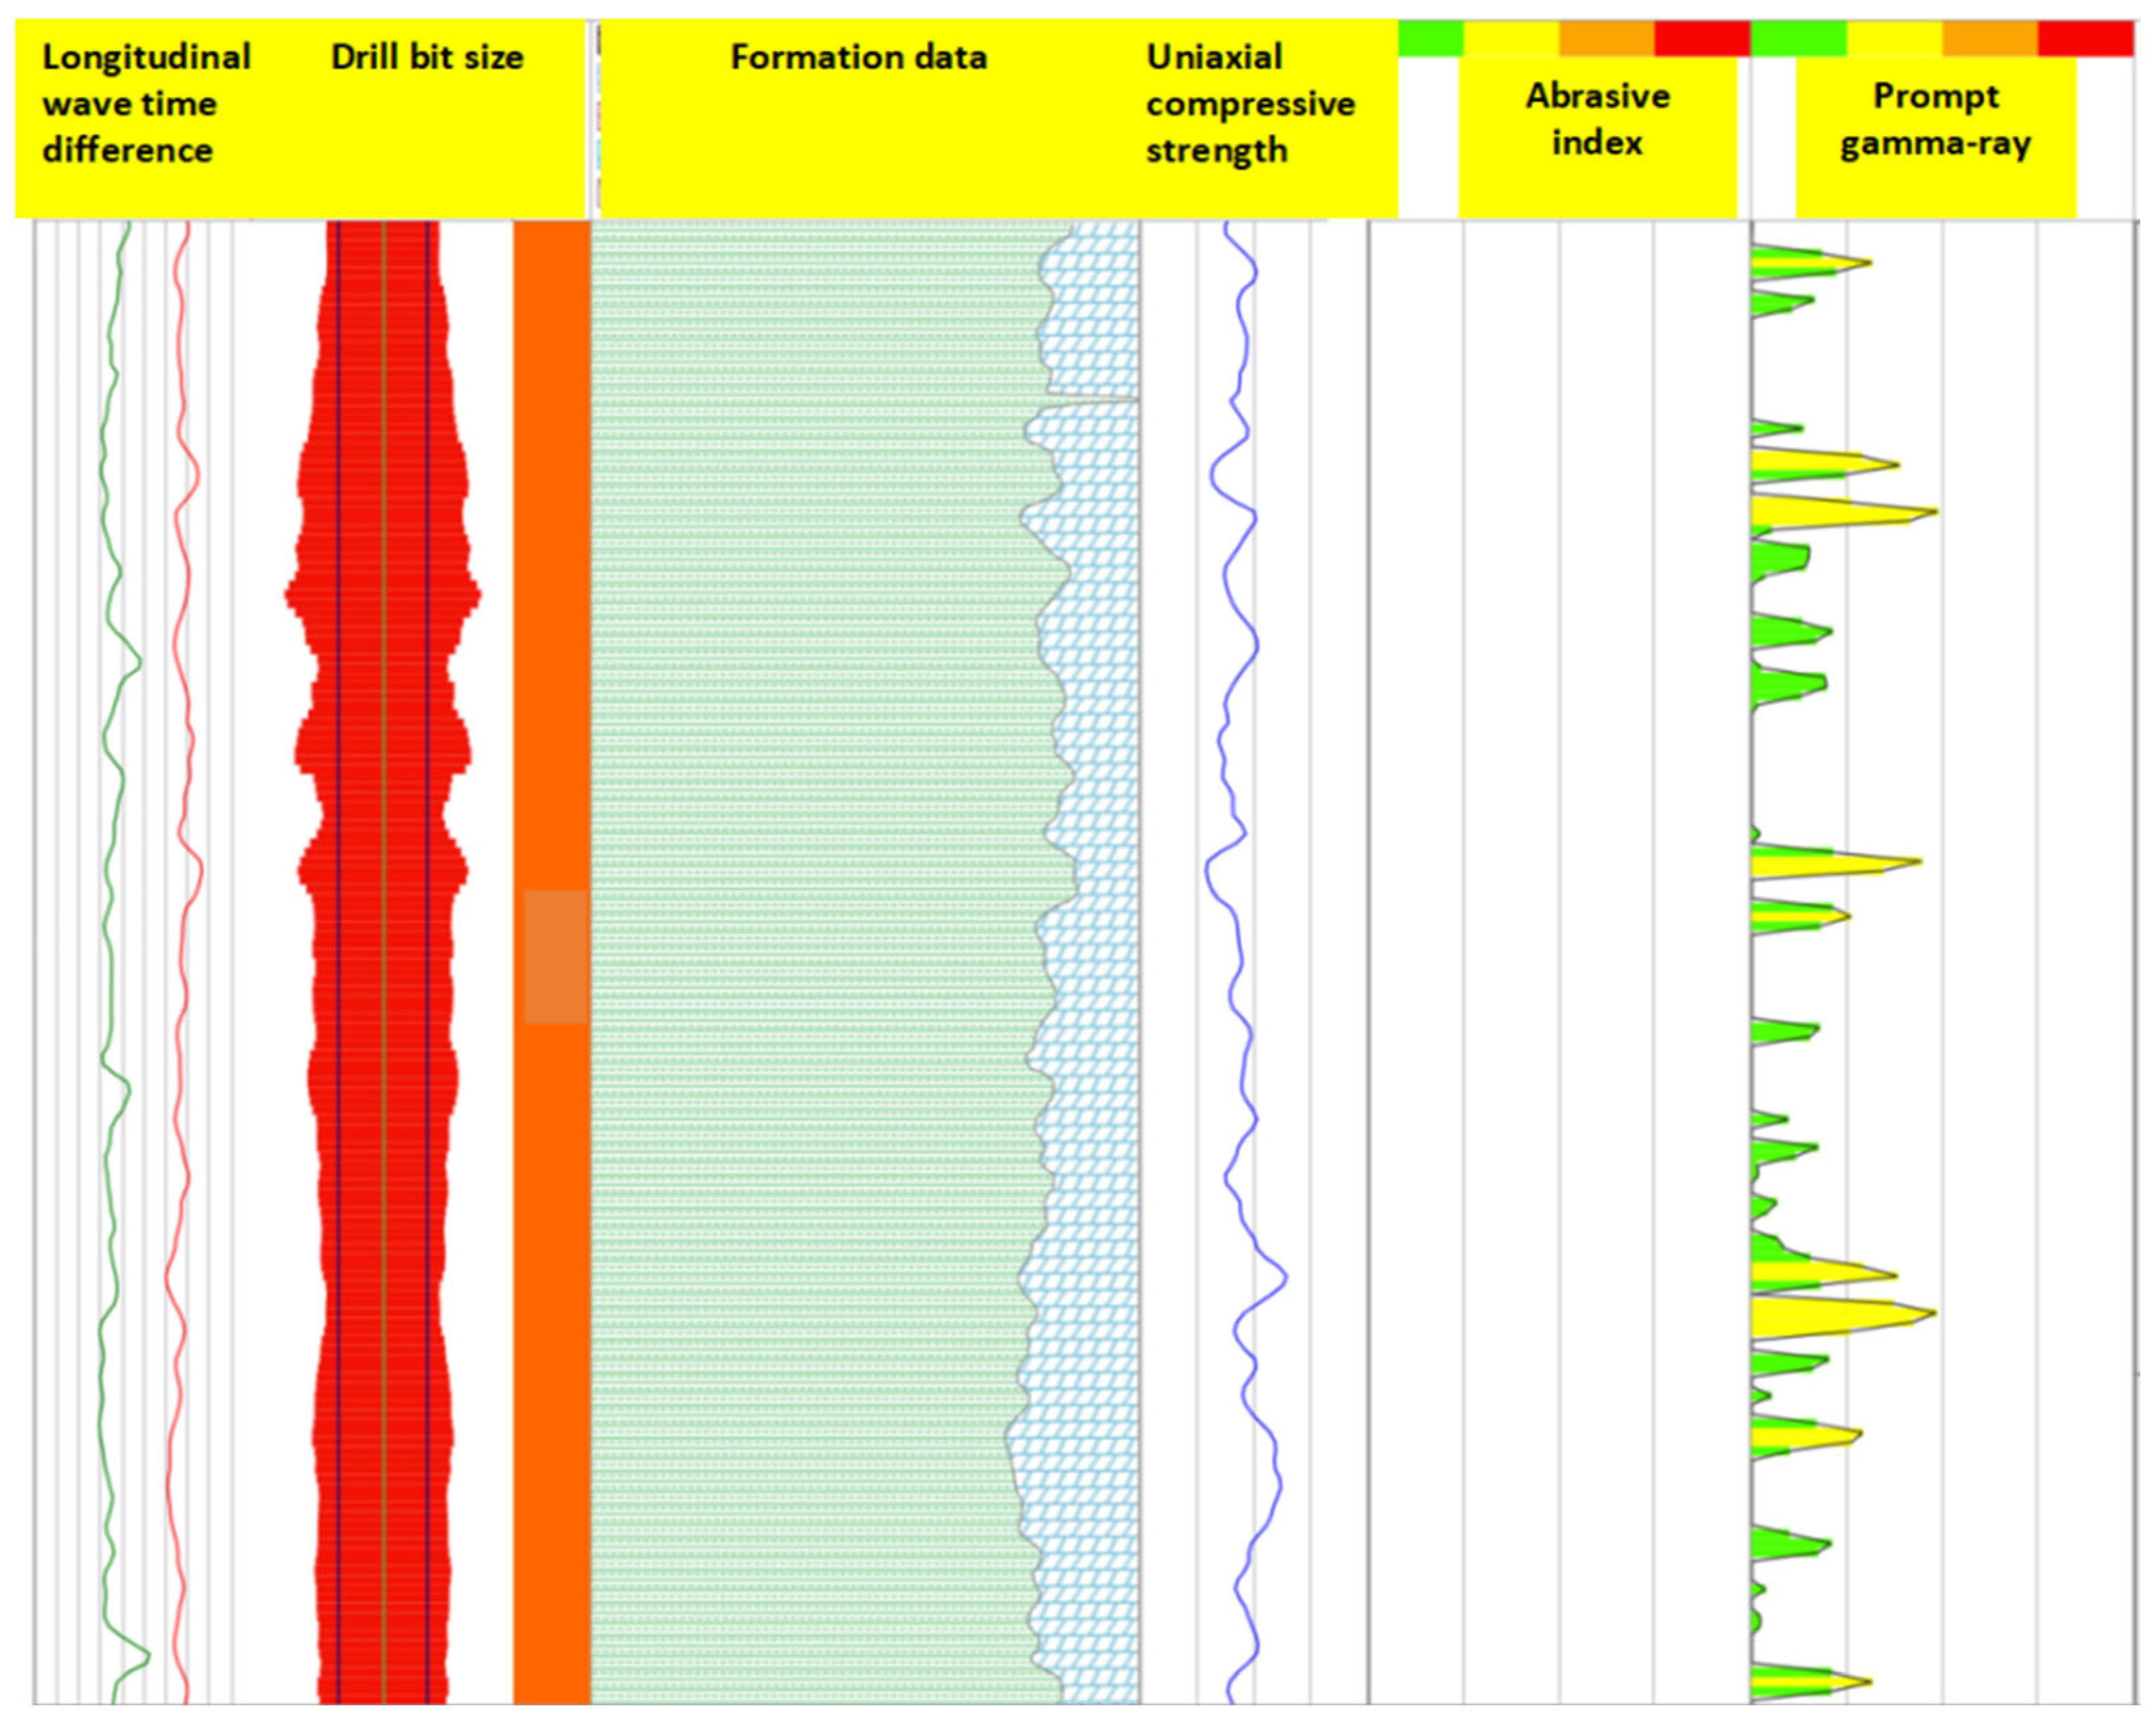
Using pre-drilling geo-mechanical modeling, the drillability results for the test well in the Xiagou Formation were obtained. A predicted formation drillability index, including the grinding index and impact index, was established for each drilling trip. During the drilling process, the downhole mechanical specific energy and rock triaxial compressive strength were calculated in real time. For advanced visualization and rock property modeling, SLB Techlog remains top-tier [
31]. The choice of opting this software is that SLB’s platforms facilitate real-time decision-making and have been adopted widely for their robust simulation capabilities. More importantly, it offers AI-powered models trained on extensive global well data. A 5-blade, 16mm drill bit was used for drilling during the test. The formation’s drillability effect was evident throughout the process. Over the course of two drilling trips, a total of 149.21 m was drilled. Upon retrieval, the drill bit showed no significant overall wear, indicating its durability and effectiveness during the operation. The process is clearly illustrated in the following
Figure 15.
4.5.2. Drilling Parameter Chart and Parameter Optimization
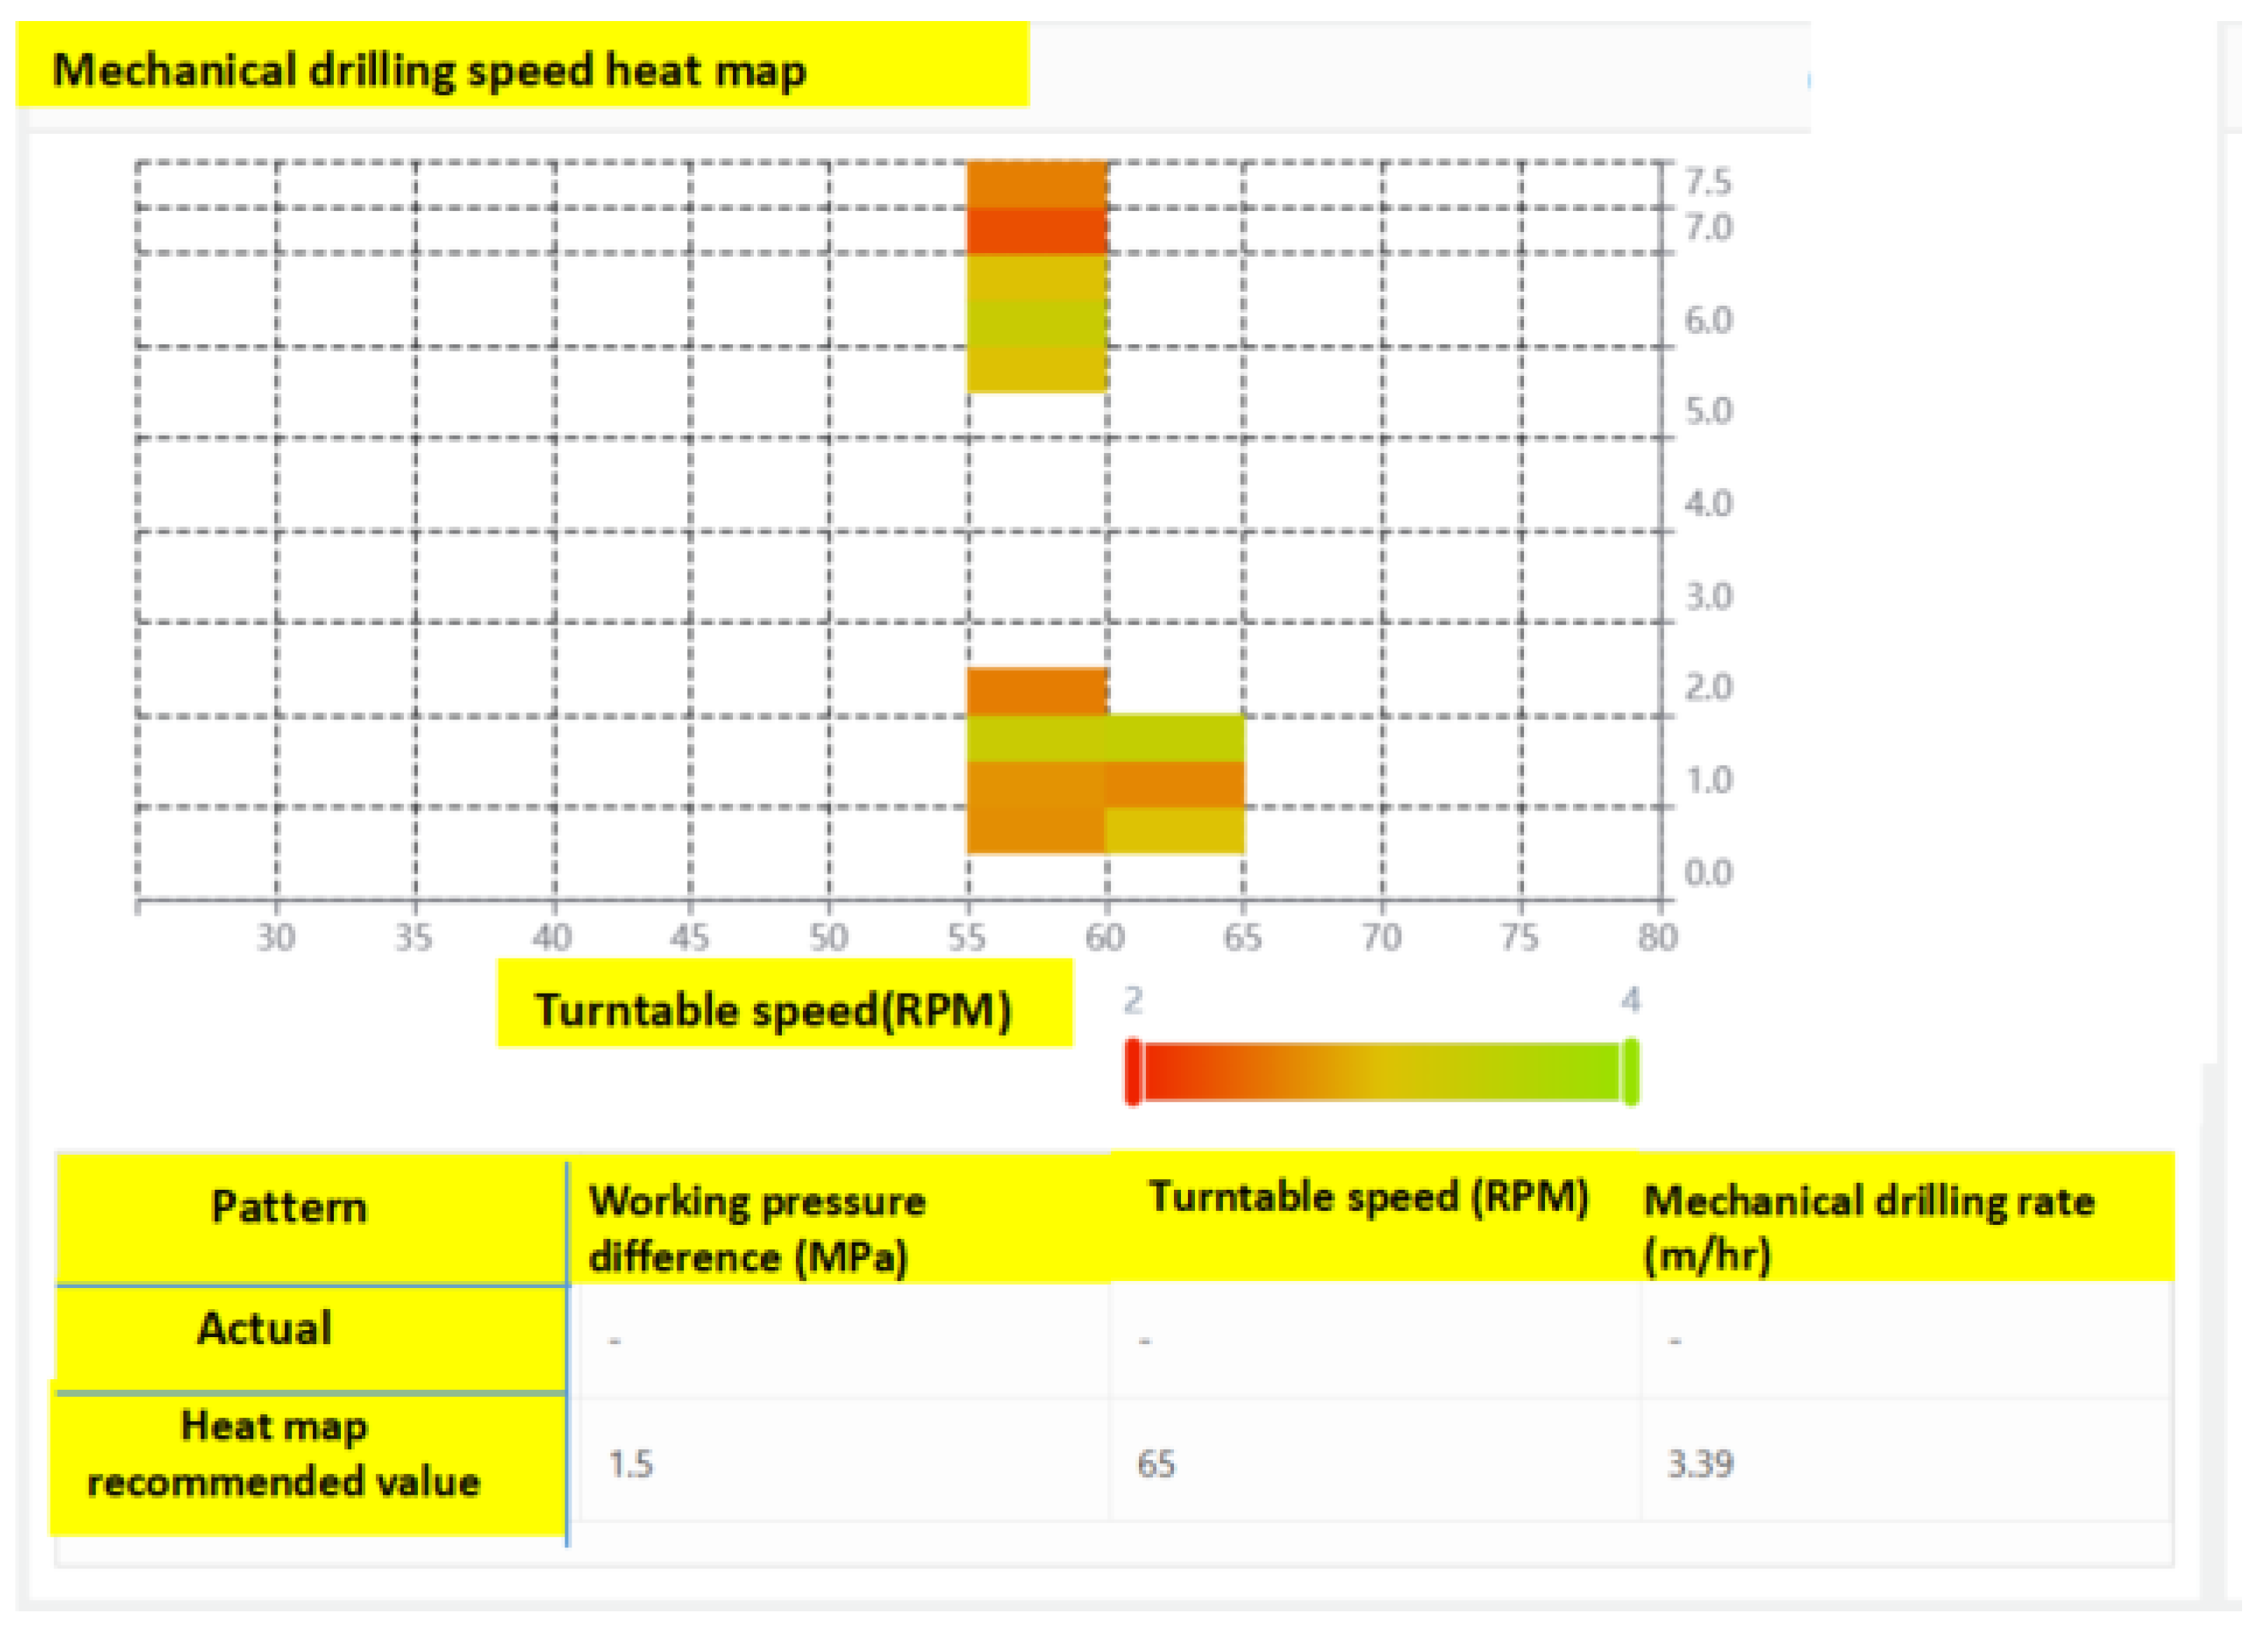
Using the measured drilling parameters, a heat map was constructed to analyze performance. The software provided optimized parameter recommendations: a rotation speed of 55 r/min + LZrpm, a displacement of 23 L/s, and a surface torque of 3–3.5 kN·m. Under these conditions, both the mechanical drilling speed heat map and the mechanical specific energy heat map reached their optimal values. LZrpm stands for low zone revolutions per minute, indicating rotational speed drops suggestive of mechanical resistance or blockage.
When comparing the parameters before optimization (rotation speed of 40 r/min + LZrpm, displacement of 23 L/s, and surface torque of 2–2.3 kN·m), the mechanical drilling speed improved significantly, increasing from 1.87 m/h to 3.39 m/h. Additionally, most of the mechanical specific energy heat map fell within the optimal (green) range. indicating that less energy was being wasted and more was directed toward effective drilling. This optimization resulted in an 81.28% improvement in drilling speed. The combination of increased rotational speed and higher torque maximized the bit’s rock-cutting capability, leading to smoother, faster penetration with less stalling or inefficient cutting cycles. The increased mechanical force and speed overcame formation resistance more effectively, which is especially critical in zones with higher compressive strength or mixed lithologies. The current approach is far better than the traditional methods and previously matured methods in multiple ways. Firstly, it uses real-time measured data to construct live performance heat maps. Secondly, Software-guided parameters are based on quantitative analysis rather than trial-and-error adjustments. Moreover, it dynamically adapts via real-time monitoring. Further, heat maps and dashboards highlight optimal and suboptimal zones. The most importantly, the parameters such as torque, MSE, RPM, etc., are holistically optimized. Finally, the performance is 81.28% which is phenomenal. This heat map of the drilling process is shown in
Figure 16.
The implemented drilling safety system integrates real-time fluid monitoring with predictive analytics to enhance operational safety and efficiency. By continuously tracking key parameters such as mud weight, annular velocity, and formation resistivity, the system enables early detection of potential hazards. Over a 45-day test campaign, this integration led to a 22% reduction in unplanned downtime, a 33% decrease in false positive alerts, and a 40% improvement in hazard recognition latency. These metrics demonstrate the system’s effectiveness in proactively identifying risks and minimizing operational disruptions, thereby substantiating its role in improving drilling safety outcomes, as demonstrated in
Table 5 below.
4.6. Limitations of the Current System
While the proposed system demonstrates significant potential for improving drilling safety and efficiency, several limitations must be acknowledged. First, the initial deployment cost remains relatively high due to the integration of multiple advanced sensors and telemetry channels, which may limit adoption in cost-sensitive projects. Second, the system’s performance is dependent on data transmission reliability; despite using error-correction techniques, severe signal degradation in high-noise or ultra-deep wells may reduce data throughput and impact real-time decision-making. Third, the machine learning models are trained primarily on curated datasets, and their predictive accuracy may decline when faced with extremely heterogeneous formations or geomechanical conditions not represented in the training data. This highlights the need for ongoing model retraining with broader, field-diverse datasets. Finally, the system currently requires skilled personnel for configuration, calibration, and interpretation of outputs, which may not always be available in all drilling operations. Addressing these challenges through cost optimization, more resilient telemetry architectures, expanded training datasets, and enhanced user interfaces will be essential for improving scalability and reliability in future deployments.
5. Conclusions
This paper presents an in-depth study on the preprocessing of downhole measurement parameters and the development of intelligent measurement and transmission technologies for risk level evaluation based on real-time data collected and evaluated at a field site. It introduces a downhole risk prevention and control system capable of measuring and transmitting nine types of parameters, including downhole pressure during drilling, bending moment, and torque. These engineering and mechanical parameters are utilized to comprehensively analyze and evaluate risks while monitoring the real-time status of downhole drilling tools and wellbore conditions. Furthermore, field tests were conducted to validate the system’s reliability in ensuring safety monitoring. Overall, the following conclusion summarizes the whole research endeavor.
By establishing a risk profile before drilling, combining real-time measurement of downhole parameters during drilling, predicting wellbore risks, and optimizing processes using AI-powered software after drilling, it is possible to achieve a comprehensive application of downhole measurements and surface data throughout the drilling process. This forms a three-dimensional risk prediction approach, pre-drilling prediction, real-time drilling monitoring, and post-drilling optimization, significantly enhancing the accuracy of risk assessment. The feedback loop in the proposed three-dimensional risk prediction approach is implemented through a semi-automated adaptive learning framework. During drilling operations, high-frequency downhole and surface data are continuously collected, and risk events (e.g., near kicks, vibration-induced tool damage, borehole instability) are annotated by the system. Once drilling is completed, the full dataset undergoes post-drilling optimization analysis, where machine learning algorithms (CNN–LSTM hybrids, as described in
Section 3.4) re-train on the combined real-time stream and annotated outcomes. This ensures that the predictive models continuously learn from both successes and failures encountered in actual wells.
The transfer of insights between wells is thus partially automated: the AI system updates its parameter weights using the enriched dataset and stores optimized models in a shared cloud-based repository. When planning the next well, the updated models are automatically integrated into the pre-drilling risk prediction module, allowing scenario simulations and hazard forecasting to benefit from the most recent field experience. Engineering experts still play a supervisory role, validating whether the retrained models align with geological expectations and operational constraints. This hybrid process ensures reliability while maintaining flexibility to adapt to site-specific conditions.
An intelligent early safety warning system has been developed, integrating drilling risk prediction and parameter optimization. This system demonstrates high accuracy in risk assessment, effectively reducing the complexity of drilling risks and ensuring operational safety. Field tests have successfully verified the system’s ability to measure critical downhole parameters, such as drilling pressure, torque, bending moment, vibration, and rotational speed, while drilling in a real-time situation. Additionally, the system enables real-time transmission of data and ground-based risk analysis and assessment, meeting the requirements for underground safety monitoring. Most importantly, the parameters such as torque, MSE, RPM etc., are holistically optimized. Finally, the performance is 81.28%, which is phenomenal. The 81.28% improvement in drilling speed reported in our results was calculated against the baseline performance from offset wells in the same field and analogous formations, rather than only against the initial parameters of the same well. Offset well data were carefully selected to ensure comparable lithology, hole size, bottomhole assembly configuration, and operational constraints, thereby providing a fair historical benchmark.
We do acknowledge that formation variability can influence penetration rates. To mitigate this, the comparison was restricted to intervals of similar rock type, mechanical properties, and pore pressure regimes, ensuring that the observed gains are not merely an artifact of drilling through a more drillable formation. In addition, within the same test well, drilling speed under the original parameter set was also logged and compared to the optimized regime, showing a consistent trend of improvement.
Therefore, while geological variability always plays a role, the magnitude and consistency of the improvement across multiple sections and wells strongly indicate that the parameter optimization methodology rather than formation effects alone was the primary driver of the performance gain. This dual comparison combined offset wells and in-well baseline helps reinforce the robustness of our conclusions.
To further enhance underground risk prevention and control systems, the following strategies are recommended for future exploration. Firstly, incorporating state-of-the-art real-time monitoring systems will provide continuous data on drilling parameters, enabling proactive adjustments and more effective risk mitigation. Secondly, advanced AI-based analytics will be integrated, including deep reinforcement learning for adaptive decision-making and digital twin models to simulate downhole conditions in real time. These tools will allow continuous optimization of drilling strategies while reducing non-productive time. Furthermore, attention will be directed toward the challenges of ultra-deep wells, where higher bottomhole temperatures and longer data transmission delays demand specialized sensor technologies, enhanced telemetry schemes, and robust predictive models. Addressing these factors will ensure the system remains reliable and scalable across diverse geological environments.
Author Contributions
Z.Y.: Writing—review and editing, Investigation, Software, Writing—original draft, Conceptualization. Z.L.: Data curation, Writing—original draft, Methodology, Writing—review and editing, Supervision. M.Y.: Validation, Project administration, Writing—review and editing, Writing—original draft, Formal Analysis. D.W.: Visualization, Resources, Writing—review and editing, Writing—original draft, Funding acquisition; P.C.: Investigation, Project administration, Supervision, Resources, Funding acquisition. All authors have read and agreed to the published version of the manuscript.
Funding
This work was supported by China National Petroleum Corporation Oilfield Technical Services Co., Ltd., Scientific Research and Technology Development Project (2023T-001-001).
Data Availability Statement
The data that support the findings of this study are available from the corresponding author upon reasonable request.
Conflicts of Interest
Authors Zhenbao Li, Ming Yi, Di Wang and Panfei Cheng were employed by the company PetroChina Western Drilling Engineering Co., Ltd. The remaining authors declare that the research was conducted in the absence of any commercial or financial relationships that could be construed as a potential conflict of interest.
References
- Yan, S.; Zhou, C.; Zhou, H.; Zhao, Q.; Li, X.; Cai, W.; Wang, Y.; Zhang, X.; Wang, W.; Su, D. Application of the abnormal geological body identification technology in the prediction of drilling and completion risks. In Proceedings of the SEG Integration of Geophysics Geology, and Engineering Workshop, Chengdu, China, 26–28 June 2023. [Google Scholar] [CrossRef]
- Zeng, Y. Key technologies for safe and efficient drilling of marine carbonate ultra-deep oil and gas wells. Pet. Drill. Tech. 2019, 47, 25–33. [Google Scholar] [CrossRef]
- Du, S.; Huang, C.; Ma, X.; Fan, H. A Review of Data-Driven Intelligent Monitoring for Geological Drilling Processes. Processes 2024, 12, 2478. [Google Scholar] [CrossRef]
- Su, Y.; Dou, X.; Gao, K.; Liu, K. Discussion and prospects of the development on measurement while drilling technology in oil and gas wells. Pet. Sci. Bull 2023, 8, 534–535. [Google Scholar]
- Ahmad, S.; Rizvi, Z.H.; Wuttke, F. Unveiling soil thermal behavior under ultra-high voltage power cable operations. Sci. Rep. 2025, 15, 7315. [Google Scholar] [CrossRef]
- Lu, M.; Liao, H.; Wang, H.; He, Y.; Liu, J.; Wang, Y.; Niu, W. Research and Test on the Device of Downhole Near-Bit Temperature and Pressure Measurement While Drilling. Processes 2023, 11, 2238. [Google Scholar] [CrossRef]
- Namuq, M.A.; Hasso, E.A.; Jamal, M.A.; Namuq, K.A.; Yu, Y. Simulation and Modeling of Data Transmission Process in Boreholes Using Intelligent Drill Pipe for a Laboratory Experiment. Modelling 2024, 5, 1961–1979. [Google Scholar] [CrossRef]
- Li, C.; Xu, Z. A review of communication technologies in mud pulse telemetry systems. Electronics 2023, 12, 3930. [Google Scholar] [CrossRef]
- Zhang, Z.; Lai, X.; Wu, M.; Chen, L.; Lu, C.; Du, S. Fault diagnosis based on feature clustering of time series data for loss and kick of drilling process. J. Process Control 2021, 102, 24–33. [Google Scholar] [CrossRef]
- Boucherit, S. Modeling and Optimization of Cutting Parameters during Machining of Austenitic Stainless Steel AISI304 Using RSM and Desirability Approach. Period. Polytech. Mech. Eng. 2021, 65, 10–26. [Google Scholar] [CrossRef]
- Khelfaoui, F. Statistical analysis, modeling and multi-objective optimization of parameters intermittent turning process of AISI D3. J. Mech. Eng. Sci. 2023, 17, 9492–9506. [Google Scholar] [CrossRef]
- Guo, J.; Dang, J. Data compression collecting method for vibration signals based on optimal deterministic measurement matrix. J. Vib. Shock. 2019, 177, 107903. [Google Scholar] [CrossRef]
- Tu, B.; Li, D.S.; Lin, E.H.; Ji, M.M. Research on mud pulse signal data processing in MWD. EURASIP J. Adv. Signal Process. 2012, 2012, 182. [Google Scholar] [CrossRef]
- Wei, L.; Yingcao, Z.; Ying, W.; Xiaoqiang, Z. Study on downhole vibration measurement and analysis theory. Oil Drill. Prod. Technol. 2012, 34, 14. [Google Scholar]
- Rizvi, Z.H.; Mustafa, S.H.; Sattari, A.S.; Ahmad, S.; Furtner, P.; Wuttke, F. Dynamic Lattice Element Modelling of Cemented Geomaterials; Springer: Singapore, 2020; pp. 655–665. [Google Scholar] [CrossRef]
- Woloson, S.E.; Jones, D.A. Apparatus for Measuring Downhole Drilling Efficiency Parameters. U.S. Patent 6,216,533, 22 June 2000. [Google Scholar]
- Yan, T.; Xu, R.; Liu, W.; Sun, W.; Hou, Z.; Shao, Y. Research and development of intelligent drilling technology in China. J. Northeast. Pet. Univ. 2020, 44, 15–21. [Google Scholar]
- Yan, Z.; Geng, Y.; Wei, C.; Wang, T.; Gao, T.; Shao, J.; Hu, X.; Yuan, M. Design of a continuous wave mud pulse generator for data transmission by fluid pressure fluctuation. Flow Meas. Instrum. 2018, 59, 28–36. [Google Scholar] [CrossRef]
- Jia, M.; Geng, Y.; Yan, H.; Yue, Y. Review of high-speed mud pulse telemetry technology. Chin. J. Sci. Instrum 2018, 39, 160–170. [Google Scholar]
- Fang, J.; Su, Y. Dynamic mathematical model for valve-controlled MWD hydraulic signal generator. China Petrol Mach 2004, 32, 26–28. [Google Scholar] [CrossRef]
- Haroon, A.; Ahmad, S.; Hussain, A. CFD Prediction of Loss Coefficient in Straight Pipes. In Development of Water Resources in India. Water Science and Technology Library; Garg, V., Singh, V., Raj, V., Eds.; Springer: Cham, Switzerland, 2017; Volume 75. [Google Scholar] [CrossRef]
- He, Y.; Du, Y.; Guo, H.; Yang, J.; Sun, Y.; Wang, Z.; Li, C.; Sun, K.; Zhang, M.; Shi, C. Design and research of intelligent building control system. IOP Conf. Ser. Earth Environ. Sci. 2021, 632, 042023. [Google Scholar] [CrossRef]
- Matheus, J.; Ignova, M.; Amaya, D. A medical-inspired framework to classify downhole shocks waveforms while drilling. In Proceedings of the SPE/IADC Drilling Conference and Exhibition, Online, 8–12 March 2021. [Google Scholar] [CrossRef]
- Zhao, P.; Gao, X.; Ju, X.; Yang, P.; Song, Q.; Huang, Y.; Zheng, Z. Optimization of the front-mounted fertilizer pipe strip rotary tillage device by modeling the wide-seedbed characteristics and power consumption. Comput. Electron. Agric. 2024, 227, 109624. [Google Scholar] [CrossRef]
- Hubin, W. Development and application of MWD data automatic acquisition and remote real-time monitoring system. Mud Logging Eng. 2020, 31, 103–108. [Google Scholar] [CrossRef]
- Li, G.; Hu, J.; Shan, D.; Ao, J.; Huang, B.; Huang, Z. A CNN model based on innovative expansion operation improving the fault diagnosis accuracy of drilling pump fluid end. Mech. Syst. Signal Process. 2023, 187, 109974. [Google Scholar] [CrossRef]
- Jebur, A.A.M. Directional Drilling Tools Assessment and the Impact of Bottom Hole Assembly Configuration on the Well Trajectory and Operation Optimization. Ph.D. Thesis, Politecnico di Torino, Torino, Italy, 2020. Available online: http://webthesis.biblio.polito.it/id/eprint/16247 (accessed on 10 September 2025).
- Yanwen, W.; Haichao, Y. Current Status and Development Trend of Measurement & Control while Drilling Technology. Pet. Drill. Tech. 2024, 52, 122–129. [Google Scholar] [CrossRef]
- Jia, H.; Ai, W.; Mao, W.; Peng, L.; Sheng, L.; Dou, X.; Yu, D.; Chen, W. Development of Near-Bit High Precision Imaging Measuring Tool While Drilling. In Proceedings of the International Petroleum and Petrochemical Technology Conference, Beijing, China, 21–23 March 2022; Springer: Berlin/Heidelberg, Germany, 2022. [Google Scholar] [CrossRef]
- Ahmad, S.; Rizvi, Z.; Khan, M.A.; Ahmad, J.; Wuttke, F. Experimental study of thermal performance of the backfill material around underground power cable under steady and cyclic thermal loading. Mater. Today Proc. 2019, 17 Pt 1, 85–95. [Google Scholar] [CrossRef]
- Pothana, P.; Ifrene, G.; Ling, K. Integrated Petrophysical Evaluation and Rock Physics Modeling of Broom Creek Deep Saline Aquifer for Geological CO2 Storage. Fuels 2024, 5, 53–74. [Google Scholar] [CrossRef]
Figure 1.
Overall composition and structure of underground parts.
Figure 1.
Overall composition and structure of underground parts.
Figure 2.
Strain resistor connection method and loading.
Figure 2.
Strain resistor connection method and loading.
Figure 3.
The relationship between measuring torque strain resistance and drilling tool position.
Figure 3.
The relationship between measuring torque strain resistance and drilling tool position.
Figure 4.
Schematic diagram of bending stress in drill tool section.
Figure 4.
Schematic diagram of bending stress in drill tool section.
Figure 5.
Principal diagram of positive pulse mode.
Figure 5.
Principal diagram of positive pulse mode.
Figure 6.
Design of variable precision transmission method.
Figure 6.
Design of variable precision transmission method.
Figure 7.
Flowchart of the positive pulse data transmission process during drilling.
Figure 7.
Flowchart of the positive pulse data transmission process during drilling.
Figure 8.
Structure diagram of ground risk prevention and control system.
Figure 8.
Structure diagram of ground risk prevention and control system.
Figure 9.
Pre-drilling risk profile.
Figure 9.
Pre-drilling risk profile.
Figure 10.
Schematic diagram of the software interface for real-time monitoring and analysis of drilling parameters while drilling.
Figure 10.
Schematic diagram of the software interface for real-time monitoring and analysis of drilling parameters while drilling.
Figure 11.
Pressure bearing capacity test curve.
Figure 11.
Pressure bearing capacity test curve.
Figure 12.
Three-pressure model of test well.
Figure 12.
Three-pressure model of test well.
Figure 13.
Overflow risk analysis.
Figure 13.
Overflow risk analysis.
Figure 14.
Comparative analysis chart of weight on bit.
Figure 14.
Comparative analysis chart of weight on bit.
Figure 15.
Drillability formation modeling of test wells.
Figure 15.
Drillability formation modeling of test wells.
Figure 16.
Heat map of the drilling process.
Figure 16.
Heat map of the drilling process.
Table 1.
Comparison of different pulse accuracy.
Table 1.
Comparison of different pulse accuracy.
| Accuracy Comparison: |
|---|
| 6 pulse | 5 pulse | 4 pulse | 3 pulse | 2 pulse |
|---|
| 65,535 | 25,927 | 4240 | 670 | 55 |
Table 2.
Comparison table of weight-on-bit, bending moment, and torque calibration data.
Table 2.
Comparison table of weight-on-bit, bending moment, and torque calibration data.
| Bending Moment X | Bending Moment Y | Weight on Bit | Torque |
|---|
| Instrument Parameters | Tool Parameters | Instrument Parameters | Tool Parameters | Instrument Parameters | Tool Parameters | Instrument Parameters | Tool Parameters |
|---|
| 0.00 | 0.00 | 0.00 | 0.00 | 0.00 | 0.00 | 0.00 | 0.00 |
| 5.46 | 5.65 | 5.33 | 5.3 | −51.2 | −49.3 | 4.68 | 4.45 |
| 10.10 | 10.55 | 10.10 | 9.90 | −99.67 | −97.05 | 10.01 | 9.5 |
| 14.95 | 15.70 | 14.92 | 15.45 | −149.67 | −148.40 | 15.30 | 15.05 |
| 20.50 | 21.00 | 20.34 | 19.95 | −102.77 | −101.50 | 20.05 | 19.55 |
| 25.40 | 25.95 | 24.85 | 24.45 | −50.02 | −50.10 | 14.98 | 14.80 |
| 30.09 | 30.65 | 30.45 | 29.50 | 0.00 | −1.30 | 10.23 | 9.85 |
| 26.30 | 27.05 | 24.97 | 25.70 | 53.61 | 56.10 | 5.16 | 4.95 |
| 21.40 | 22.35 | 20.98 | 21.85 | 101.11 | 100.75 | 0.00 | −0.35 |
| 14.87 | 15.45 | 15.58 | 16.15 | 149.61 | 153.25 | - | - |
| 11.36 | 11.90 | 10.84 | 11.25 | 101.33 | 102.95 | - | - |
| 4.96 | 5.15 | 4.77 | 4.90 | 54.10 | 56.35 | - | - |
| 0.00 | 0.05 | 0.00 | −0.05 | 0.00 | 1.75 | - | - |
Table 3.
Decoded data of the first drilling project parameters (partial data).
Table 3.
Decoded data of the first drilling project parameters (partial data).
| Well Depth (m) | Downhole Drilling Pressure (kN) | Surface Weight on Bit (kN) | Downhole Torque (kN) | Ground Torque (kN) | Internal Pressure
(MPa) | External Pressure (MPa) | Stationary ESD (g/cm3) | Annular ECD (g/cm3) | Axial Vibration (g) | Longitudinal Vibration (g) | Well Inclination (°) | Speed (r/min) | Temperature (°C) |
|---|
| 4502 | 43.00 | 60.00 | 3.76 | 6.60–7.80 | 70.23 | 67.13 | 1.44 | 1.52 | 0.39 | 0.12 | 2.59 | 43.00 | 86.27 |
| 4513 | 69.00 | 80.00 | 5.37 | 6.60–7.80 | 70.26 | 67.29 | 1.44 | 1.52 | 0.69 | 0.10 | 2.33 | 60.00 | 89.74 |
| 4531 | 69.00 | 80.00 | 464 | 6.60–7.80 | 70.62 | 67.56 | 1.44 | 1.52 | 0.27 | 0.19 | 2.20 | 60.00 | 89.82 |
Table 4.
Decoded data of second drilling project parameters (partial data).
Table 4.
Decoded data of second drilling project parameters (partial data).
| Well Depth (m) | Downhole Drilling Pressure (kN) | Surface Weight on Bit (kN) | Downhole Torque (kN) | Ground Torque (kN) | Internal Pressure
(MPa) | External Pressure (MPa) | Stationary ESD (g/cm3) | Annular ECD (g/cm3) | Axial Vibration (g) | Longitudinal Vibration (g) | Well Inclination (°) | Speed (r/min) | Temperature (°C) |
|---|
| 4568 | 40 | 50–60 | 4.4 | 6.5–7.5 | 71.34 | 68.11 | 1.44 | 1.52 | 3.95 | 0.81 | 2.2 | 65 + LZrpm | 93.8 |
| 4574 | 50 | 50–60 | 4.2 | 6.5–7.5 | 71.52 | 68.2 | 1.44 | 1.52 | 4.52 | 1.21 | 1.8 | 65 + LZrpm | 89.52 |
| 4578 | 80 | 90–100 | 5.67 | 6.5–7.5 | 71.78 | 68.26 | 1.44 | 1.52 | 5.58 | 1.39 | 1.8 | 65 + LZrpm | 87.52 |
| 4585 | 89 | 90–100 | 7.78 | 6.5–7.5 | 71.82 | 68.37 | 1.44 | 1.52 | 5.72 | 1.21 | 1.8 | 65 + LZrpm | 86.52 |
| 4590 | 90 | 90–100 | 6.73 | 6.5–7.5 | 71.84 | 68.44 | 1.44 | 1.52 | 4.83 | 1.62 | 1.8 | 65 + LZrpm | 86.42 |
| 4595 | 88 | 90–100 | 5.84 | 6.5–7.5 | 71.92 | 68.52 | 1.44 | 1.52 | 4.59 | 1.78 | 1.8 | 65 + LZrpm | 86.42 |
| 4560 | 99 | 90–100 | 6.67 | 6.5–7.5 | 72.42 | 68 | 1.44 | 1.52 | 3.39 | 1.2 | 1.8 | 65 + LZrpm | 87.12 |
| 4565 | 87 | 90–100 | 5.87 | 6.5–7.5 | 72.51 | 68.07 | 1.44 | 1.52 | 3.64 | 1.27 | 1.8 | 65 + LZrpm | 87.37 |
Table 5.
Comparative Metrics of Drilling Operations with and Without the Safety System (45-Day Campaign).
Table 5.
Comparative Metrics of Drilling Operations with and Without the Safety System (45-Day Campaign).
| Performance Metric | Without Safety System | With Safety System | Improvement |
|---|
| Unplanned Downtime (hours) | 36 | 28 | 22% reduction |
| False Positive Alerts (per day) | 15 | 10 | 33% decrease |
| Hazard Recognition Latency (minutes) | 5.0 | 3.0 | 40% improvement |
| Disclaimer/Publisher’s Note: The statements, opinions and data contained in all publications are solely those of the individual author(s) and contributor(s) and not of MDPI and/or the editor(s). MDPI and/or the editor(s) disclaim responsibility for any injury to people or property resulting from any ideas, methods, instructions or products referred to in the content. |
© 2025 by the authors. Licensee MDPI, Basel, Switzerland. This article is an open access article distributed under the terms and conditions of the Creative Commons Attribution (CC BY) license (https://creativecommons.org/licenses/by/4.0/).
