Article

Study on Main Controlling Factors of CO2 Enhanced Gas Recovery and Geological Storage in Tight Gas Reservoirs

1
PetroChina Changqing Oilfield Company, Xi’an 710018, China
2
National Engineering Laboratory of Low-Permeability Oil & Gas Exploration and Development, Xi’an 710018, China
3
College of Petroleum Engineering, China University of Petroleum (Beijing), Beijing 102249, China
*
Author to whom correspondence should be addressed.
Processes 2025, 13(10), 3097; https://doi.org/10.3390/pr13103097
Submission received: 12 September 2025 / Revised: 24 September 2025 / Accepted: 26 September 2025 / Published: 27 September 2025
(This article belongs to the Section Energy Systems)

Abstract

Tight gas reservoirs, as important unconventional natural gas resources, face low recovery rates due to low porosity, low permeability, and strong heterogeneity. CO2 Storage with Enhanced Gas Recovery (CSEGR) technology combines CO2 geological storage with natural gas development, providing both economic and environmental benefits. However, the main controlling factors and influence mechanisms remain unclear. This study utilized the PR-EOS to investigate CH4, CO2, and natural gas physical properties, established a numerical simulation model considering CO2 dissolution and geochemical reactions, and explored the influence of injection scheme, injection rate, production rate, and shut-in condition on CO2 enhanced recovery and storage effectiveness through orthogonal design. Results show that CO2 exhibits significant differences in compressibility factor, density, and viscosity compared to natural gas, enabling piston-like displacement. Intermittent injection slightly outperforms continuous injection in recovery enhancement, while continuous injection provides greater CO2 storage capacity. The ranking of the significance of different influencing factors for enhanced oil recovery is as follows: injection rate > production rate > injection scheme > shut-in condition. For the effect of geological storage of CO2, it is as follows: injection rate > injection scheme > production rate > shut-in condition. During gas injection, supercritical, ionic, and dissolved CO2 continuously increase while mineral CO2 decreases, with storage mechanisms dominated by structural and residual trapping. The study provides scientific basis for optimizing CO2 flooding strategies in tight gas reservoirs.

1. Introduction

Tight gas reservoirs, as important unconventional natural gas resources, play a significant role in the global energy structure [1]. However, due to their characteristics of low porosity, low permeability, and strong heterogeneity, tight gas reservoirs commonly face technical challenges of low recovery rates during development [2,3,4]. Currently, the main technical means for enhanced gas recovery in tight reservoirs include hydraulic fracturing, horizontal well technology, and refracturing [5,6,7]. While these technologies have improved gas reservoir development effectiveness to some extent, technical bottlenecks still exist. China’s tight sandstone gas reservoirs contain abundant reserves, but they are characterized by strong reservoir heterogeneity, rapid production decline, and a lack of effective enhanced recovery methods [8].
Carbon Capture, Utilization and Storage (CCUS) technology, as an important technical pathway for addressing climate change, has received widespread attention and application globally [9,10]. Among these, CO2 Storage with Enhanced Gas Recovery (CSEGR) technology [11,12,13] integrates CO2 geological storage with natural gas development, not only achieving long-term geological sequestration of CO2 but also enhancing natural gas recovery through CO2 displacement effects, demonstrating significant dual economic and environmental benefits [14,15,16,17]. Many scholars have confirmed through experimental, theoretical calculation, and numerical simulation methods that CSEGR technology has unique advantages in tight gas reservoirs [18,19,20,21,22,23,24]. In tight reservoirs, the main CO2 storage mechanisms are structural trapping, solubility trapping, residual (capillary) trapping, and mineral trapping [25,26,27,28]. However, the CO2 flooding process in tight gas reservoirs involves complex physicochemical processes. Research results from many scholars indicate that after CO2 dissolves in formation water, it reacts with reservoir minerals, causing dissolution or precipitation [29,30,31], thereby affecting enhanced natural gas recovery and storage effectiveness.
Currently, the main controlling factors and influence mechanisms of CO2 injection for enhanced gas recovery are not yet fully understood. This study uses Computer Modeling Group (v. 2022.1) software, aiming to clarify the PVT property variation patterns of the CO2-natural gas system under gas reservoir conditions through theoretical analysis and numerical simulation methods, systematically analyze the influence patterns of injection-production parameters during the CO2 enhanced recovery and geological storage process in tight gas reservoirs, identify the main controlling factors affecting recovery enhancement and CO2 storage effectiveness, and provide scientific basis for the optimal design of CO2 flooding injection-production strategies and field applications in tight gas reservoirs.

2. Methods

2.1. PR-EOS

The Peng-Robinson equation of state (PR-EOS) was proposed by Peng and Robinson [32] in 1976 and is currently widely applied in the petroleum industry. The basic form of PR-EOS is:
P = R T V b a ( T ) V ( V + b ) + b ( V b )
a = ( T , ω ) = a 0 α
The compressibility factor Z is given by:
Z 3 ( 1 B ) Z 2 + ( A 3 B 2 2 B ) Z ( A B B 2 B 3 ) = 0
A = a P R 2 T 2
B = b P R T
At the critical point, a pure substance reaches the maximum point on the P-V phase diagram, and the phase envelope exhibits an inflection point at the critical point. Therefore, the critical conditions are:
P v P C , T C = 2 P v 2 P C , T C = 0
For gas mixtures like natural gas, parameters p / v T c ,   ( 2 p / v 2 ) T c are non-zero. By applying the critical conditions to PR-EOS, we obtain:
a ( T c ) = 0.45724 R 2 T c 2 P c
b ( T c ) = 0.07780 R T c P c
Z c = 0 . 307

2.2. Henry’s Law Model

Gas dissolution in the liquid phase is commonly described by Henry’s law [33]. Under the assumption that the fugacity of components in the gas phase and aqueous phase are equal, and the gas phase and aqueous phase are in thermodynamic equilibrium, we have:
g i = f i g f i w = 0 ,   i = 1 , , n c
where f i g and f i w are the fugacity of component i in the gas phase and liquid phase, respectively, and nc is the number of gas components.
For gas components soluble in the aqueous phase, the fugacity fiw is calculated using Henry’s law, i.e.,
f i w = y i w H i
where H i represents the Henry constant for component i, and y i w denotes the mole fraction of component i in the aqueous phase.
The Henry constant depends on pressure, temperature, and salinity. CMG-GEM employs the following equation to calculate the Henry constant at various pressures:
ln H i = ln H i * + v ¯ i ( p p * ) R T
where H i is the Henry constant for component i at pressure p and temperature T ; H i * is the Henry constant for component i at reference pressure p * and temperature T ; v ¯ i is the partial molar volume of component i at infinite dilution in water, L/mol; p * is the reference pressure for the Henry constant of component i, Pa ; T is the absolute temperature, K; R is the gas constant, taken as 8.314 J / ( mol K ) .
Due to the salting-out effect, as the concentration of inorganic salts (NaCl, CaCl2, etc.) in formation water increases, water molecules bind more strongly with salt ions, resulting in a reduction in free water molecules available for gas dissolution and a decrease in solubility. The salting-out coefficient in GEM is defined by the following relationship [34]:
log 10 H s a l t , i H i = k s a l t , i   m s a l t
where H s a l t , i is the Henry constant of component i in the saline solution; H i is the Henry constant of component i at zero salinity; k s a l t , i is the salting-out coefficient of component i; m s a l t is the molality of dissolved salt, mol / kg   H 2 O .

2.3. Geochemical Reaction Kinetics Model

Following CO2 injection into the formation, it can react with formation water to form carbonic acid. Under acidic conditions, the rock undergoes dissolution and new precipitates may form. The primary factors governing chemical reaction rates are reactant concentration and temperature. Reaction rates between gases and aqueous solutions are typically described by the Arrhenius equation [35], which mainly accounts for the effects of temperature and reactant concentrations on reaction rates. Due to its few parameters and simple form, the rate constants can be measured in the laboratory, and, through fitting, the following model can be established:
r = F exp E a R 1 T i = 1 n c i a i
where r denotes the reaction rate, mol / ( m 2 s ) ; r is the pre-exponential factor, with units determined by the overall reaction order; r is the activation energy, J / mol ; c i is the molal concentration of the reactant, mol / kg ; n is the number of reactant species and a i is the overall reaction order, defined as the sum of the exponents of the concentration terms in the rate law. A larger reaction order indicates a stronger dependence of the reaction rate on concentration.
Transition state theory (TST) is a fundamental framework in chemical kinetics for explaining reaction rates. It posits the existence of a high-energy transition state between reactants and products, and assumes that the reaction rate is determined by the frequency with which reactants traverse this state. TST refines the Arrhenius pre-exponential factor and replaces the activation energy with the Gibbs free energy of activation, thereby providing concrete physical meaning to the empirical parameters in the Arrhenius equation, as follows:
r = s g n 1 Q K e q A ^ S w k 0 + i = 1 n c t k i a i w i 1 Q K e q ξ ς
A ^ = A ^ 0 × N m N m 0
k 0 = k 0 * exp E a R T 1 T 1 T 0
where Q denotes the activity product, i.e., the product of the activities of all reactants in the transition state; K e q is the chemical equilibrium constant, mol / ( m 2 s ) ; when Q < K e q , the reaction proceeds in the forward direction, whereas Q > K e q favors the reverse direction; A ^ and A ^ 0 denote the reactive surface area of the mineral per unit volume at the current time and at the initial time, respectively, m 2 / m 3 ; and N m and N m 0 denote the amount of the mineral at the current time and at the initial time, respectively. S w denotes the water saturation; k 0 denotes the standard transition-state-theory rate constants; T 0 is a reference value whose initial value depends on the specific reaction; k i denotes the TST reaction constants for each species involved in the liquid phase and in the equation of state during the reaction; ξ and ς are reaction-related exponents, determined experimentally and typically taken as 1; and T 0 is the initial temperature.

2.4. Numerical Model Parameters

The target block produced water is characterized as CaCl2-type with a total dissolved solids content of 42,694.42 mg/L. Table 1 presents the experimental data of CO2 solubility in formation water across different pressure regimes. The fluid model Henry’s law parameters were calibrated using these experimental data. For the natural gas composition analysis, only CO2 dissolution in water was considered. The fitted parameters yield a reference Henry’s constant of 6.21 × 10⁵ kPa and an infinite dilution molar volume of 0.03127 L/mol for CO2.
Figure 1 illustrates the relative permeability curves for the gas-water two-phase system. The reservoir rock types in the target block are primarily lithic quartz sandstone reservoirs, with quartz sandstone as the secondary lithology. The clay mineral assemblage is dominated by illite and kaolinite, while chlorite is scarcely present. Consequently, the model incorporates five mineral phases: calcite, anorthite, orthoclase, kaolinite, and illite. Table 2 presents the principal mineralization reactions considered in the model, the reaction-related parameter settings can be found in Ref. [36].
To conduct further research, a five-spot well pattern mechanistic model was constructed. The model consisted of a grid with dimensions of 50 × 50 × 10 cells in the X, Y, and Z directions, respectively, with a horizontal grid spacing of 10 m and a vertical grid spacing of 2 m. The production wells are positioned at the four corners, while the CO2 injection well is centrally located. Initial conditions include a formation pressure of 20 MPa and a water saturation of 0.3. Figure 2 illustrates the heterogeneous porosity and permeability distributions, with mean values of 0.1 and 0.77 mD, respectively, the model employs heterogeneous porosity–permeability fields that are statistically consistent with a real gas reservoir, to capture the impact of in situ heterogeneity on flow.

3. Results and Discussions

3.1. Physical Properties of CH4, CO2, Natural Gas, and CO2-Natural Gas Mixtures

The composition of the natural gas used is listed in Table 3. The reservoir gas is methane-rich (>90%), with 7% C2–C6 intermediate hydrocarbons and approximately 1% each of CO2 and N2. Using the PR-EOS, we computed the compressibility factor (Z), density, and viscosity of pure CH4 and of the reservoir natural gas over a range of temperatures and pressures; the results are shown in Figure 3. The panels are arranged with rows (top to bottom) representing CH4, natural gas, and their comparison, and columns (left to right) showing the compressibility factor (Z), density, and viscosity. Each subplot depicts variations with pressure across temperatures of 20~120 °C. Z quantifies deviation from ideal-gas behavior (for an ideal gas, Z = 1). Because the natural gas contains about 10% non-methane components with stronger intermolecular interactions, at the same temperature and pressure it departs more from ideality than pure CH4, and its Z exhibits a larger dependence on pressure, indicating higher compressibility. As temperature increases, thermal motion intensifies and the relative influence of intermolecular forces diminishes; consequently, the compressibility factors of both natural gas and CH4 increase with temperature, and their difference at a given pressure decreases.
Due to the presence of heavier C2–C6 components and a small amount of CO2, the density and viscosity of natural gas are consistently higher than those of CH4. With increasing pressure, intermolecular forces and frictional resistance strengthen, and the viscosity difference between natural gas and CH4 becomes more pronounced.
Overall, the natural gas in the research area contains more than 90% CH4, so its Z, density, and viscosity are generally close to those of pure methane. The remaining approximately 10% non-methane components increase pressure sensitivity making the gas more compressible and raise both density and viscosity.
Using the PR-EOS, we computed the Z, density, and viscosity of CO2 at various temperatures and pressures and compared them with those of natural gas. The results are shown in Figure 4. The figure separately depicts, for CH4 and for natural gas, the pressure dependence of their physical properties over 20–120 °C. As pressure increases, the Z values of both fluids exhibit a trend of initial decrease followed by increase. Higher temperatures generally result in larger Z values. The Z of CO2 is significantly lower than that of natural gas at the same temperature and pressure. Near the critical point, CO2 shows more dramatic changes in Z, and compared to natural gas, CO2’s Z is more sensitive to temperature and pressure variations, deviating more from ideal gas behavior and exhibiting higher compressibility.
Comparing density and viscosity variations reveals that CO2 properties are more sensitive to temperature and pressure changes than natural gas. Near the critical point, CO2 properties change more dramatically. Beyond the critical pressure, significant differences exist in density and viscosity between the two fluids. Under reservoir conditions, the high density of CO2 facilitates downward migration, reducing convective diffusion with natural gas when CO2 is injected in the lower part of the reservoir, thereby preventing large-scale mixing at the displacement front.
Similarly, when reservoir pressure exceeds the CO2 critical pressure, CO2 viscosity becomes significantly higher than natural gas at the same temperature and pressure. This creates favorable mobility ratios during displacement, resulting in piston-like displacement behavior that reduces viscous fingering and enhances displacement front stability.
Using the PR-EOS, we computed the Z, density, and viscosity of CO2 at various temperatures and pressures and compared them with those of natural gas. The results are shown in Figure 5. As pressure increases, the Z values of both fluids exhibit a trend of initial de.
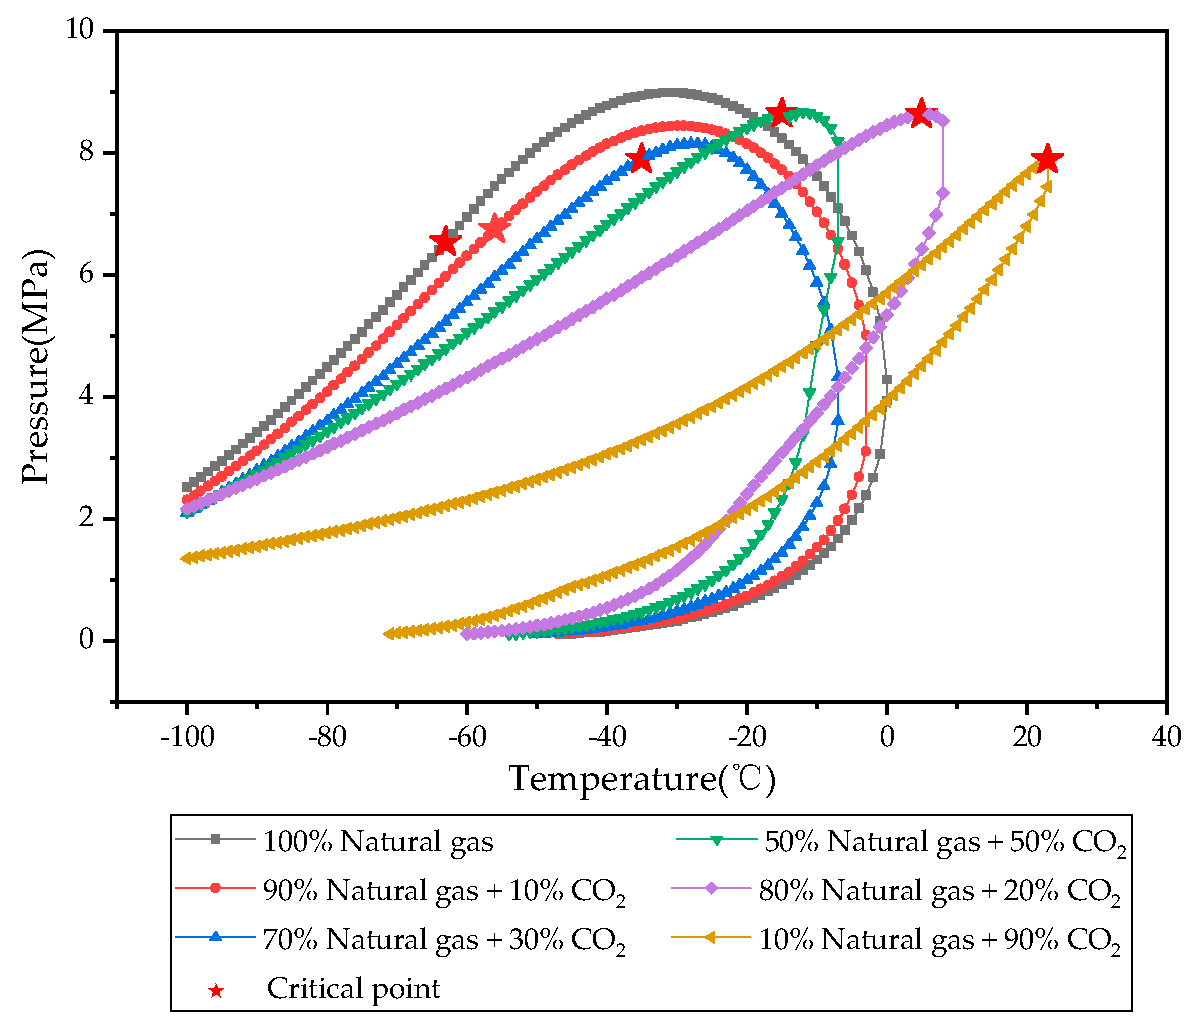
Since partial mixing occurs between the CO2 displacement front and natural gas during the displacement process, creating a transition zone at the displacement front, it is essential to study the physical property variations of CO2-natural gas mixtures at different proportions. Phase diagrams of CO2-natural gas mixtures with varying CO2 concentrations (10%, 30%, 50%, 70%, 90%) were calculated using PR-EOS, as illustrated in Figure 6. As the CO2 content in the mixture system increases, the two-phase region narrows, and the critical point gradually approaches CO2’s critical temperature and pressure. The compressibility factor (Z), density, and viscosity of CO2-natural gas mixtures at different proportions were computed as shown in Figure 1. With increasing CO2 proportion, the physical properties of the mixture system progressively converge toward those of pure CO2.
In this study, we employ the PR-EOS for phase behavior calculations to ensure computational efficiency and reproducibility; however, it does not explicitly account for confined-space effects (e.g., capillary pressure and critical-point shifts), which may introduce systematic bias in phase equilibria and saturation distributions in shale/tight porous media [37]. Future work will adopt improved EOS formulations to incorporate these effects.

3.2. Effects of CO2 Injection Scheme on CSEGR

To compare the enhanced recovery effects of gas injection, a complete depletion development was designed as the baseline comparison case. During the first 10 years of depletion development, each production well produced at a gas rate of 2000 m3/d. In the subsequent 10 years, production continued at 1000 m3/d until abandonment pressure was reached. After the first 10 years of depletion development, the average bottomhole flowing pressure of all production wells decreased to 10 MPa, with CH4 recovery reaching 46.63%. The pressure decline rate slowed after reducing the gas production rate and continuing depletion development for another 10 years, with the final depletion development CH4 recovery reaching 69.92%.
The continuous CO2 injection development scheme, based on 10 years of depletion development, involved deploying one injection well at the model center for continuous CO2 injection over 10 years, with a total injection volume of 1 HCPV. During the gas injection development period, each production well produced at a gas rate of 3000 m3/d, with a minimum bottomhole flowing pressure limit of 7.35 MPa (ensuring CO2 remained in supercritical state in the reservoir). Wells were shut in when the CO2 mole fraction in the produced gas reached 20%. The continuous injection scheme achieved a 36.15% increase in CH4 recovery over the first 10 years of depletion development, representing a 12.86% improvement compared to the complete 20-year depletion development. This result is consistent with the findings reported in Ref. [38], indicating good agreement and reliability of our conclusions. To further demonstrate the superiority of CO2 as an injection medium for enhanced recovery, we simulated injection of an equivalent volume of N2. N2 readily mixes with natural gas, leading to early breakthrough of the injected gas. The continuous CO2 injection over 20 years achieved a 4% higher recovery improvement compared to N2 injection.
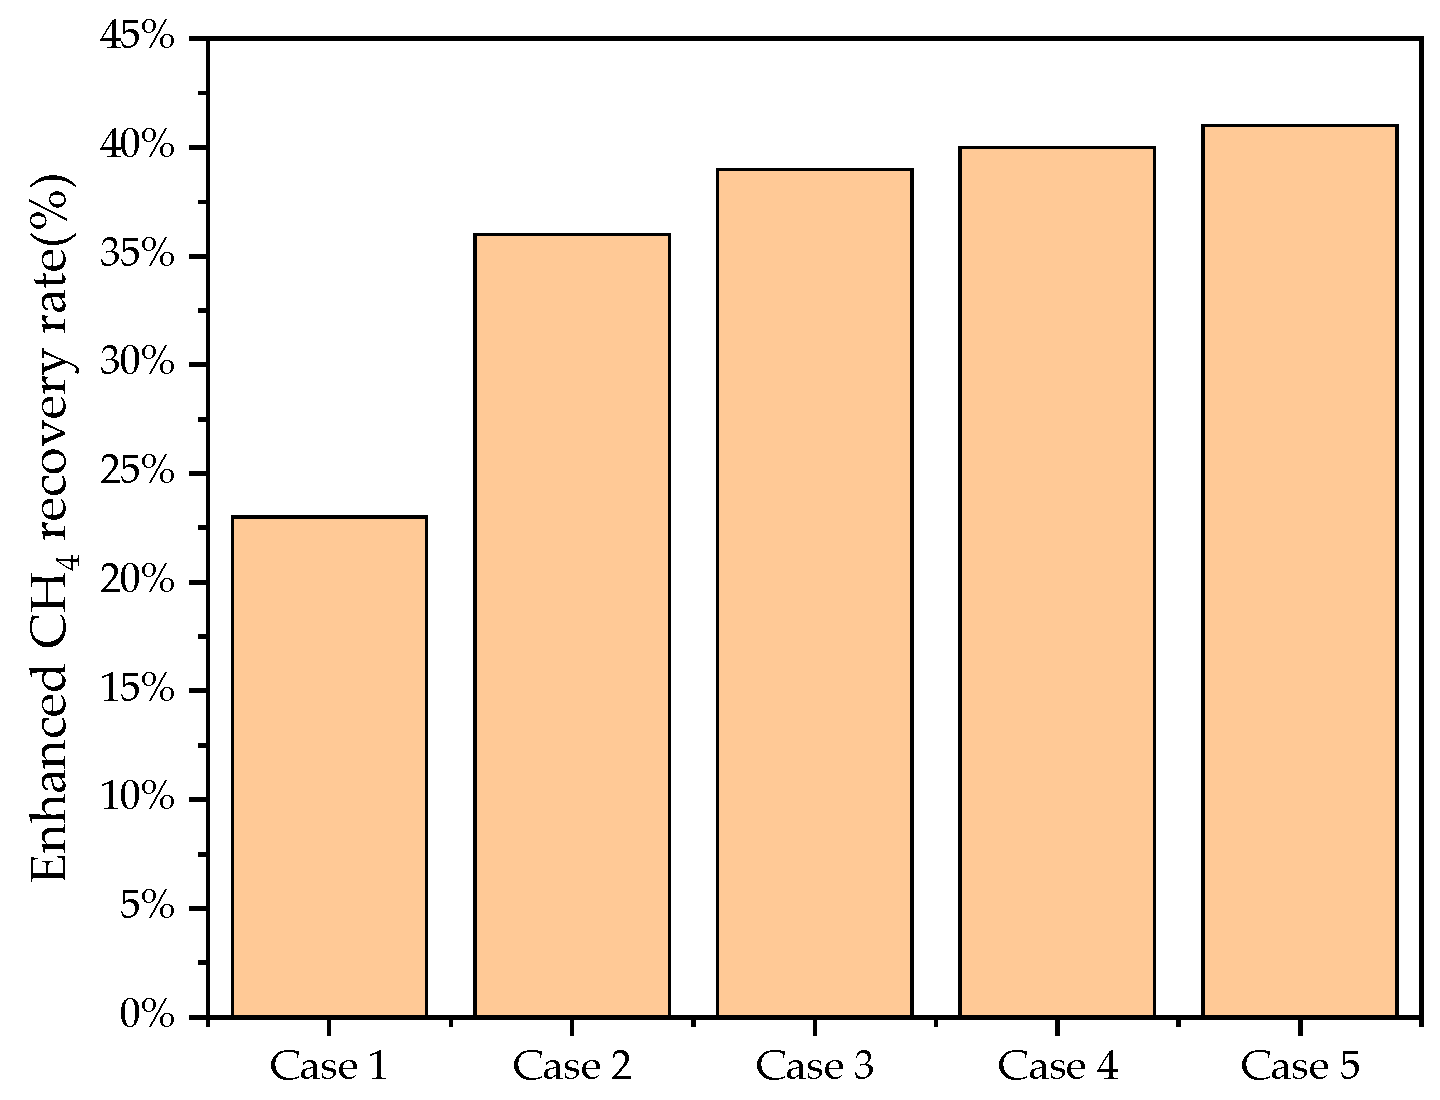
To further compare the differences between continuous and intermittent gas injection methods, the intermittent ratio was set at 1:1, meaning injection time equaled shut-in time. Since the total gas injection development period was fixed at 10 years, with a total injection volume of 1 HCPV, the number of intermittent cycles was controlled by varying the single injection duration. For convenient comparison, depletion development was designated as case 1, continuous gas injection as case 2, and intermittent cycles of 2, 5, and 10 times as cases 3, 4, and 5, respectively. Production wells maintained a gas production rate of 3000 m3/d, with a minimum bottomhole flowing pressure limit of 7.35 MPa. The shut-in condition was when the CO2 mole fraction in produced gas reached 20%.
Figure 7 presents the final recovery rates for various scenarios. Intermittent gas injection scenarios demonstrate superior recovery enhancement over continuous gas injection. Recovery enhancement increases slightly with the number of intermittent cycles. This phenomenon occurs because extended injection periods accelerate formation energy replenishment and CO2 migration toward production wells, leading to earlier attainment of shut-in limit conditions. The shut-in periods in intermittent injection effectively delay gas breakthrough. Increased intermittent cycles result in prolonged shut-in periods, extended production well operation time, and consequently enhanced CH4 production.
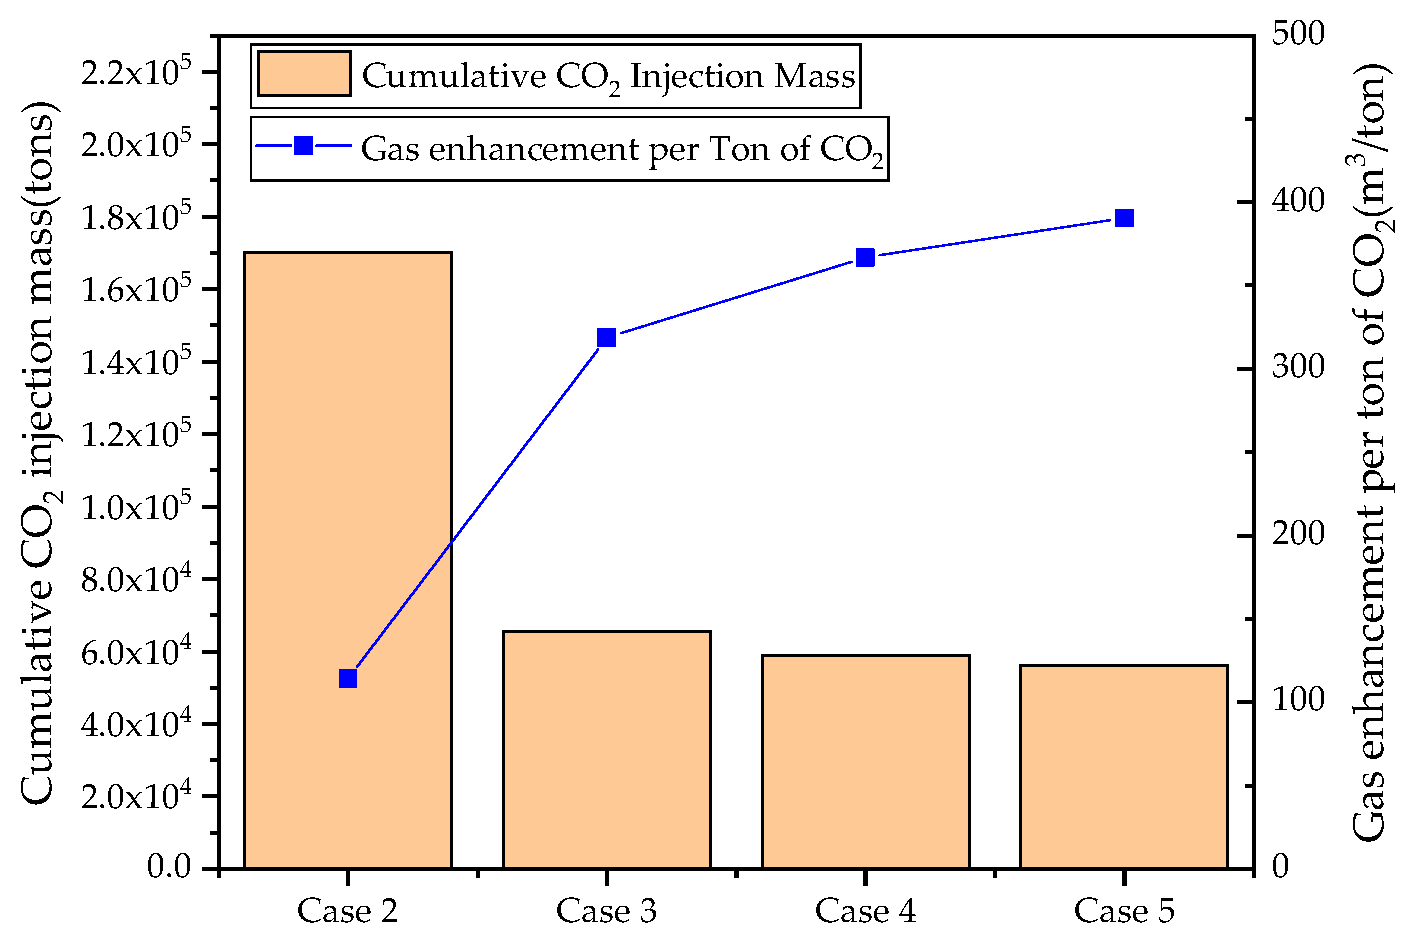
Since the injection rate during the injection period of intermittent gas injection equals that of continuous gas injection, the total CO2 injection mass for intermittent injection methods is substantially reduced compared to the continuous injection scenario. Owing to shut-in conditions, when all production wells are closed, the gas reservoir enters a pure CO2 storage phase. Figure 8 illustrates the cumulative CO2 injection volume and gas enhancement per ton of CO2 for different injection methods. From a recovery enhancement standpoint, intermittent injection methods achieve higher recovery rates with reduced cumulative CO2 injection, resulting in superior gas enhancement per ton of CO2. However, from a storage perspective, continuous injection methods offer greater CO2 storage capacity.

3.3. Effects of CO2 Injection Rate on CSEGR

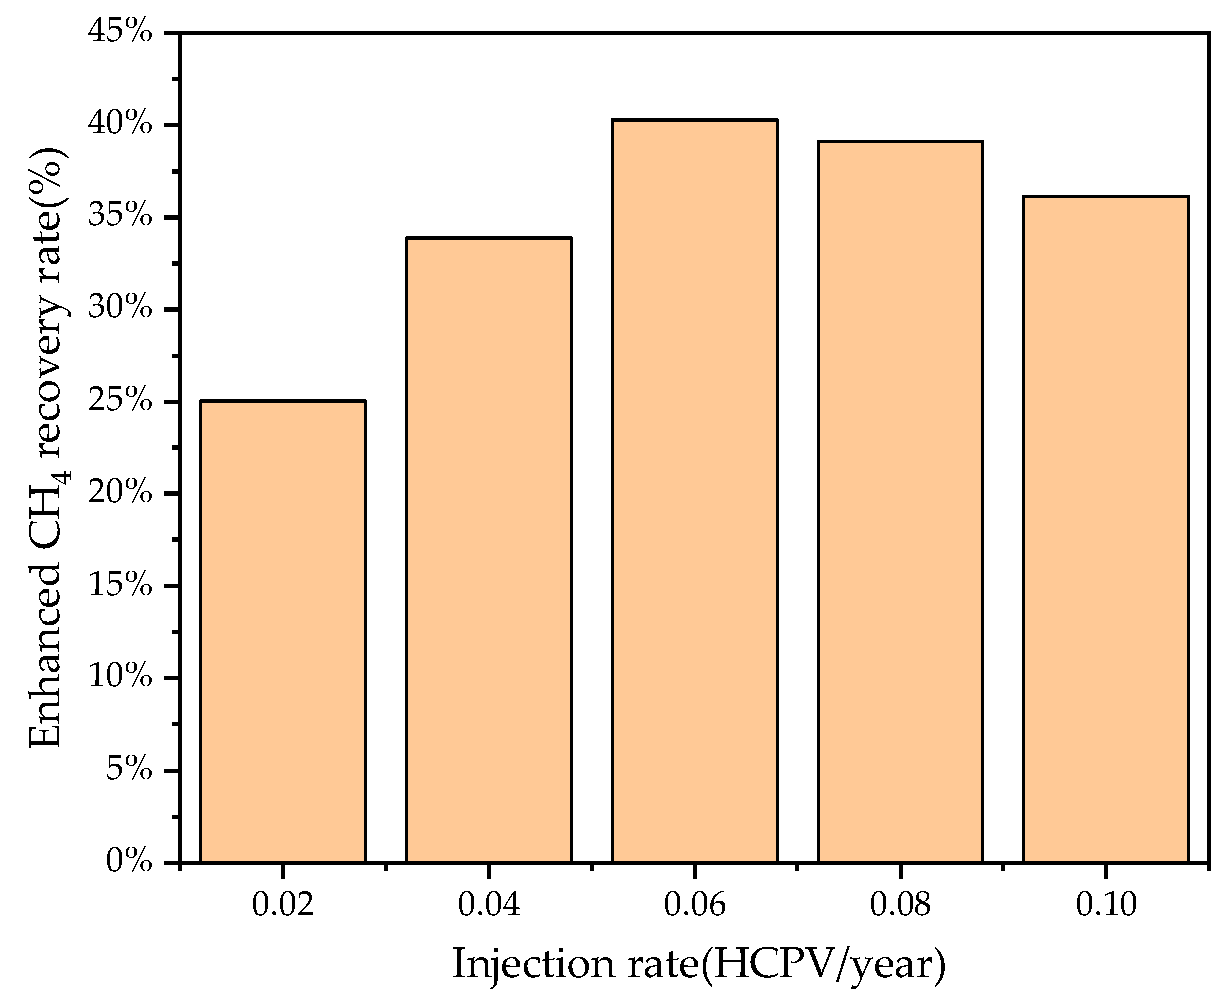
The injection rate affects both the gas injection energy replenishment effectiveness and the CO2 front advancement velocity. To explore the influence of different injection rates during the injection phase on recovery enhancement and geological storage, various injection rate schemes were established under continuous gas injection conditions. Specifically, annual injection rates were configured at 0.02 HCPV/year, 0.04 HCPV/year, 0.06 HCPV/year, 0.08 HCPV/year, and 0.1 HCPV/year. Figure 9 illustrates the recovery enhancement for different injection rate schemes. Recovery enhancement initially increases and then decreases with increasing injection rate, with 0.06 HCPV/year achieving optimal recovery enhancement. At injection rates below 0.06 HCPV/year, insufficient total injected gas volume prevents adequate formation energy deficit replenishment and effective pressure drive system establishment. Conversely, at injection rates above 0.06 HCPV/year, excessive CO2 front advancement velocity prematurely triggers shut-in conditions, reducing production well operation duration and consequently decreasing recovery rates.
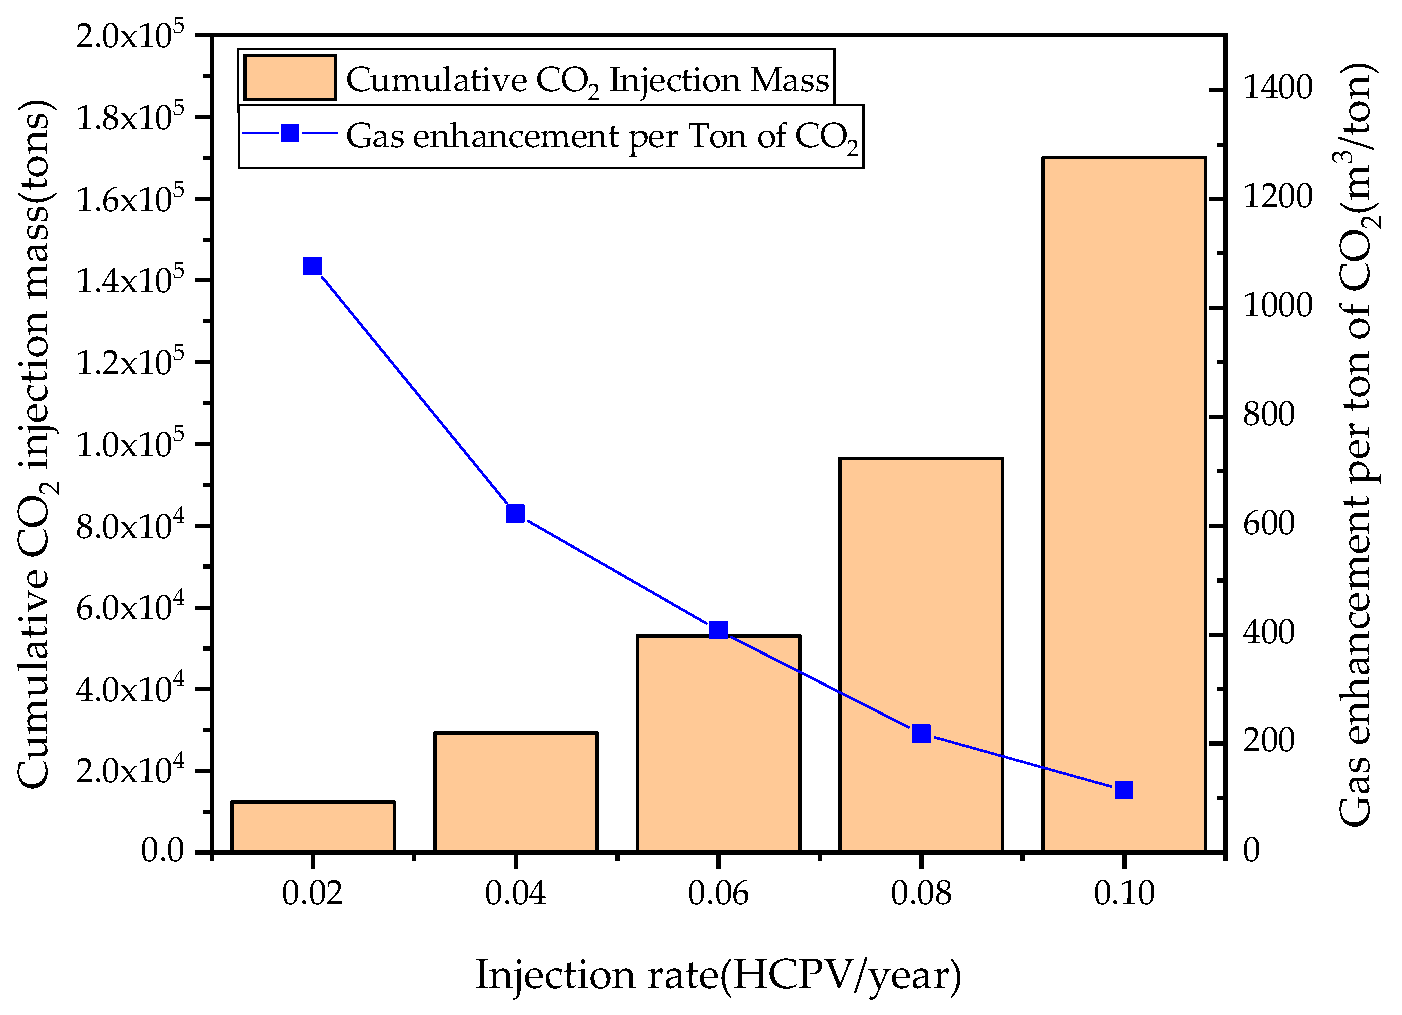
The cumulative CO2 injection mass and gas enhancement per ton of CO2 for different injection rates are shown in Figure 10. Regarding gas enhancement per ton of CO2, lower injection rates result in reduced cumulative CO2 injection, yielding higher gas enhancement per ton of CO2. While injection rates below 0.06 HCPV/year demonstrate higher CO2 utilization efficiency, overall recovery enhancement remains limited. At injection rates exceeding 0.06 HCPV/year, recovery enhancement plateaus, and gas enhancement per ton of CO2 decreases substantially. This suggests that elevated injection rates rapidly replenish formation energy and effectively enhance recovery but diminish effective gas enhancement per ton of CO2. As injection rates exceed reasonable values under current production rates and shut-in limit conditions, gas breakthrough in production wells accelerates. From a storage perspective, increased injection rates hasten the pure storage phase arrival, with elevated formation pressure enhancing CO2 storage capacity.
This indicates that optimal injection rates are established based on determined production rates and shut-in conditions. Changes in production rates or shut-in conditions will correspondingly alter optimal injection rates. Future research should address the reasonable formulation of injection-production schemes considering multi-parameter interactions.

3.4. Effects of Production Rate on CSEGR

Production well production rates influence gas breakthrough timing to a certain degree and directly determine recovery rate variation patterns. Various production rate schemes were established under continuous gas injection conditions. Specifically, production wells were configured to operate at gas production rates of 1000 m3/d, 2000 m3/d, 3000 m3/d, 4000 m3/d, and 5000 m3/d. Figure 11 illustrates the recovery enhancement for different production rate schemes. Recovery enhancement continuously increases with rising production rates, while production wells simultaneously reach shut-in conditions more rapidly. When production rates exceed 4000 m3/d, the recovery enhancement improvement rate diminishes.
Figure 12 presents the cumulative CO2 injection volume and gas enhancement per ton of CO2 for various injection rates. Gas enhancement per ton of CO2 continuously increases with rising production rates. From a storage perspective, given unchanged injection rates, formation pressure decline rates accelerate continuously, and the mass corresponding to equivalent underground volumes of injected CO2 continuously decreases. Further increasing production rates causes production wells to rapidly transition to constant pressure production, which offers no assistance for recovery enhancement while further reducing storage capacity. Consequently, under current injection rates, a production rate of 4000 m3/d is optimal.

3.5. Effects of Shut-In Condition on CSEGR

Shut-in condition directly determines the production duration of producers: the higher the CO2 fraction in produced gas allowed before shut-in, the greater the corresponding CH4 produced. However, engineering practice must also account for the treatment of high-CO2 produced gas and associated issues such as pipeline corrosion. Therefore, a trade-off is required between maximizing recovery and corrosion control. Under continuous CO2 injection, we configured different shut-in conditions whereby producers are shut in when the CO2 fraction in produced gas reaches 10%, 15%, 20%, 25%, and 30%, respectively. The resulting recovery enhancement under different shut-in conditions is shown in Figure 13. As the shut-in CO2 limit increases, production time progressively extends and recovery enhancement increases, because later shut-in leads to higher cumulative production.
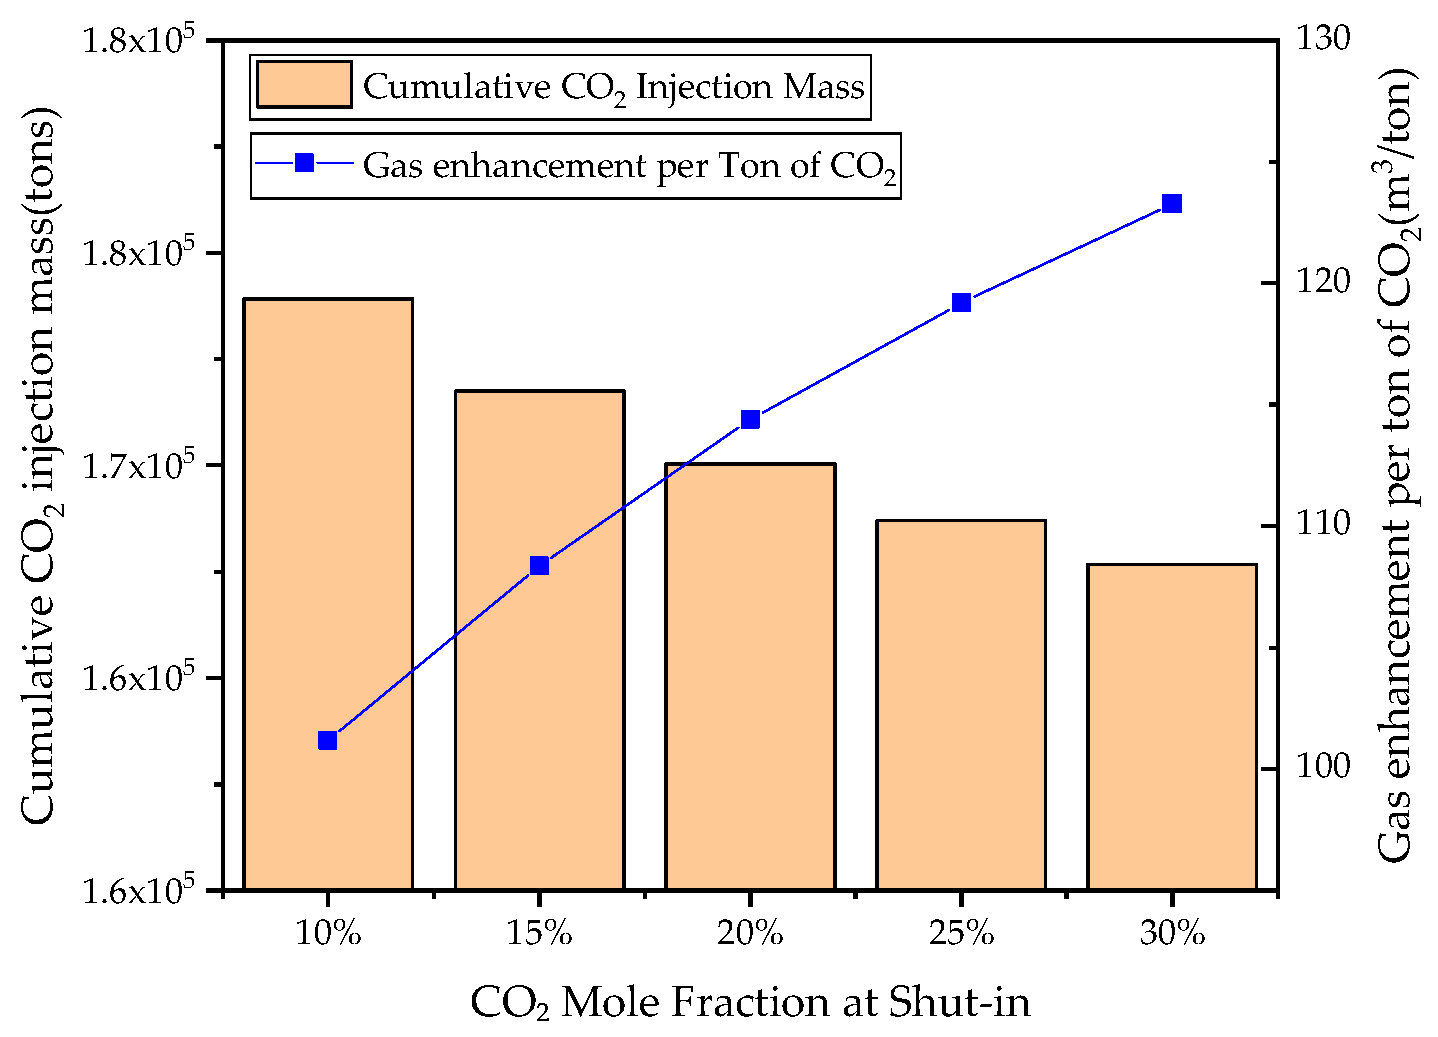
The cumulative CO2 injection mass and gas enhancement per ton of CO2 under different shut-in conditions are shown in Figure 14. As shut-in conditions become more permissive, production time increases, the magnitude of formation pressure decline grows, and the mass corresponding to the same subsurface volume of injected CO2 decreases. Additionally, the gas enhancement per ton of CO2 increases gradually with increasing CO2 mole fraction at shut-in. The influence of shut-in condition on recovery is straightforward and has significant implications for optimizing both injection and production rates.

3.6. Main Controlling Factors for CCUS-EGR

Based on the preceding single-factor analyses, we further considered interactions among parameters. Optimizing each parameter in isolation may yield only a local optimum; the optimal injection-production scheme and parameter combination may not coincide with the combination of single-factor optima. Therefore, we designed an orthogonal experiment to investigate how interactions among multiple development factors affect the performance metrics, and employed analysis of variance to assess the relative importance of each factor.
We adopted recovery enhancement, CO2 utilization efficiency (gas enhancement per ton of CO2), and CO2 storage efficiency as evaluation metrics. The factors in the orthogonal design were Injection scheme, injection rate, production rate, and shut-in condition. The parameter settings for each case are summarized in Table 4.
Based on the analysis of variance results for recovery enhancement, the factors in order of decreasing significance are injection rate > production rate > Injection scheme > shut-in condition. Injection rate directly governs energy replenishment and determines whether the displacement pressure system can satisfy the daily gas offtake requirement. Production rate is secondary, as it controls the produced gas volume, while Injection scheme and shut-in condition are relatively less influential than injection and production rates.
For gas enhancement per ton of CO2, the order is: injection rate > Injection scheme > production rate > shut-in condition. Injection rate is paramount because it directly affects CO2 utilization efficiency. Injection scheme ranks second: with intermittent injection, shut-in periods allow production to be sustained by the pressure gradient established during injection, yielding higher CO2 utilization than continuous injection. Production rate and the shut-in condition are comparatively least significant.
For cumulative CO2 injection mass, the order is: injection rate > Injection scheme > production rate > shut-in condition. The injection rate directly determines the amount of CO2 injected over the development period, hence the highest significance. Injection scheme is next because intermittent injection includes shut-in periods that materially affect the total injected volume. Production rate and the shut-in condition have the lowest significance for total injected CO2.
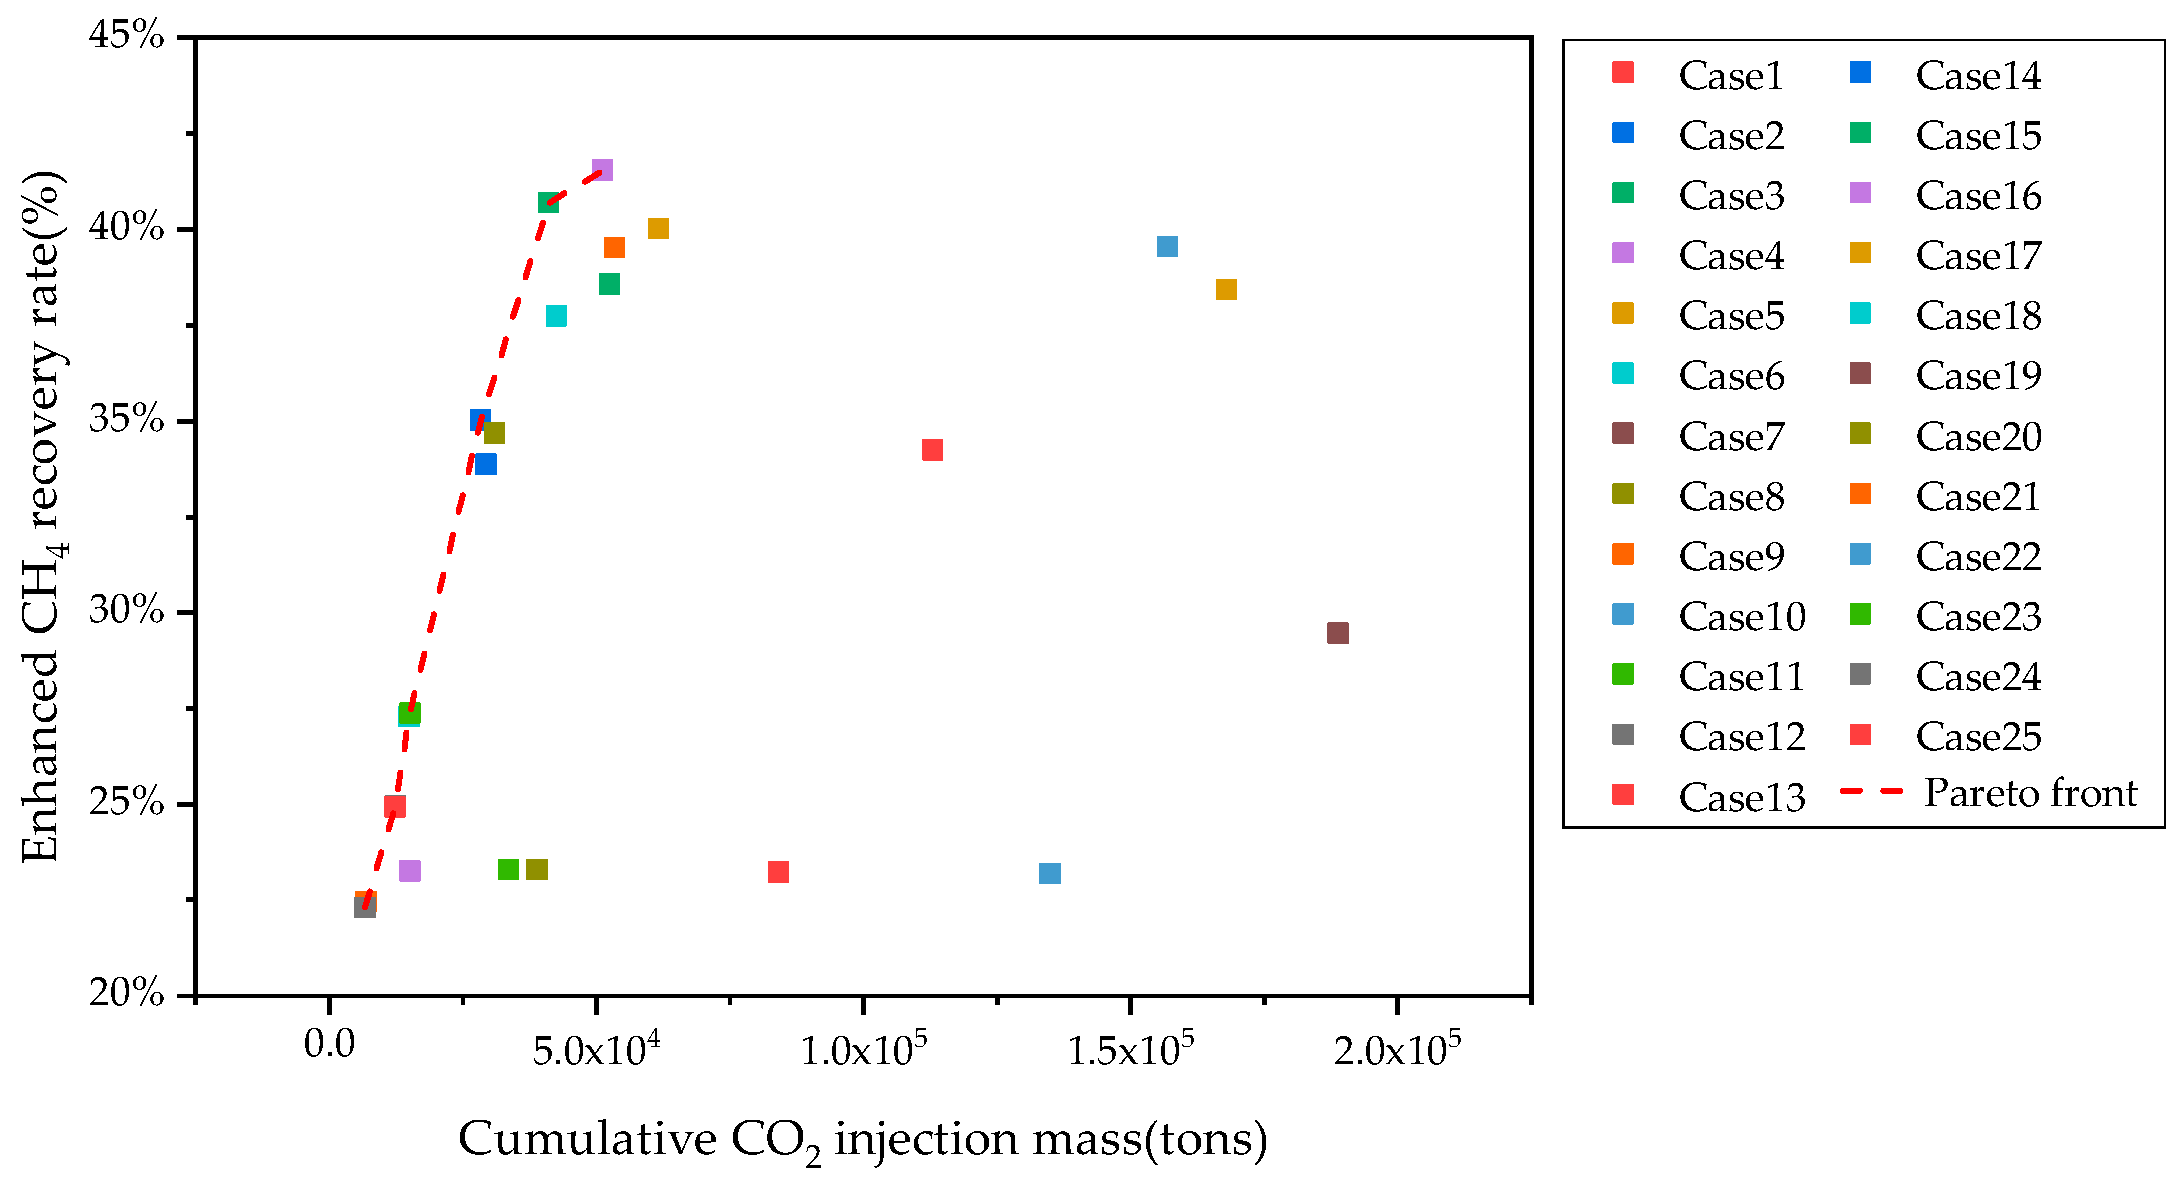
Different schemes emphasize different objectives; there is no single “perfect” scheme that both minimizes CO2 injection and maximizes recovery enhancement. If recovery enhancement is the sole objective, Case 4 is optimal. However, when the economic cost of CO2 injection is considered, Case 15 is clearly more economical: recovery decreases by only 0.85%, while injected CO2 is reduced by 19.7%. For Case 15, with an incremental gas production of 983.75 m3/ton CO2 injected, a CO2 injection cost of 180 ¥/ton (based on Ref. [39]), and a natural gas price of 1.575 ¥/m3, the net economic benefit per ton of CO2 for enhanced recovery reaches 1369.41 ¥, excluding storage subsidies. We plot an X–Y scatter of cumulative injected CO2 versus recovery enhancement for all orthogonally designed cases (Figure 15) and identify the Pareto front (the set of non-dominated solutions), thereby provide field-oriented parameter optimization guidance and implementable operating windows, which can directly inform option selection and injection–production parameter settings for the target block.
Considering the cost of gas injection, Case 15, which achieves higher gas enhancement per ton of CO2, was selected for further analysis of CO2 storage mechanisms in the gas reservoir. CO2 geological storage mechanisms primarily include structural trapping, residual trapping, solubility trapping, and mineral trapping. Case 15 maintains production wells above the CO2 critical pressure, ensuring all CO2 in the reservoir remains in the supercritical state.
CO2 dissolution in the aqueous phase refers to CO2 gas entering and dispersing within the aqueous phase. When CO2 contacts water, some CO2 molecules enter the aqueous phase, forming a CO2 aqueous solution. At this point, CO2 exists in molecular form within the water. Beyond molecular existence, CO2 also reacts chemically with water to form carbonic acid (H2CO3), which further ionizes to produce bicarbonate ions (HCO3) and carbonate ions (CO32−). Therefore, CO2 dissolution in the aqueous phase includes both molecular CO2 and the ionic forms (HCO3and CO32−) formed after CO2 dissolves in formation water. Mineral trapping refers to CO2 existing in the form of mineral precipitation.
The evolution curves of different CO2 storage mechanisms for Case 15 are shown in Figure 16, it can be observed that as gas injection progresses, supercritical, ionic, and dissolved CO2 continuously increase, while mineral CO2 continuously decreases. This indicates that during the injection period, storage mechanisms are dominated by structural and residual trapping. Since Case 15 is an intermittent injection scheme, storage mechanism transformations occur during shut-in periods: some supercritical CO2 continuously dissolves into formation water, with slight increases in ionic and dissolved CO2 during the shut-in phase. Throughout the entire injection period, the amount of CO2 stored in mineral form continuously decreases, indicating that mineral dissolution predominates.
Mineralization reactions primarily occur within the CO2 swept zone, as illustrated by calcite in Figure 17. The changes in mineral quantities in the formation are shown in Figure 18. As injection progresses, calcite dissolution dominates the mineral changes in the formation, anorthite is continuously dissolved, orthoclase initially shows slight precipitation followed by continuous dissolution, while kaolinite and illite predominantly precipitate. The evolution of different CO2 storage mechanisms indicates that during the CO2 injection development phase, due to the short time scale, storage mechanisms are dominated by structural and residual trapping, while minerals primarily undergo dissolution. Achieving more stable CO2 storage in mineral form requires a longer time scale.

4. Conclusions

This study utilized the PR-EOS to investigate the physical properties of CH4, CO2, and natural gas. A numerical simulation model for tight gas reservoirs was established, considering CO2 dissolution in formation water and CO2-water-rock geochemical reactions. Based on numerical simulation methods, we explored the influence patterns of injection scheme, injection rate, production rate, and shut-in condition on CO2 enhanced recovery and storage effectiveness. An orthogonal design was conducted to investigate the main controlling factors affecting CO2 enhanced gas recovery and storage effectiveness under multi-factor interactions. The main conclusions are as follows:
  • Under reservoir temperature and pressure conditions, CO2 exhibits significant differences in compressibility factor, density, and viscosity compared to natural gas. The higher density enables bottom injection to avoid large-scale mixing at the displacement front, while viscosity differences form favorable mobility ratios for piston-like displacement and improved front stability.
  • Intermittent injection slightly outperforms continuous injection for recovery enhancement, with shut-in periods delaying CO2 breakthrough and improving utilization efficiency. However, continuous injection stores more CO2 mass during development. Injection rate affects energy replenishment and front advancement velocity, while production rates must balance recovery enhancement with formation energy constraints and corrosion prevention.
  • For recovery enhancement effectiveness, factor significance ranking is injection rate > production rate > injection scheme > shut-in condition. For CO2 storage effectiveness, the ranking is: injection rate > injection scheme > production rate > shut-in condition. Injection rate directly determines energy replenishment and total CO2 mass injected, while injection scheme significantly affects total injection volume due to shut-in periods.
  • During gas injection, supercritical, ionic, and dissolved CO2 continuously increase while mineral CO2 decreases. Storage mechanisms are dominated by structural and residual trapping, with supercritical CO2 dissolving into formation water. Mineral changes are characterized by calcite dissolution, anorthite dissolution, orthoclase precipitation followed by dissolution, and kaolinite/illite precipitation.

Author Contributions

Conceptualization, L.L. and J.L.; Methodology, P.L.; Software, Z.Y. and B.F.; Validation, L.L., J.L. and P.L.; Formal analysis, L.L.; Investigation, P.L.; Resources, X.L.; Data curation, J.L.; Writing—original draft, L.L.; Writing—review and editing, P.L.; Visualization, P.L.; Supervision, J.L.; Project administration, X.L.; Funding acquisition, L.L. All authors have read and agreed to the published version of the manuscript.

Funding

This research was funded by the Science and Technology Project of PetroChina Company Limited, “Research on Energy Supplementation to Enhance Recovery in Tight Gas Reservoirs” (No. 2023ZZ25YJ05).

Data Availability Statement

The original contributions presented in this study are included in the article. Further inquiries can be directed to the corresponding author.

Conflicts of Interest

Lili Liu, Jinbu Li, Pengcheng Liu and Bin Fu were employed by the PetroChina Changqing Oilfield Company. The remaining authors declare that the research was conducted in the absence of any commercial or financial relationships that could be construed as a potential conflict of interest. The PetroChina Company Limited had no role in the design of the study; in the collection, analyses, or interpretation of data; in the writing of the manuscript, or in the decision to publish the results.

Abbreviations

The following abbreviations are used in this manuscript:
CSEGRCO2 Storage with Enhanced Gas Recovery
HCPVHydrocarbon Pore Volume

References

  1. Sun, L.; Zou, C.; Jia, A.; Wei, Y.; Zhu, R.; Wu, S.; Guo, Z. Development Characteristics and Orientation of Tight Oil and Gas in China. Pet. Explor. Dev. 2019, 46, 1073–1087. [Google Scholar] [CrossRef]
  2. Gao, H.; Li, H.A. Pore Structure Characterization, Permeability Evaluation and Enhanced Gas Recovery Techniques of Tight Gas Sandstones. J. Nat. Gas Sci. Eng. 2016, 28, 536–547. [Google Scholar] [CrossRef]
  3. Cheng, M.; Xue, W.; Guo, Z.; Hou, M.; Wang, C. Development of Large-Scale Tight Gas Sandstone Reservoirs and Recommendations for Stable Production-The Example of the Sulige Gas Field in the Ordos Basin. Sustainability 2023, 15, 9933. [Google Scholar] [CrossRef]
  4. Zou, C.; Zhu, R.; Liu, K.; Su, L.; Bai, B.; Zhang, X.; Yuan, X.; Wang, J. Tight Gas Sandstone Reservoirs in China: Characteristics and Recognition Criteria. J. Pet. Sci. Eng. 2012, 88–89, 82–91. [Google Scholar] [CrossRef]
  5. Lei, Q.; Xu, Y.; Cai, B.; Guan, B.; Wang, X.; Bi, G.; Li, H.; Li, S.; Ding, B.; Fu, H.; et al. Progress and Prospects of Horizontal Well Fracturing Technology for Shale Oil and Gas Reservoirs. Pet. Explor. Dev. 2022, 49, 191–199. [Google Scholar] [CrossRef]
  6. Zhou, F.; Su, H.; Liang, X.; Meng, L.; Yuan, L.; Li, X.; Liang, T. Integrated Hydraulic Fracturing Techniques to Enhance Oil Recovery from Tight Rocks. Pet. Explor. Dev. 2019, 46, 1065–1072. [Google Scholar] [CrossRef]
  7. Soliman, M.Y.; Hunt, J.L.; Azari, M. Fracturing Horizontal Wells In Gas Reservoirs. SPE Prod. Oper. 1999, 14, 277–283. [Google Scholar] [CrossRef]
  8. Jia, A.; Wei, Y.; Guo, Z.; Wang, G.; Meng, D.; Huang, S. Development Status and Prospect of Tight Sandstone Gas in China. Nat. Gas Ind. B 2022, 9, 467–476. [Google Scholar] [CrossRef]
  9. Stevens, S.H.; Kuuskraa, V.A.; Gale, J.; Beecy, D. CO2 Injection and Sequestration in Depleted Oil and Gas Fields and Deep Coal Seams: Worldwide Potential and Costs. Environ. Geosci. 2001, 8, 200–209. [Google Scholar] [CrossRef]
  10. Yan, J.; Zhang, Z. Carbon Capture, Utilization and Storage. Appl. Energy 2019, 235, 1289–1299. [Google Scholar] [CrossRef]
  11. van der Burgt, M.J.; Cantle, J.; Boutkan, V.K. Carbon Dioxide Disposal from Coal-Based IGCC’s in Depleted Gas Fields. Energy Convers. Manag. 1992, 33, 603–610. [Google Scholar] [CrossRef]
  12. Oldenburg, C.M.; Pruess, K.; Benson, S.M. Process Modeling of CO2 Injection into Natural Gas Reservoirs for Carbon Sequestration and Enhanced Gas Recovery. Energy Fuels 2001, 15, 293–298. [Google Scholar] [CrossRef]
  13. Oldenburg, C. Carbon Sequestration In Natural Gas Reservoirs: Enhanced Gas Recovery and Natural Gas Storage; Lawrence Berkeley National Laboratory: Berkeley, CA, USA, 2003. [Google Scholar]
  14. Zhao, E.; Jin, Z.; Li, G.; Hou, J.; Zeng, Y. Potential Assessment and Production Performance Analysis of CO2 Storage with Enhanced Gas Recovery from Tight Gas Reservoirs. Phys. Fluids 2025, 37, 063103. [Google Scholar] [CrossRef]
  15. Zhang, L.; Cao, C.; Wen, S.; Zhao, Y.; Peng, X.; Wu, J. Thoughts on the Development of CO2-EGR under the Background of Carbon Peak and Carbon Neutrality. Nat. Gas Ind. B 2023, 10, 383–392. [Google Scholar] [CrossRef]
  16. Hamza, A.; Hussein, I.A.; Al-Marri, M.J.; Mahmoud, M.; Shawabkeh, R.; Aparicio, S. CO2 Enhanced Gas Recovery and Sequestration in Depleted Gas Reservoirs: A Review. J. Pet. Sci. Eng. 2021, 196, 107685. [Google Scholar] [CrossRef]
  17. Wang, W.; Wen, J.; Wang, C.; Gomari, S.R.; Xu, X.; Zheng, S.; Su, Y.; Li, L.; Hao, Y.; Li, D. Current Status and Development Trends of CO2 Storage with Enhanced Natural Gas Recovery. Fuel 2023, 349, 128555. [Google Scholar] [CrossRef]
  18. Zhang, Y.; Liu, S.; Chen, M.; Xu, S. Experimental Study on Dispersion Characteristics and CH4 Recovery Efficiency of CO2, N2 and Their Mixtures for Enhancing Gas Recovery. J. Pet. Sci. Eng. 2022, 216, 110756. [Google Scholar] [CrossRef]
  19. Liu, S.-Y.; Ren, B.; Li, H.-Y.; Yang, Y.-Z.; Wang, Z.-Q.; Wang, B.; Xu, J.-C.; Agarwal, R. CO2 Storage with Enhanced Gas Recovery (CSEGR): A Review of Experimental and Numerical Studies. Pet. Sci. 2022, 19, 594–607. [Google Scholar] [CrossRef]
  20. Seo, J.G.; Mamora, D.D. Experimental and Simulation Studies of Sequestration of Supercritical Carbon Dioxide in Depleted Gas Reservoirs. J. Energy Resour. Technol. 2005, 127, 1–6. [Google Scholar] [CrossRef]
  21. Sidiq, H.; Amin, R. Impact of Pore-Pressure on the Recovery Efficiency from CO2-Methane Displacement Experiments. In Proceedings of the 2010 IEEE Workshop on Environmental Energy and Structural Monitoring Systems, Taranto, Italy, 9 September 2010; pp. 1–8. [Google Scholar]
  22. Vandeweijer, V.; van der Meer, B.; Hofstee, C.; Mulders, F.; D’Hoore, D.; Graven, H. Monitoring the CO2 Injection Site: K12-B. Energy Procedia 2011, 4, 5471–5478. [Google Scholar] [CrossRef]
  23. Hussen, C.; Amin, R.; Madden, G.; Evans, B. Reservoir Simulation for Enhanced Gas Recovery: An Economic Evaluation. J. Nat. Gas Sci. Eng. 2012, 5, 42–50. [Google Scholar] [CrossRef]
  24. Patel, M.J.; May, E.F.; Johns, M.L. High-Fidelity Reservoir Simulations of Enhanced Gas Recovery with Supercritical. Energy 2016, 111, 548–559. [Google Scholar] [CrossRef]
  25. Tileuberdi, N.; Gussenov, I. Review on Miscible, Immiscible, and Progressive Nitrogen Injection for Enhanced Oil Recovery. Energy Rep. 2024, 12, 360–367. [Google Scholar] [CrossRef]
  26. Shukla, R.; Ranjith, P.; Haque, A.; Choi, X. A Review of Studies on CO2 Sequestration and Caprock Integrity. Fuel 2010, 89, 2651–2664. [Google Scholar] [CrossRef]
  27. Massarweh, O.; Abushaikha, A.S. CO2 Sequestration in Subsurface Geological Formations: A Review of Trapping Mechanisms and Monitoring Techniques. Earth-Sci. Rev. 2024, 253, 104793. [Google Scholar] [CrossRef]
  28. Orivri, U.D.; Chanda, P.; Johnson, L.; Koehn, L.W.; Pollyea, R.M. Opportunities and Challenges for Geologic CO2 Sequestration in Carbonate Reservoirs: A Review. Int. J. Greenh. Gas Control 2025, 142, 104342. [Google Scholar] [CrossRef]
  29. Bertier, P.; Swennen, R.; Laenen, B.; Lagrou, D.; Dreesen, R. Experimental Identification of CO2–Water–Rock Interactions Caused by Sequestration of CO2 in Westphalian and Buntsandstein Sandstones of the Campine Basin (NE-Belgium). J. Geochem. Explor. 2006, 89, 10–14. [Google Scholar] [CrossRef]
  30. Shiraki, R.; Dunn, T.L. Experimental Study on Water–Rock Interactions during CO2 Flooding in the Tensleep Formation, Wyoming, USA. Appl. Geochem. 2000, 15, 265–279. [Google Scholar] [CrossRef]
  31. Oomole, O.; Osoba, J.S. Carbon Dioxide—Dolomite Rock Interaction During CO2 Flooding Process. In Proceedings of the Annual Technical Meeting; PETSOC: Banff, AB, Canada, 1983; p. PETSOC-83-34-17. [Google Scholar]
  32. Peng, D.-Y.; Robinson, D.B. A New Two-Constant Equation of State. Ind. Eng. Chem. Fundam. 1976, 15, 59–64. [Google Scholar] [CrossRef]
  33. Li, Y.-K.; Nghiem, L.X. Phase Equilibria of Oil, Gas and Water/Brine Mixtures from a Cubic Equation of State and Henry’s Law. Can. J. Chem. Eng. 1986, 64, 486–496. [Google Scholar] [CrossRef]
  34. Cramer, S.D. Solubility of Methane in Brines from 0 to 300°. Ind. Eng. Chem. Process Des. Dev. 1984, 23, 533–538. [Google Scholar] [CrossRef]
  35. Arrhenius, S. Quantitative Relationship between the Rate a Reaction Proceed and Its Temperature. J. Phys. Chem. 1889, 4, 226–248. [Google Scholar]
  36. Kharaka, Y.K.; Gunter, W.D.; Aggarwal, P.K.; Perkins, E.H.; DeBraal, J.D. SOLMINEQ.88, A Computer Program for Geochemical Modeling of Water-Rock Interactions; U.S. Geological Survey: Reston, VA, USA, 1988. [Google Scholar]
  37. Chen, Z.; Li, R.; Du, Y.; Ma, S.; Zhang, X.; Shi, J. Effect of Confinement on the Vapor-Liquid-Liquid Three-Phase Equilibrium during CO2 Utilization and Sequestration in Shale Reservoirs. Adv. Geo-Energy Res. 2025, 16, 199–210. [Google Scholar] [CrossRef]
  38. Clemens, T.; Wit, K. CO2 Enhanced Gas Recovery Studied for an Example Gas Reservoir. In Proceedings of the SPE Annual Technical Conference and Exhibition, San Antonio, TX, USA, 29 September–2 October 2002. [Google Scholar]
  39. Jia, Y.; Shi, Y.; Yan, J. The Feasibility Appraisal for CO2 Enhanced Gas Recovery of Tight Gas Reservoir: Case Analysis and Economic Evaluation. In Proceedings of the International Petroleum Technology Conference, Virtual, 23 March–1 April 2021. [Google Scholar]
Figure 1. Gas-water relative permeability curve.
Processes 13 03097 g001
Figure 2. (a) Porosity distributions and (b) Permeability distributions in the Mechanistic Model. I1 represents the injection well, and P1–P4 represent the production wells.
Processes 13 03097 g002
Figure 3. Rows (top to bottom) show CH4, natural gas, and their comparison; columns (left to right) correspond to (a) compressibility factor (Z), (b) density, and (c) viscosity. Each panel presents variations across temperatures and pressures.
Processes 13 03097 g003
Figure 4. (a) Compressibility factor (Z), (b) density, and (c) viscosity of CO2 and natural gas at different temperature and pressure conditions.
Processes 13 03097 g004
Figure 5. Phase diagrams of CO2-natural gas mixtures with different CO2 proportions.
Processes 13 03097 g005
Figure 6. (a) Compressibility factor (Z), (b) density, and (c) viscosity of CO2−Natural gas mixtures at different pressures.
Processes 13 03097 g006
Figure 7. Enhanced CH4 recovery rate for different development cases.
Processes 13 03097 g007
Figure 8. Cumulative CO2 injection mass and gas enhancement per ton of CO2 for different cases.
Processes 13 03097 g008
Figure 9. Enhanced CH4 recovery rate for different injection rates.
Processes 13 03097 g009
Figure 10. Cumulative CO2 injection mass and gas enhancement per ton of CO2 for different injection rates.
Processes 13 03097 g010
Figure 11. Enhanced CH4 recovery rate for different production rates.
Processes 13 03097 g011
Figure 12. Cumulative CO2 injection mass and gas enhancement per ton of CO2 for production rate.
Processes 13 03097 g012
Figure 13. Enhanced CH4 recovery rate for different shut-in conditions.
Processes 13 03097 g013
Figure 14. Cumulative CO2 injection mass and gas enhancement per ton of CO2 for shut-in condition.
Processes 13 03097 g014
Figure 15. Cumulative CO2 injection mass vs. enhanced CH4 recovery rate for all orthogonally designed cases.
Processes 13 03097 g015
Figure 16. Evolution of different CO2 storage mechanisms.
Processes 13 03097 g016
Figure 17. (a) CO2 mole fraction distribution and (b) calcite distribution.
Processes 13 03097 g017
Figure 18. Changes in mineral quantities.
Processes 13 03097 g018
Table 1. CO2 mole fraction in formation water at different experimental pressures.
Experimental Pressure (MPa)CO2 Mole Fraction in Aqueous Phase (%)
50.46139
150.98926
251.24225
351.40589
451.53514
Table 2. Principal mineralization reactions considered in the model.
Reaction Classification Reaction Equations
Phase Equilibrium Reaction CO 2 ( g ) CO 2 ( aq )
Chemical Equilibrium Reactions CO 2 ( aq ) HCO 3 2 - + H +
HCO 3 - CO 3 2 - + H +
CaCO 3 + H + HCO 3 - + Ca 2 +
Al 2 Si 2 O 5 OH 4 + 6 H + 2 Al 3 + + 5 H 2 O + 2 SiO 2
CaAl 2 Si 2 O 8 + 8 H + 2 Al 3 + + Ca 2 + + 4 H 2 O + 2 SiO 2
KAlSi 3 O 8 + 4 H + Al 3 + + K + + 2 H 2 O + 3 SiO 2
KAl 2 SiAl 4 O 10 OH 2 nH 2 O + 8 H + = 2 . 3 Al 3 + + 5 H 2 O + 6 K + + 0 . 25 Mg 2 + + 3 . 5 SiO 2
Table 3. Natural gas composition in the study area.
Composition Mole Fraction (%)
CO20.91
N21.41
C190.61
C25.01
C30.97
iC40.25
nC40.24
iC50.13
nC50.07
C60.40
Table 4. Parameter settings for the orthogonal design.
Case IDInjection SchemeInjection Rate
(HCPV/Year)
Production Rate
(m3/day)
Shut-in
Condition
(%)
Gas
Enhancement Per Ton of CO2
(m3/ton)
Enhanced CH4 Recovery Rate
(%)
Cumulative CO2 Injection Mass
(tons)
1Intermittent 1.0100015436.1523.22%5.12 × 10⁴
2Intermittent0.6200020533.0435.01%4.11 × 10⁴
3Continuous0.6400010349.6238.56%6.16 × 10⁴
4Continuous0.6500030135.5141.53%1.57 × 10⁵
5Continuous1.0300030398.3138.42%5.34 × 10⁴
6Intermittent0.4500010395.5227.28%5.25 × 10⁴
7Continuous0.8100020123.2623.18%1.68 × 10⁵
8Continuous0.4200025477.1434.68%4.25 × 10⁴
9Continuous0.6300015665.6439.51%2.83 × 10⁴
10Continuous0.8500025603.7823.18%3.09 × 10⁴
11Intermittent0.6100025162.8323.30%1.13 × 10⁵
12Continuous0.2400020621.9724.95%2.93 × 10⁴
13Continuous0.250001583.8724.92%1.89 × 10⁵
14Continuous0.4300020978.1433.87%1.51 × 10⁴
15Intermittent0.8400030983.7540.69%1.49 × 10⁴
16Continuous0.21000101085.9523.26%1.24 × 10⁴
17Intermittent1.05000201089.7440.01%1.23 × 10⁴
18Intermittent0.8300010322.2737.74%3.89 × 10⁴
19Continuous1.0200010373.3129.45%3.36 × 10⁴
20Continuous0.4100030828.6523.30%1.51 × 10⁴
21Intermittent0.2200030148.3722.46%8.42 × 10⁴
22Continuous1.040002592.4639.54%1.35 × 10⁵
23Intermittent0.440001592.4627.37%1.35 × 10⁵
24Intermittent0.23000251744.6922.31%6.93 × 10³
25Continuous0.82000151798.7534.25%6.67 × 10³
Disclaimer/Publisher’s Note: The statements, opinions and data contained in all publications are solely those of the individual author(s) and contributor(s) and not of MDPI and/or the editor(s). MDPI and/or the editor(s) disclaim responsibility for any injury to people or property resulting from any ideas, methods, instructions or products referred to in the content.