Article

Study on Production System Optimization and Productivity Prediction of Deep Coalbed Methane Wells Considering Thermal–Hydraulic–Mechanical Coupling Effects

1
Engineering Technology Research Institute, CNPC Xibu Drilling Engineering Co., Ltd., Urumqi 830011, China
2
School of Resources and Geosciences, China University of Mining and Technology, Xuzhou 221008, China
*
Authors to whom correspondence should be addressed.
Processes 2025, 13(10), 3090; https://doi.org/10.3390/pr13103090
Submission received: 7 September 2025 / Revised: 23 September 2025 / Accepted: 24 September 2025 / Published: 26 September 2025

Abstract

Deep coalbed methane (CBM) resources possess significant potential. However, their development is challenged by geological characteristics such as high in situ stress and low permeability. Furthermore, existing production strategies often prove inadequate. In order to achieve long-term stable production of deep coalbed methane reservoirs and increase their final recoverable reserves, it is urgent to construct a scientific and reasonable drainage system. This study focuses on the deep CBM reservoir in the Daning-Jixian Block of the Ordos Basin. First, a thermal–hydraulic–mechanical (THM) multi-physics coupling mathematical model was constructed and validated against historical well production data. Then, the model was used to forecast production. Finally, key control measures for enhancing well productivity were identified through production strategy adjustment. The results indicate that controlling the bottom-hole flowing pressure drop rate at 1.5 times the current pressure drop rate accelerates the early-stage pressure drop, enabling gas wells to reach the peak gas production earlier. The optimized pressure drop rates for each stage are as follows: 0.15 MPa/d during the dewatering stage, 0.057 MPa/d during the gas production rise stage, 0.035 MPa/d during the stable production stage, and 0.01 MPa/d during the production decline stage. This strategy increases peak daily gas production by 15.90% and cumulative production by 3.68%. It also avoids excessive pressure drop, which can cause premature production decline during the stable phase. Consequently, the approach maximizes production over the entire life cycle of the well. Mechanistically, the 1.5× flowing pressure drop offers multiple advantages. Firstly, it significantly shortens the dewatering and production ramp-up periods. This acceleration promotes efficient gas desorption, increasing the desorbed gas volume by 1.9%, and enhances diffusion, yielding a 39.2% higher peak diffusion rate, all while preserving reservoir properties. Additionally, this strategy synergistically optimizes the water saturation and temperature fields, which mitigates the water-blocking effect. Furthermore, by enhancing coal matrix shrinkage, it rebounds permeability to 88.9%, thus avoiding stress-induced damage from aggressive extraction.

1. Introduction

Since 2019, China’s coalbed methane exploration has progressively advanced to depths exceeding 2000 m. Through the application of large-scale hydraulic fracturing technology, the Daning-Jixian Block achieved a breakthrough with individual wells reaching a daily production of 10.1 × 10⁴ m3, fundamentally challenging conventional assumptions regarding deep CBM reservoirs [1,2]. Notable progress has been made in the exploration and development of deep CBM, particularly in the Yanchuannan and Linxing-Shenfu blocks [3,4,5]. Resource assessments reveal considerable deep CBM resources, estimated at 18.4 × 10¹² m3 within the 2000–3000 m depth range, thereby underscoring promising prospects for future development [6,7].
Although deep coal seams exhibit high gas content, their characteristically low permeability, high stress sensitivity, and weak mechanical elasticity result in complex dynamic reservoir responses during extraction. Permeability varies significantly with changes in effective stress, which can lead to prominent engineering challenges such as rapid production decline and a high proportion of low-efficiency wells [8,9]. In terms of production patterns, studies indicate that deep CBM wells can be classified into three types based on daily output: low, medium, and high. Their production life cycle typically exhibits four stages: gas production increase, decline, stabilization, and depletion. Some research further subdivides the entire life cycle into five stages, identifying key tasks and production characteristics for each phase. Compared with mid-to-shallow wells, deep wells have a higher proportion of free gas in the early stage, enabling faster gas production and higher yields [10,11]. Regarding factors influencing production capacity, it is widely acknowledged that in situ stress, fracture stimulation effectiveness, and production continuity are crucial. Quantitative analyses have confirmed six key factors governing gas production: burial depth, coal seam thickness, the ratio of critical desorption pressure to initial pressure, gas content, permeability, and fracture stimulation effectiveness [12]. Specifically, high reservoir pressure in deep CBM reservoirs leads to prolonged gas desorption and an extended dewatering/pressure reduction phase, thereby increasing production costs [13]. Regarding development strategies, studies propose that implementing large-scale slickwater fracturing in favorable target zones is an effective method to enhance production capacity, which has been successfully demonstrated in field applications. Furthermore, for extraction systems, researchers have developed tailored design methodologies for high-, medium-, and low-productivity wells. These methodologies emphasize that a faster extraction rate is not always better. In particular, a slow extraction strategy is recommended for low-productivity wells that are susceptible to coal fines production [14]. Additionally, guided by the “man-made gas reservoir” concept and the life-cycle management philosophy, a standardized template for well production protocols has been established [15]. However, the development of quantitative, dynamically optimized production strategies for deep CBM wells is still in its infancy.
Focusing on the deep CBM reservoirs in the Daning-Jixian Block of the Ordos Basin, this study developed a thermo-hydro-mechanical (THM) coupling model to forecast production and determine reservoir parameters inversely, subsequently adjusting the production strategy to increase well productivity.

2. Thermal–Hydraulic–Mechanical (THM) Coupling Model for Production in Deep Coalbed Methane Wells

2.1. Basic Assumptions of the Mathematical Model

The mathematical model is founded on the mechanisms of gas–water migration, coal deformation, and gas adsorption/desorption, incorporating the following assumptions [16,17]: (1) Coal is a dual-porosity medium comprising matrix and fractures; (2) Fractures are saturated with water and CH4; (3) CH4 in the matrix is primarily adsorbed; (4) CH4 behaves as an ideal gas, with diffusion governed by Fick’s law; (5) Gas and water seepage follows Darcy’s law; (6) Coal deformation is elastic.

2.2. Mathematical Models

2.2.1. Governing Equations for Fluid Flow

(1)
CH4 Transport Equation in Coal Matrix
In this model, the coal matrix—defined as containing CH4 in adsorbed and free phases and acting as the mass source for fractures—governs CH4 transport by the following equation [16,18,19]:
t V s g ρ s M g R T s P s + ϕ m M g R T P m = M g τ R T P m P f
where t is time, s; Vsg is adsorbed gas content, m3/kg; ρs is rock skeleton density, kg/m3; Mg is molar mass of CH4, kg/mol; R is the universal gas constant, R = 8.314 J/(mol·K); Ts is temperature at standard conditions, Ts = 273.5 K; Ps is standard atmospheric pressure, Ps = 1.01325 × 10⁵ Pa; ϕm is matrix porosity, %; Pm is CH4 pressure in the matrix, Pa; T is reservoir temperature, K; τ is CH4 desorption time, s; Pf is fluid pressure in the fractures, Pa.
The adsorbed CH4 in the coal matrix can be described by the Langmuir equation [16]:
V s g = V L P m P L + P m exp d T T T t 1 + d P P m
where VL is the Langmuir volume, m3/kg; PL is the Langmuir pressure, Pa; dT is the temperature coefficient for gas adsorption, K−1; dP is the pressure coefficient for gas adsorption, Pa−1; Tt is the gas adsorption temperature, K.
(2)
Governing Equations for Fluid Migration in Coal Fracture Systems
The gas–water two-phase flow equations in coal fractures can be expressed as [16,17,18,19,20]:
t S g ϕ M g P f g R T + M g P f g + b R T k r g k μ g P f g D f ρ g S g = 1 ϕ f M g τ R T P m P f t S w ϕ f c T T s + ρ w s + c T c T s + ρ w s k r w k μ w P f w = 0
where Sg/Sw represent gas phase saturation and water phase saturation, with Sw + Sg = 1; ϕf is fracture porosity, %; b is the Klinkenberg factor, Pa; krg/krw are relative permeability of gas phase and water phase, dimensionless; Df is diffusion coefficient, m2/s; k is absolute fracture permeability, ×10−3 μm2; μg/μw are dynamic viscosity of gas phase and water phase, mPa·s; Pfg/Pfw are gas phase pressure and water phase pressure in fractures, Pa; c is the temperature coefficient of water, kg/(m3·K); ρws is water density under standard conditions, kg/m3.
(3)
Supplementary Equation
Under two-phase flow conditions, the gas–water relative permeability is expressed as [16,20,21]:
k r g = k r g 0 1 S w S w r 1 S w r S g r 2 1 S w S w r 1 S w r 2 0 ,   0 S g S g r ,   S g r < S g 1
k r w = 0 ,   0 S w S w r k r w 0 S w S w r 1 S w r 4 ,   S w r < S w 1
where Swr is the irreducible water saturation; Sgr is the residual gas saturation; krw0 is the endpoint relative permeability of water; krg0 is the endpoint relative permeability of gas.
Under two-phase flow conditions, the relationship between fluid pressure, partial pressures, and capillary pressure can be expressed as [16,22]:
P c = P f g P f w P f = P f w S w + P f g S g P c = P e S w 1 λ
where Pc/Pfg/Pfw represent capillary pressure, gas phase pressure, and water phase pressure in the fractures, respectively, Pa; Pe is the displacement pressure, Pa; λ is the pore size distribution coefficient.

2.2.2. Governing Equations for Stress Field

Accounting for coal strain caused by stress, fluid pressure, gas sorption, and temperature changes, the stress field governing equation is formulated as follows [22,23,24,25]:
G u i , j j + G 1 2 ν u j , j i + f j = α m P m , i + α f P f , i + K ε a , i + K α T T i
where
G = E / 2 1 + ν K = E / 3 1 2 ν α m = 1 K / K s α f = 1 K / a K n ε a = α s g V s g
where i, j = x, y, z, denoting directions in the three-dimensional coordinate system; u is the displacement component, m; f is the component of body force, Pa; G is the shear modulus, Pa; K is the bulk modulus, Pa; Ks is the bulk modulus of the rock skeleton, Pa; Kn is the fracture stiffness, Pa/m; αm is the Biot effective pressure coefficient of the matrix; αf is the Biot effective pressure coefficient of the fractures; εa is the matrix shrinkage/swelling strain induced by CH4 adsorption/desorption; αsg is the adsorption strain coefficient, kg/m3; αT is the thermal expansion coefficient of the rock skeleton, K−1; E is the elastic modulus, Pa; v is Poisson’s ratio.

2.2.3. Governing Equations for Temperature Field

The thermal balance in the coal seam is influenced by CH4 adsorption/desorption, elastic deformation, heat conduction, and thermal convection. The corresponding governing equation is [16,26]:
ρ C p e f f T t + η e f f T λ e f f T + K α T T ε v t + q s t ρ s ρ g s M g V s g t = 0
where (ρCp)eff is the effective volumetric heat capacity of the reservoir, J/(m3·K); ηeff is the effective fluid thermal convection coefficient, J/(m2·s); λeff is the effective thermal conductivity of the rock, W/(m·K); εv is the volumetric strain; qst is the isosteric heat of CH4 adsorption, J/mol.
Where (ρCp)eff, ηeff, and λeff can be expressed as [17,25,26]:
ρ C p e f f = 1 ϕ f ϕ m ρ s C s + S g ϕ f + ϕ m ρ g C g + S w ϕ f ρ w C w η e f f = k k r g μ g 1 + b P f g P f g ρ g C g k k r w μ w P f w ρ f w C w λ e f f = 1 ϕ f ϕ m λ s + S g ϕ f + ϕ m λ g + S w ϕ f λ w
where Cs is the specific heat capacity of rock, J/(kg·K); Cg is the specific heat capacity of methane, J/(kg·K); Cw is the specific heat capacity of water, J/(kg·K); λs is the thermal conductivity of rock, W/(m·K); λg is the thermal conductivity of methane, W/(m·K); λw is the thermal conductivity of water, W/(m·K).

2.2.4. Governing Equations for Porosity and Permeability

The matrix porosity and fracture permeability of coal are functions of pressure, gas adsorption/desorption, and temperature. Their mathematical representations are as follows: [16,27,28,29,30]:
ϕ m = 1 + s 0 ϕ m 0 + α m s s 0 1 + s s 0 = ε v 0 + P f 0 K s ε a 0 α T T 0 s = ε v + P f K s ε a α T T
where the subscript “0” denotes the initial state.
The fracture porosity of coal can be expressed as [16,25]:
ϕ f = 1 1 ϕ f 0 1 + ε v 1 α f Δ P f + α m Δ P m K + Δ ε a Δ α T T
The fracture permeability of coal follows the cubic law, which is described by [17]:
k = k 0 ϕ f ϕ f 0 3
where k0 is the initial fracture permeability of coal, ×10−3 μm2.
In summary, Equations (1)–(13) collectively constitute a thermal–hydraulic–mechanical gas–water transport mathematical model for deep coal seams. The model characterizes the behavior of CH4 and water in coal reservoirs, including their occurrence, migration, and the associated evolution of reservoir parameters during CBM production.
The numerical simulations in this study were configured with the following key settings. A direct solver (MUMPS) with an implicit scheme was employed, chosen for its robust convergence that is independent of mesh quality or problem conditioning. The system of equations was discretized using the Finite Element Method (FEM), which is well-suited for handling the various partial differential equations and multi-physics coupling involved. For convergence, the absolute and relative tolerances were set to 0.1 and 0.001, respectively, and nonlinearities were addressed using the constant (Newton) method.

3. Geological Model, Numerical Scheme, and Boundary Conditions

3.1. Geologic Model

The eastern Ordos Basin’s Daning-Jixian Block is characterized by multiple near-source gas accumulations, including tight gas and CBM [31]. At present, tight gas has achieved large-scale development in this block, while deep CBM exploration is still in a stage of technology research and experimental exploration. It has now become one of China’s key demonstration bases for CBM development [32].
Located on the western slope of the regional structural framework (Figure 1a), the deep CBM exploration area exhibits gentle strata (dip angles generally <2.5°), forming a broad, large-scale slope with limited fault development [11].
The principal coal seams in the block are the Permian No. 8 seam of the Taiyuan Formation and the No. 5 seam of the Shanxi Formation, with burial depths predominantly between 2000 and 2400 m. The primary target, the No. 8 seam, consists mainly of primary structured coal. It has a thickness of 5–12 m (Figure 1b), a gas content of 24.3 m3/t, porosity of 5.95–7.45%, permeability of 0.001–0.13 mD, and an average reservoir pressure of approximately 20 MPa.
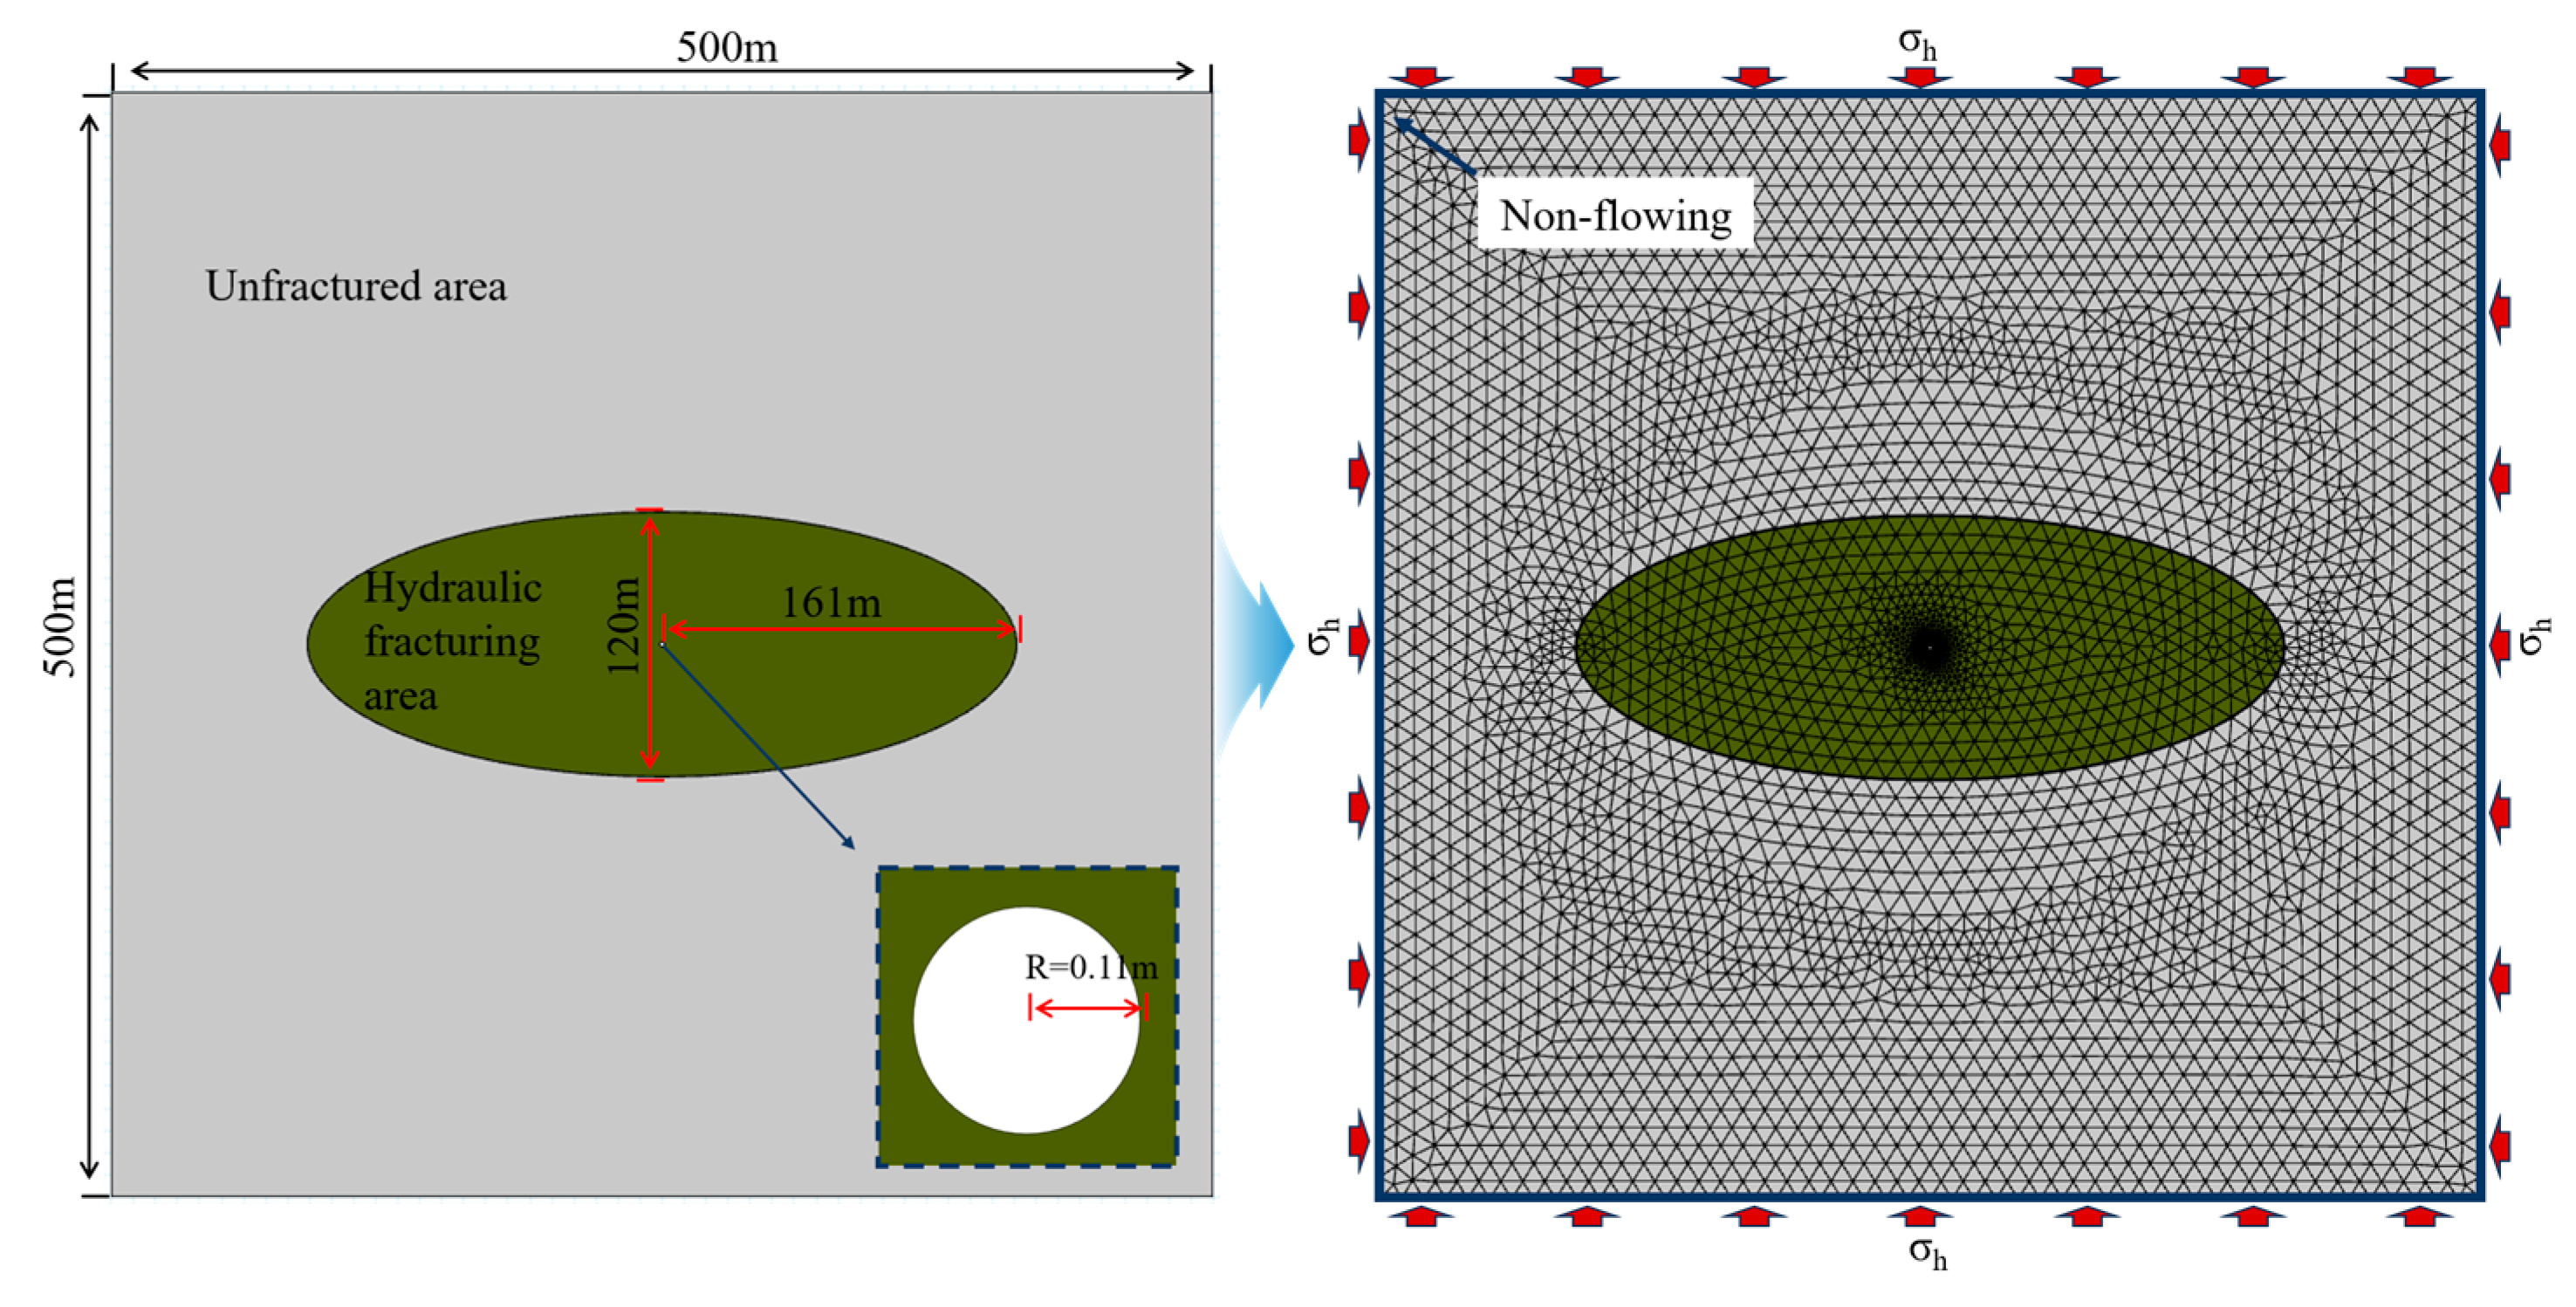
The low permeability and poor pore connectivity of deep coal seams necessitate large-scale hydraulic fracturing. This process creates interconnected pathways among matrix pores, natural fractures, and artificial fractures to enable commercial gas production [11]. Based on the geological and engineering context of the study area, a physical model for production simulation of deep CBM wells was constructed targeting the No. 8 coal seam. The model dimensions are set as a 500 m × 500 m rectangle, with a wellbore radius of 0.11 m. According to microseismic fracture monitoring results in the study area, the hydraulic fracturing zone is configured as an elliptical region with a fracture length of approximately 322 m and a width of 120 m (Figure 2).

3.2. Numerical Scheme

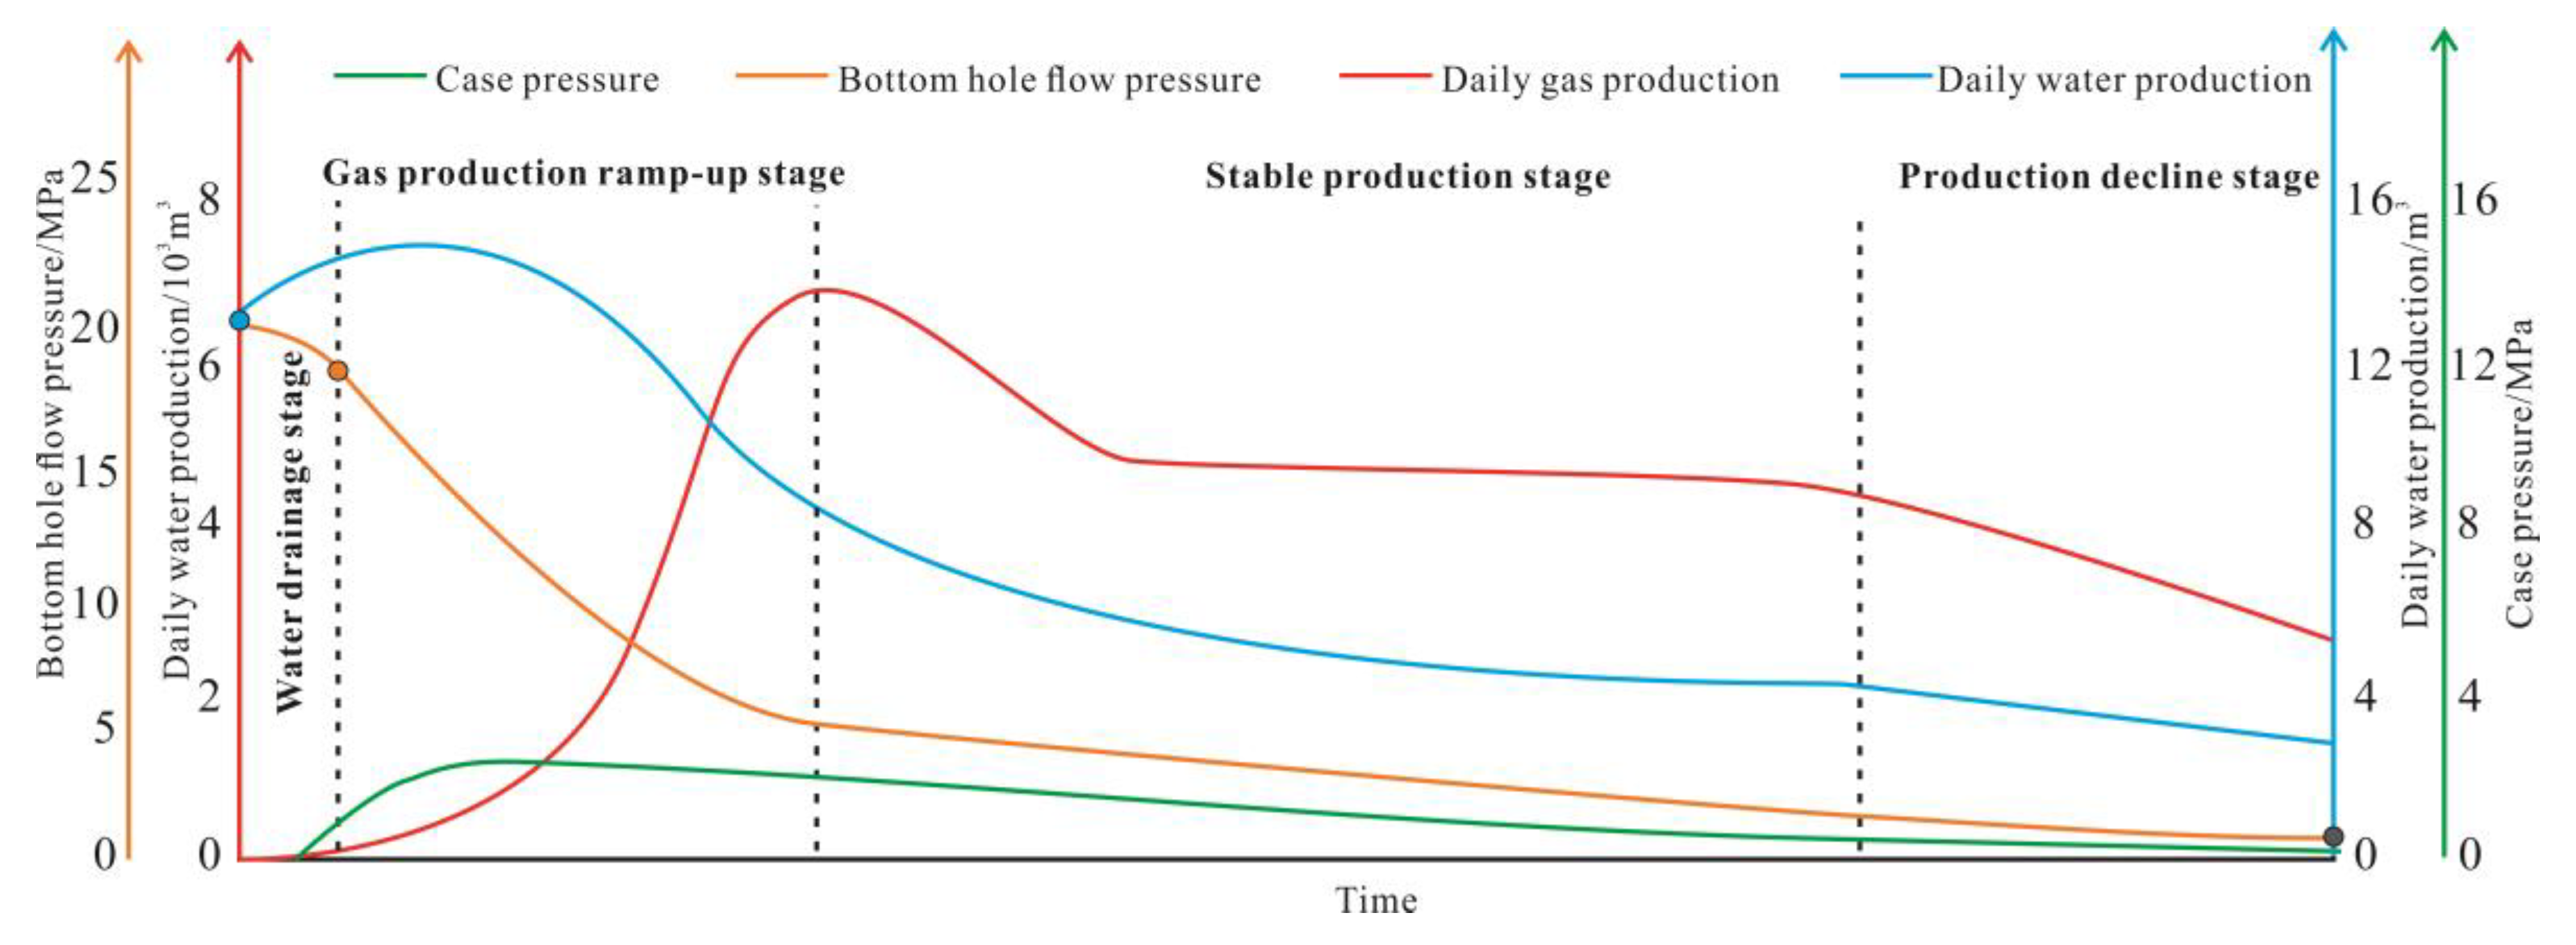
Guided by established frameworks for deep CBM well production and the specific engineering context of the Ordos Basin, we categorize the production process in the Daning-Jixian Block into four stages: dewatering, ramp-up, stable production, and decline (Figure 3).
Production data from the Block’s deep CBM wells form the basis for a systematic classification (Table 1). The extraction process is divided into four distinct stages, each with specific engineering parameters and operational objectives. The water drainage stage operates at a flowing pressure drop rate of 0.10 MPa/d for 26 days, maintaining a casing pressure of 4.9 MPa to rapidly achieve critical desorption pressure through intensive depressurization while minimizing reservoir damage. This is followed by the gas production ramp-up stage, where the flowing pressure drop rate is reduced to 0.038 MPa/d over 17–20 days with a casing pressure of 5.7 MPa to facilitate a smooth transition from dewatering to gas production and confirm gas activation. The stable production stage then continues for 185 days at a flowing pressure drop rate of 0.023 MPa/d and casing pressure of 3.8 MPa, balancing desorption and seepage to ensure sustained high output and demonstrate reservoir stability. Finally, the production decline stage extends beyond 230 days with a minimal flowing pressure drop rate of 0.01 MPa/d (10% of the initial dewatering rate) and casing pressure of 3 MPa, slowing depressurization in response to reduced desorption and extending the well’s economic life while contributing incremental production [2].
Taking Well D1 as the primary study subject and using its current bottom-hole flowing pressure drop velocity as a benchmark, production strategies with different pressure drop velocities were designed (Table 2). By comparing the production performance under these different strategies, the key optimized parameters for production control in deep coalbed methane wells within typical gas-bearing systems were determined.

3.3. Boundary Conditions

Stage 1: Model Initialization and History Matching. The model was initialized with the original reservoir pressure. The inner boundary was defined by the actual bottom-hole flowing pressure, while all external boundaries were set at constant pressure. History matching against actual production data was then performed to validate the model and inversely determine reservoir parameters.
Stage 2: The simulation was continued using the reservoir and bottom-hole pressures at the 300-day mark as the new initial and inner boundary conditions, respectively, with all other boundaries held constant. This model projected production performance and reservoir behavior under the existing strategy for the subsequent 2700 days (Table 3).
The numerical model utilized key parameters sourced from well engineering data and relevant literature (Table 4).

4. Results

4.1. History Matching and Mathematical Model Validation

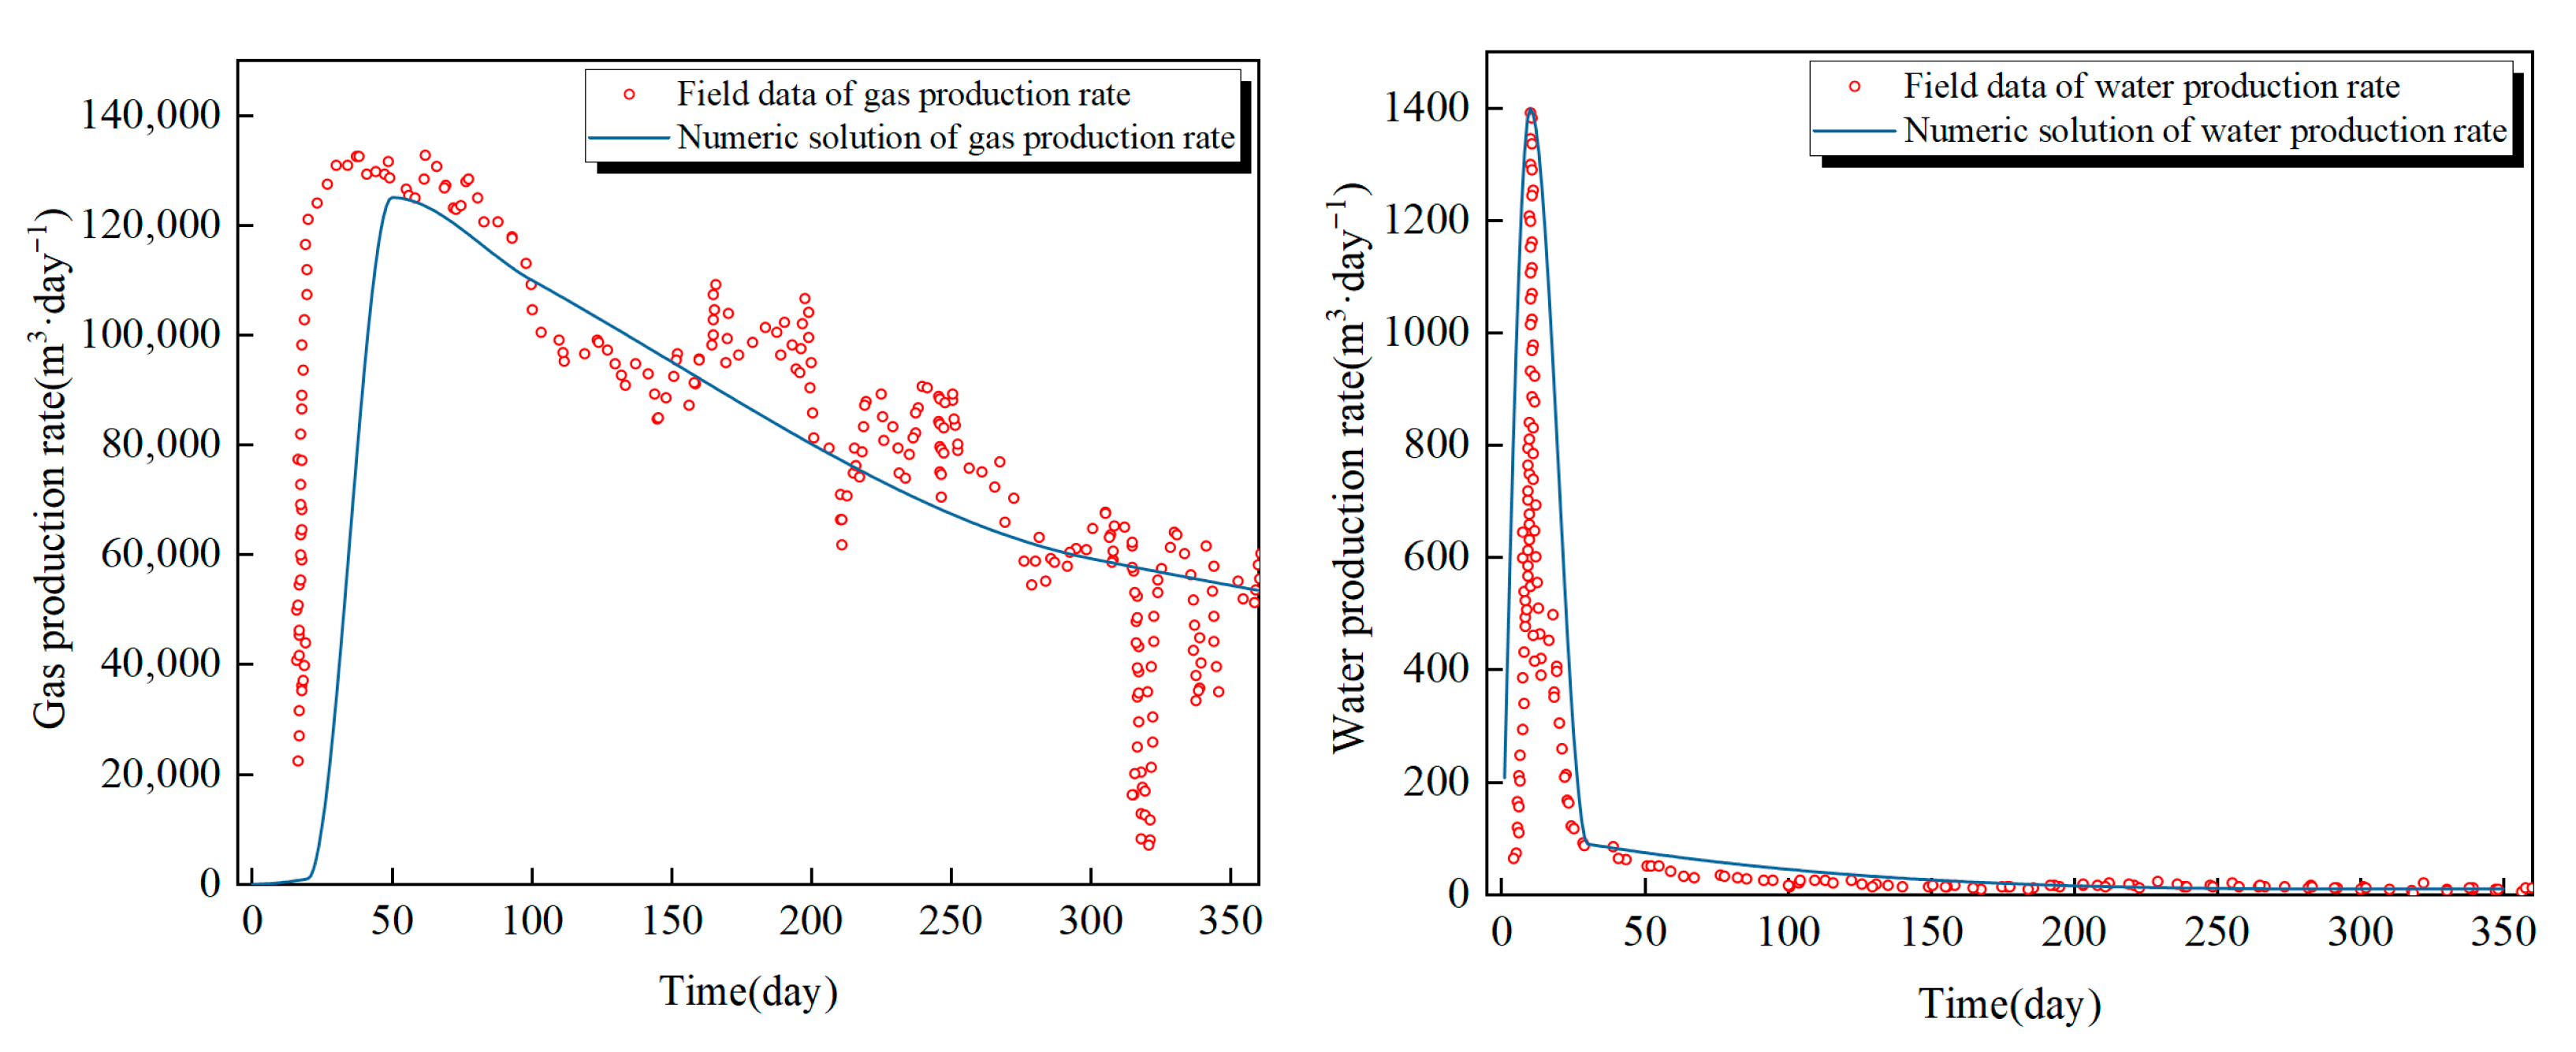
Simulated daily gas and water production rates closely match the actual field data. The simulation error for daily gas production is 13.88%, while that for daily water production is 17.2% (Figure 4), thereby validating the accuracy of the mathematical model. Some deviations exist in the history matching of daily gas production, primarily due to frequent adjustments in the production technical scheme during the extraction process—such adjustments led to significant fluctuations in gas production. In particular, field operations such as suspending pumps for well workover or changes in the production technical scheme at specific time steps could not be effectively represented in the simulation. The discrepancy between the field data and the simulation results was quantified with the following equation [33]:
s i m u l a t i o n   e r r o r   % = f i e l d   d a t a s i m u l a t i o n   d a t a f i e l d × 100

4.2. Impact of Production Strategy on Development Effectiveness of Deep CBM Wells

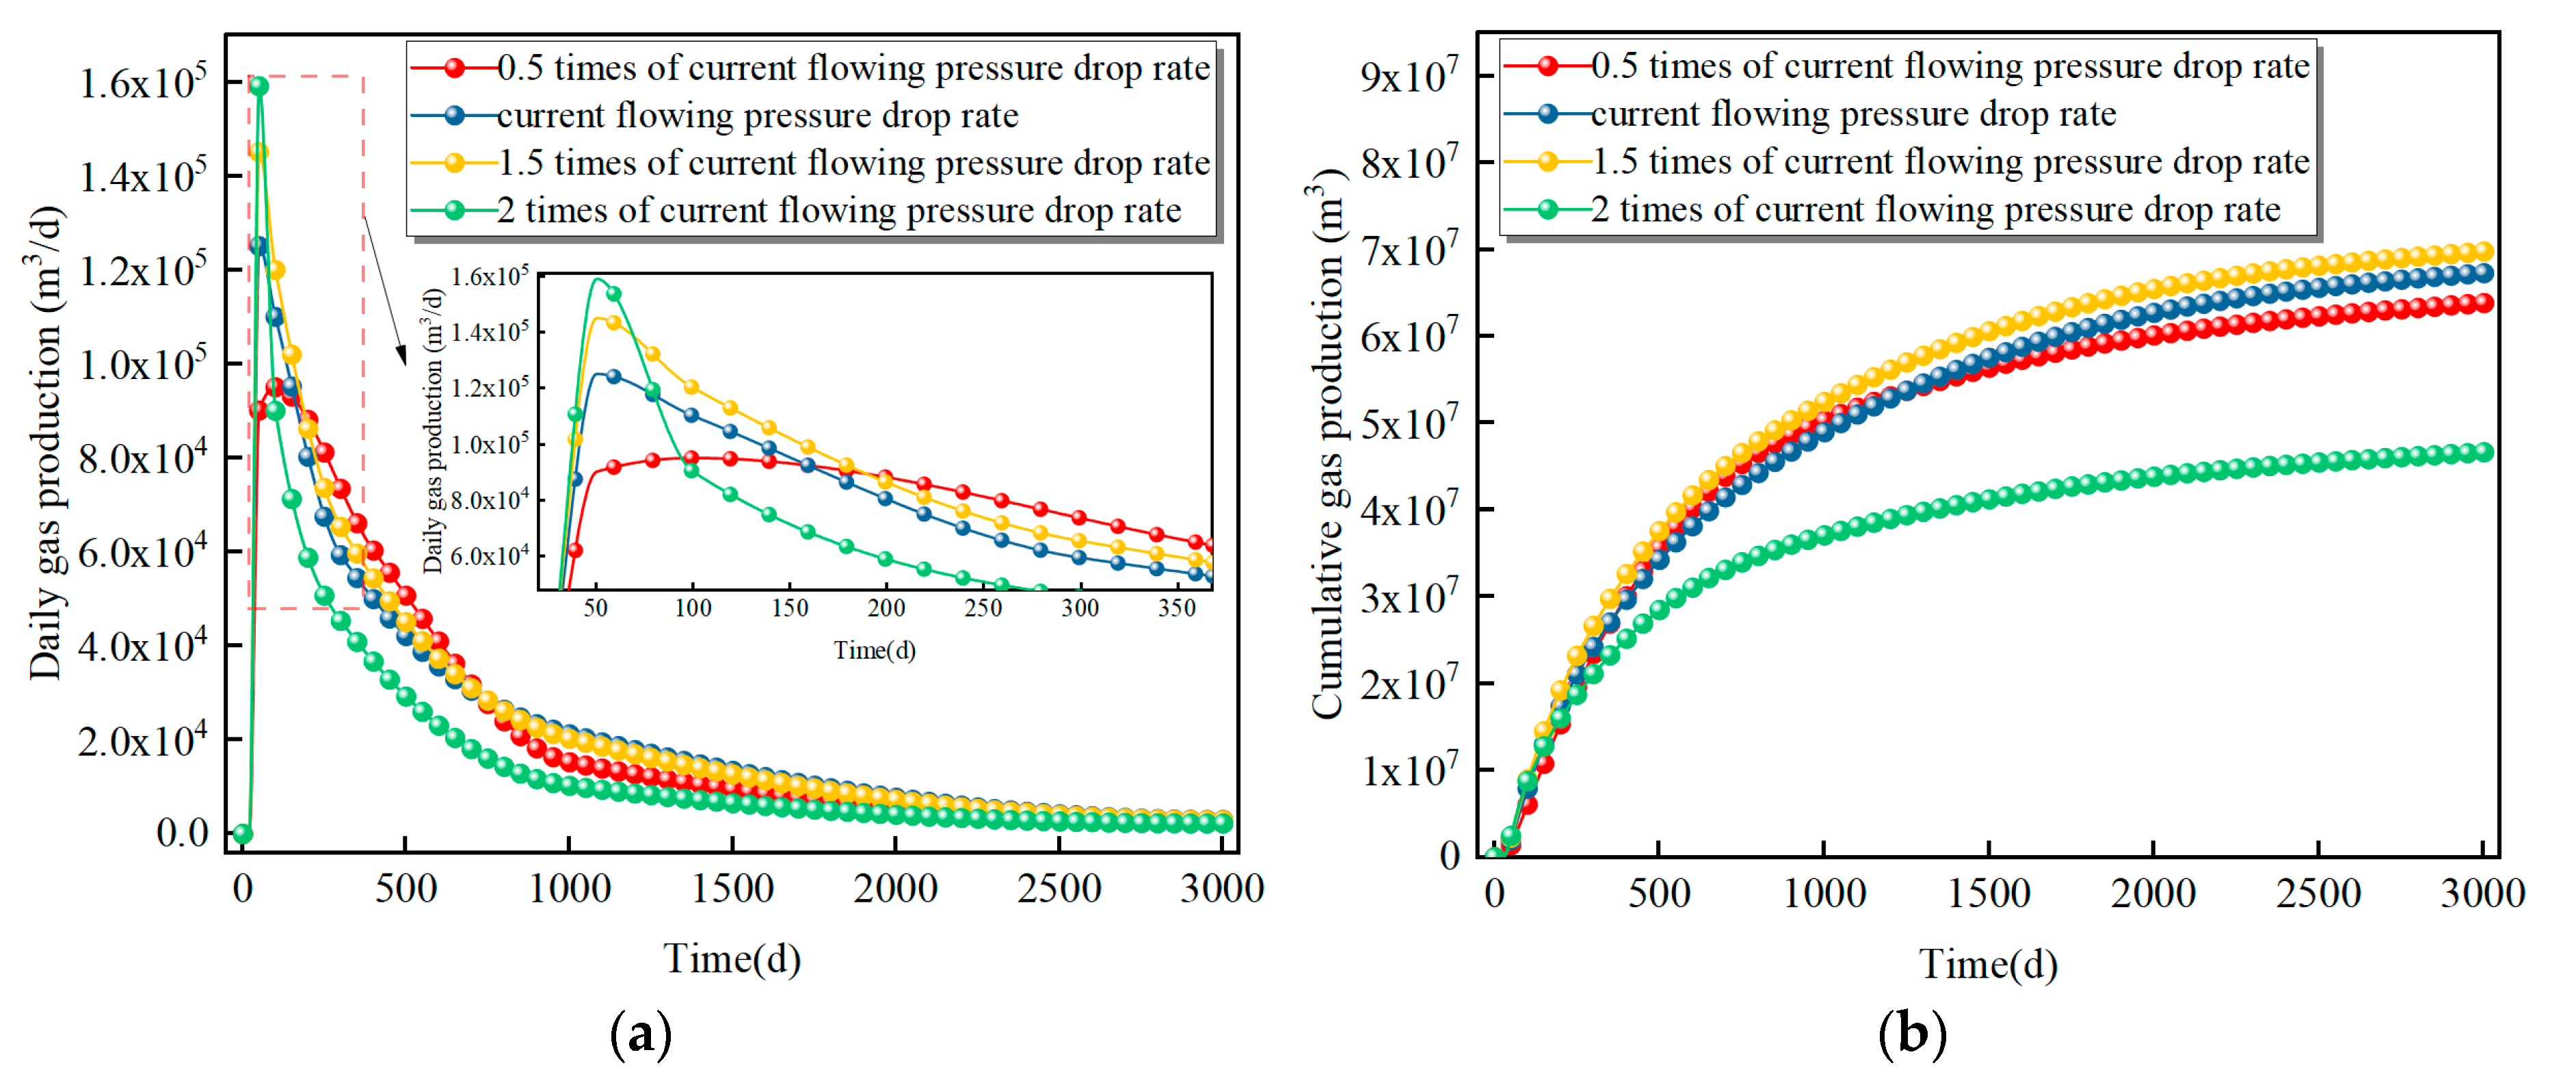
Figure 5 presents the daily and cumulative gas production profiles for Well D1 under four different bottom-hole flowing pressure depletion strategies. As shown in Figure 5a, all scenarios exhibit a consistent trend of an initial increase in daily gas rate followed by a gradual decline, albeit with varying times to peak production. Notably, a larger initial pressure drop leads to an earlier production peak. This trend occurs because a more aggressive drawdown allows the reservoir to reach the critical desorption pressure more quickly during the flowback and ramp-up stages, thereby accelerating gas release.
Simulations comparing different flowing pressure drop rates reveal distinct production outcomes. Using 1.5× and 2× the current rate accelerates early production, increasing the peak daily gas rate by 15.90% and 27.10%, respectively. However, the 2× rate causes a rapid post-peak decline and the lowest stable production, ultimately reducing cumulative production by 30.70% versus the baseline. Conversely, a 0.5× rate extends the stable period but slows the production buildup, resulting in a 5.13% cumulative decrease. The 1.5× rate strikes a balance, achieving a 3.68% increase in cumulative recovery and is therefore identified as the optimal strategy.

5. Discussion

5.1. Impact of Reservoir Pressure on Gas Production Performance

Reservoir pressure is a critical factor in designing and optimizing production strategies for deep CBM, as it directly governs the magnitude, rate, and effectiveness of pressure depletion [34].
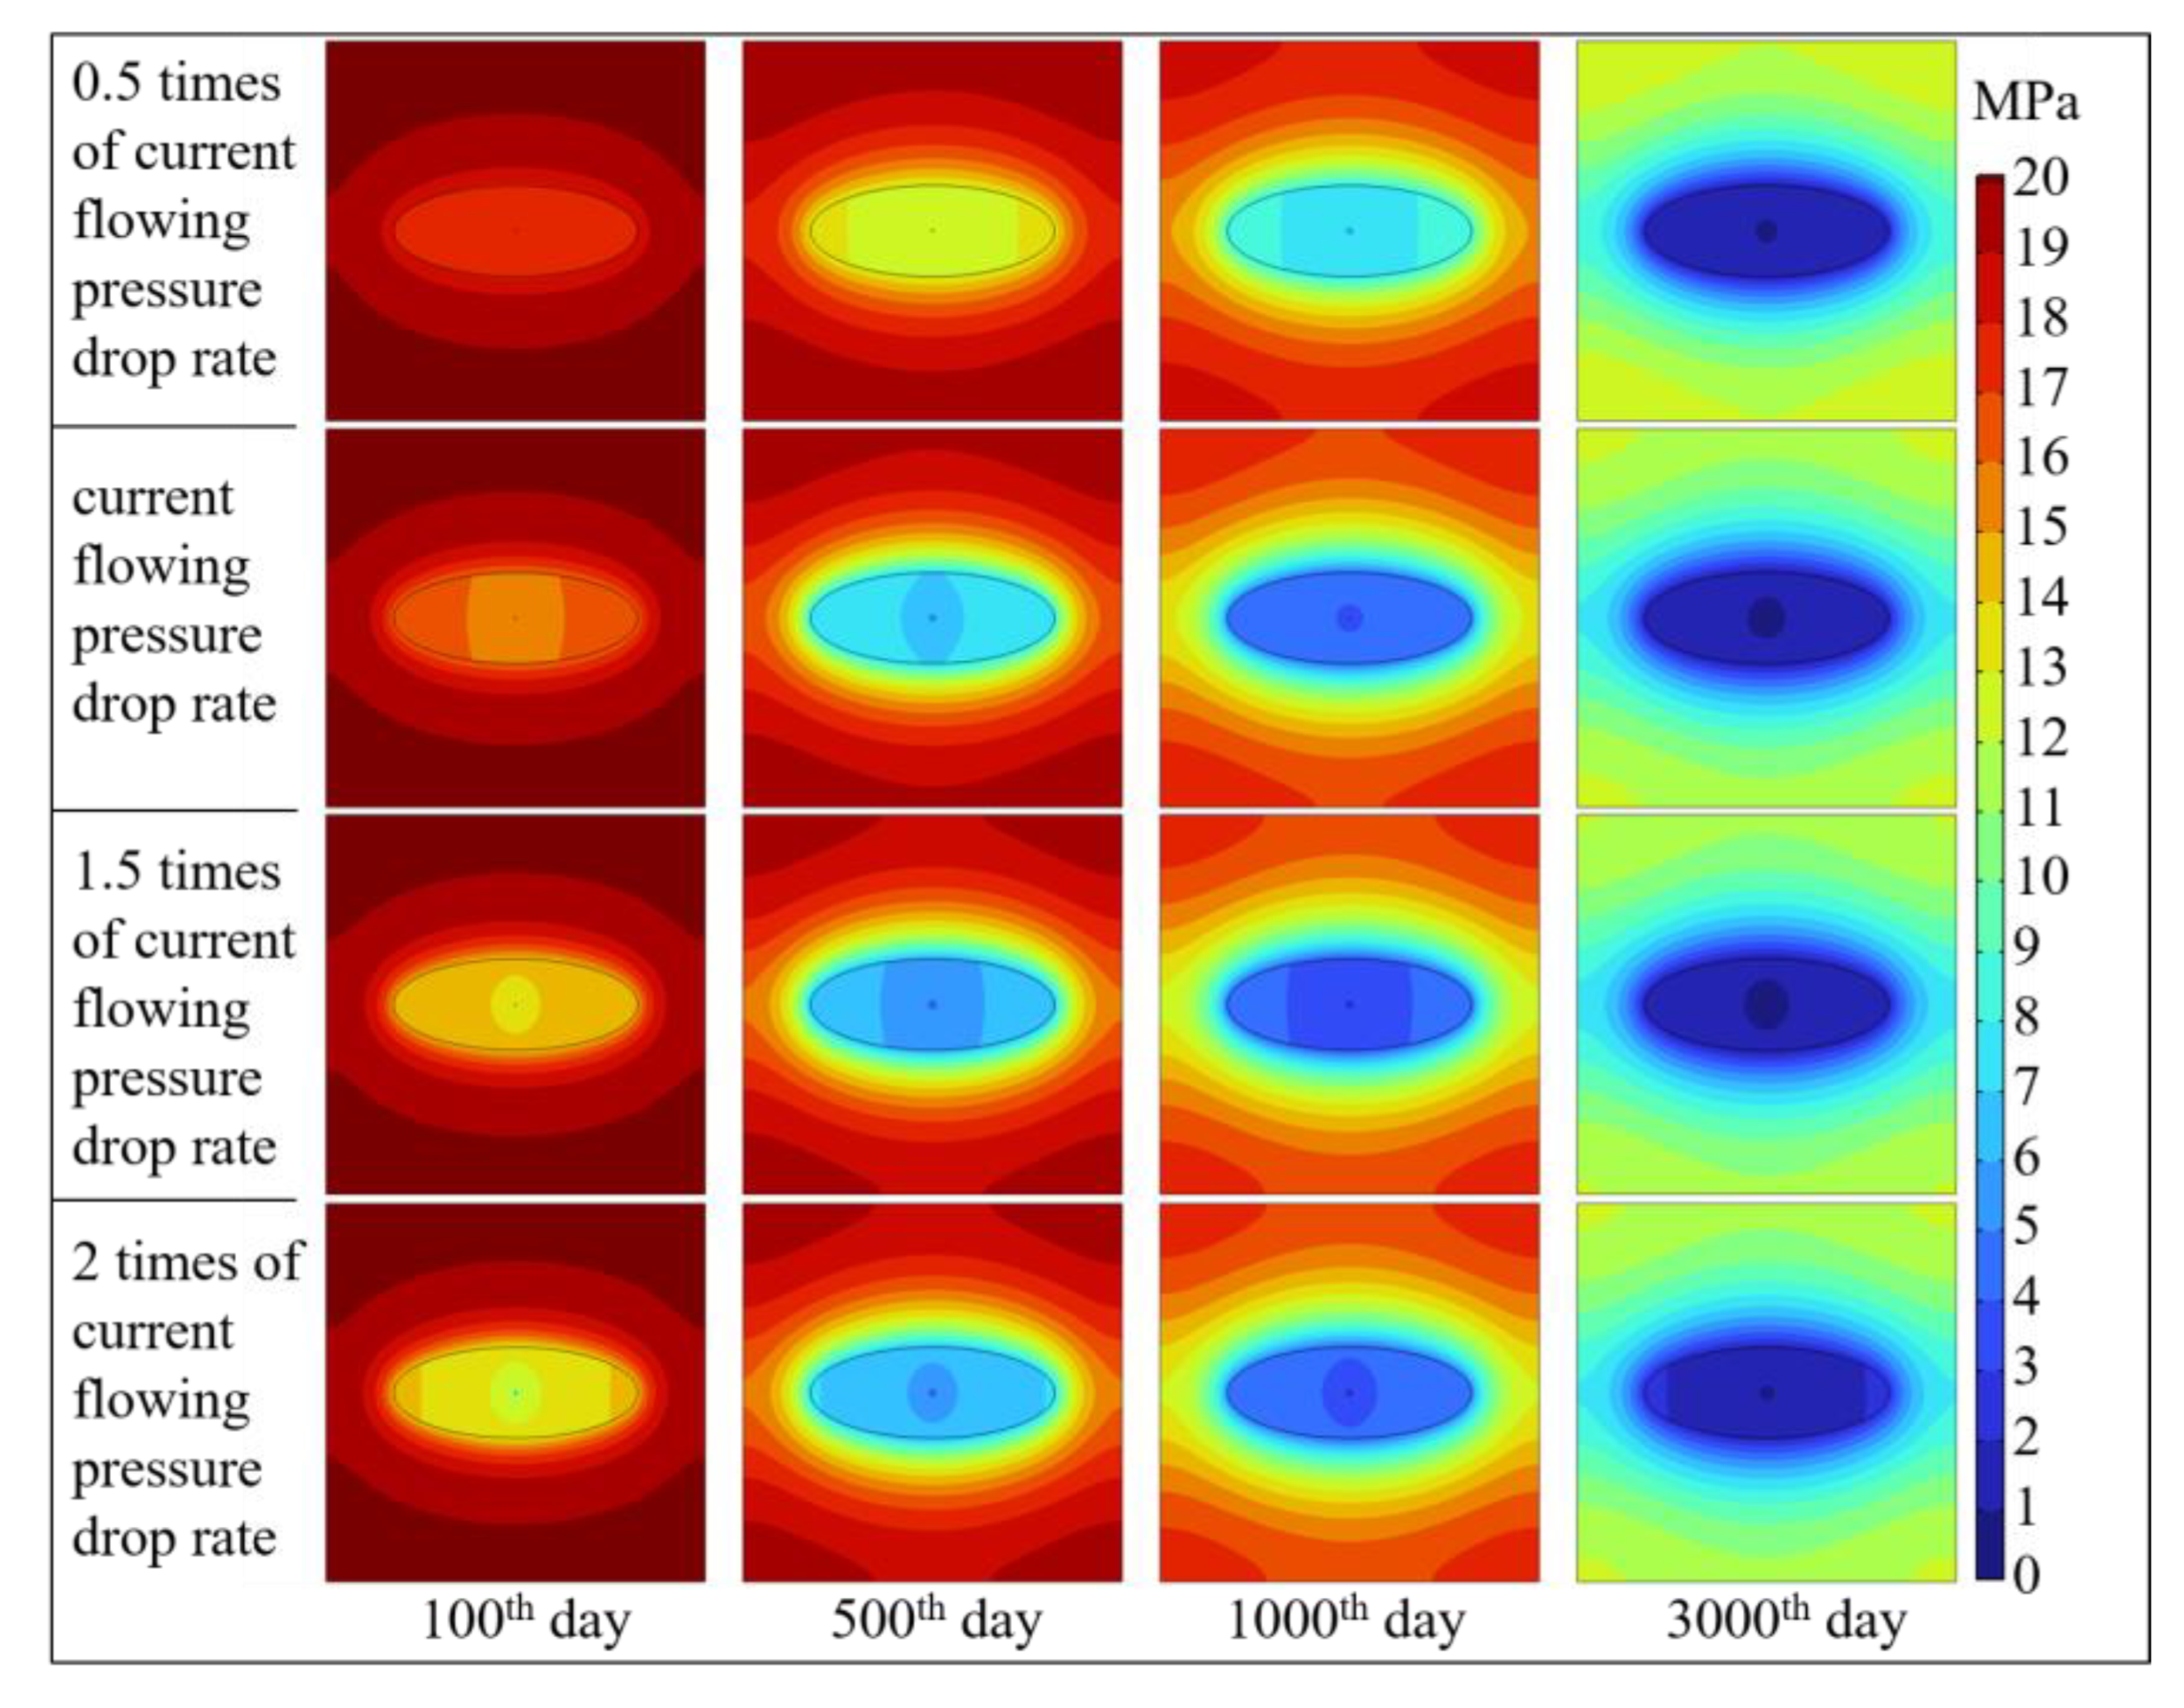
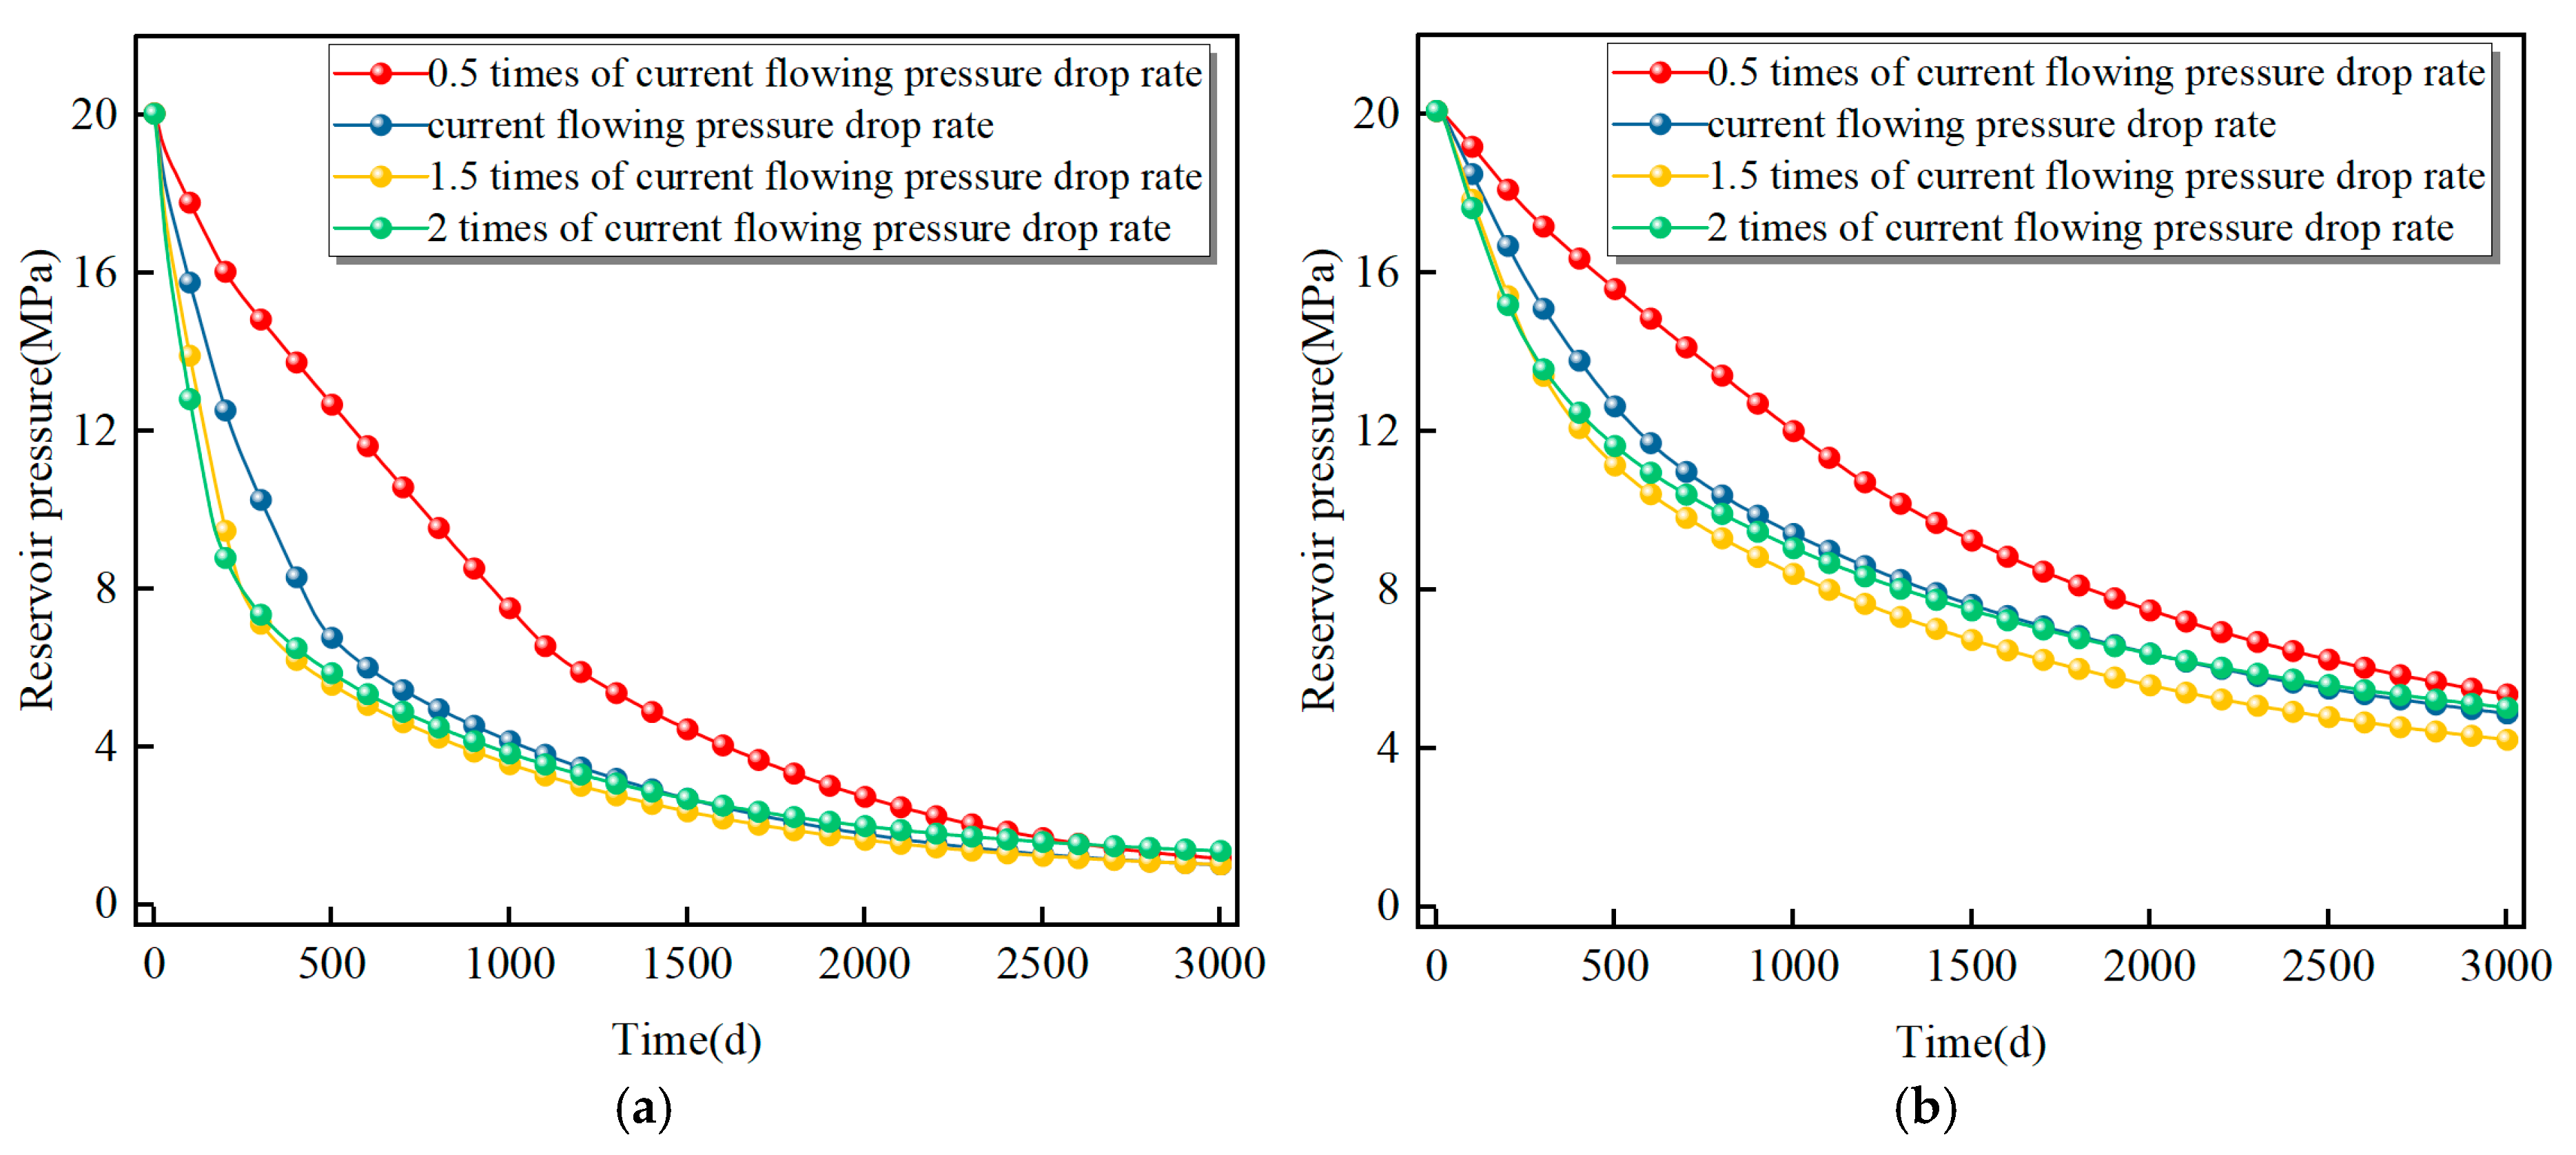
A comparison of pressure distributions under different flowing pressure drop rates reveals that an increased rate accelerates pressure depletion during the flowback and gas production ramp-up stages. Owing to higher permeability in the fractured zone, the pressure decreases significantly in this region, whereas the unstimulated zone shows minimal pressure change (Figure 6). In contrast, during the stable and production decline stages, the magnitude of pressure depletion at twice the current rate gradually becomes smaller than that under other rates (Figure 7).
Simulation results indicate that increasing the flowing pressure drop rate enhances pressure depletion only during the early production stage. In the subsequent stable and decline stages, a further increase in the drop rate does not yield a greater depletion extent.
In summary, a flowing pressure drop rate of 1.5 times the current value achieves the most effective depletion, better facilitates CBM desorption and diffusion, and consequently enhances well productivity.

5.2. Impact of Reservoir Water Saturation on Gas Production Performance

Reservoir water saturation is a critical factor in the production of deep CBM, as its magnitude directly determines whether effective gas phase permeability can be achieved and influences the time required for gas production, thereby affecting overall productivity [35].
A comparison of water saturation distributions under different flowing pressure drop rates reveals that by day 500 of production, increasing the flowing pressure drop rate accelerates the decrease in water saturation. Due to the higher permeability in the fractured zone, water saturation in this region decreases significantly, while little change is observed in the unstimulated zone (Figure 8). Between days 1000 and 3000 of production, water saturation under a flowing pressure drop rate of twice the initial rate gradually exceeds values observed under other drawdown strategies (Figure 8).
Increasing the flowing pressure drop rate effectively reduces water saturation only during the early production stage, with its efficacy diminishing in later phases. This mechanism operates by rapidly expanding the pressure depletion funnel (Figure 7a), which accelerates dewatering and pressure reduction in the near-wellbore region, thereby bringing forward the initial gas production time. However, high water saturation persists in distal areas, potentially inducing a water-blocking effect that impedes gas diffusion.
In summary, a flowing pressure drop rate of 1.5 times the current rate achieves the most effective reduction in water saturation while avoiding localized water blocking. This approach more effectively supports the outward expansion of reservoir pressure depletion and promotes the desorption and diffusion of CBM.

5.3. Impact of Reservoir Temperature on Gas Production Performance

Reservoir temperature serves as an implicit controlling factor in regulating desorption efficiency and fluid mobility during the extraction of deep CBM [36].
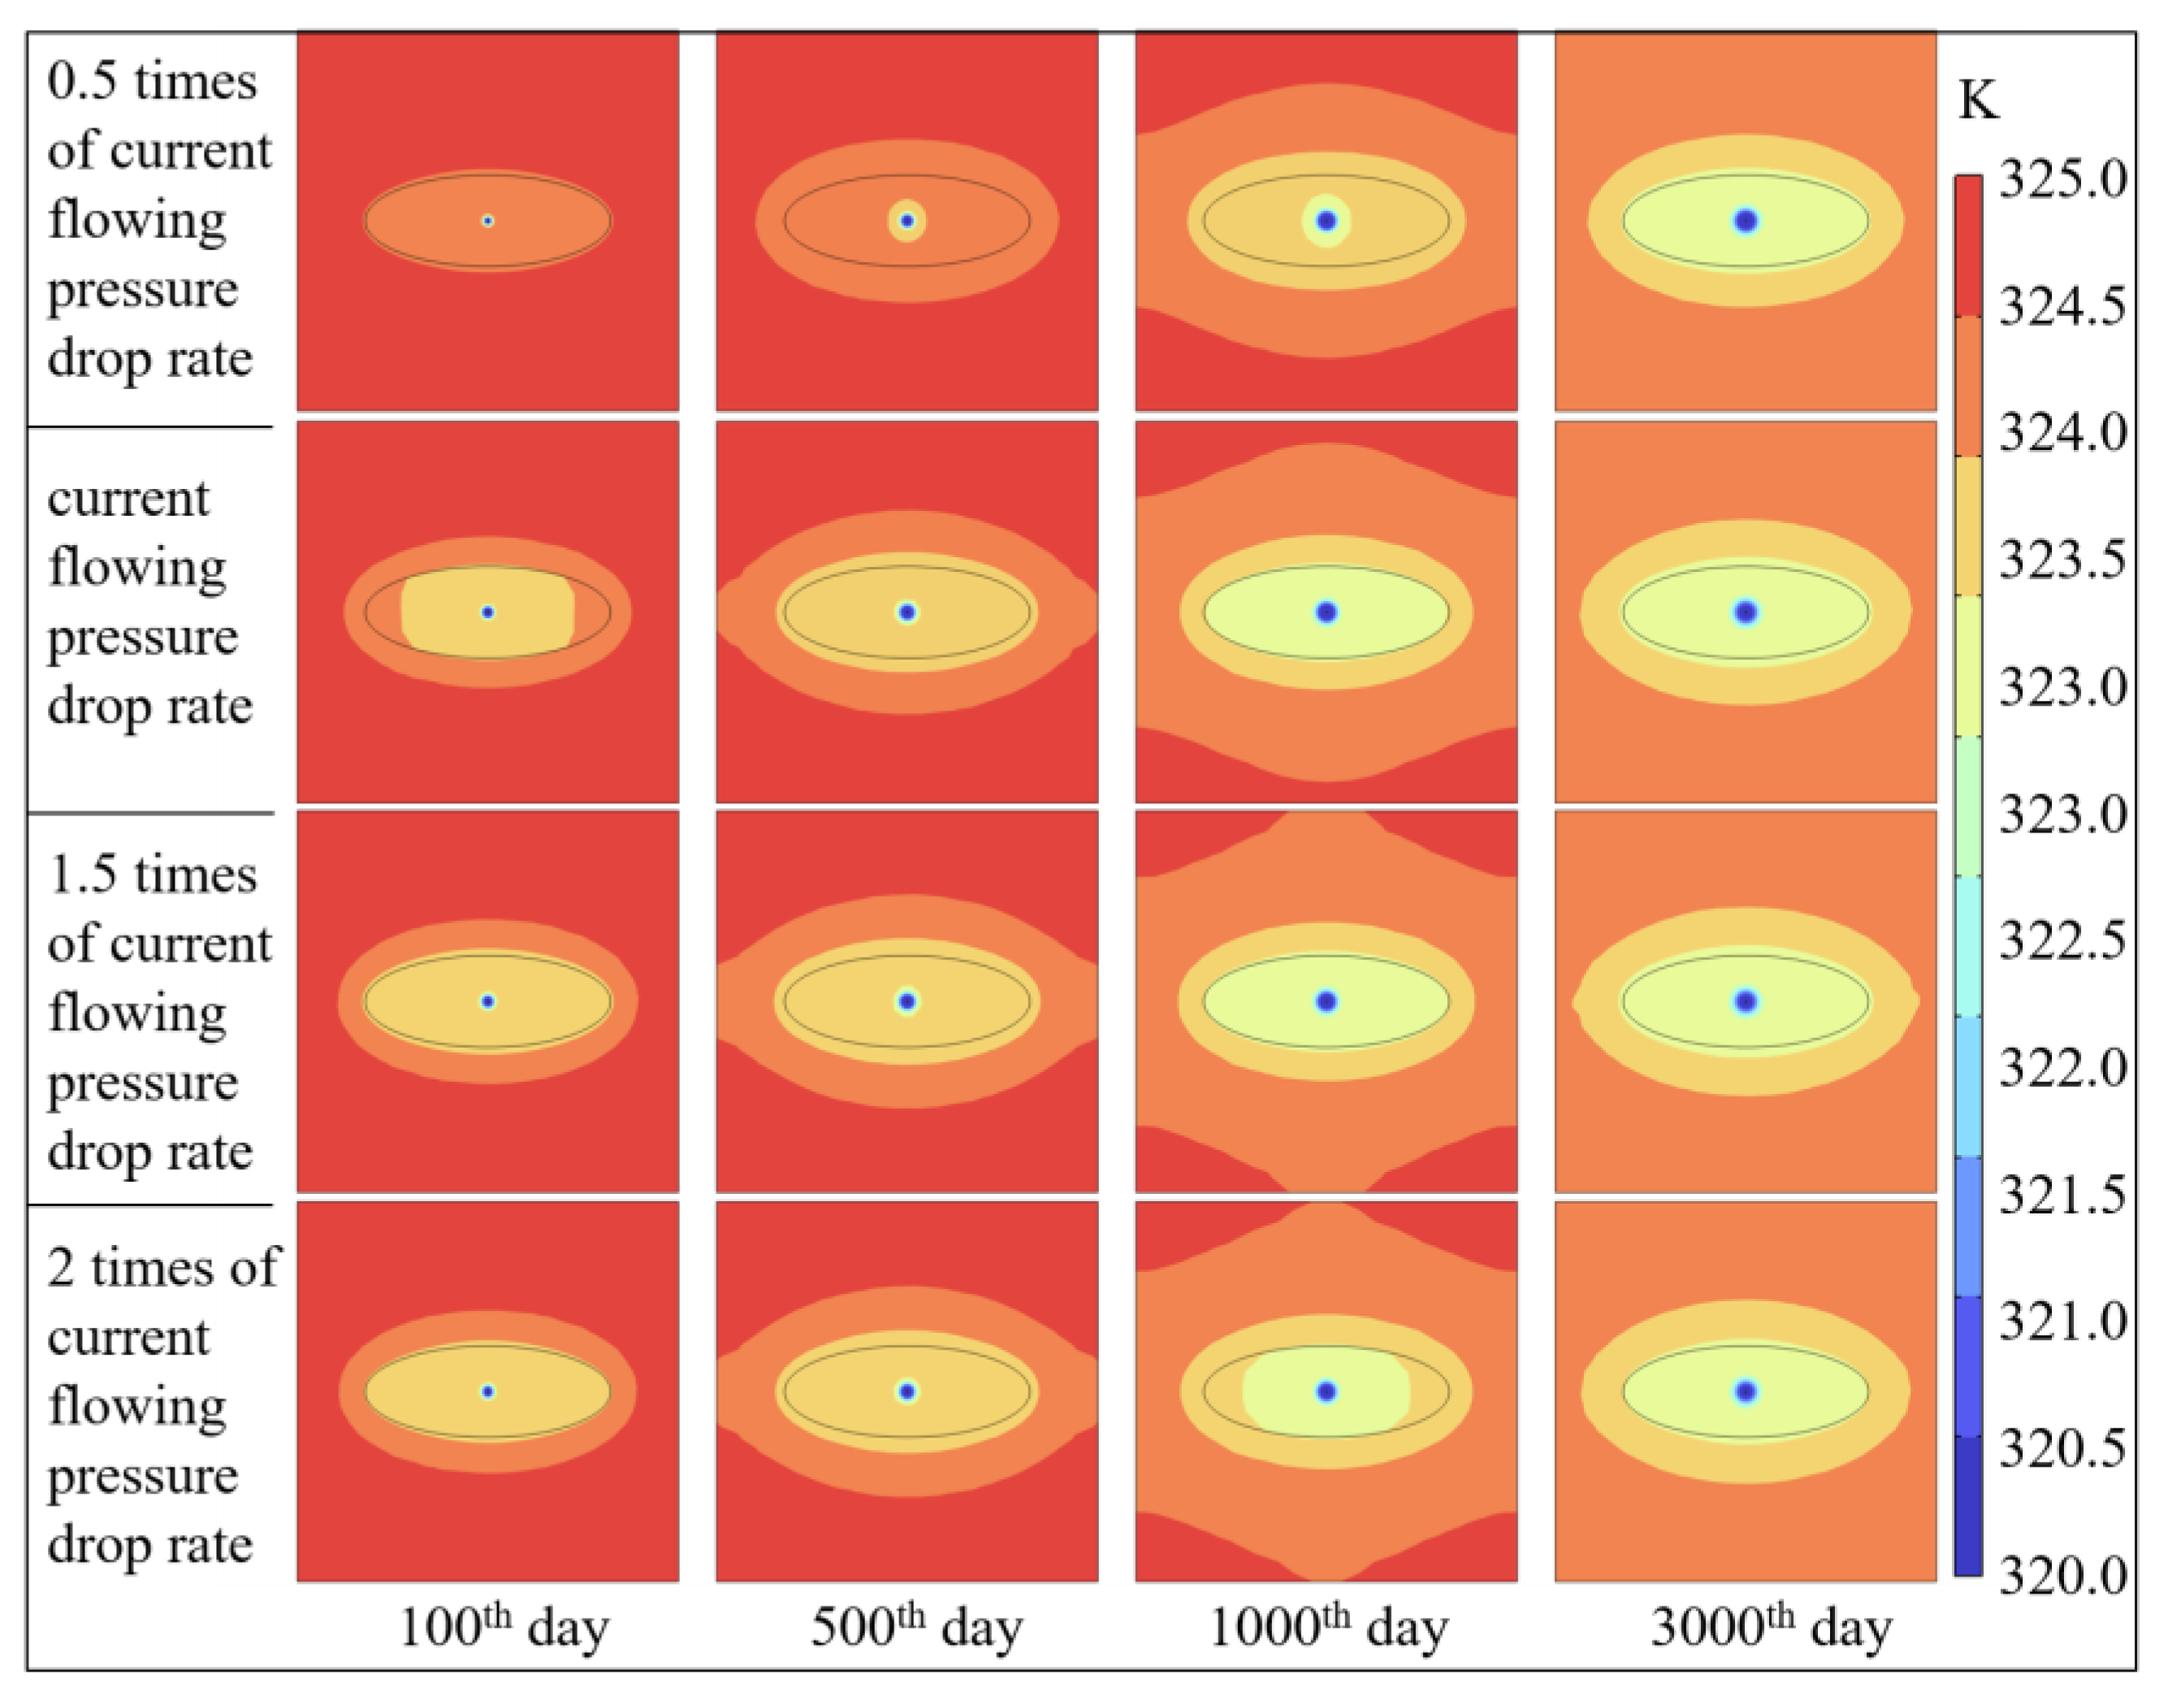
A comparison of reservoir temperature distributions under different drawdown rates reveals a distinct evolutionary pattern. By day 500, a higher rate accelerates cooldown, with a more pronounced effect in the fractured zone. Subsequently, between days 1000 and 2000, the temperature under the 2× rate surpasses that of other cases. Finally, the temperature stabilizes across all scenarios by day 3000 (Figure 9).
The results indicate that a higher flowing pressure drop rate accelerates the cooling of the reservoir, which in turn inhibits the desorption and diffusion of CBM. However, the decrease in reservoir temperature helps reduce the critical desorption pressure, thereby promoting overall pressure depletion in the coal reservoir.
Overall, at a flowing pressure drop rate of 1.5 times the current rate, a stable decrease in reservoir temperature is achieved while facilitating the outward expansion of pressure depletion, ultimately enhancing the desorption and diffusion of CBM.

5.4. Impact of Desorption-Diffusion on Gas Production Performance in Deep CBM Reservoirs

As a key mechanism for resource mobilization during deep CBM production, the production strategy plays a critical role in regulating the transformation of methane from adsorbed to free state [37].
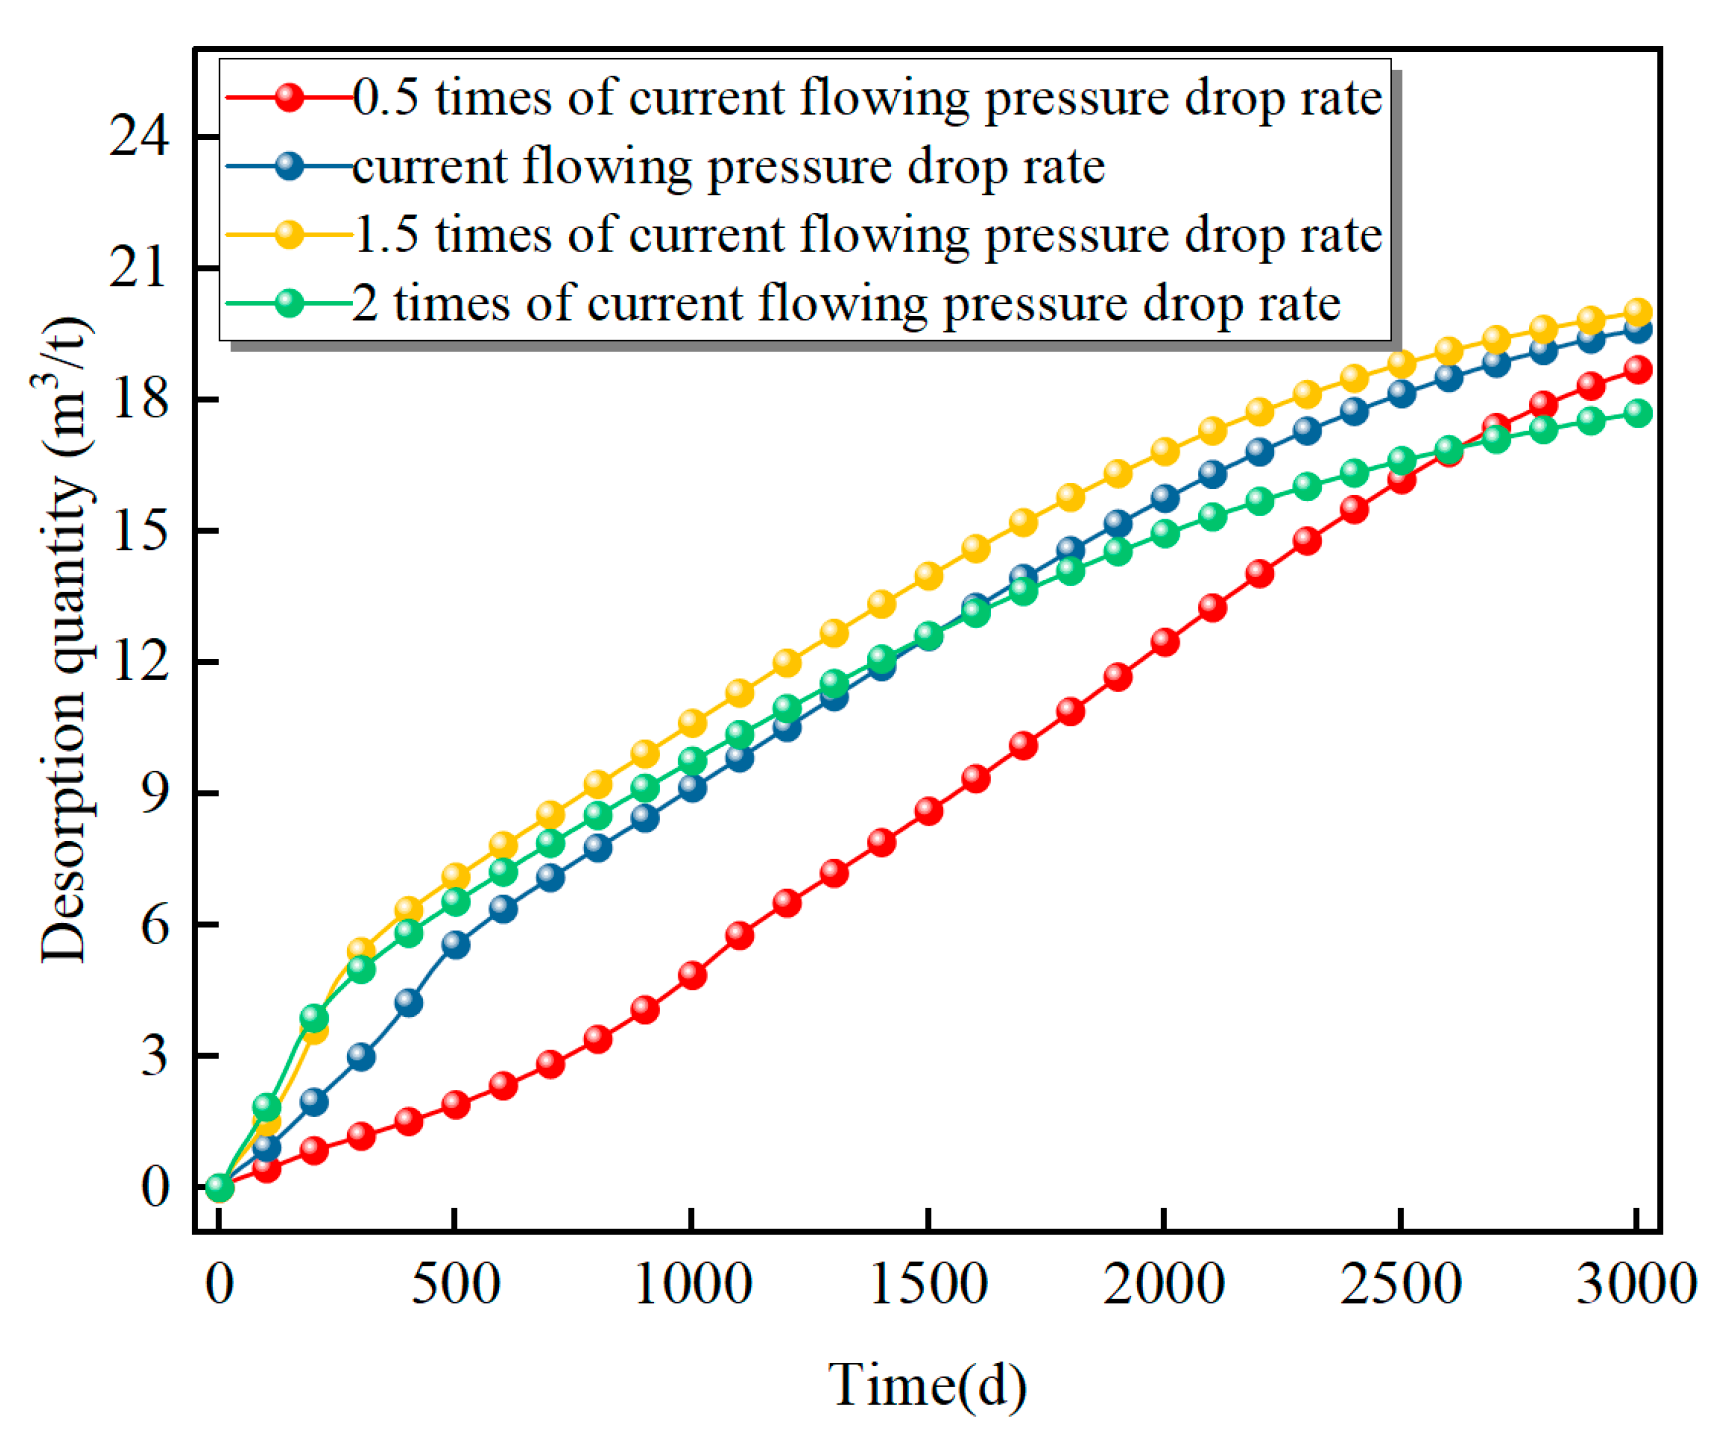
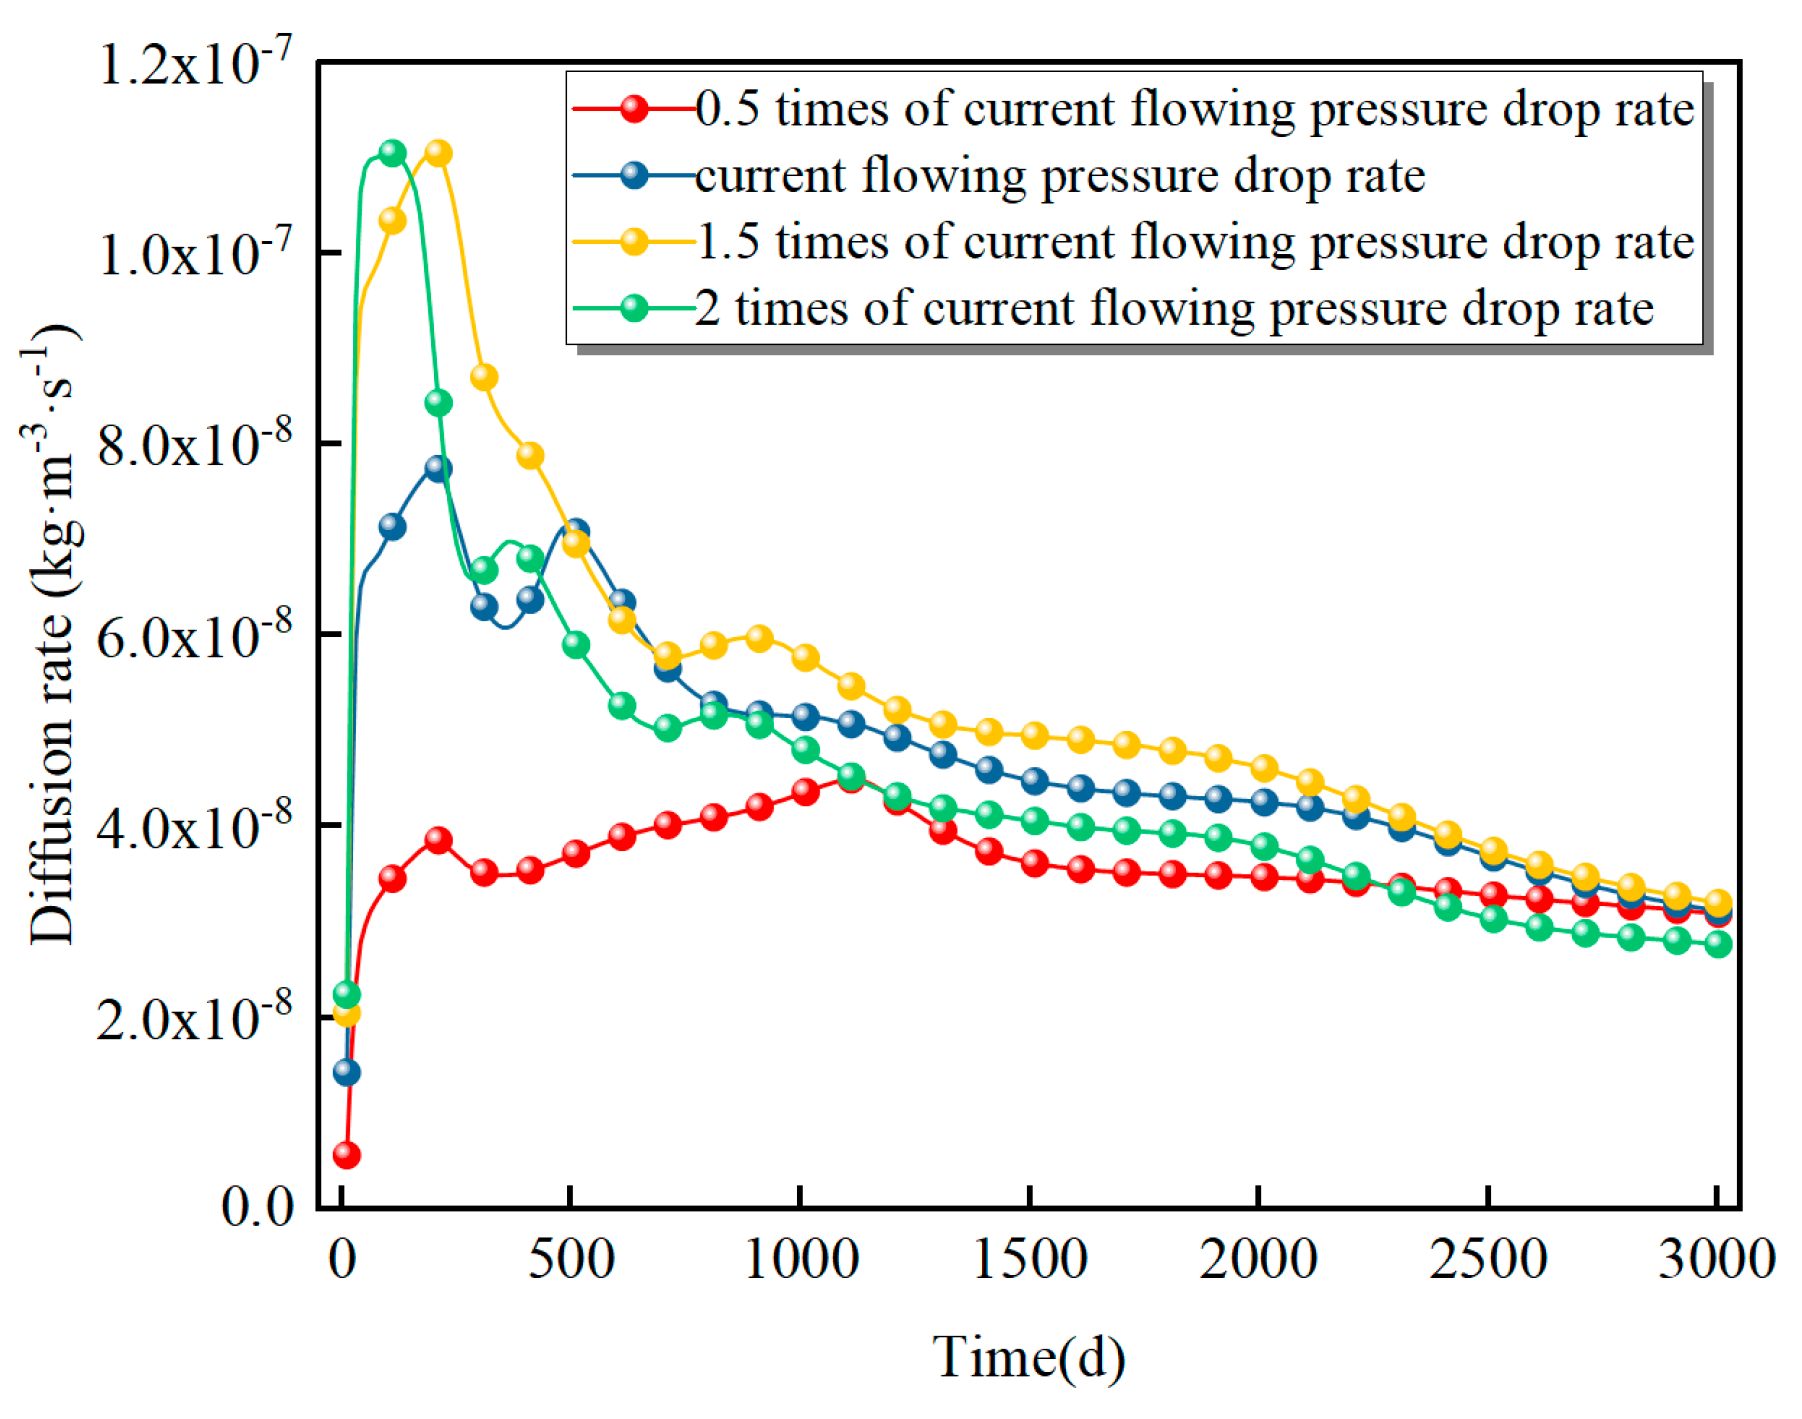
Comparative analysis of desorption and diffusion characteristics under different flowing pressure drop rates reveals that increasing the flowing pressure drop rate enhances both the volume of desorbed gas and the peak diffusion rate. Specifically, relative to the current flowing pressure drop rate, a reduction to 0.5 times the current rate results in a 4.7% decrease in desorption volume and a 46.8% decrease in peak diffusion rate; at 1.5 times the current rate, desorption volume increases by 1.9% and peak diffusion rate rises by 39.2%(Figure 10); while at 2 times the current rate, desorption volume declines by 9.7%, yet the peak diffusion rate still increases by 39.4% (Figure 11). These findings demonstrate that a flowing pressure drop rate set at 1.5 times the current value most effectively accelerates desorption and diffusion processes, thereby maximizing gas production from CBM wells.

5.5. Impact of Reservoir Permeability on Gas Production Performance

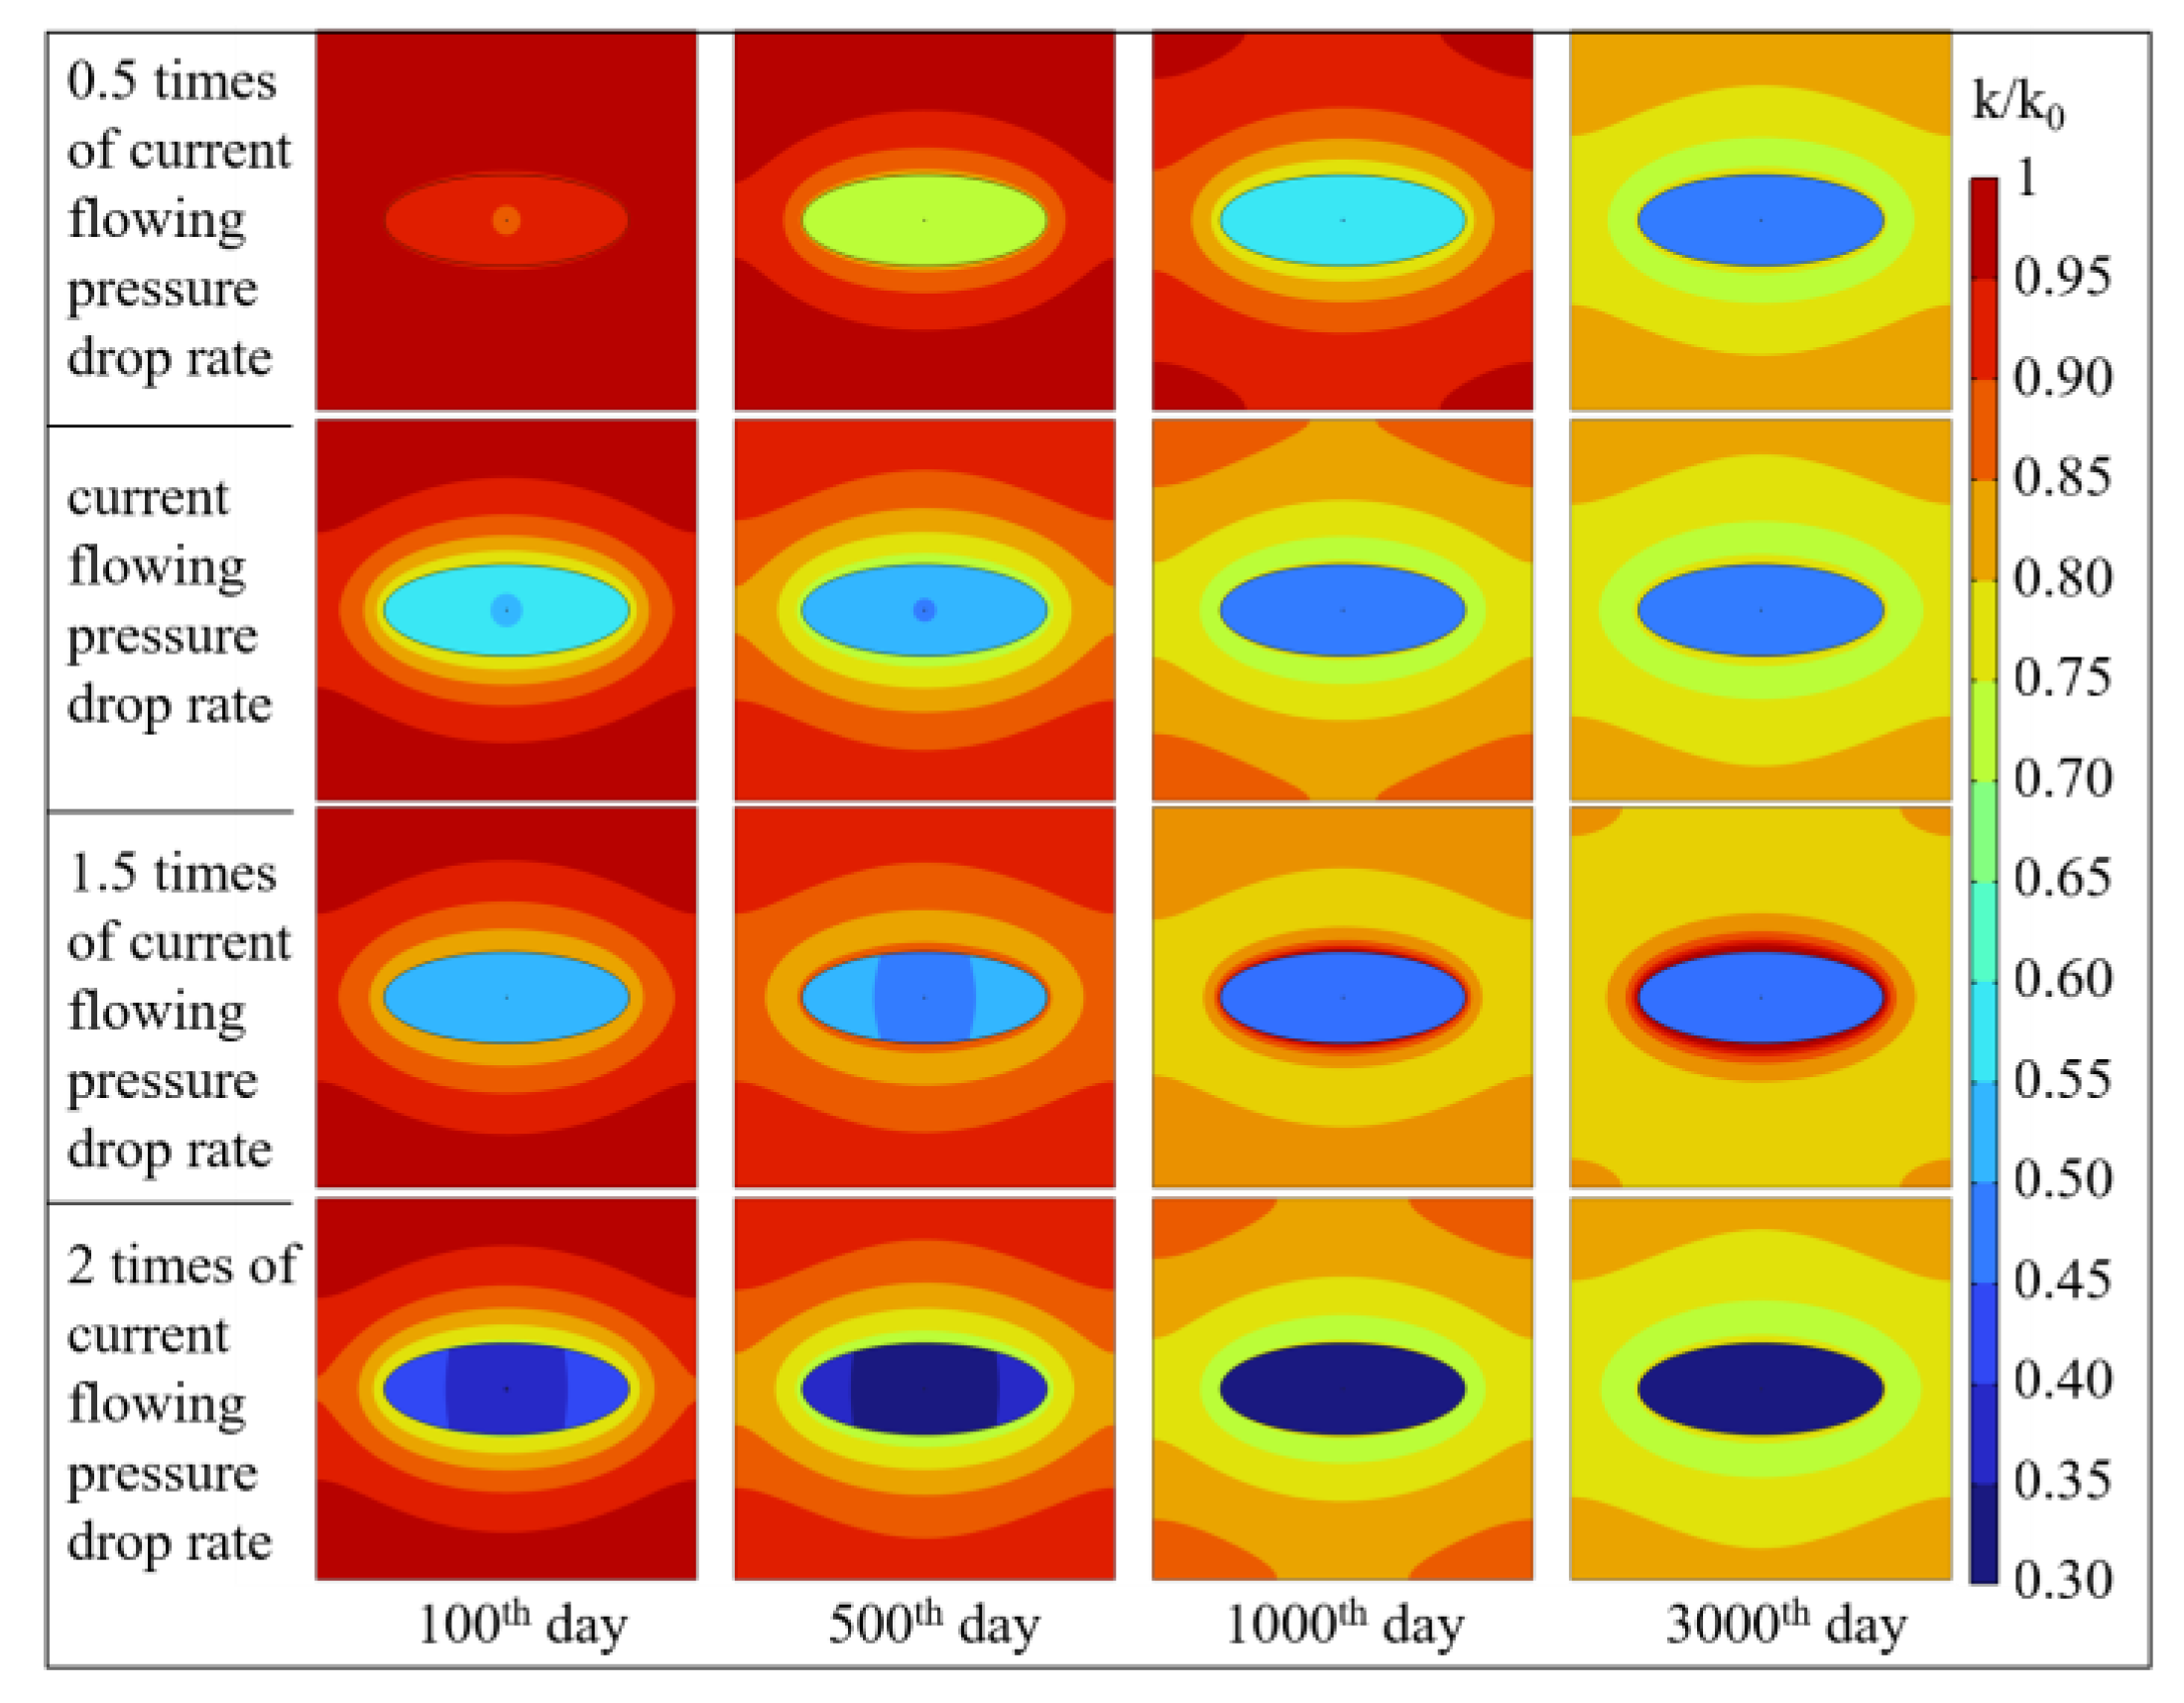
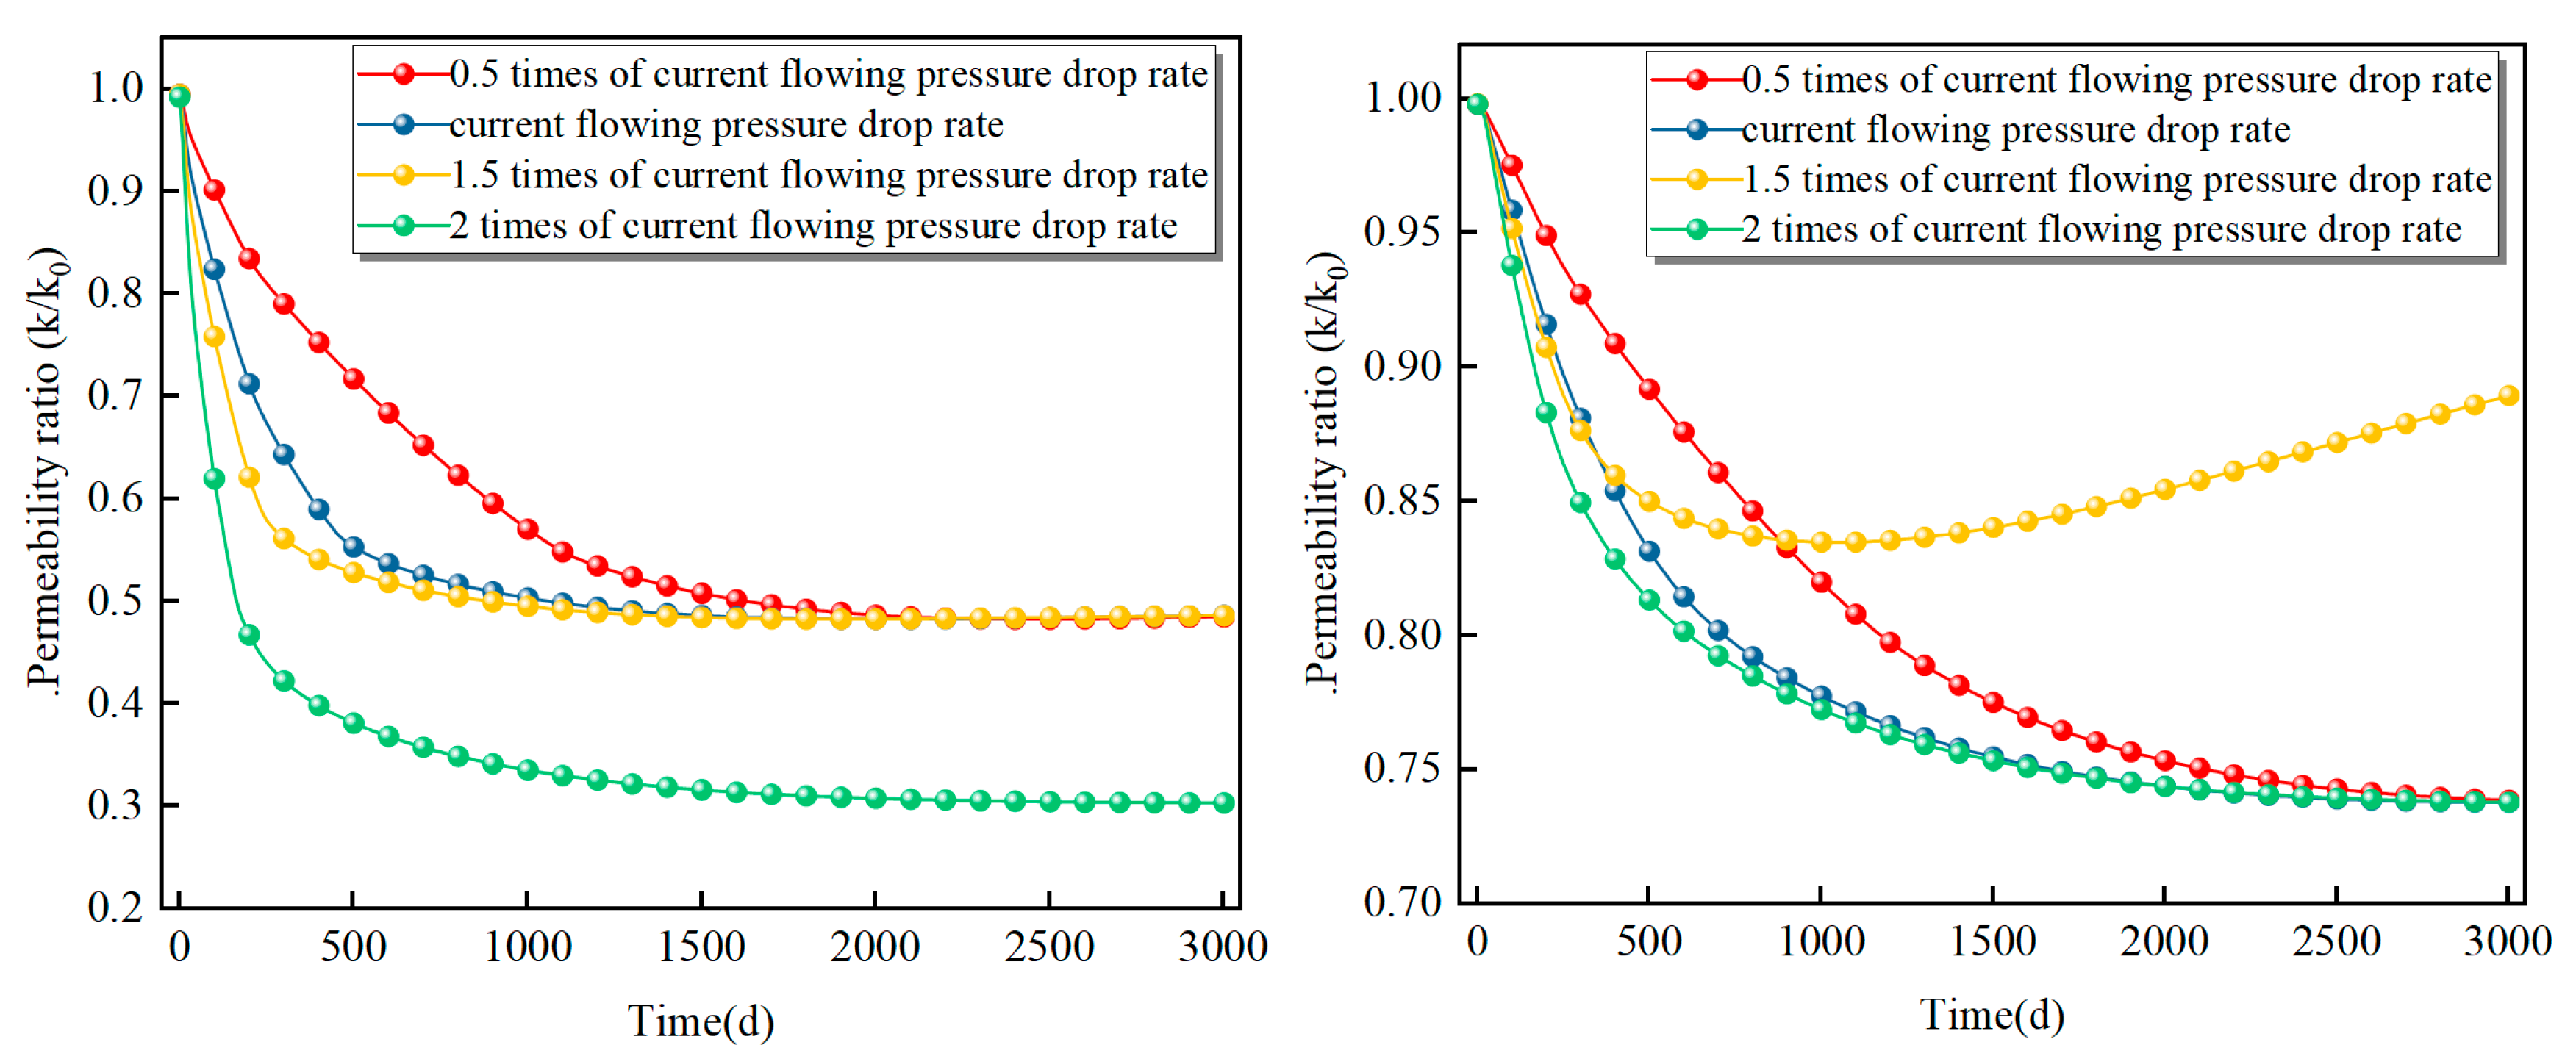
Comparison of coal reservoir permeability under different flowing pressure drop rates reveals that the most significant decrease occurs within the stimulated (fractured) zone, with a maximum reduction of 69.6%, whereas the maximum reduction in the unstimulated zone is 26.2% (Figure 12). Specifically, within the first 1500 days of production, the permeability decline in the stimulated zone intensifies with increasing flowing pressure drop rates. After 1500 days, the permeability gradually stabilizes. In the unstimulated zone, the permeability reduction also increases with higher flowing pressure drop rates during the initial 400 days. Beyond 400 days, under the current, 0.5×, and 2× flowing pressure drop rates, permeability exhibits a slow decline followed by stabilization. In contrast, under the 1.5× flowing pressure drop rate, permeability rebounds, recovering to 88.9% by the end of the production period (Figure 13).
The primary reason for this behavior is that the stimulated zone experiences rapid and significant pressure depletion during production. Under effective stress, permeability decreases quickly, and higher flowing pressure drop rates exacerbate reservoir damage, leading to further permeability impairment. Conversely, the unstimulated zone undergoes slower and milder pressure depletion. Appropriately increasing the flowing pressure drop rate helps enhance pressure depletion in this zone, promoting gas desorption and diffusion, strengthening coal matrix shrinkage, and ultimately improving reservoir permeability.
In summary, adopting a flowing pressure drop rate of 1.5 times the current value maximizes the recovery of coal reservoir permeability and enhances gas production in CBM wells.

5.6. Limitations and Future Work

Although this study was conducted under the specific conditions of the Daning–Jixian Block, the integrated workflow and numerical modelling methodology developed are transferable to other CBM reservoirs. It must be emphasized, however, that the quantitative results reported here (e.g., the optimal dewatering rate) reflect only the geological and engineering setting of our study area. Extrapolation of these findings to another field is contingent on the degree of similarity in the following key reservoir attributes: (1) reservoir pressure, (2) permeability and porosity, (3) reservoir temperature, and (4) fracturing scale. We therefore recommend that operators first calibrate the model with core and well-test data from their target area before applying the framework, so that field-specific development strategies can be derived. Furthermore, we note that the safety issues associated with CBM development cannot be overlooked. Subsequent research will also explore the impact of CBM development on surface safety [38,39].

6. Conclusions

(1)
A bottom-hole flowing pressure drop rate of 1.5 times the current value is recommended as optimal. The specific rates are 0.15 MPa/d (dewatering), 0.057 MPa/d (ramp-up), 0.035 MPa/d (stable production), and 0.01 MPa/d (decline). This strategy accelerates the early-stage pressure drop, bringing forward the gas production peak and increasing the peak daily rate by 15.90%. Crucially, it also avoids the sharp production decline associated with higher drawdown rates (e.g., 2×), leading to a 3.68% increase in cumulative production over the lifecycle. Lower rates offer insignificant gains, while higher rates risk reservoir damage.
(2)
Increasing the bottom-hole pressure drop rate to 1.5–2 times the reference value shortens the dewatering and ramp-up stages by rapidly lowering the reservoir pressure to the critical desorption point. The 1.5× rate achieves the most effective pressure depletion, optimally facilitating gas desorption and diffusion and thereby enhancing productivity. While a higher drawdown rate accelerates pressure decline in the stimulated zone during early stages, it has limited effect on the non-stimulated region. Conversely, an excessively high rate (e.g., 2×) results in a smaller pressure decrease during the stable and decline stages compared to other stages.
(3)
Employing a drawdown rate 1.5 times the current value achieves synergistic optimization of water saturation, temperature, and gas transport. This approach accelerates early stage drainage in fractures, shortening the time to initial gas production, while avoiding the water-blocking effect induced by excessive drawdown (e.g., 2×). Consequently, it increases the desorbed gas volume by 1.9% and elevates the peak diffusion rate by 39.2%. By ensuring balanced depletion and mitigating water-blocking and thermal fluctuations, the method maximizes desorption-diffusion efficiency. Furthermore, it promotes matrix shrinkage, leading to a permeability rebound of up to 88.9% and preventing the stress-induced damage associated with higher drawdown rates.

Author Contributions

Conceptualization, S.W. and S.L.; Data curation, Y.L. (Yonglong Li), W.W., and W.L.; Formal analysis, S.L. and W.W.; Investigation, S.Z., L.Z. and Y.L. (Yonglong Li); Methodology, Y.L. (Yan Liang); Project administration, S.W. and S.L.; Resources, S.W. and Y.L. (Yan Liang); Writing—original draft, W.W., X.L., Q.G. and L.Z.; Writing—review and editing, W.L. and Q.G. All authors have read and agreed to the published version of the manuscript.

Funding

This research was funded by the Scientific Research and Technology Development Project of PetroChina Company Limited (2024DJ2303) and the National Natural Science Foundation of China (No. 42030810).

Data Availability Statement

The original contributions presented in this study are included in the article. Further inquiries can be directed to the corresponding authors.

Conflicts of Interest

Sukai Wang, Yonglong Li, Wei Liu, Siyu Zhang, Lipeng Zhang, Yan Liang, Xionghui Liu and Quan Gan were employed by Engineering Technology Research Institute of CNPC Xibu Drilling Engineering Co., Ltd. The remaining author declares that the research was con-ducted in the absence of any commercial or financial relationships that could be construed as a potential conflict of interest.

References

  1. Li, S.; Qin, Y.; Tang, D.; Shen, J.; Wang, J.; Chen, S. A comprehensive review of deep coalbed methane and recent developments in China. Int. J. Coal Geol. 2023, 279, 104369. [Google Scholar] [CrossRef]
  2. Yang, X.; Xu, F.; Wang, H.; Li, S.; Lin, W.; Wang, W.; Hao, S. Exploration and development process of coalbed methane in eastern margin of Ordos Basin and its enlightenment. Coal Geol. Explor. 2022, 50, 30–41. [Google Scholar]
  3. Chen, S.; Tang, D.; Hou, W.; Li, Y.; Tao, S.; Xu, H.; Zhang, B. Geological particularity and reservoir engineering response of deep coalbed methane. Acta Pet. Sin. 2023, 44, 1993. [Google Scholar]
  4. Zhu, G.; Ji, H.; Mi, H.; Zhang, Y.; Sun, Q.; Zhao, W.; Zhu, X.; Kang, L.; Wang, Y. Discovery of a large gas field of deep coalbed methane in the Shenfu block and its implications. Coal Geol. Explor. 2024, 52, 12–21. [Google Scholar]
  5. Liu, J.; Zhu, G.; Liu, Y.; Chao, W.; Du, J.; Yang, Q.; Mi, H.; Zhang, S. Breakthrough, future challenges and countermeasures of deep coalbed methane in the eastern margin of Ordos Basin: A case study of Linxing-Shenfu block. Acta Pet. Sin. 2023, 44, 1827. [Google Scholar]
  6. Geng, M.; Chen, H.; Chen, Y.; Zeng, L.; Chen, S.; Jiang, X. Methods and results of the fourth round national CBM resources evaluation. Coal Sci. Technol. 2018, 46, 64–68. [Google Scholar]
  7. Zhang, S.; Tang, S.; Qian, Z.; Pan, Z.; Guo, Q. Evaluation of geological features for deep coalbed methane reservoirs in the Dacheng Salient, Jizhong Depression, China. Int. J. Coal Geol. 2014, 133, 60–71. [Google Scholar] [CrossRef]
  8. Liu, S.; Fan, K.; Jin, Y. Stress sensitivity characteristics of deep coal reservoirs and its influence on coalbed methane productivity. Coal Geol. Explor. 2022, 50, 56–64. [Google Scholar]
  9. Xie, H.; Sang, S.; Li, X.; Yan, Z.; Liu, S.; Zhou, X.; Han, S. Evolution of pore-fracture and permeability prediction in soft coal rock under variable-pressure water saturation. Phys. Fluids 2025, 37, 076646. [Google Scholar] [CrossRef]
  10. Zhang, X.; Lai, F.; Meng, Y.; Xu, X.; Li, H.; Liu, K. Dynamic production characteristics of deep coalbed methane: A case study of Daning-Jixian Block. Energy Fuels 2024, 38, 8700–8711. [Google Scholar] [CrossRef]
  11. Nie, Z.; Shi, X.; Sun, W.; Yan, X.; Huang, H.; Liu, Y.; Feng, Y. Production characteristics of deep coalbed methane gas reservoirs in Daning-Jixian block and its development technology countermeasures. Coal Geol. Explor. 2022, 50, 193–200. [Google Scholar]
  12. Li, S.; Tang, D.; Pan, Z.; Xu, H.; Tao, S.; Liu, Y.; Ren, P. Geological conditions of deep coalbed methane in the eastern margin of the Ordos Basin, China: Implications for coalbed methane development. J. Nat. Gas Sci. Eng. 2018, 53, 394–402. [Google Scholar] [CrossRef]
  13. Zhao, J.; Tang, D.; Xu, H.; Lv, Y.; Tao, S. High production indexes and the key factors in coalbed methane production: A case in the Hancheng block, southeastern Ordos Basin, China. J. Pet. Sci. Eng. 2015, 130, 55–67. [Google Scholar] [CrossRef]
  14. Wang, X.; Shi, J.; Hao, P.; Wang, Y.; Cao, J.; Wang, T.; Fan, Q.; Zhang, Y. Optimal design of rational drainage schedule for deep coalbed methane wells: Taking the Shenfu Block in eastern Ordos Basin as an example. Geol. Explor. 2024, 60, 0850–0862. [Google Scholar]
  15. Chen, M.; Wang, D.; Yu, L.; Sun, J.; Feng, X.; Zhang, K.; Gu, X.; Wang, L.; Yin, Z.; Zhang, H. Drainage system research and application of deep coalbedmethane gas reservoirs in Daning-Jixian block. J. China Coal Soc. 2025, 50, 2188–2197. [Google Scholar]
  16. Li, S.; Fan, C.; Han, J.; Luo, M.; Yang, Z.; Bi, H. A fully coupled thermal-hydraulic-mechanical model with two-phase flow for coalbed methane extraction. J. Nat. Gas Sci. Eng. 2016, 33, 324–336. [Google Scholar] [CrossRef]
  17. Zhang, N.; Luo, Z.; Chen, Z.; Liu, F.; Liu, P.; Chen, W.; Zhao, L. Thermal–hydraulic–mechanical–chemical coupled processes and their numerical simulation: A comprehensive review. Acta Geotech. 2023, 18, 6253–6274. [Google Scholar] [CrossRef]
  18. Ma, Q.; Li, H.; Ji, K.; Huang, F. Thermal-hydraulic-mechanical coupling simulation of CO2 enhanced coalbed methane recovery with regards to Low-Rank but relatively shallow coal seams. Appl. Sci. 2023, 13, 2592. [Google Scholar] [CrossRef]
  19. Teng, T.; Zhao, Y.; Gao, F.; Wang, J.G.; Wang, W. A fully coupled thermo-hydro-mechanical model for heat and gas transfer in thermal stimulation enhanced coal seam gas recovery. Int. J. Heat Mass Transf. 2018, 125, 866–875. [Google Scholar] [CrossRef]
  20. Ma, T.; Liu, J.; Fu, J.; Qiu, Y.; Fan, X.; Martyushev, D.A. Fully coupled thermo-hydro-mechanical model for wellbore stability analysis in deep gas-bearing unsaturated formations based on thermodynamics. Rock Mech. Rock Eng. 2025, 58, 33–64. [Google Scholar] [CrossRef]
  21. Shang, X.; Zhang, Z.; Yang, W.; Wang, J.G.; Zhai, C. A thermal-hydraulic-gas-mechanical coupling model on permeability enhancement in heterogeneous shale volume fracturing. Mathematics 2022, 10, 3473. [Google Scholar] [CrossRef]
  22. Su, E.; Wei, J.; Chen, H.; Chen, X.; Liang, Y.; Zou, Q.; Zhu, X. Effect of CO2 injection on coalbed permeability based on a thermal–hydraulic–mechanical coupling model. Energy Fuels 2024, 38, 11078–11092. [Google Scholar] [CrossRef]
  23. Fang, T.; Feng, Q.; Zhou, R.; Guo, C.; Wang, S.; Gao, K. A coupled thermal–hydrological–mechanical model for geothermal energy extraction in fractured reservoirs. J. Pet. Explor. Prod. Technol. 2023, 13, 2315–2327. [Google Scholar] [CrossRef]
  24. Rene, N.N.; Liang, W.; Ali, A.; Butt, I.A.; Hussain, S. Modeling of thermo-hydro-mechanical coupling in coalbed seam seepage based on impact factor framework. Phys. Fluids 2025, 37, 055114. [Google Scholar] [CrossRef]
  25. Fan, C.; Yang, L.; Xiao, B.; Zhou, L.; Wen, H.; Sun, H. Reasonable start time of carbon dioxide injection in enhanced coalbed methane recovery involving thermal-hydraulic-mechanical couplings. Front. Earth Sci. 2023, 17, 832–843. [Google Scholar] [CrossRef]
  26. Fang, H.; Yu, S.; Zhang, S.; Sang, S.; Guo, J.; Wang, Z.; Wang, X. Coupling mechanism of THMC fields in crushed soft coal with low permeability after CO2 injection and its application in CO2-ECBM technology. Energy Fuels 2024, 38, 6891–6911. [Google Scholar] [CrossRef]
  27. Wan, J.; Li, Z.; Gao, T.; Xu, Z.; Yan, Z.; Gao, Y. Numerical study on the effect of injection pressure on hot flue gas induced coal deformation and enhanced coalbed methane recovery. Energy 2025, 335, 137985. [Google Scholar] [CrossRef]
  28. Liu, T.; Wang, J.; Lin, B.; Wang, X.; Xu, J. Research on multi-parameter collaborative control method for enhancing coalbed methane recovery by hot flue gas displacement. Phys. Fluids 2025, 37, 056615. [Google Scholar] [CrossRef]
  29. Hosking, L.J.; Chen, M.; Thomas, H.R. Numerical analysis of dual porosity coupled thermo-hydro-mechanical behaviour during CO2 sequestration in coal. Int. J. Rock Mech. Min. Sci. 2020, 135, 104473. [Google Scholar] [CrossRef]
  30. Shu, C.; Wang, H.; Li, X.; Fan, J.; Ye, X. A thermo–hydro–mechanical model: Capturing the effects of initial permeability and gas pressure on outburst-prone indicators. Nat. Resour. Res. 2020, 29, 1897–1914. [Google Scholar] [CrossRef]
  31. Yang, S.; Li, S.; Hou, W.; Ji, Y.; Zhang, K. Hydrocarbon Generation Processes of the Upper Carboniferous Coal in the Daning-Jixian Block, Eastern Ordos Basin: Insights From Geochemical and Three-Dimensional Basin Modeling. Energy Fuels 2025, 39, 8926–8939. [Google Scholar] [CrossRef]
  32. Xu, F.; Yan, X.; Li, S. Theoretical and technological difficulties and countermeasures of deep CBM exploration and development in the eastern edge of Ordos Basin. Coal Geol. Explor. 2023, 51, 115–130. [Google Scholar]
  33. Khormali, A.; Ahmadi, S.; Kazemzadeh, Y.; Karami, A. Evaluating the efficacy of binary benzimidazole derivatives as corrosion inhibitors for carbon steel using multi-modal analysis and optimization techniques. Results Eng. 2025, 26, 104671. [Google Scholar] [CrossRef]
  34. Wang, X.; Hou, S.; Wang, X.; Yuan, Y.; Dang, Z.; Tu, M. Geological and hydrological controls on the pressure regime of coalbed methane reservoir in the Yanchuannan field: Implications for deep coalbed methane exploitation in the eastern Ordos Basin, China. Int. J. Coal Geol. 2024, 294, 104619. [Google Scholar] [CrossRef]
  35. Chang, Y.; Yao, Y.; Liu, D.; Liu, Y.; Cui, C.; Wu, H. Behavior and mechanism of water imbibition and its influence on gas permeability during hydro-fracturing of a coalbed methane reservoir. J. Pet. Sci. Eng. 2022, 208, 109745. [Google Scholar] [CrossRef]
  36. Fan, L.; Zhou, G.; Yang, Z. Geological control of differential enrichment of deep coalbed methane in the Ordos Basin. Coal Sci. Technol. 2025, 53, 203–215. [Google Scholar]
  37. Xie, H.; Sang, S.; Li, X.; Yan, Z.; Zhou, X.; Liu, S.; Cai, J. Competitive adsorption-penetration characteristics of multi-component gases in micro-nano pore of coal. Chem. Eng. J. 2025, 506, 159965. [Google Scholar] [CrossRef]
  38. Wang, Y.; Chen, H.; Long, R.; Yang, M. Health economic loss measurement and risk assessment of new cases of coal worker’s pneumoconiosis in China. Saf. Sci. 2020, 122, 104529. [Google Scholar] [CrossRef]
  39. Yıldız, T. Loss of profits occurring due to the halting of mining operations arising from occupational accidents or reasons related to legislation. Gospod. Surowcami Miner. Miner. Resour. Manag. 2021, 37, 153–176. [Google Scholar]
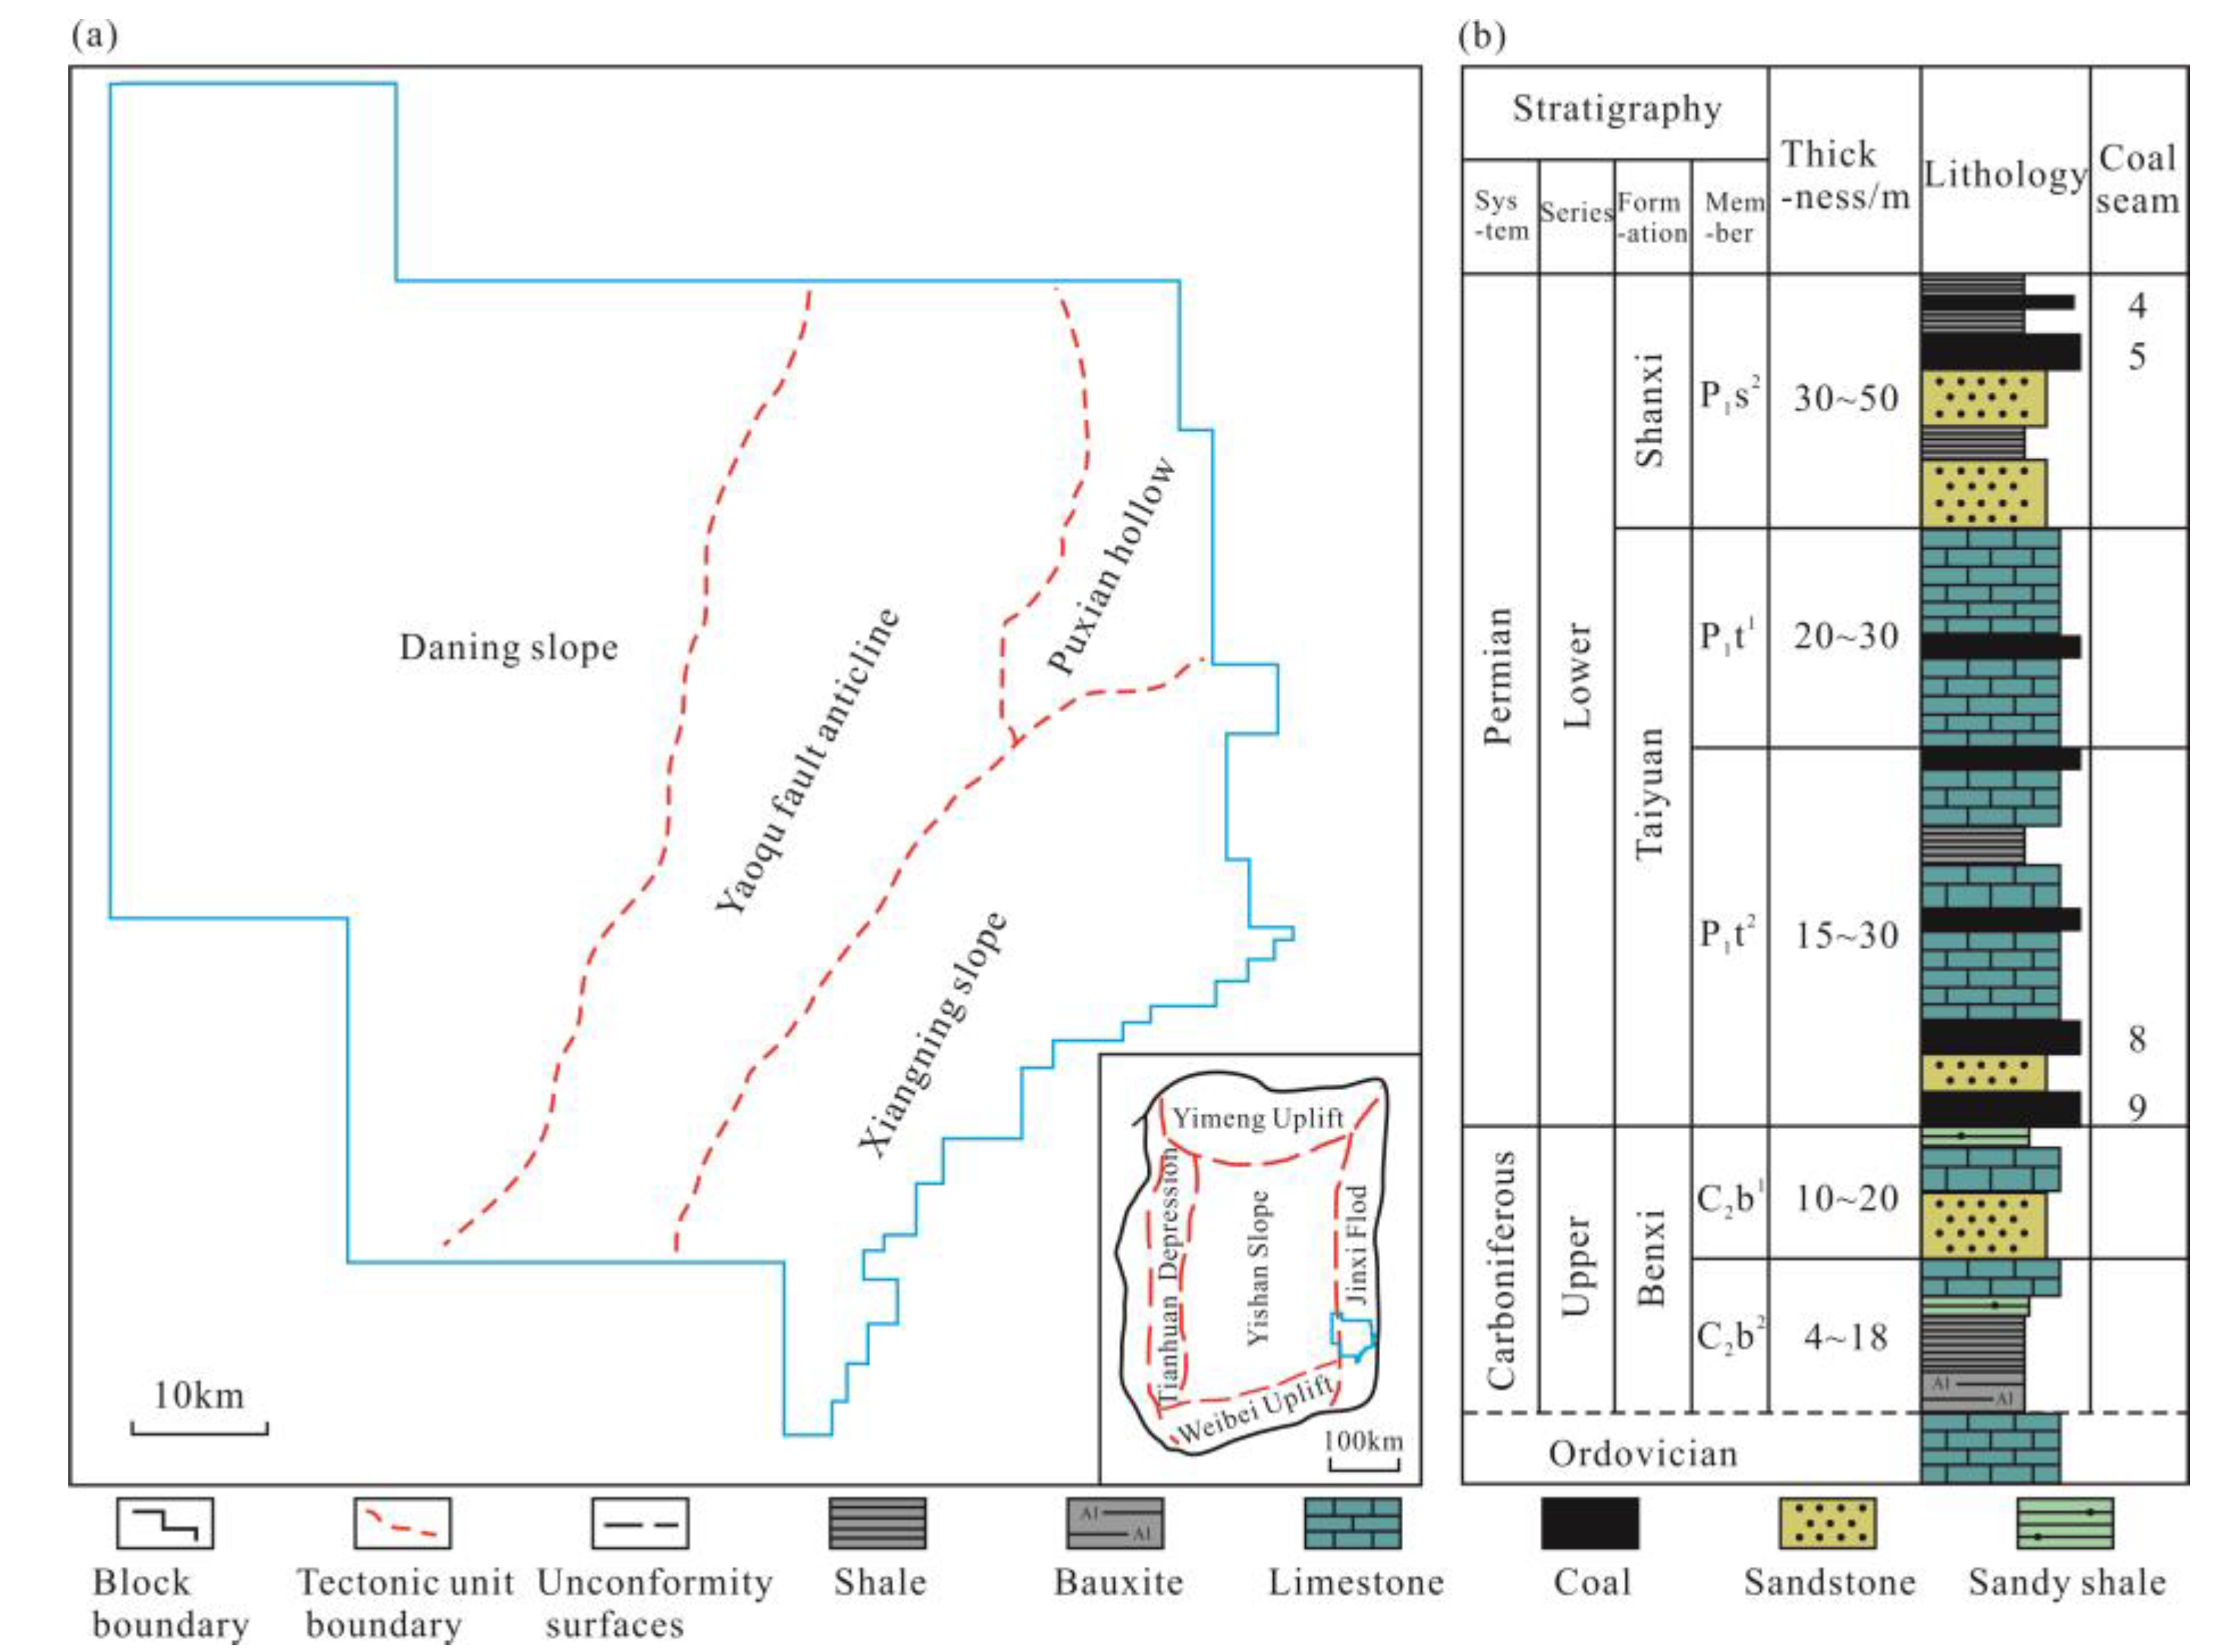
Figure 1. Tectonic outline and coal-bearing strata of Daning Jixian block: (a) Tectonic outline; (b) coal-bearing strata (cited from Reference [10]).
Processes 13 03090 g001
Figure 2. Physical Model and Mesh Generation of a Single Well.
Processes 13 03090 g002
Figure 3. Division of Production Stages for Deep CBM in the Ordos Basin.
Processes 13 03090 g003
Figure 4. History fitting results.
Processes 13 03090 g004
Figure 5. (a) Daily Gas Production Rate and (b) Cumulative Gas Production of CBM Wells under Different Flowing Pressure Drop Rates.
Processes 13 03090 g005
Figure 6. Dynamic Pressure Distribution in Coal Reservoir under Different Flowing Pressure Drop Rates.
Processes 13 03090 g006
Figure 7. (a,b) Pressure Evolution of Coal Reservoir under Different Flowing Pressure Drop Rates.
Processes 13 03090 g007
Figure 8. Dynamic Distribution of Water Saturation in Coal Reservoir under Different Flowing Pressure Drop Rates.
Processes 13 03090 g008
Figure 9. Dynamic Distribution of Coal Reservoir Temperature under Different Flowing Pressure Drop Rates.
Processes 13 03090 g009
Figure 10. Variation in CBM Desorption Volume under Different Flowing Pressure Drop Rates.
Processes 13 03090 g010
Figure 11. Variation in CBM Diffusion Rate under Different Flowing Pressure Drop Rates.
Processes 13 03090 g011
Figure 12. Distribution of Permeability Ratio in Coal Reservoir under Different Flowing Pressure Drop Rates.
Processes 13 03090 g012
Figure 13. Permeability Ratio Variation in Coal Reservoir under Different Flowing Pressure Drop Rates.
Processes 13 03090 g013
Table 1. Production Characteristics of Deep CBM Wells in the Daning-Jixian Block.
Production PhaseWater Drainage StageGas Production
Ramp-Up Stage
Stable Production StageProduction Decline Stage
Flowing pressure drop rate (MPa/d)0.100.0380.0230.01
Time (day)2617~20185>230
Casing pressure (MPa)4.95.73.83
Table 2. Numerical Scheme.
Production Strategy (Flowing Pressure Drop)Water Drainage StageGas Production Ramp-Up StageStable Production StageProduction Decline Stage
0.5 times of current flowing pressure drop rate (MPa/d)0.050.0190.01150.005
Current flowing pressure drop rate (MPa/d)0.100.0380.0230.01
1.5 times of current flowing pressure drop rate (MPa/d)0.150.0570.03450.015
2 times of current flowing pressure drop rate (MPa/d)0.200.0760.0460.02
Table 3. Initial and Boundary Conditions.
StepTime/DaySimulation StageInitial and Boundary Conditions
Stage 1300History matching stage① The bottom-hole flowing pressure is set according to the actual measured values from the coalbed methane well.
② All other boundaries are defined as constant-pressure boundaries.
Stage 22700Gas production prediction stage① The bottom-hole flowing pressure is set to the value measured after 300 days of production.
② All other boundaries are defined as constant-pressure boundaries.
Table 4. Key Parameters for Numerical Simulation.
ParameterValueParameterValue
Permeability in fractured zone/(10−3 μm2)45.5Water viscosity/Pa·s1 × 10−3
Elastic modulus of coal/GPa3.0Methane viscosity/Pa·s1.84 × 10−5
Poisson’s ratio of coal/dimensionless0.350Langmuir pressure of coal pL/MPa2.95
Specific heat capacity of water/J·(kg·K)−14190Langmuir volume of coal VL/m3·kg−10.0276
Thermal conductivity of water/W·(m·K)−10.598Klinkenberg factor/MPa0.76
Endpoint relative permeability of water/dimensionless1.0Elastic modulus of coal matrix/GPa7.340
Original formation temperature/K325Specific heat capacity of methane/J·(kg·K)−12220
Endpoint relative permeability of gas/dimensionless0.756Thermal conductivity of methane/W·(m·K)−10.031
Isosteric heat of adsorption/kJ·mol−133.4
Disclaimer/Publisher’s Note: The statements, opinions and data contained in all publications are solely those of the individual author(s) and contributor(s) and not of MDPI and/or the editor(s). MDPI and/or the editor(s) disclaim responsibility for any injury to people or property resulting from any ideas, methods, instructions or products referred to in the content.