1. Introduction
Shale reservoirs, holding vast global reserves of shale gas (7576 trillion cubic feet) and shale oil (418 billion barrels), are pivotal for meeting energy demands and enhancing energy security. However, the ultralow permeability of these formations (<0.1 millidarcy) poses significant drilling challenges, particularly in high-inclination and horizontal wells (80–90°). Common issues include cuttings bed formation, high torque, and low Rate of Penetration (ROP), which collectively contribute to global drilling costs of approximately
$100 billion annually and exacerbate mechanical issues (e.g., stuck pipe) and chemical instabilities (e.g., shale hydration) [
1,
2,
3,
4,
5,
6,
7]. Horizontal drilling, paired with hydraulic fracturing, is essential for maximizing reservoir contact and boosting production rates, yet optimizing hole cleaning remains critical to improving drilling efficiency and well integrity [
8,
9].
Previous studies have highlighted the critical role of drillstring rotation and flow hydraulics in enhancing cuttings transport. Sanchez et al. (1999) observed that the improvement level resulting from pipe rotation is intricately linked to the interplay of mud rheology, cuttings size, and mud flow rate, showing that higher rotary speeds facilitate the movement of cuttings to the surface in deviated wells [
10]. Ahmed et al. (2010) [
11] investigated Equivalent Circulation Density (ECD) management in narrow boreholes of deep-water wells, demonstrating that variations in pipe rotation directly affect Bottom Hole Pressure (BHP) and hole cleaning efficiency. Busch and Johansen (2020) [
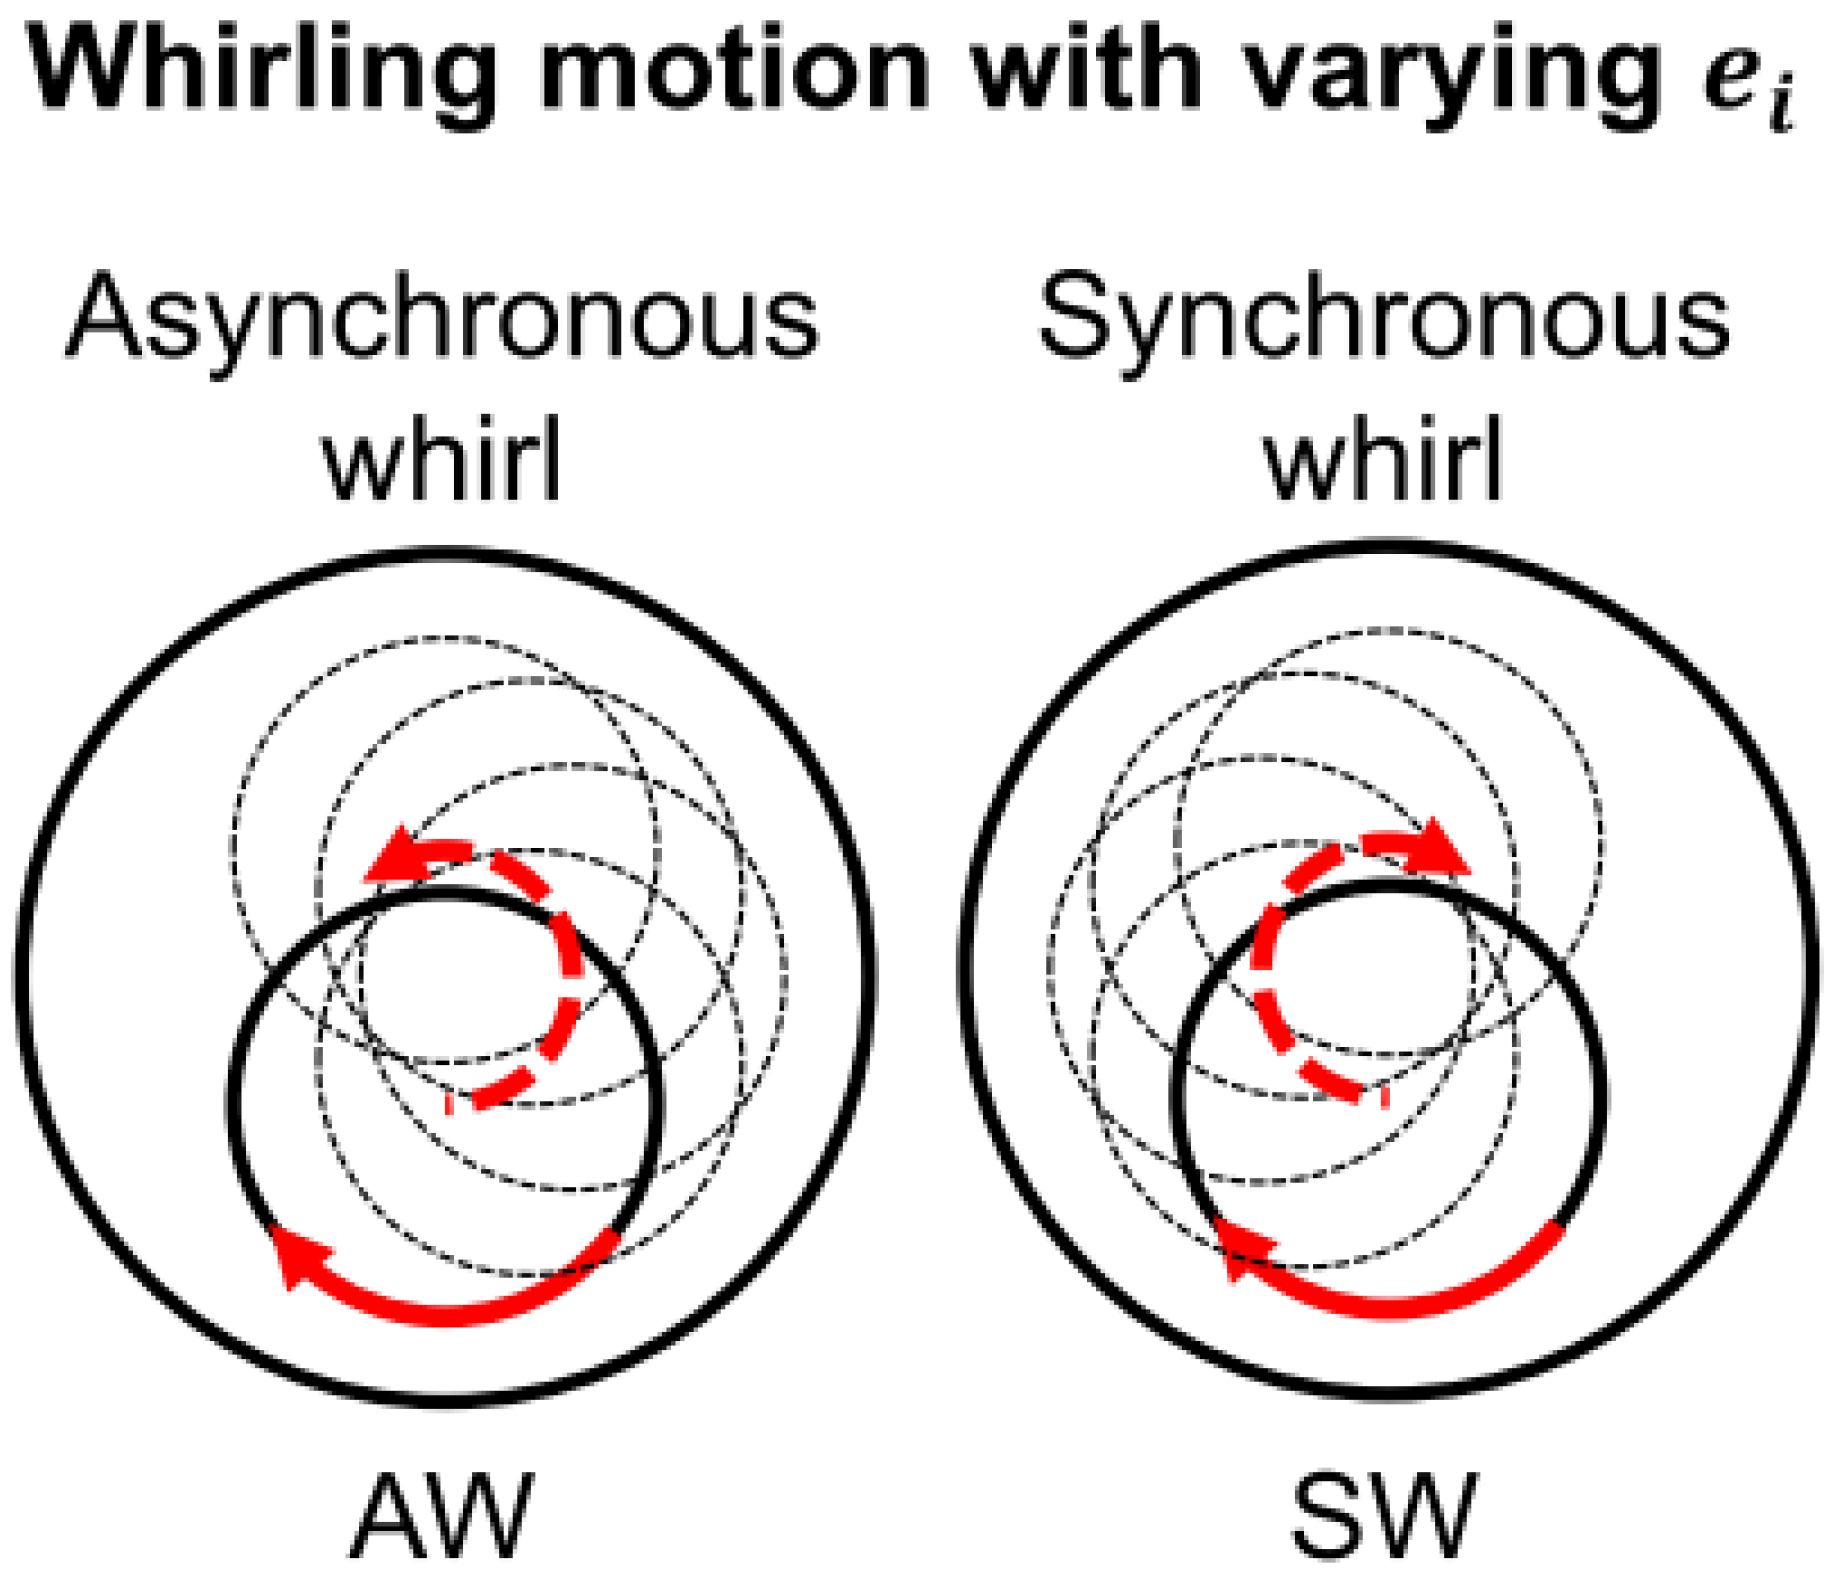
12] conducted laboratory setups to explore the influence of drill pipe rotation on cuttings transport. In their study, “rotation” denotes a combination of simple drill pipe rotation around its axis and more intricate lateral motion, with two distinct patterns: Synchronous Whirl (SW), where the tool joint slides on the hole/casing wall consistently facing the same side toward the outer wall, and Asynchronous Whirl (AW), or backward whirl, where the tool joint rolls along the hole/casing wall without slipping, as illustrated in
Figure 1 [
12].
The whirling motion can be further characterized by a two-dimensional oscillatory pattern in the y and z directions, expressed as:
where E
i represents the dimensional eccentricities, A
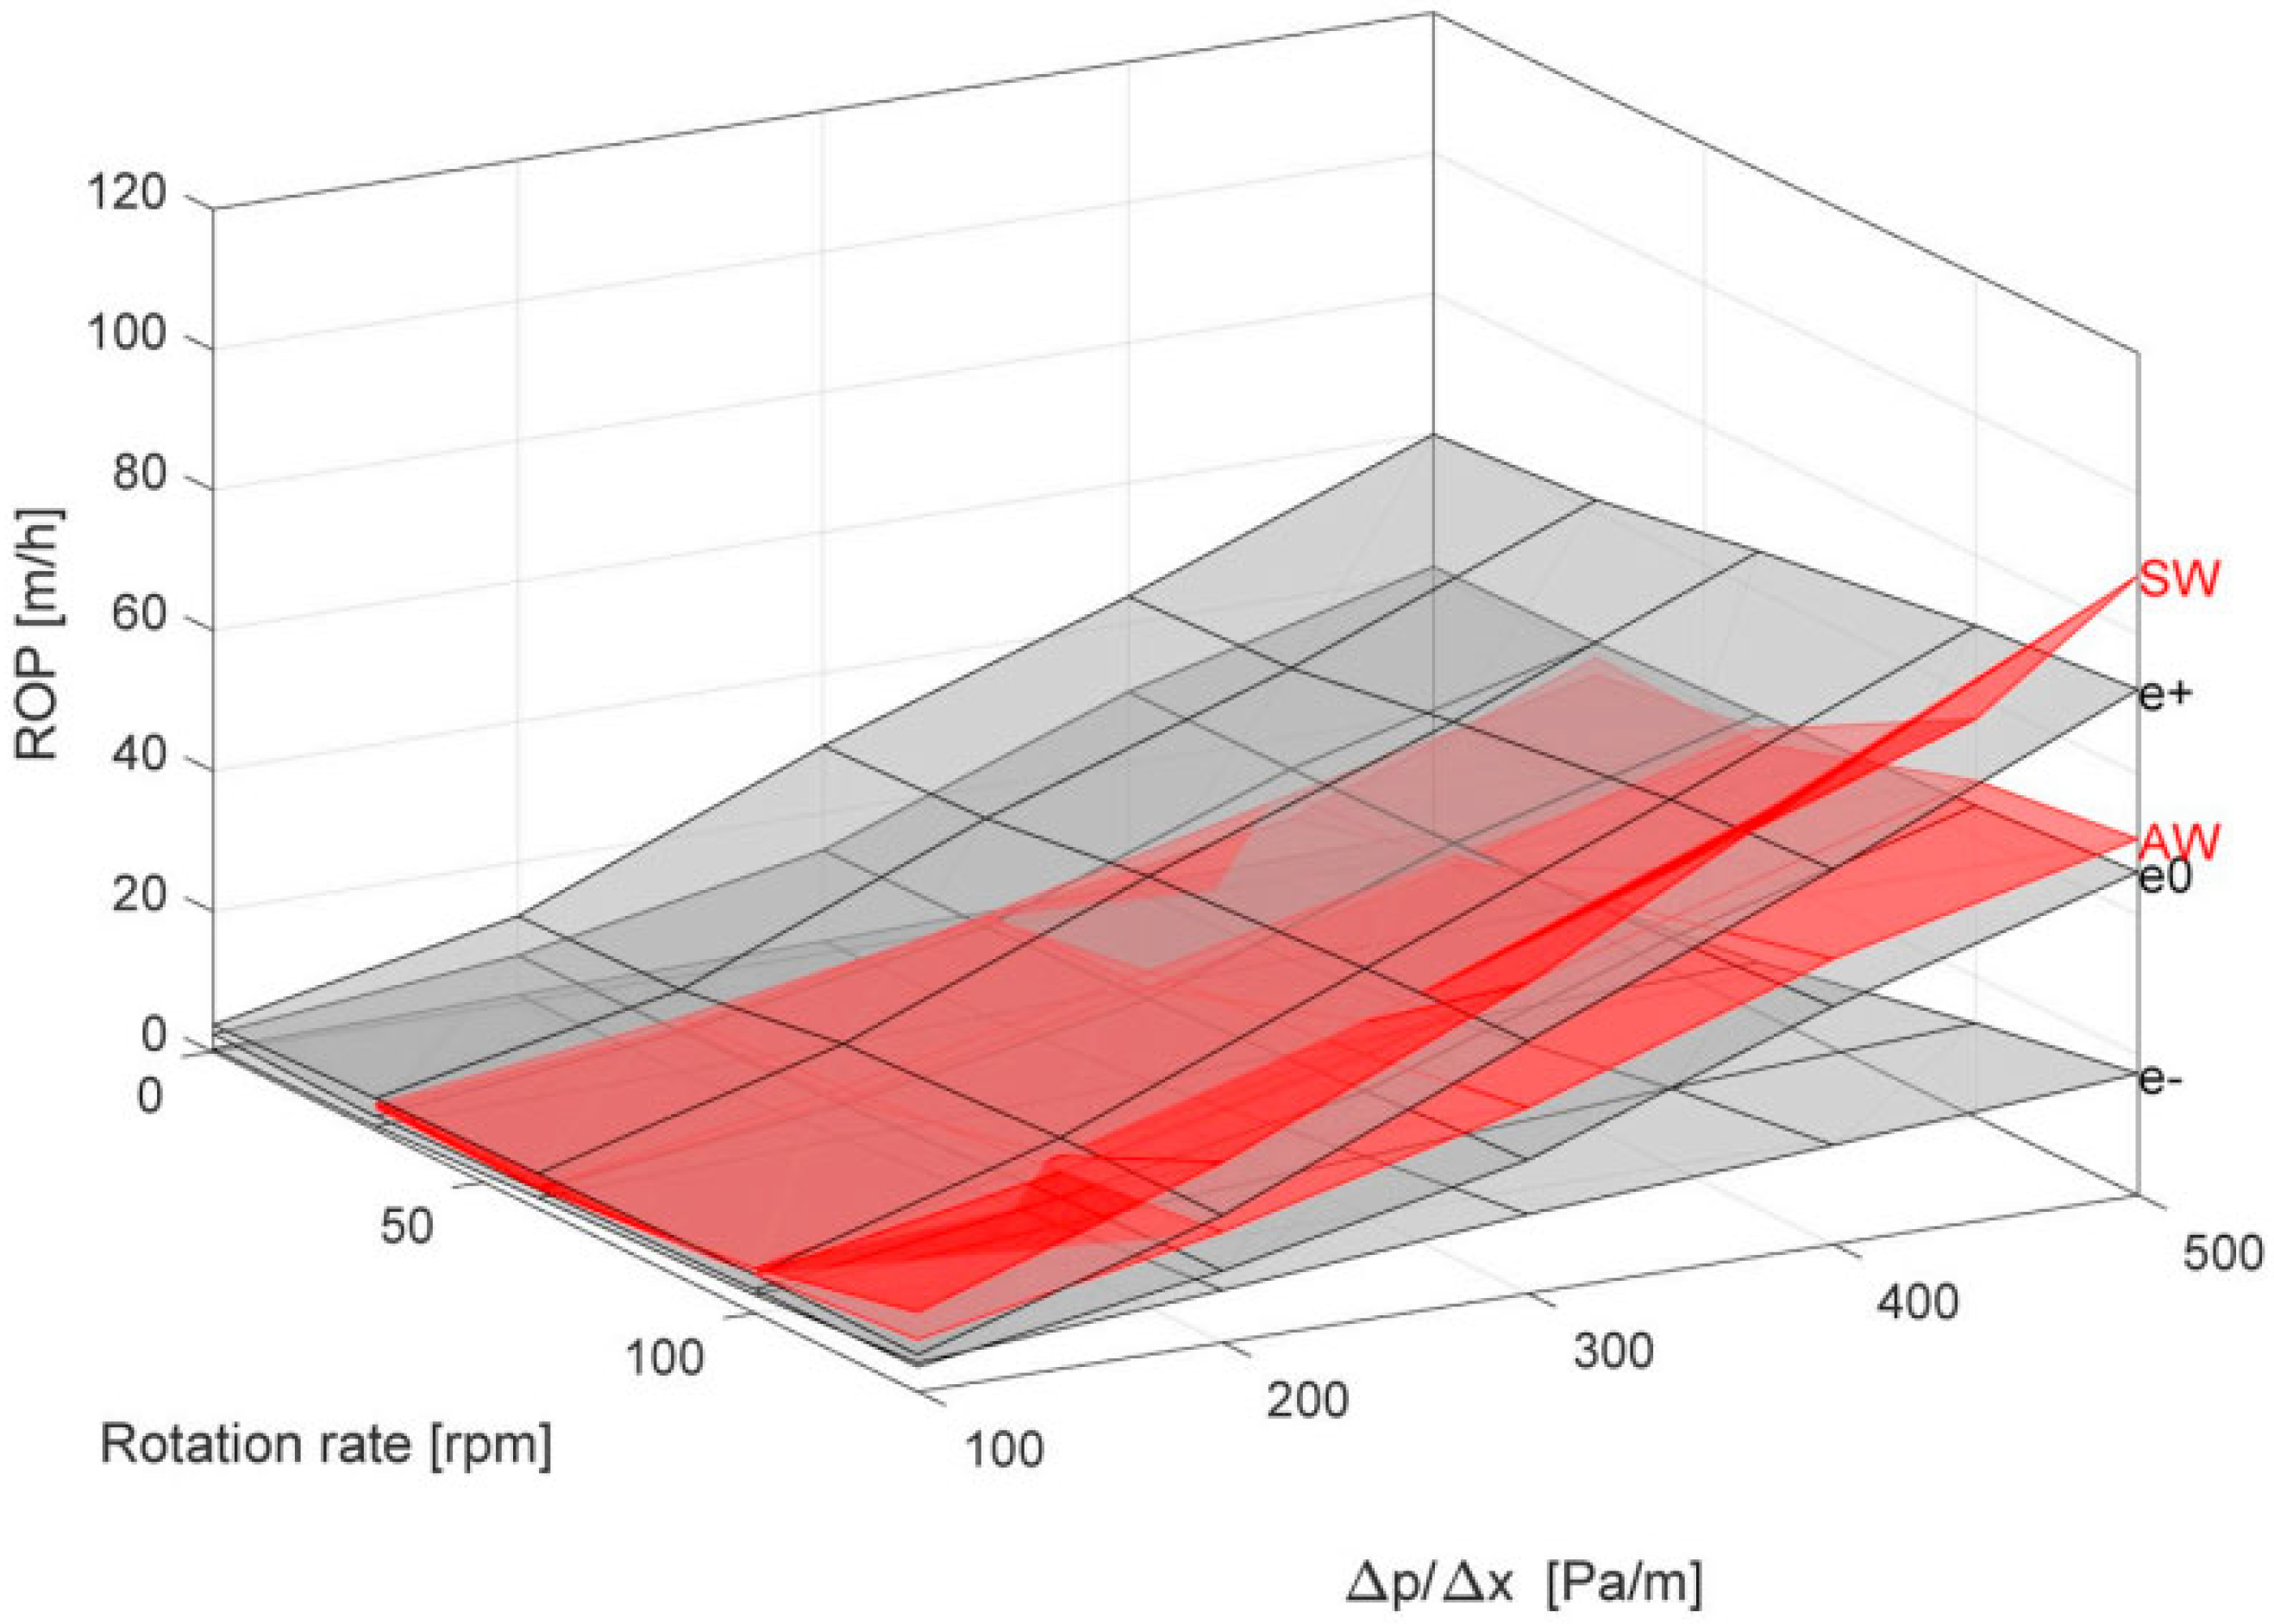
i the oscillation amplitudes, and ω the angular frequency. Equal angular velocities are assumed along both axes for simplicity. These findings indicate that, in negatively eccentric annuli, whirling motion significantly disperses solids into the primary flow region, enhancing cuttings transport and hole cleaning. Synchronous whirl proves more effective than asynchronous whirl in agitating the bed and dispersing cuttings, as illustrated in
Figure 2 [
12].
Drilling operations in shale formations have similarly benefited from integrating simulation technologies. Isbell et al. (2014) [
13] systematically explored simulation-based optimization, while additional studies have examined the mechanical interactions between drillstring motion and fluid dynamics to elucidate RPM’s role in hole cleaning. Katende et al. (2020) [
14] reported that at higher RPM values, turbulence in the annulus is sufficient to lift and transport larger cuttings, particularly when water-based muds are used. Erge and van Oort (2020) [
15] incorporated eccentricity effects in their modeling and confirmed that rotation-induced agitation of the fluid can prevent cuttings accumulation under complex wellbore geometries. Collectively, these studies highlight the mechanical benefits of drillstring rotation, especially in mitigating annular pack-off, a common challenge in reactive shale formations with high cutting loads.
Field-based and simulation studies in other shale-rich formations such as Bakken further underline the operational importance of RPM optimization. Isbell et al. (2014) [
13] demonstrated that increasing drillstring rotation reduced non-productive time and the incidence of stuck-pipe events by improving hole cleanliness. Lockett et al. (1993) [
16] emphasized that without sufficient RPM, even high flow rates may fail to clear cuttings beds in extended laterals. More recent applications of machine learning, such as those by Domanova et al. (2025) [
17], have enabled real-time monitoring of RPM effects, allowing dynamic adjustments during drilling operations. Together, these works build a compelling case for carefully selecting and controlling RPM to optimize hole cleaning efficiency in shale drilling scenarios [
18,
19,
20,
21,
22,
23,
24,
25].
The South Pars/North Dome gas field, located in the Persian Gulf, is the world’s largest natural gas-condensate field, extending over approximately 9700 km
2 across the maritime border between Iran (South Pars, ~3700 km
2) and Qatar (North Dome, ~6000 km
2). The reservoir is hosted within Permian–Triassic carbonate formations, specifically the Kangan and Upper Dalan formations, deposited on a homoclinal carbonate ramp [
26]. These formations comprise multiple reservoir units (K1–K4), each with distinct depositional characteristics and diagenetic histories. The Kazhdumi Formation, overlying the South Pars reservoir, is a Late Albian to Cenomanian calcareous shale unit characterized by alternating dark gray shales, marls, and occasional limestone interbeds. Rock-Eval pyrolysis indicates predominantly Type III kerogen with TOC values ranging from 0.12 to 1.2 wt.% and T
max values between 370 °C and 426 °C, suggesting thermally immature to early mature conditions. Consequently, the Kazhdumi Formation’s role in hydrocarbon generation within South Pars is limited due to its low maturity and gas-prone character [
27,
28]. Intensive gas production has caused reservoir compaction and surface subsidence, with pressure depletion from 36.5 MPa to 6.2 MPa resulting in approximately 0.48 m of vertical compaction [
26].
In this study, real-time field data from South Pars are integrated with Drillbench simulations to optimize drilling parameters in horizontal and extended reach wells, aiming to improve ROP, reduce torque, enhance cuttings transport, and maintain borehole stability in unconsolidated shale formations. The novelty of this work lies in combining field measurements, whirling motion characterization, and numerical simulations to identify optimized drilling conditions (including drillstring rotation, circulation rates, and water-based mud additives). By analyzing both South Pars and Bakken shale formations, the study demonstrates transferability of the optimized parameters across ultralow-permeability reservoirs, providing actionable recommendations for horizontal/extended reach drilling, enhanced hole cleaning, and improved operational performance, directly supporting sustainable reservoir development and potential EOR activities. To highlight the differences and justify the transferability analysis,
Table 1 summarizes the contrasting drilling challenges between South Pars carbonate–shale sequences and Bakken organic-rich shales.
2. Materials and Methods
This study develops optimized drilling strategies by integrating experimental field data from the South Pars field with Drillbench simulations, focusing on shale-prone intervals. The workflow comprised three components: (i) identification and characterization of operational challenges in South Pars shale drilling; (ii) implementation of parameter modifications including drillstring rotation, pump rate, and mud formulation during controlled field operations; and (iii) evaluation of transferability through comparative simulation studies in the Bakken Formation.
2.1. South Pars Field Data Acquisition
Real-time drilling data were collected in the South Pars field at approximately 1202 m, targeting the Kazhdumi formation, which consists of sandstone interbedded with thin limestone layers and dark gray to green splintery shales. All wells were drilled using an IADC 437 Tricone Roller bit with a water-based mud system containing calcium chloride.
Table 1 summarizes key well parameters, including depth range, ROP, mud viscosity, density, and PH. Observed operational challenges included shale instability, bit balling, tight-hole conditions, stuck-pipe events, and poor cuttings removal. These observations defined the parameters and scenarios for subsequent optimization and simulation studies.
Table 2 summarizes key well parameters including depth range, ROP, mud viscosity, density, and pH. These observations defined the parameters and scenarios for subsequent optimization and simulation studies.
2.2. Identification of Drilling Challenges
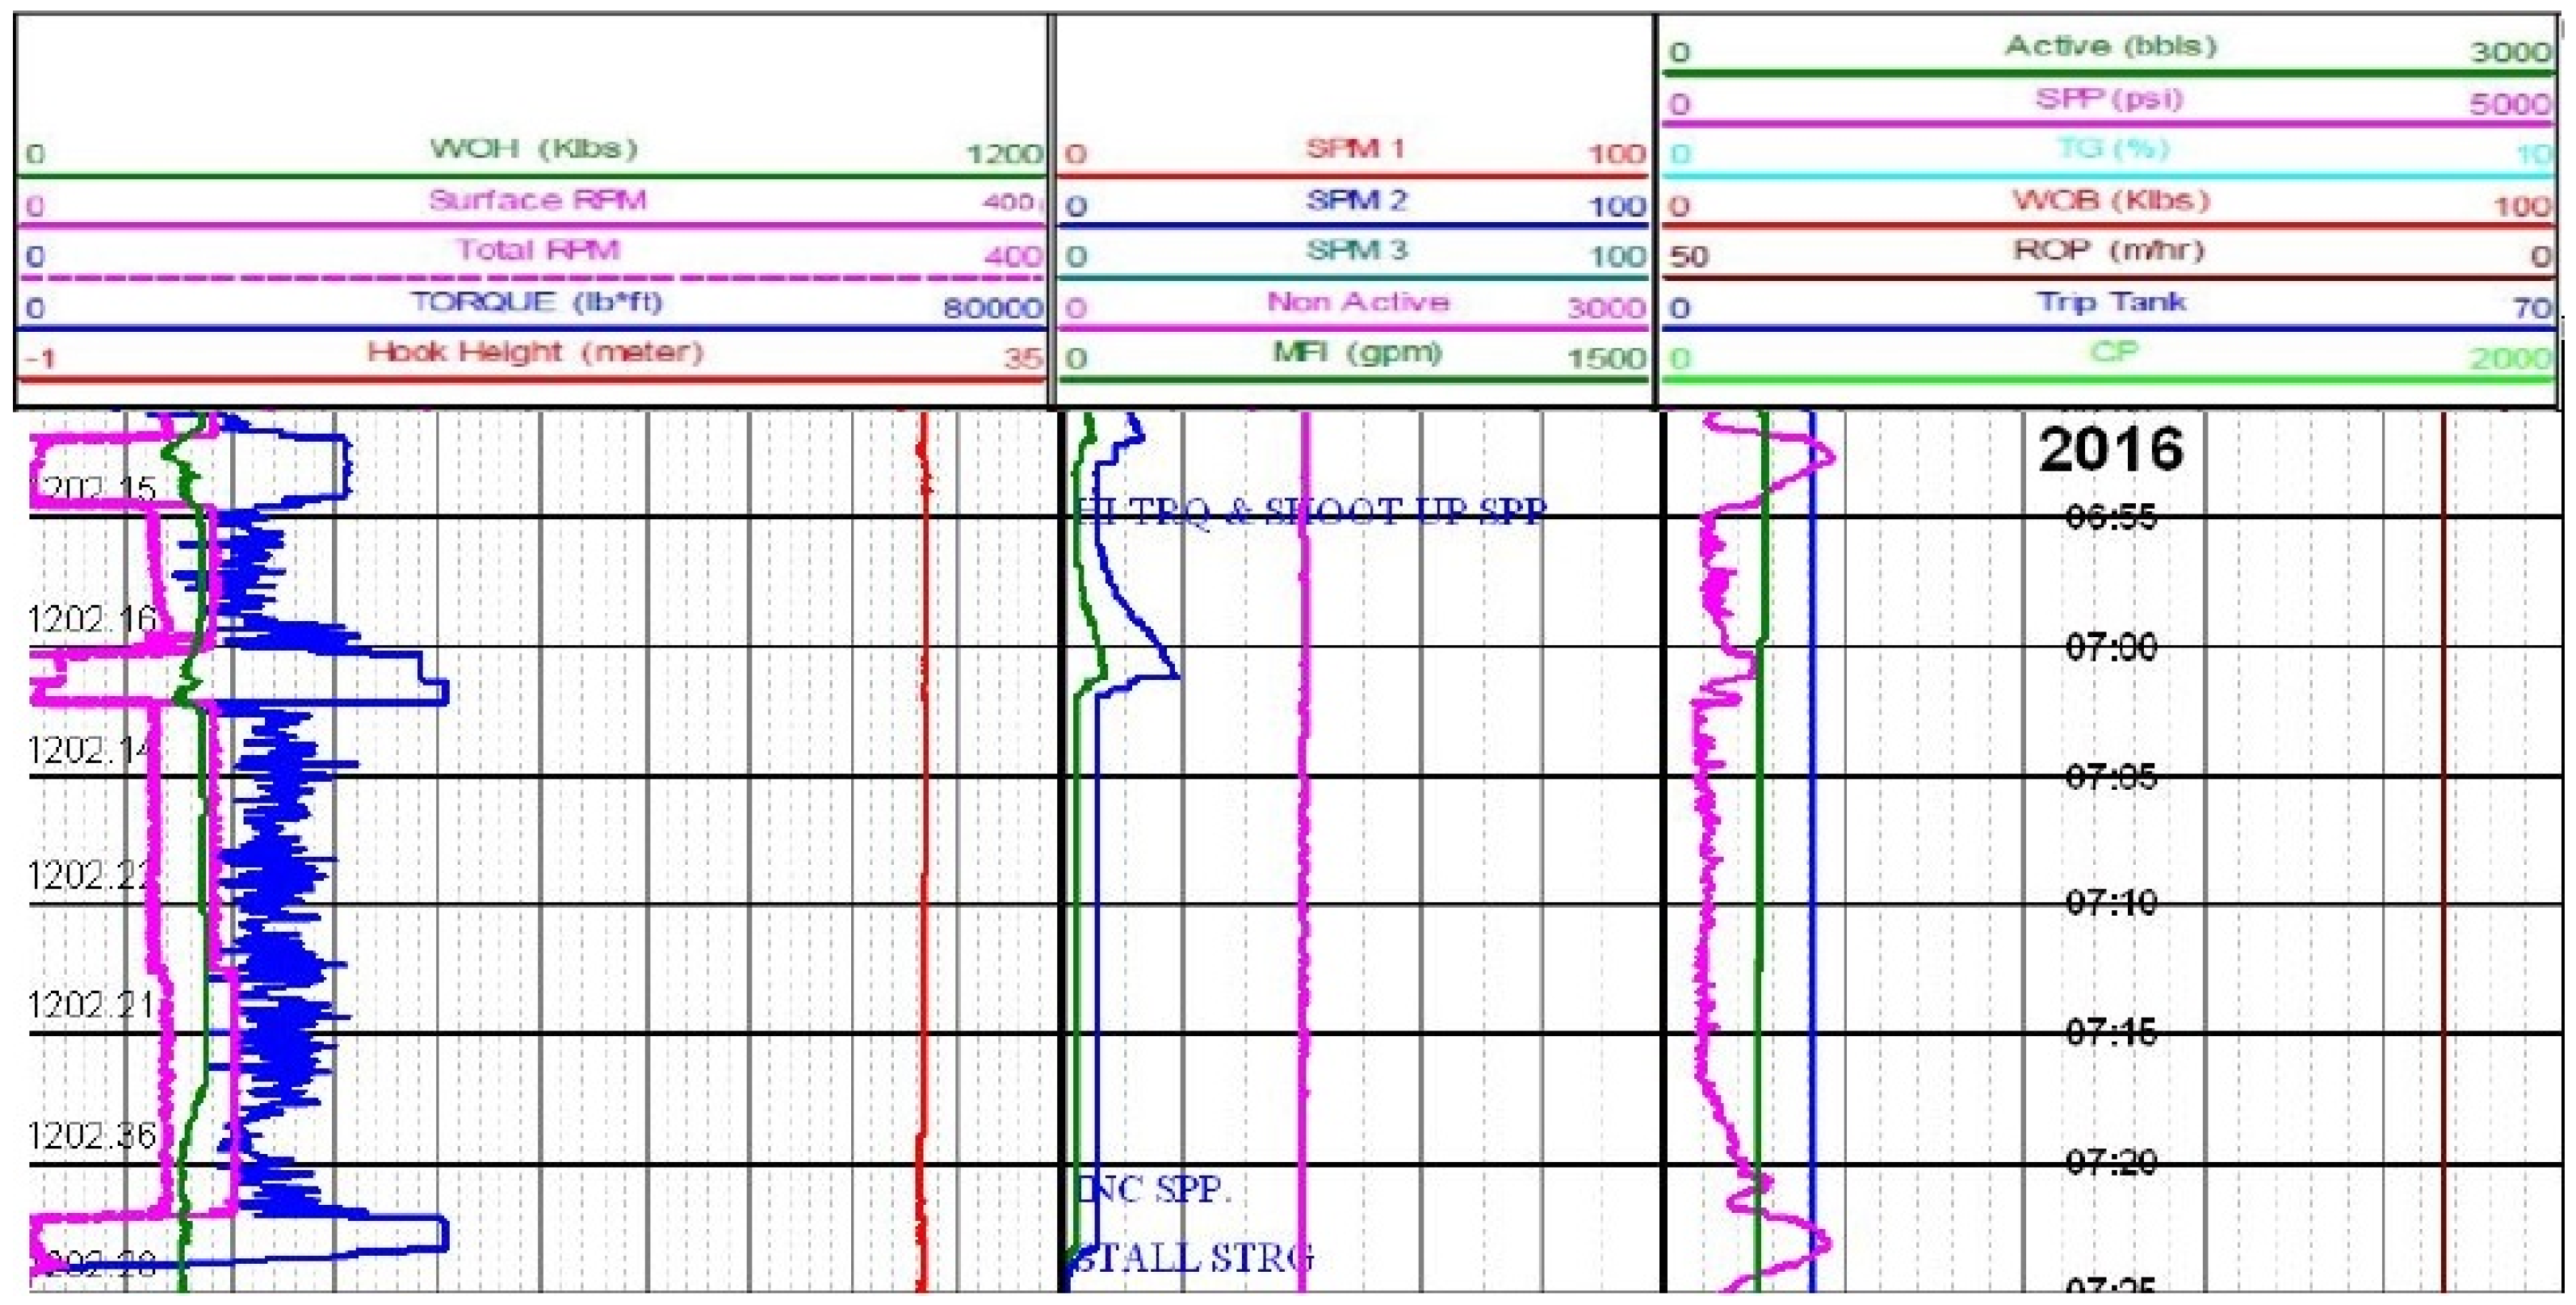
Mud logging data were analyzed to identify key operational constraints. At 1202 m, high torque spikes (TQ), elevated standpipe pressure (SPP), and intermittent string stalling were recorded (
Figure 3). These indicators pointed to cuttings accumulation, restricted mud circulation, and inefficient hole cleaning. While these observations informed the design of interventions, they were used solely as diagnostic baselines during the methodology stage.
2.3. Parameter Change Design
Operational adjustments were pre-defined to address the identified challenges. Drillstring rotation was increased to 90 RPM to promote synchronous whirl. Pump rates were adjusted to maintain an annular velocity of approximately 0.7 m/s. Mud properties were modified by adding 2% sulphonated asphalt to reduce shale hydration and by implementing high-viscosity sweeps (40–50 cP) every 30 m. Annular velocity was calculated as:
where Q is flow rate in gal/min, D
h is hole or casing diameter in inches, and D
p is drill pipe or tool diameter in inches.
2.4. Bakken Formation Case Studies
To assess transferability, three Saskatchewan Bakken wells were selected: vertical (Well A), deviated (Well B), and horizontal (Well C). These wells targeted the Middle Bakken (sandstone with limestone interbeds) and Lower Bakken (dark organic-rich shale). All wells were drilled with 8.6-in holes using WBM with CaCl2 (density ~950–1100 kg/m3, viscosity 28–35 s, pH 8–10). Common operational challenges included shale instability, bit balling, tight-hole conditions, high torque, and poor cuttings removal, particularly in the build sections. Three Bakken wells in Saskatchewan were selected for this study, representing vertical, deviated, and horizontal well trajectories. Well A was drilled vertically from 1220 to 1640 m with an average rate of penetration (ROP) of approximately 10–15 m/h. It employed a water-based mud system containing calcium chloride, with density in the range of 950–1100 kg/m3, viscosity of 28–35 s, and a pH of 8–10, providing moderate alkalinity. The well was drilled using an IADC 547 Tricone Roller bit. Lithologically, the Middle Bakken consisted of sandstone interbedded with varying amounts of limestone, whereas the Lower Bakken comprised dark grey to black organic-rich shale. Operational challenges included shale instability, characterized by swelling and sloughing, bit balling, tight-hole and stuck-pipe events, and poor cuttings removal.
Well B, a deviated well drilled from 1231 to 1644 m, had an ROP of approximately 15–20 m/h. It utilized the same water-based mud formulation and bit type as Well A, encountering similar lithologies and operational issues, particularly in the build section where cuttings accumulation and high torque were prominent.
Well C, drilled horizontally from 1290 to 1665 m, exhibited a lower ROP of 8–10 m/h due to the combined effects of horizontal drilling and the ultralow-permeability shales in the Lower Bakken. The well used the same water-based mud system and IADC 547 Tricone Roller bit, and experienced comparable challenges including shale instability, bit balling, tight-hole conditions, and inefficient cuttings transport.
Table 3 presents operational drilling data recorded from a Middle Bakken well located in southeastern Saskatchewan, Canada. The data reflect typical performance during 8.5-inch hole drilling with a Tricone roller bit using a water-based mud system (density ≈ 1050 kg/m
3, viscosity 32 s, pH ≈ 9). The table shows depth progression each day, daily progress, instantaneous rate of penetration (ROP), cumulative rotating hours, and the primary drilling activity conducted. These real field values illustrate the operational variability encountered during drilling, with initial high ROP in shallower sections (>30 m/h) decreasing to <5 m/h in deeper horizontal intervals due to increasing torque and cuttings load. This dataset served as a baseline for calibrating the Drillbench simulation models discussed in
Section 2.5 and validating the optimization strategies applied to the Bakken case studies.
The geological framework of the studied Middle Bakken well was established from the original wellsite geological report, which documented all major stratigraphic units encountered during drilling. The well penetrated a typical Williston Basin stratigraphy, starting with shallow Cretaceous clastic and carbonate formations (Second White Specks, Viking Sandstone, and Mannville), followed by Jurassic–Triassic mixed siliciclastic intervals (Gravelbourg and Watrous), and continuing into Mississippian carbonates (Frobisher, Kisbey, Alida, Tilston, and Souris Valley) before reaching the Bakken sequence. The Bakken interval consisted of an upper shale member, a thin Bakken sandstone, and a porous Bakken sandstone subunit directly overlying the Exshaw Shale and the Devonian Torquay Formation. These formations provided the lithological context used to assign rock properties (e.g., porosity, density, and mechanical strength) in the Drillbench simulations and to interpret the drilling performance and torque response observed in the field. The full list of formations with their prognosed and sampled depths is shown in
Table 4.
Density and viscosity progressively increased with depth as solids content rose and additional weighting materials were introduced, while calcium/chloride concentrations were adjusted to inhibit shale swelling and maintain chemical stability. Water loss and filter cake thickness remained relatively stable after 1190 m, suggesting effective fluid loss control as the well entered the low-permeability Bakken intervals. pH values were kept between 9.0 and 10.0 to maintain alkalinity and prevent clay dispersion. These real-time rheological measurements were used to parameterize the fluid input for the Drillbench modeling described in
Section 2.5, and the detailed values are provided in
Table 5.
2.5. Computational Modeling
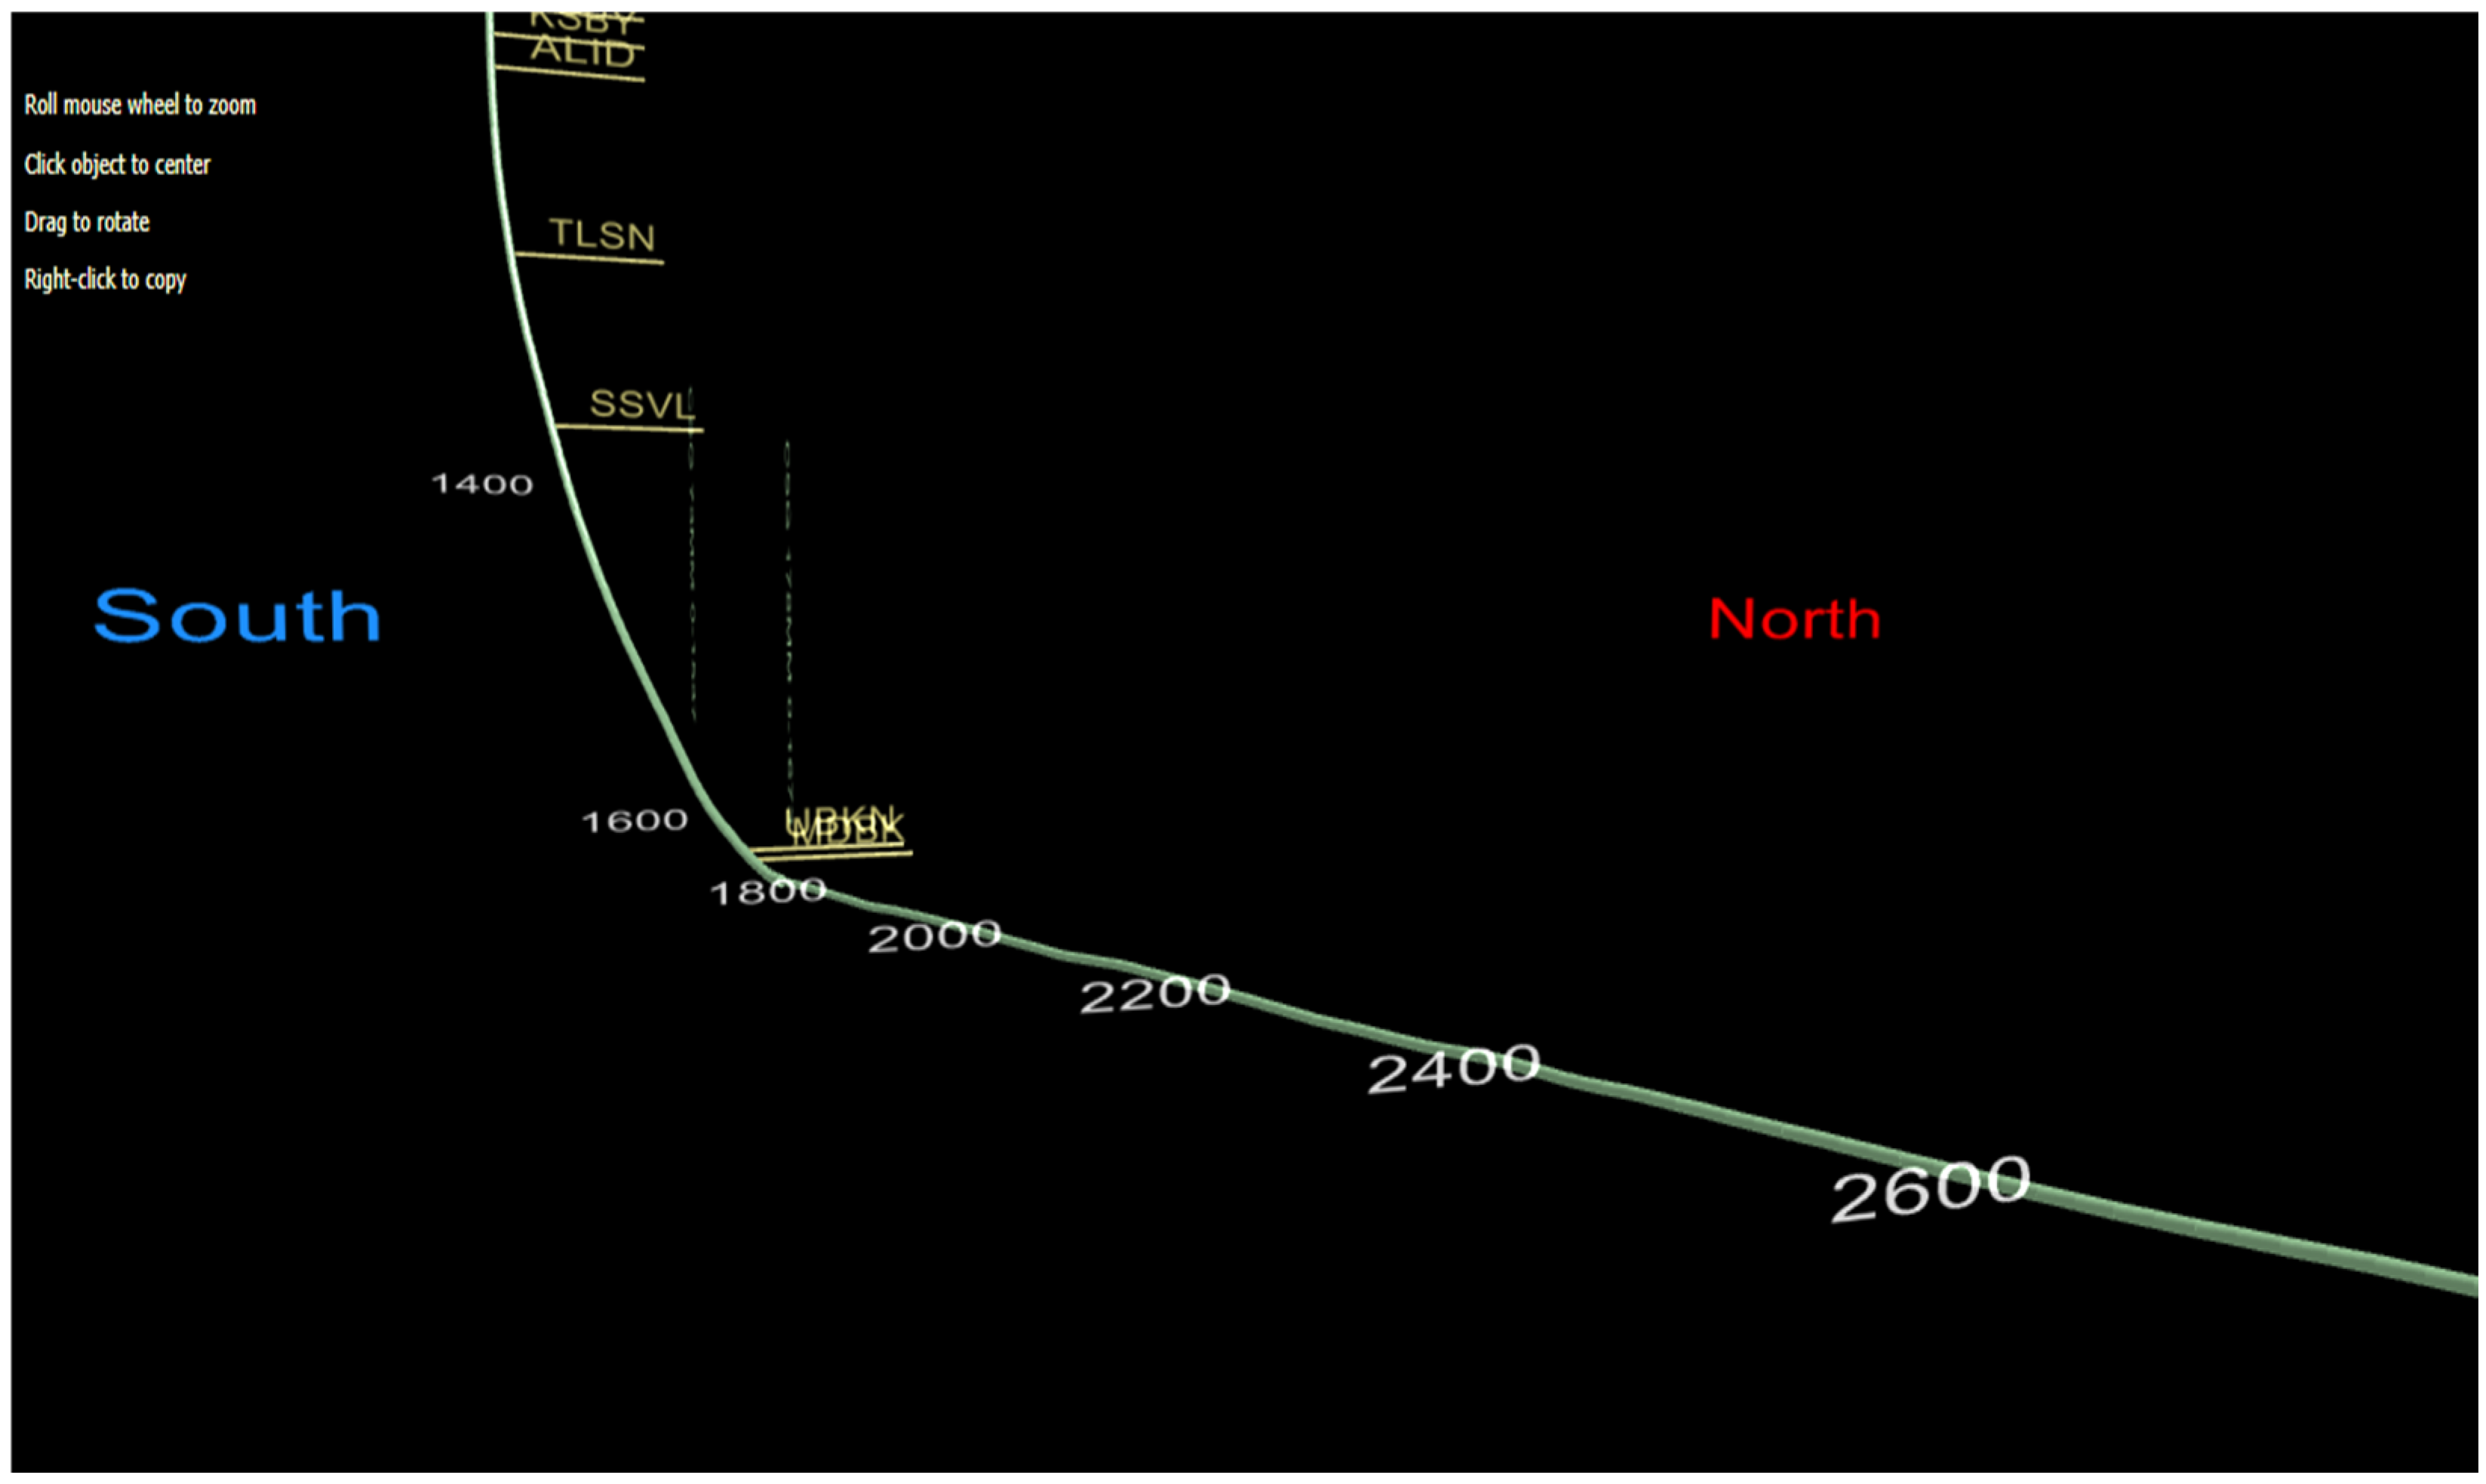
Drillbench simulations were conducted for a single-lateral horizontal well comprising a ~222 mm vertical section (~1450 m), a build to 90° inclination, and a 158 mm production interval extending to 1800–2600 m MD. Model assumptions included steady-state flow, drillstring eccentricity of 0.5, shale porosity of 5%, and permeability of 0.1 mD. Predicted outputs included torque, annular pressure, ECD, and cuttings transport efficiency. Simulated results were validated against field data from the Bakken wells. Moreover,
Figure 4 shows the overall simulated well trajectory. Additionally,
Table 6 highlights the build section trajectory and
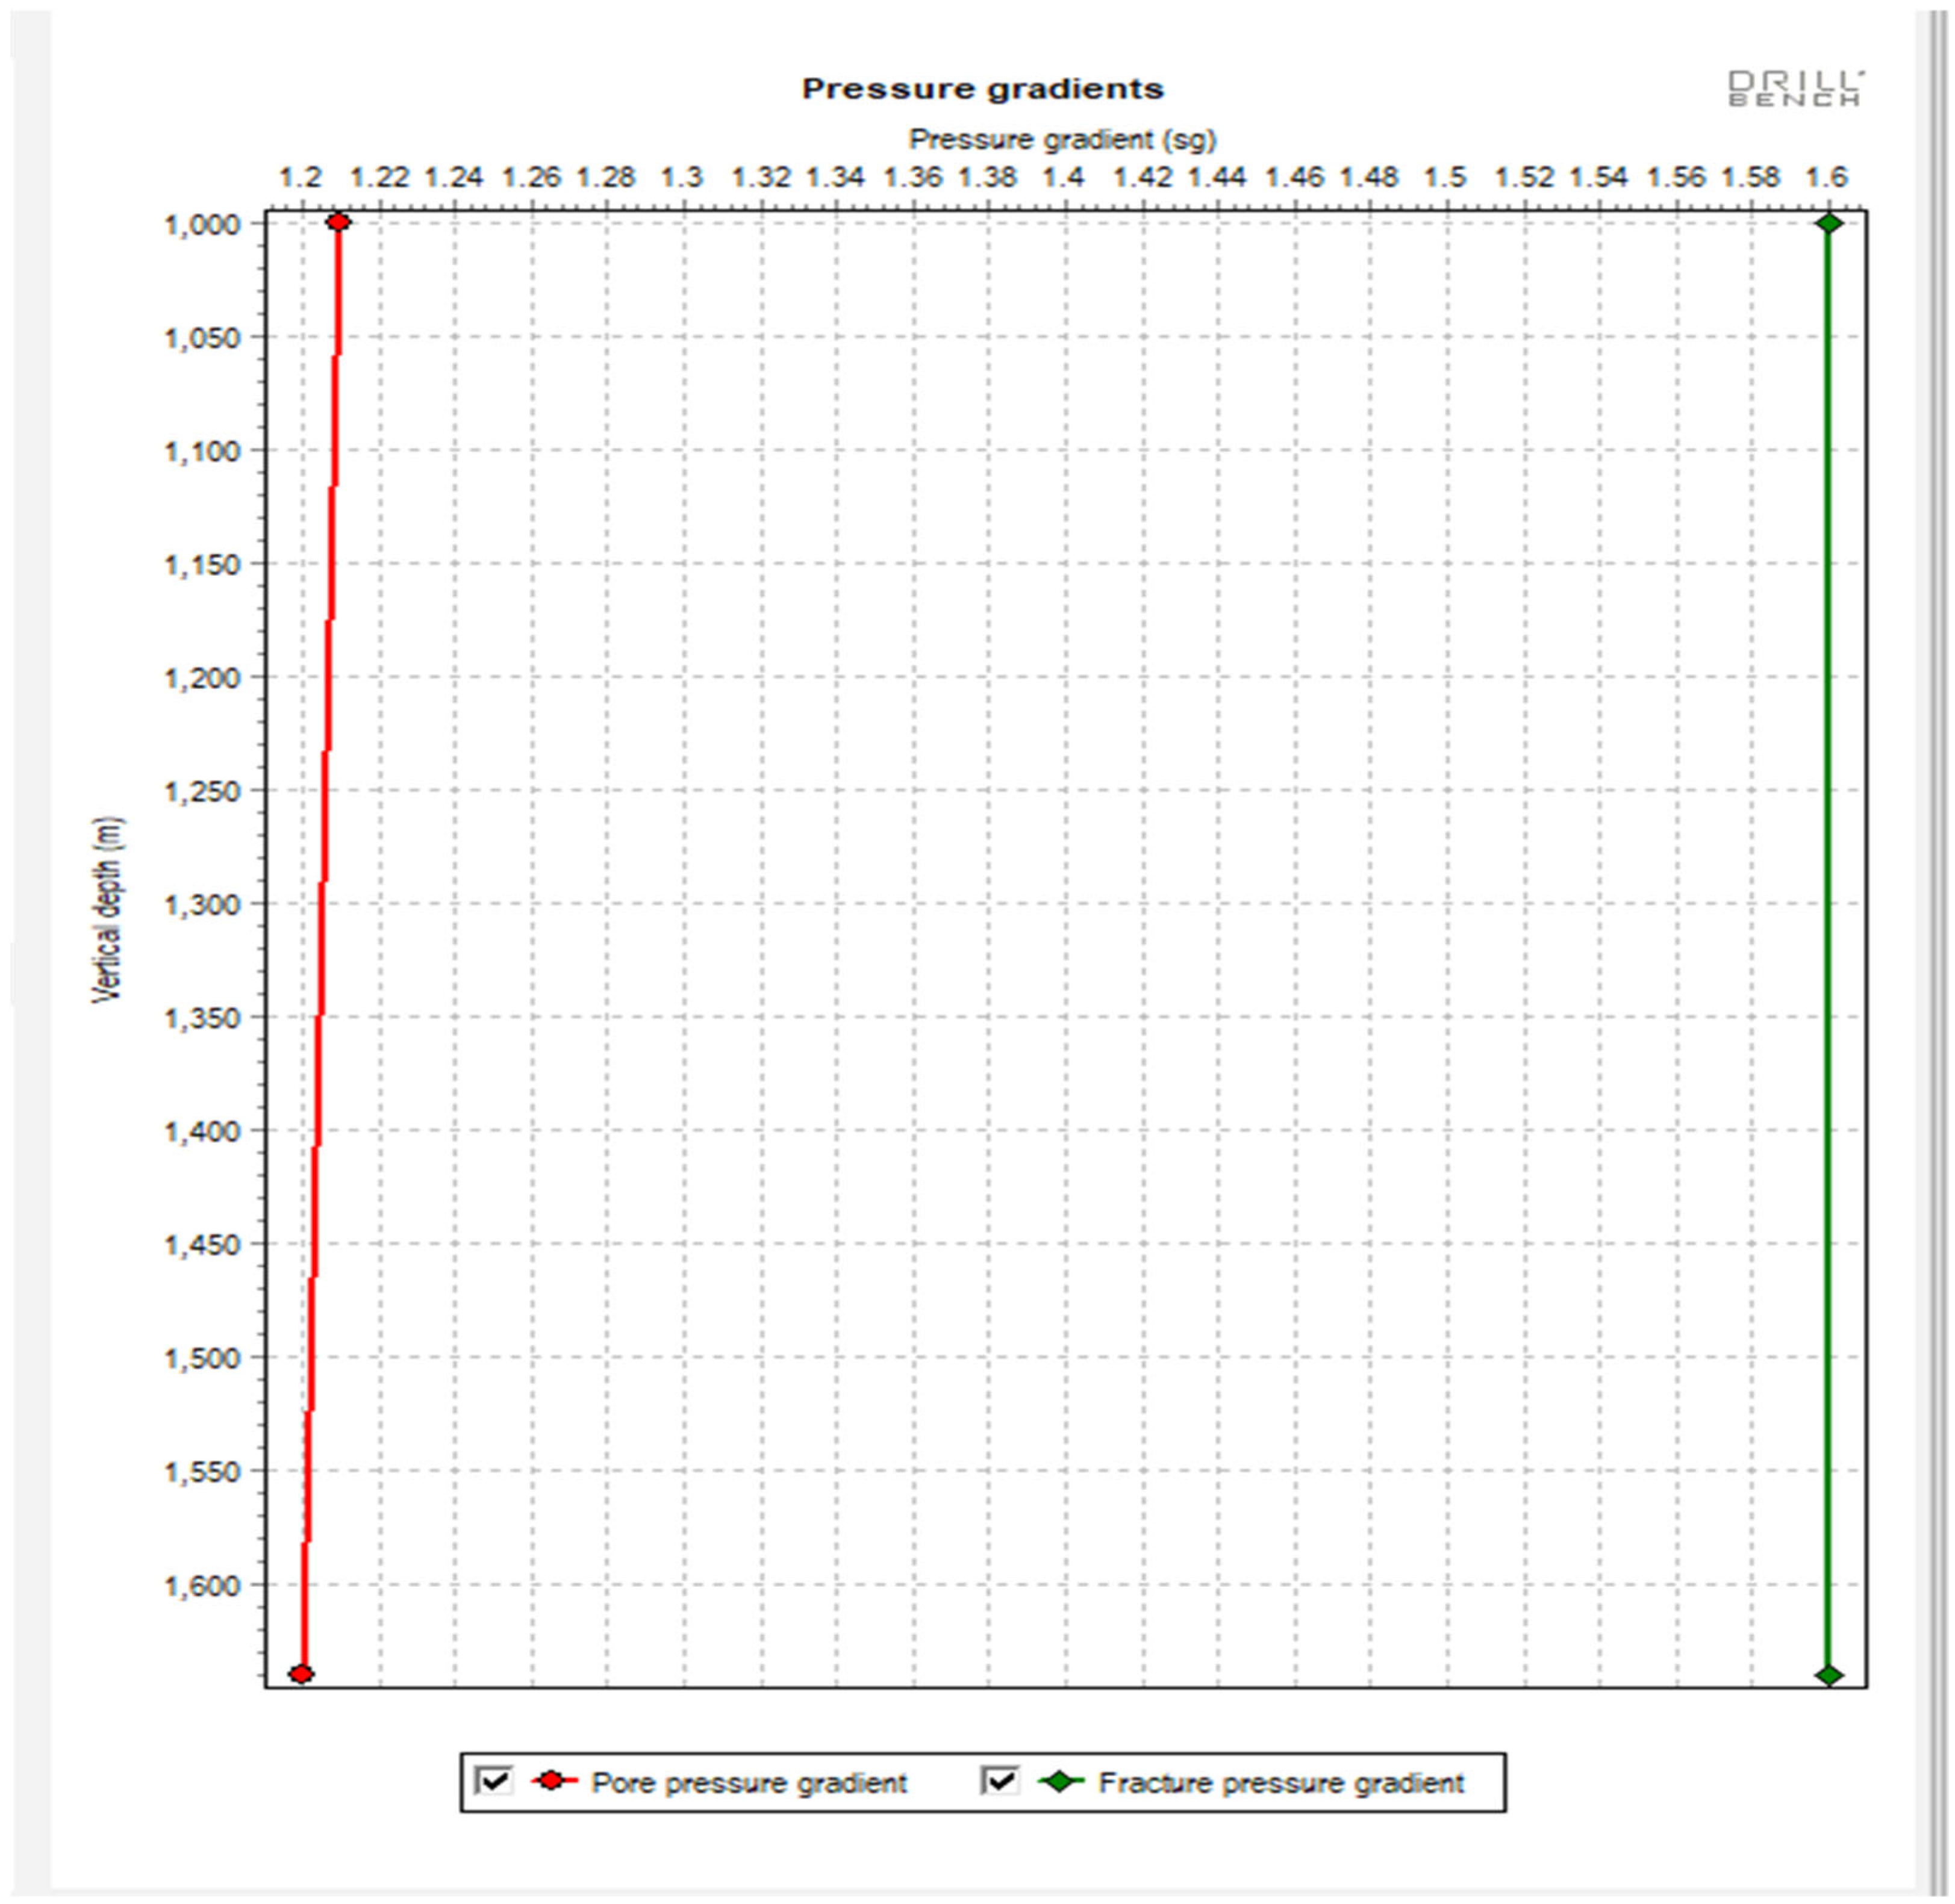
Figure 5 provides pore pressure and fracture gradient profiles used to define operational limits.
2.6. Analysis Protocol
To quantify the impact of the optimization measures, drilling signals were divided into pre-change and post-change intervals. Segmentation was performed by identifying the depth (or time) at which operational parameters (e.g., RPM, pump rate, mud properties) were modified.
Simulation outputs from Drillbench (torque, annular pressure, equivalent circulating density [ECD], and cuttings transport efficiency) were depth-matched to field measurements by aligning simulated measured depth (MD) with recorded bit depth at corresponding time intervals. Cuttings transport ratios and torque values were normalized relative to baseline (pre-change) conditions to allow direct comparison across field and simulated datasets. Sensitivity runs were conducted to test robustness against ±10% uncertainty in mud rheology inputs.
This workflow ensured that improvements observed in field measurements could be directly cross-validated with simulated outputs, providing both statistical confidence in the short-term effects and quantitative consistency across field and model domains.
3. Results and Discussion
3.1. South Pars Field Performance
Implementation of the optimized parameters in the South Pars shale intervals produced substantial improvements in operational performance. Torque spikes, which previously reached approximately 24,000 ft-lb, were reduced to around 7000 ft-lb, while standpipe pressure decreased from 3500 psi to approximately 2500 psi and exhibited less fluctuation. The ROP increased from 5–8 m/h to 9–10 m/h. The observed improvements result from the combination of increased drill string RPM and modified mud properties. Synchronous whirl induced by higher rotation increases secondary flow near the borehole wall, mobilizing cuttings that would otherwise accumulate in stagnant beds. This circulation reduces torsional resistance and stabilizes the drill string, preventing stalls. The addition of sulphonated asphalt to the WBM mitigates shale hydration and cohesive particle agglomeration, while periodic high-viscosity sweeps dislodge residual cuttings without exceeding the allowable ECD. These effects collectively enhance hole cleaning and operational stability.
Figure 6 illustrates the improvements in TQ and SPP after optimization.
3.2. Flow and ECD Considerations
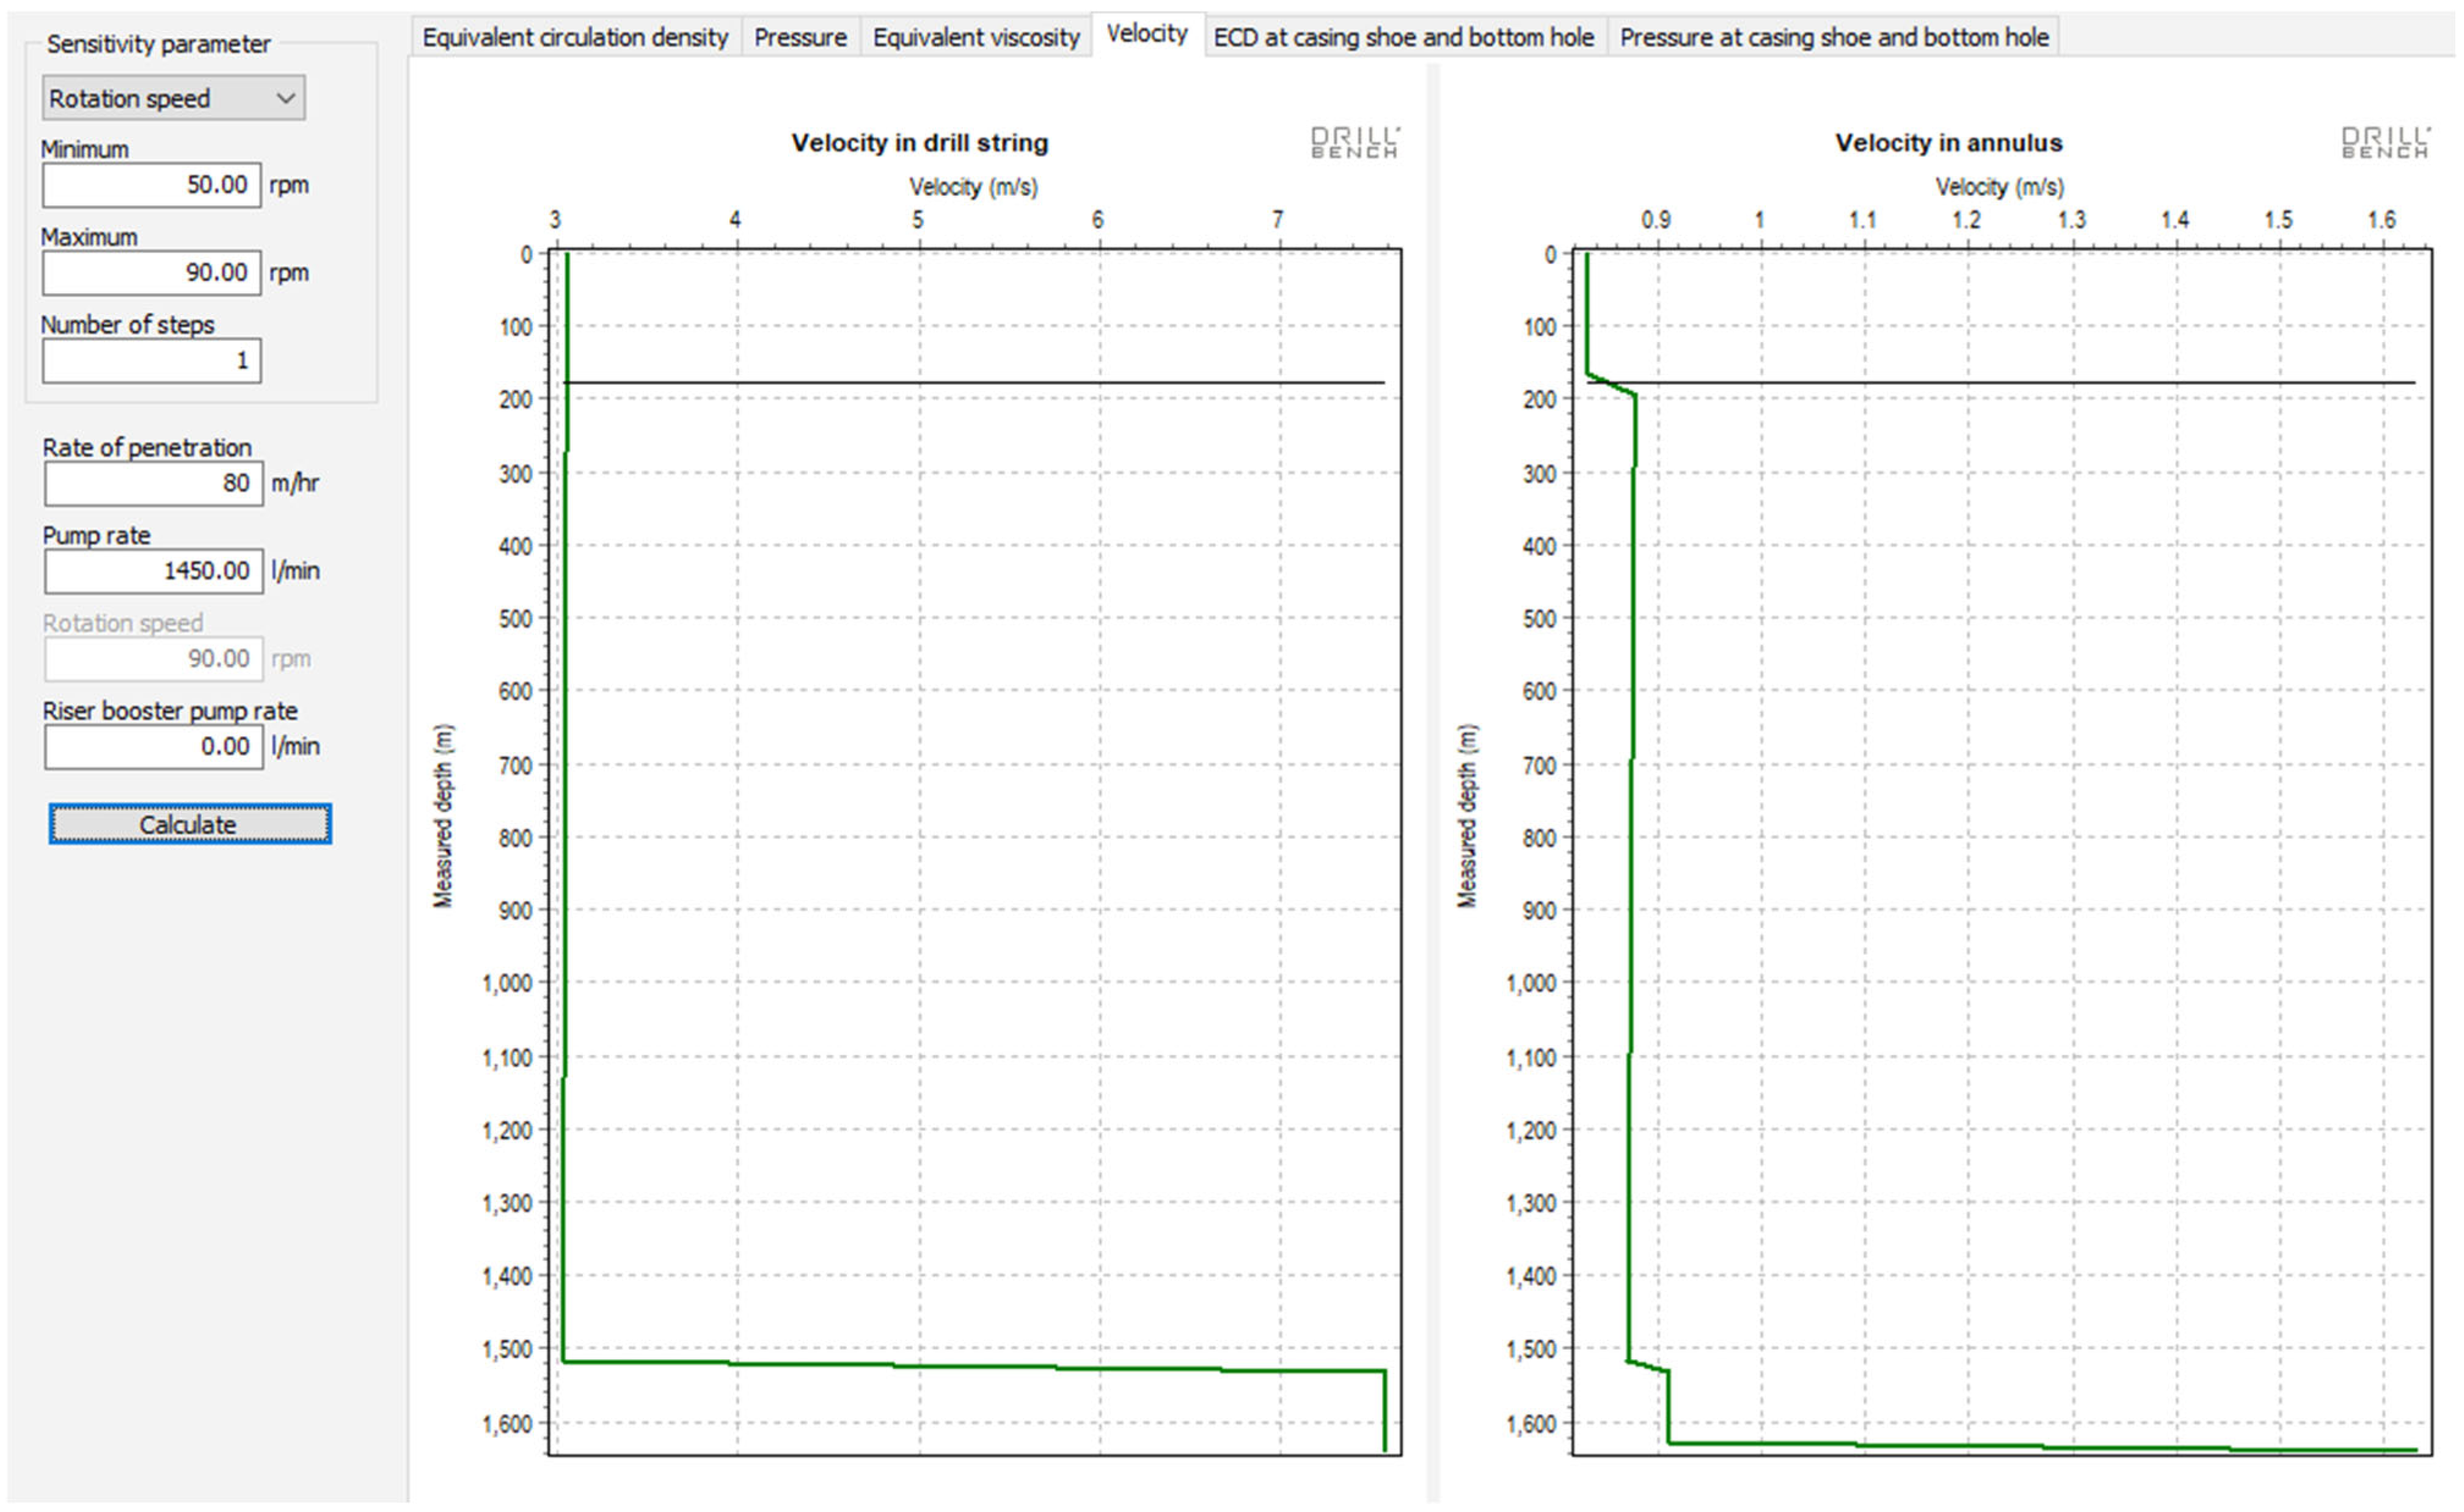
Sensitivity analyses revealed that maintaining an annular velocity of ~0.7 m/s was sufficient to ensure cuttings transport while keeping ECD within the safe operational window between pore and fracture pressures. By partially shifting the burden of cuttings transport from hydraulic flow to rotational motion, the strategy minimizes pressure fluctuations and reduces the risk of inducing fractures. The observed reductions in SPP indicate lower frictional losses in the annulus due to thinner cuttings beds and more homogeneous slurry transport. The result is a safer, more controlled drilling window without compromising efficiency.
Figure 7 shows the sensitivity analysis results.
3.3. Cuttings Transport and Sweep Efficiency
Simulation and field data indicate that synchronous whirl and adjusted rotation significantly enhance sweep efficiency, increasing cuttings transport to above 95% in the modeled build and lateral sections. Simulated ROP reached 60 m/h under a combination of 109 downhole RPM at the bit and 90 RPM at the surface. The approach demonstrates that effective hole cleaning can be maintained with lower pump rates (1420 L/min) compared to baseline operations, reducing energy consumption and associated emissions without compromising mechanical stability. The periodic viscosity sweeps serve to remobilize settled cuttings, preventing reaccumulating in high-inclination zones.
Figure 8 presents the cutting transportation ratio analysis.
3.4. Transferability to the Bakken Formation
While operational challenges in the Bakken mirrored those observed in South Pars field such as shale instability, bit balling, and drag these issues were more pronounced due to the ultralow permeability and organic-rich nature of the Bakken shales. The horizontal intervals exhibited ROP reductions to ~8 m/h, primarily caused by cohesive cuttings beds in build sections. Simulations confirmed that combining increased rotational energy with controlled flow can achieve transport efficiencies similar to those observed in South Pars, but lithologic differences necessitate adaptation of sweep scheduling and rotation profiles.
Beyond the short-term improvements in hole cleaning, the optimized mud system also has implications for reducing near-wellbore formation damage and supporting long-term well integrity. The addition of sulphonated asphalt improved shale inhibition and reduced filtrate invasion, limiting clay swelling and pore throat plugging in the near-wellbore zone. Combined with enhanced cuttings transport (>95%), the strategy reduced the likelihood of fine particle accumulation and filter cake thickening, both of which are known to lower permeability and impair production. By maintaining cleaner wellbores with thinner, less permeable filter cakes, injectivity and productivity are better preserved. Although this study did not include direct core flooding or return permeability tests, the observed operational stability and sustained injectivity in the South Pars wells suggest that the optimized system mitigates typical drilling-induced damage mechanisms such as dispersion, fines migration, and mechanical blockage. Over the long term, these effects are expected to contribute to lower skin values, more efficient hydraulic fracturing, and improved reservoir connectivity, thereby enhancing production performance.
3.5. Operational Implications
The combined field and simulation results support a strategy that balances rotation and flow to maintain efficient cuttings transport while preserving ECD margins. This approach stabilizes torque, reduces SPP fluctuations, prevents stalls, and enhances ROP. By redistributing the cleaning workload from hydraulic flow to mechanical rotation, energy efficiency is improved without compromising well integrity. Although steady-state simulations and simplified mud rheology introduce limitations, the methodology provides a robust framework for developing field-validated drilling strategies in shale formations and for adapting them to diverse geological contexts. Although synchronous whirl demonstrated clear benefits in enhancing cuttings transport and torque reduction, maintaining this controlled mode in real drilling environments presents practical challenges. Drillstring dynamics are highly sensitive to bit–rock interaction, downhole RPM variations, and wellbore eccentricities, making unintended transitions into asynchronous whirl or violent lateral vibrations possible. Such instability can accelerate drillstring fatigue, induce tool joint wear, and elevate the risk of downhole tool failure. In practice, managing whirl requires a combination of real-time downhole vibration monitoring, use of stabilizers and near-bit reamers to reduce eccentricity, and surface control of rotary speed and weight-on-bit within narrow operating windows. Advanced drilling dynamics software and measurement-while-drilling (MWD) tools are increasingly applied to identify whirl onset and allow proactive parameter adjustment. Acknowledging these risks, the application of synchronous whirl should be considered a controlled technique requiring active monitoring and conservative operational limits to balance improved hole cleaning against potential mechanical damage.
3.6. Risk Reduction Analysis
The operational improvements achieved particularly the 70% torque reduction, stable ECD, and increased cuttings transport efficiency have direct implications for drilling risk mitigation. High torque and unstable annular pressure are known precursors to stuck pipe, wellbore collapse, and well control events. By reducing torque from ~24 to 7 klbf·ft, the probability of drillstring stalls and mechanical sticking is significantly lowered, decreasing the likelihood of stuck-pipe incidents. Maintaining ECD within the safe operational window minimizes surge and swab pressures, thereby reducing the risk of kicks and lost circulation. Enhanced cuttings transport (>95%) mitigates the accumulation of cuttings beds that can contribute to wellbore collapse or differential sticking.
Table 7 summarizes the main parameter changes and their associated risk reduction mechanisms.
3.7. Rheology Consistency and Limitations
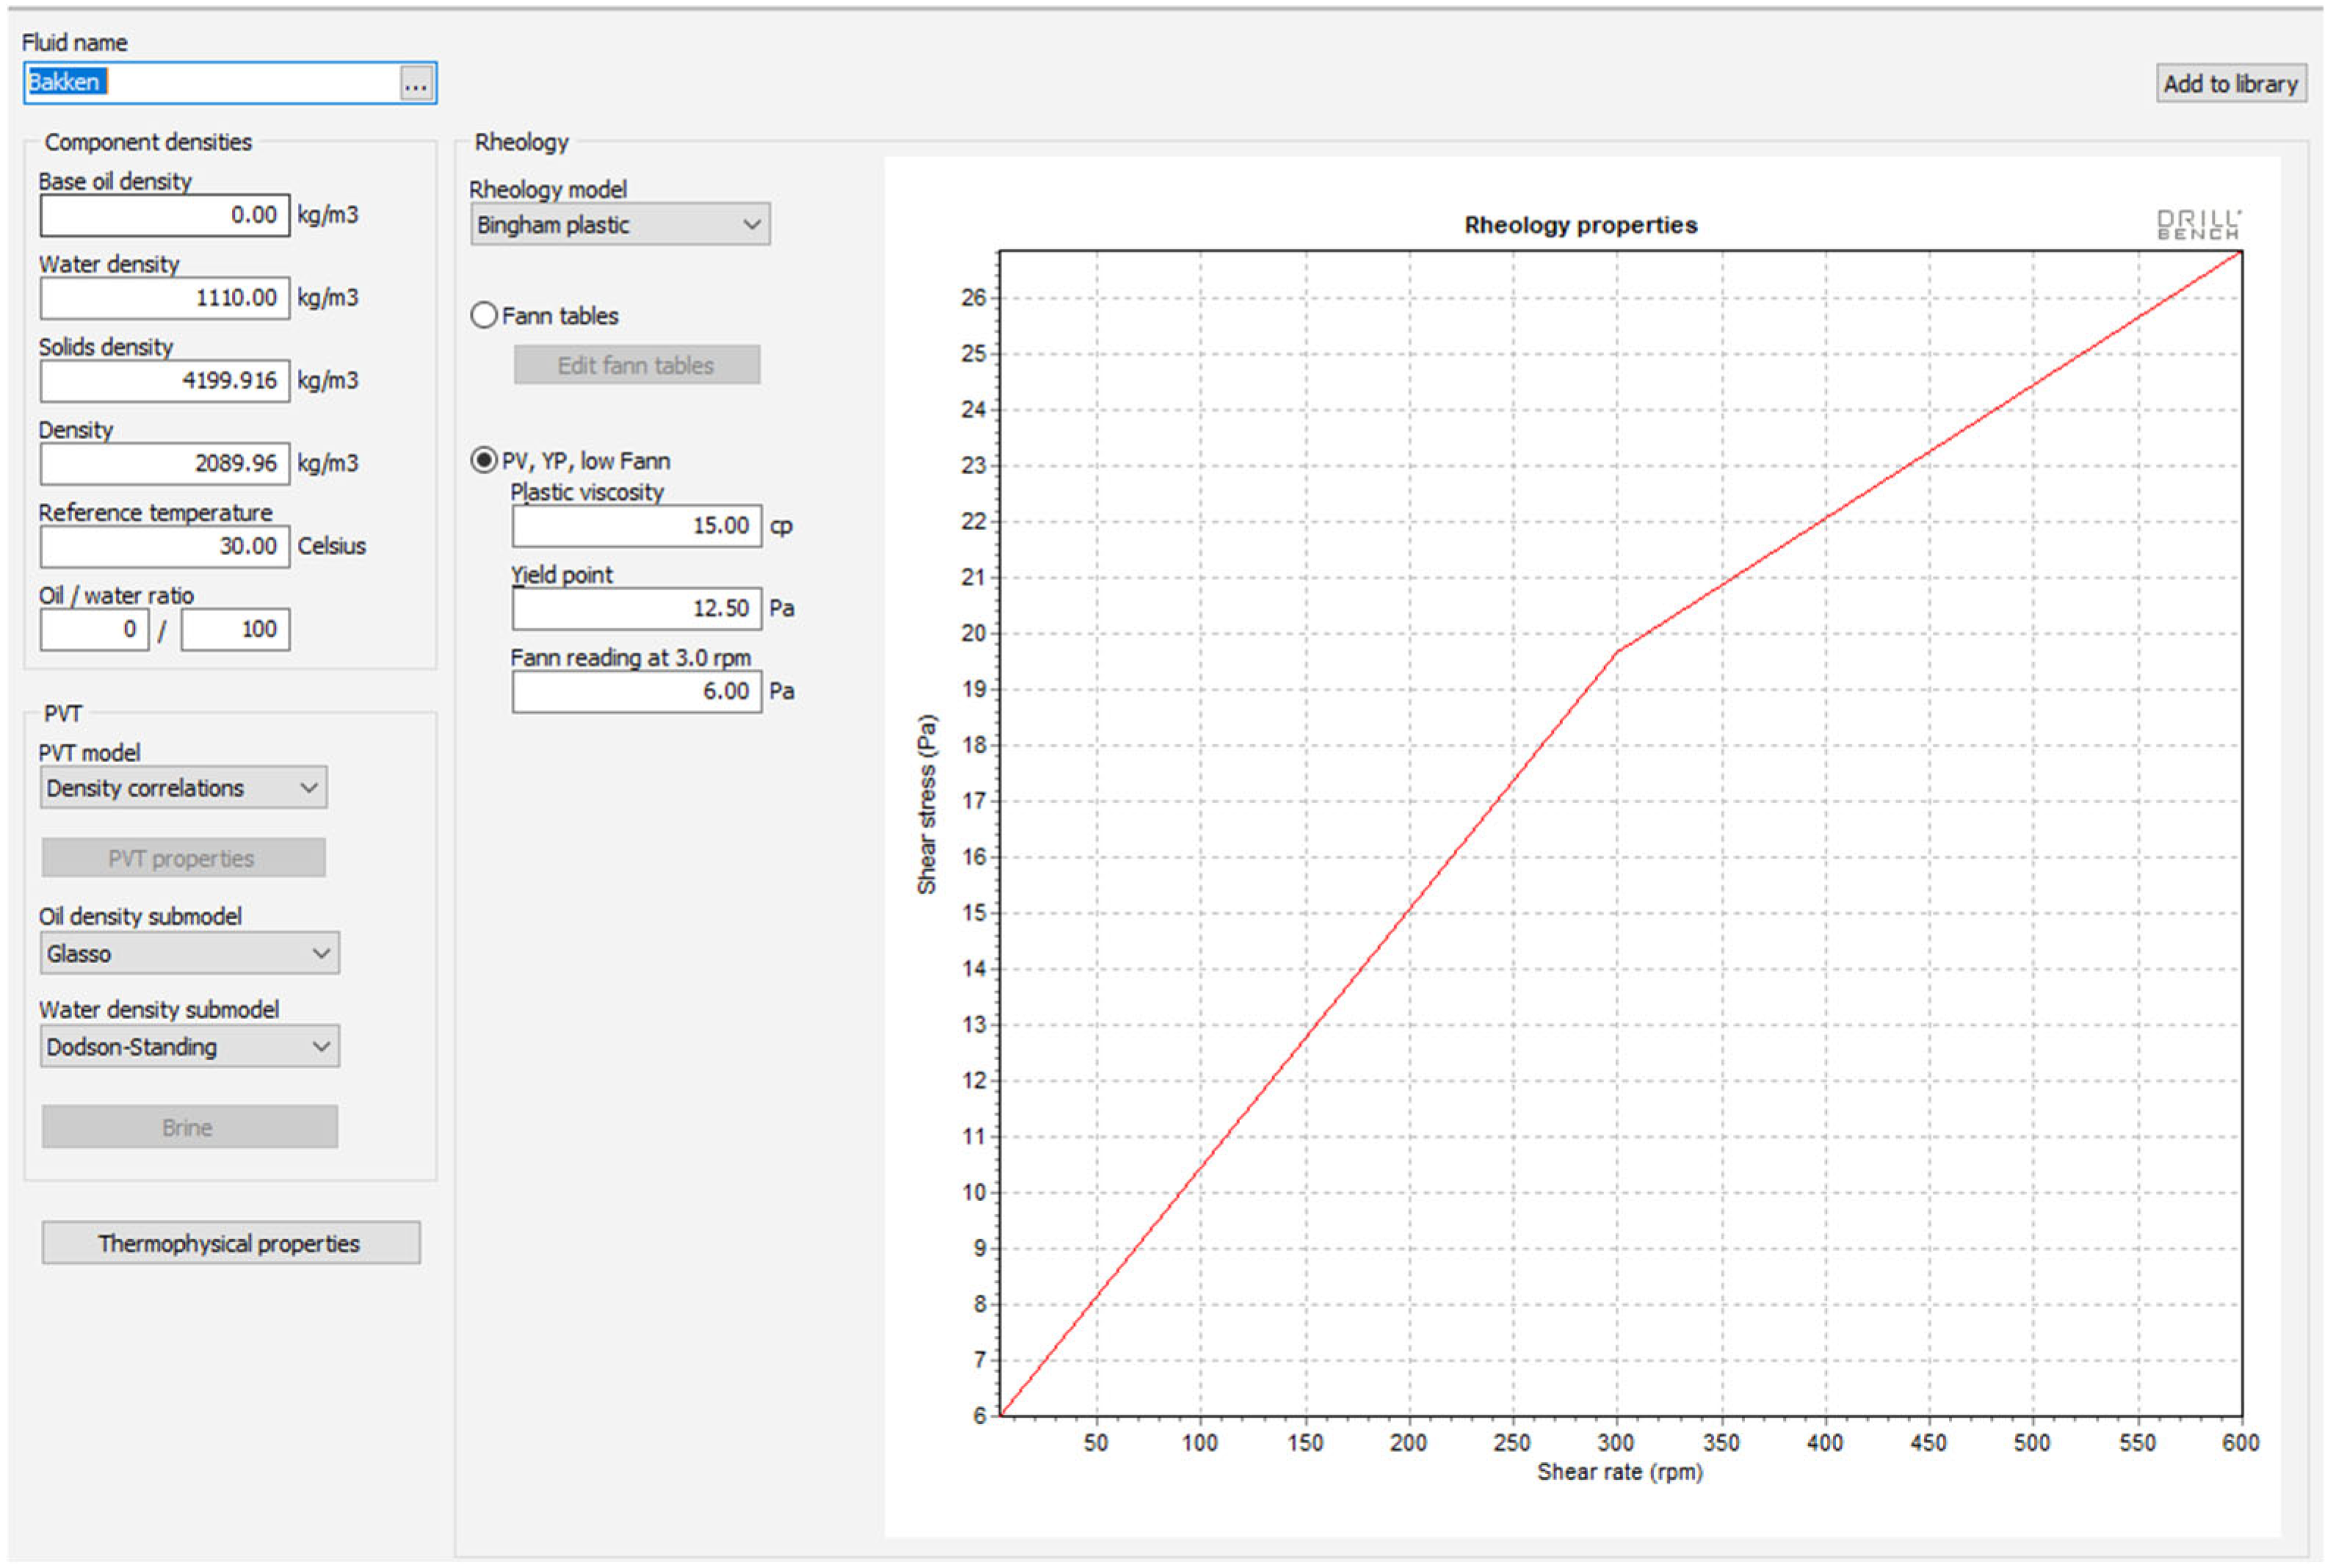
The rheological properties defined in the Drillbench simulations were based on a Bingham plastic model with a plastic viscosity (PV) of 15 cP, a yield point (YP) of 12.5 Pa, and a low-shear Fann reading of 6 Pa at 3 rpm. The resulting shear stress versus shear rate curve (
Figure 9) shows a near-linear increase from approximately 6 Pa at low shear to over 26 Pa at 600 rpm, which reflects the stable, slightly shear-thinning behavior typical of water-based mud systems used in shale drilling.
These simulated rheological parameters closely match the field rheology data recorded during the Bakken drilling operation (
Table 4), where viscosity progressively increased from 29 s at shallow depths to 122 s in deeper sections, density rose from about 1000 kg/m
3 to 1125 kg/m
3, and pH was maintained between 9.0 and 10.0. The field data also showed controlled fluid loss (~8–12 mL) and thin filtercake (~1.3 mm), which confirms that the actual mud behaved as a low-yield Bingham plastic fluid consistent with the simulation assumption. This agreement supports the validity of the selected rheology input for reproducing the annular flow and cuttings transport behavior observed in the field.
Nonetheless, the present simulation framework relies on steady-state assumptions and does not capture time-dependent rheological effects such as gel strength development during static periods, thixotropy, or transient surge/swab pressures caused by pipe movement. A transient model could represent cyclic variations in equivalent circulating density (ECD) and the buildup/breakdown of gel structure during flow stoppages, which might cause short-lived torque spikes or pressure surges not visible in the steady-state results. Such effects could narrow the predicted operational safety margins for both ECD and torque.
Therefore, it is important to incorporate transient hydraulic–mechanical simulations that explicitly model gel strength recovery, surge/swab dynamics, and cuttings settling–resuspension cycles. This would provide a more conservative, time-resolved assessment of hole cleaning efficiency and operational risk during non-circulating events. Despite these limitations, the strong agreement between the simulated and measured rheological behavior demonstrates that the steady-state approach provides a reliable baseline for defining safe and efficient drilling parameters, while highlighting opportunities for refinement through time-dependent modeling.
Figure 9 shows the rheology curve generated in Drillbench for the Bakken mud system used in the simulation.
3.8. On the Simulated ROP Increase and Comparison to Field Ranges
Typical field ROPs in Bakken horizontal sections reflecting bit wear, formation heterogeneity, operational limits on downhole RPM and WOB, and transient events are commonly observed to be in the order of single tens of meters per hour (for example, ranges near 8–20 m/h in the data used for calibration in this study). When the simulation is re-run under conservative, field-constrained conditions (including realistic bit wear, limits on allowable WOB/RPM to prevent excessive torque and vibration, and reduced formation strength zones), the predicted ROP gain shrinks substantially and falls into a more conservative range that is consistent with observed field performance. Consequently, the 60 m/h result should be interpreted as a best-case upper bound achievable under ideal, steady-state conditions rather than a guaranteed field outcome.
To address this uncertainty and provide more realistic performance expectations, we recommend and plan to perform (a) sensitivity simulations that include bit wear models, reduced bit efficiency, and conservative RPM/WOB ceilings, and (b) transient simulations that incorporate non-circulating periods, surge/swab effects, and gel recovery. These steps will produce a narrower, more actionable interval for expected ROP gains and will quantify how much of the simulated improvement can be realized in practice.
3.9. Economic Considerations
The operational improvements demonstrated in this study have direct economic implications. The reduction in torque-related stalls and stuck-pipe risks translates into fewer unplanned tripping events and lower Non-Productive Time (NPT). Based on industry averages, stuck-pipe incidents can cost upwards of USD 500,000 per event, while each additional day of drilling in shale laterals may exceed USD 50,000–80,000 in rig costs. The observed ~70% torque reduction and improved hole cleaning efficiency therefore represent significant potential savings by reducing downtime and extending bit life. Similarly, the 20–25% increase in ROP achieved in the South Pars trial corresponds to several days of saved rig time for a typical 1500–2000 m horizontal interval, yielding cost reductions in the order of USD 0.5–1.0 million per well.
However, these savings must be balanced against potential additional costs. The use of sulphonated asphalt increases mud cost by approximately 5–10%, though this is generally marginal compared to the savings from avoided NPT. Higher RPM operations can accelerate drillstring and downhole tool wear, potentially increasing replacement or maintenance costs. Overall, the economic analysis suggests that the net benefit is strongly positive: modest incremental fluid or equipment costs are outweighed by the substantial reductions in rig time and lost-time events, strengthening the case for adopting the optimized parameters in both South Pars and Bakken drilling programs.
4. Conclusions
This study demonstrated that targeted optimization of drilling parameters and mud properties can substantially improve hole cleaning, torque control, and drilling productivity in ultralow-permeability shale formations, using an integrated field–simulation framework combining real-time South Pars field data with Drillbench simulations in the Bakken Formation.
4.1. Technical Outcomes
In the South Pars field trial, increasing drillstring rotation to 90 RPM and circulation to 1100 GPM reduced surface torque by ~70% (from 24 to 7 klbf·ft), increased the rate of penetration (ROP) by ~25% (from 8 to 10 m/h), and decreased standpipe pressure from 3500 to 2500 psi. The optimized water-based mud (9–10.2 ppg, 29–35 cP) with 2 wt.% sulphonated asphalt achieved ~95% cuttings transport efficiency and reduced ECD fluctuations, improving borehole stability. Simulations applying these parameters in the Bakken yielded consistent improvements: torque reduction of ~72% (20 to 5.6 klbf·ft), cuttings transport efficiency >95%, and simulated ROP gains from 15 m/h (baseline) to up to 60 m/h under idealized steady-state conditions. Conservative field-constrained estimates suggest achievable ROP gains of ~15–25 m/h.
4.2. Practical Recommendations
From the findings of this study, it is recommended to adopt a systematic approach when drilling the build section of horizontal wells in shale formations to balance drilling efficiency with long-term reservoir performance. The use of water-based mud with moderate density and viscosity, supplemented by shale inhibitors such as sulphonated asphalt, can effectively reduce hydration and maintain cuttings transport capacity. Optimizing drillstring rotation and circulation rates within ranges that promote controlled whirl and stable annular velocities is also suggested to enhance hole cleaning and minimize torque. Periodic use of high-viscosity sweeps further supports efficient solids removal, while real-time monitoring of downhole parameters (torque, annular pressure, and standpipe pressure) allows timely adjustment of operating conditions to avoid instability. Collectively, these practices provide a transferable framework for improving drilling efficiency, reducing operational risks, and establishing better wellbore conditions that benefit both immediate productivity and future enhanced recovery operations.
4.3. Limitations and Future Works
It should not be left unmentioned that the simulations used steady-state assumptions and simplified Bingham plastic rheology, which do not capture transient effects (surge/swab, gel buildup, thixotropy) or bit wear. The 60 m/h ROP result represents an idealized upper bound and may not be fully achievable under field constraints. Lithological differences between South Pars (carbonate-shale) and Bakken (organic-rich shale) may require localized calibration of sweep frequency and downhole RPM. Future research should incorporate transient hydraulic–mechanical modeling, bit wear effects, and stochastic formation variability to better quantify uncertainty and operational risk.
Overall, this study provides a transferable framework and field-calibrated parameter set to enhance drilling performance in ultralow-permeability shale reservoirs, while outlining clear operational guidelines and highlighting areas where further refinement is needed to ensure robust field implementation.
