Abstract
Ultra-deep tight sandstone gas reservoirs are key targets for natural gas exploration, yet their pore structures under high temperature, pressure, and stress greatly affect gas occurrence and flow. This study investigates representative reservoirs in the Kelasu structural belt, Tarim Basin. Porosity–permeability were measured under in situ conditions, and multi-scale pore structures were analyzed using thin sections, a SEM, mercury intrusion, and nitrogen adsorption. The results show that (1) the median permeability of cores at an ambient temperature and a confining stress of 3 MPa is 13.33–29.63 times that under the in situ temperature and pressure conditions. When the core permeability is lower than 0.1 mD, the stress sensitivity effect is significantly enhanced; (2) nanopores and micron-fractures are well developed yet exhibit poor connectivity. The majority of a core’s porosity is derived from the intergranular pores in clay minerals; (3) the volume of nano-sized pores within the 100 nm diameter range is mainly composed of mesopores, with an average proportion of 73.37%, while the average proportions of macropores and micropores are 22.29% and 4.34%, respectively; (4) full-scale pore sizes show bimodal peaks at 100–1000 nm and >100 μm, which are poorly connected; (5) the pore structure exhibits distinct fractal characteristics. The fractal dimension Df1 (2.65 on average) corresponds to the larger pore diameters of the primary intergranular pores, residual intergranular pores, and intragranular dissolution pores. The fractal dimension Df2 (2.10 on average) corresponds to the grain margin fractures, micron-fractures and partial throats. The pore types corresponding to the fractal dimensions Df3 (2.36 on average) and Df4 (2.58 on average) are mainly intercrystalline pores of clay minerals and a small number of intraparticle dissolution pores. These findings clarify the pore structure of ultra-deep tight sandstones and provide insights into their gas occurrence and flow mechanisms.
1. Introduction
Tight sandstone gas resources are globally abundant and widely distributed, constituting a critical component of unconventional natural gas exploration and development. The efficient development of tight sandstone gas reservoirs is of significant practical importance for optimizing the global energy system and achieving the targets of carbon peak and carbon neutrality [1]. The substantial gas resources are hosted in the deep (4500–6000 m) and ultra-deep (>6000 m) tight sandstone reservoirs, which represent the primary focus for future exploration and production. For instance, in China, deep and ultra-deep gas resources account for 49% of the total natural gas endowment. However, compared with the gas reservoirs shallower than 4500 m, the proven recovery rate of hydrocarbons in the deep and ultra-deep formations remains considerably low. This low recovery efficiency is largely attributed to the insufficient understanding of their reservoir properties, especially the pore structure that fundamentally controls hydrocarbon occurrence and fluid flow [2,3].
The ultra-deep tight sandstone gas reservoirs typically exhibit intense compaction and late-stage diagenesis, resulting in a dense matrix dominated by micron–nanoscale pores with strong heterogeneity that significantly impedes fluid flow. Accurate characterization of these complex pore structures is therefore essential for clarifying reservoir quality and flow mechanisms. The qualitative and quantitative methods of the pore structure measurement for such dense rocks can mainly be classified into three categories: (1) direct observation methods: Scanning Electron Microscope (SEM) [4], Thin Section (TS) [5], etc.; (2) fluid injection method: High-Pressure Mercury Injection (HPMI) [6], Low-Pressure Nitrogen Adsorption (LPNA) [7], Nuclear Magnetic Resonance (NMR) [8], etc.; (3) indirect observation method: Magnetic Resonance Imaging (MRI) [9], Computed Tomography (CT) [10], etc. The above methods can directly or indirectly obtain the morphology and related parameters of the pore structure, but they also have limitations in terms of measurement accuracy and applicable scale. For instance, HPMI may artificially cause the expansion of nanopores (<100 nm) under high intrusion pressures, leading to distorted results within certain pore size ranges. LPNA (0.35–120 nm) fails to characterize micron-scale pores dominating fluid flow [11,12]. By integrating these analytical methods according to different experimental objectives and spatial scales, the limitations of individual techniques can be overcome, enabling comprehensive characterization of reservoir pore structures across the full pore sizes. This integrated approach can provide more precise and holistic theoretical foundations for the efficient development of tight sandstone gas reservoirs [13,14].
The fractal theory was first proposed by Mandelbrot in 1967 to describe the strongly heterogeneous structures with self-similarity widely existing in nature, quantifying structural complexity through the key parameter of fractal dimension [15]. Because pore systems in tight sandstones are highly heterogeneous and span multiple scales, fractal theory provides a suitable framework for quantitatively evaluating their structural complexity and connectivity. The most prominent feature of the fractal theory is that it is not affected by the scale and can describe the distribution laws from nanoscale to micron-scale pore structure. It characterizes the overall features through local structural characteristics and has a natural advantage in the study of pore structure in tight rocks. It is widely used to characterize the spatial distribution, heterogeneity, and multi-scale structural features of pores and throats. It is particularly suitable for the pore structure characterization of the ultra-deep tight sandstone, and has unique theoretical advantages and engineering value [16,17,18,19]. The main methods for calculating the fractal dimension of pore structure include the box counting method, the Frenkel–Halsey–Hill fractal model and fractal models based on HPMI, etc. Li (2010) [20] established the Brooks–Corey equation through the fractal theory of porous media, with comparative analysis of three fractal models applied to identical cumulative pore-size distribution curves for fractal dimension quantification. The results demonstrated good consistency among these models and confirmed their capability for the quantitative assessment of pore structure heterogeneity [20]. The pore structure and fractal characteristics of four synthetic cores with distinct petrophysical properties were studied by MRI and the box counting method [9]. The results show that the fractal dimensions calculated by the box counting method can effectively distinguish the four synthetic cores. The relationship between the porosity, permeability, and fractal dimension of the samples can be characterized by empirical formulas. Through comprehensive analysis of LPNA data [21], the fractal characteristics of the pore structures of five shale samples in the Ordos Basin were investigated using the FHH fractal model. The relationship between pore parameters and fractal dimensions was systematically analyzed. The study confirmed pronounced fractal characteristics in the target shales, predominantly influenced by mesopore (2 nm < D < 50 nm) and macropore (D ≥ 50 nm).
The Tarim Basin hosts globally significant ultra-deep tight sandstone gas resources, with proven hydrocarbon reserves in these formations increasing from 66% in 2000 to 92% in 2013 [2]. The Kalasu structural belt of the Kuqa piedmont zone is located in the northern part of the Tarim Basin and the southern edge of the Tianshan Mountains. Its primary producing zone is the Bashijiqike Formation of the Cretaceous system. The reservoirs buried at a depth of 5500–8200 m in the above region are the typical ultra-deep tight sandstone gas reservoirs. It is the key areas for the exploration and development of ultra-deep tight sandstone gas in the Tarim Basin [3]. However, most previous studies on tight sandstones have focused on shallow or moderately deep reservoirs, and the pore structure characteristics of ultra-deep tight sandstones remain poorly understood, particularly regarding their full-scale pore size distributions and fractal features [22,23,24,25]. This knowledge gap limits our understanding of reservoir quality and fluid flow in ultra-deep formations. This paper takes the ultra-deep tight sandstone reservoirs in the Kalasu structural belt of the Tarim Basin as the research object. The pore structure morphology of tight sandstones was directly characterized using TS and SEM. The pore size distribution of the samples was analyzed by HPMI and LPNA methods, yielding the full pore size distribution curves. Fractal dimensions were calculated using a 2D parallel capillary model and the FHH fractal model, with the subsequent classification of fractal characteristics. The integrated analysis of these results provides qualitative evaluation of fractal features across different pore structures. The findings of this paper advance the fundamental understanding of pore structure characteristics, which is beneficial for the efficient development of ultra-deep tight sandstone gas reservoirs.
2. Experimental Materials and Methods
2.1. Experimental Materials
The cylindrical tight sandstone matrix samples (Figure 1) were collected from representative sections of the Kalasu structural belt (Bozi, Dabei, and Keshen sections) and typical wells. The sampling areas belong to the Cretaceous Bashijiqik Formation, with burial depths from 5838.1 to 6957.5 m, representing ultra-deep tight sandstone gas reservoirs. Prior to the experiments, the samples underwent thorough cleaning using toluene and methanol to remove the hydrocarbons and salts, followed by oven-drying. The dried samples were then weighed, and their lengths and diameters were measured. Porosity and permeability measurements were conducted under a 3 MPa net confining pressure. The basic parameters of the experimental samples are presented in Table 1.
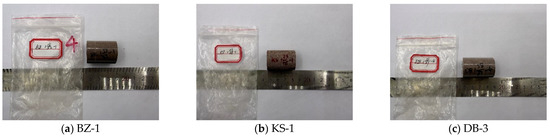
Figure 1.
Photographs of ultra-deep tight sandstone samples.

Table 1.
Fundamental physical properties of samples.
2.2. Experimental Methods
The experimental methods employed to investigate the pore structure of tight sandstones in the study area mainly include TS, SEM, HPMI, and LPNA. These methods were selected because they are complementary in characterizing pore structures across different scales: SEM and TS can directly observe the morphology of micron-scale pores and fractures; HPMI effectively characterizes the distribution of larger pores and throats (D > 100 nm); and LPNA is highly sensitive to nanopores (D < 100 nm). The combination of these techniques allows for a comprehensive and accurate characterization of the full-scale pore structure of ultra-deep tight sandstones.
2.2.1. Porosity and Permeability Measurement
The porosity and permeability of the nine core samples were measured using the PKEH-A1 high-temperature/high-pressure core multi-parameter analyzer developed by the authors. Measurements were conducted under effective stress at 25 °C and 3 MPa, respectively, and under in situ temperature and effective stress (121.0 °C and 40.5 MPa for the Bozi section; 170.0 °C and 32.6 MPa for the Keshen section; 112 °C and 46.3 MPa for the Dabei section). The high-purity nitrogen served as the measurement medium.
2.2.2. TS and SEM Measurement
The pore structure morphology and distribution of the samples were directly characterized by the TS and SEM. The applicable pore size range of the TS is from 0.2 to 500 μm, the specific experimental methods of which were shown as follows:
Under vacuum conditions, colored epoxy resin was injected into the samples. After the resin solidification, the samples were ground into 25 mm-diameter rock thin sections and mounted on glass slides. The pore structures and rock components in the prepared TS were observed using polarized light microscopy.
The microscopic pore structure within the pore size range of 2 nm–10 μm was examined by using ZEISS Sigma 360 SEM (Carl Zeiss Microscopy GmbH, Jena, Germany). The sample preparation protocol included the following:
Before observation, the rock samples were prepared into block samples with a length, width and height of 10 mm × 10 mm × 5 mm, respectively. The fresh fracture surfaces were used as observation planes. Furthermore, considering that the rock samples are weak conductors, the electron charging would occur under SEM electron beam irradiation, significantly affecting the imaging quality. Therefore, gold coating treatment should be carried out on the observation surface prior to imaging to enhance the conductivity of the samples [26].
2.2.3. HPMI and LPNA Measurement
HPMI and LPNA can characterize the pore structure of samples by analyzing the detailed parameters during the fluid injection process. HPMI measures mercury intrusion volumes at varying pressures. Theoretically, it can calculate pore structure parameters within a pore size range of 950 μm, including porosity, pore size distribution, and average pore size. Additionally, critical parameters, such as maximum throat radius and median throat radius, can be derived from the displacement pressure and median intrusion pressure measurements. In the HPMI experiment of this paper, the Micromeritics-AutoPore V 9620 fully automatic mercury injection instrument was employed. During the experiment, parameters such as mercury injection pressure and mercury injection volume increment during the process of mercury injection into the sample were recorded. The maximum mercury intrusion pressure in this experiment was 32,929.21 psia (227.13 MPa). However, for pores with a diameter smaller than 100 nm, extreme injection pressures may induce fracturing or compaction. Furthermore, fluid flow in the nanopores deviates from the conventional behavior due to pronounced wall effects, causing the capillary pressure equation derived at macroscopic scales to become inapplicable. This fundamental discrepancy consequently introduces errors into experimental measurements [12].
Consequently, LPNA serves as an effective complementary method for characterizing pore structures with diameters smaller than 100 nm. LPNA was conducted to obtain nitrogen adsorption and desorption isotherms. It enables the quantification of nanoscale pore volume, average pore diameter, and specific surface area through BET and BJH theories. In the experiments in this paper, a MicromeriTIC-ASAP 2460 (Micromeritics Instrument Corporation, Norcross, GA, USA) fully automatic specific surface area and porosimetry analyzer was employed to measure the nitrogen adsorption and desorption isotherms at 77.35 K, characterizing the nanoscale pore structure (1.7 nm ≤ D ≤ 111.3 nm). The experimental data were processed by methods such as the BET method (Brunauer–Emmett–Teller method) and the BJH method (Barrett–Joyner–Halenda method) [27].
3. Results
3.1. Porosity, Permeability, and Full-Scale Pore Size Distribution
The porosity and permeability measurements of the samples are presented in Table 2. The porosity of the tight sandstone samples in the study area measured at 25 °C and an effective stress of 3 MPa was 2.46–6.53% (4.04% on average). The permeability was 0.0113–0.0292 mD (0.0187 mD on average). Under in situ temperature and in situ effective stress, the measured porosities varied from 2.20 to 6.39% (3.76% on average), with permeabilities from 2.57 × 10⁻⁴–41.67 × 10⁻⁴ mD (13.82 × 10⁻⁴ mD on average). Given the limited sample size (n = 9, number of replicates = 3), the Spearman rank correlation coefficient was employed to evaluate the correlation between porosity and permeability measured under the two experimental conditions, with statistical significance assessed using t-distribution approximation [28]. The calculation shows that = 0.392 < 0.500, p = 0.09 > 0.05, which indicates a weakly positive correlation between the porosity and permeability of the samples, though without statistically significant association.
Table 2.
The porosity and permeability of samples.
Based on the LPNA results and the BJH theory, the pore size–pore volume relationship was quantitatively characterized [27]. The results indicate that the pore volumes of the samples with pore diameters smaller than 100 nm are predominantly mesopores (2 nm < D < 50 nm), with an average proportion of 73.37%. The average proportions of macropores (50 nm < D < 100 nm) and micropores (D < 2 nm) are 22.29% and 4.34%, respectively (Table 3). Analysis of the nitrogen adsorption–desorption isotherms (Figure 2) reveals Type H3 hysteresis loops according to IUPAC classification, indicating the presence of slit-shaped pores, fractures, and wedge-type structures with open ends in the sample with pore diameter smaller than 100 nm. The capillary pressure curves of the samples obtained by analyzing the HPMI results are shown in Figure 3. Morphically, the sample curves demonstrate steeply inclined profiles with constrained plateau segments, indicating the poorly sorted pore-throat distributions dominated by the smaller throats. Moreover, the pronounced mid-curve pressure drop, and reduced mercury withdrawal efficiency are primarily attributed to the restricted pore connectivity. The trapped mercury in the large pores cannot be discharged through the throat with smaller pore diameters, consequently impairing fluid flow capacity.
Table 3.
The proportion of the pore volume of pores with D < 100 nm.
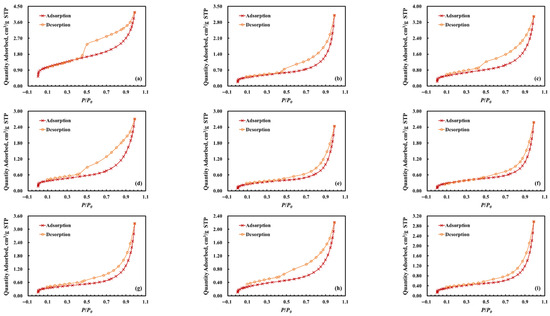
Figure 2.
N2 adsorption and desorption isotherms of samples. (a) BZ-1; (b) BZ-2; (c) BZ-3; (d) KS-1; (e) KS-1; (f) KS-1; (g) DB-1; (h) DB-2; (i) DB-3.
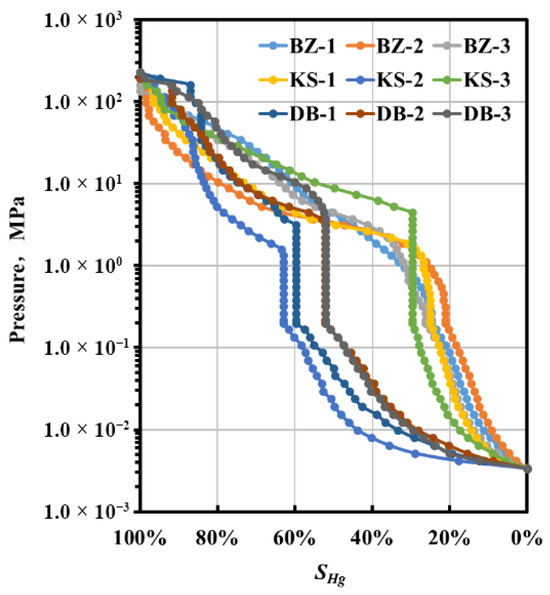
Figure 3.
Mercury injection pressure vs. mercury saturation.
Combining the experimental results of LPNA and HPMI, the total pore size distribution of the samples was jointly characterized. The relationship between the pore size and the proportion of pore volume is shown in Figure 4. The curves indicate the obvious bimodal distribution. The left peak is concentrated in the range of 100–1000 nm (accounting for 34.92% on average), and the right peak is concentrated in above 100 μm (accounting for 25.26% on average). Based on the observation results of the TS and SEM, it can be inferred that the pores with D > 100 μm correspond to the larger pore diameters of the primary intergranular pores, residual intergranular pores and intergranular dissolution pores. The partial pore structure of 100 nm < D < 1000 nm corresponds to smaller grain margin fractures, micro-fractures, intragranular dissolution pores, and residual intergranular pores with reduced diameters due to incomplete dissolution. The pores with D < 100 nm are predominantly clay mineral intercrystalline pores. The combination and development of different pore structure types jointly cause the complexity of the pore structure. The multimodal pore size distribution further demonstrates poor structural sorting, significant heterogeneity, and restricted interconnectivity within the pore network of the investigated samples.
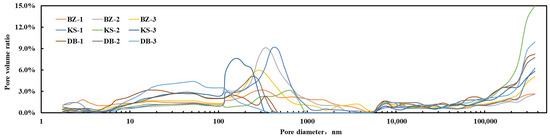
Figure 4.
Full-scale pore size distribution curves based on LPNA and HPMI measurement results.
3.2. Microscopic Characteristics of Pore Structure
The analyses of TS and SEM reveal that the ultra-deep tight sandstone gas reservoirs in the study area predominantly consist of very fine- to fine-grained and fine- to medium-grained lithic sandstones with subrounded to subangular grains. The pore system is dominated by residual intergranular pores (45.29%) and intragranular dissolution pores (41.30%), followed by matrix dissolution pores (7.28%), primary intergranular pores (3.85%), and intergranular dissolution pores (0.57%), as shown in Figure 5.
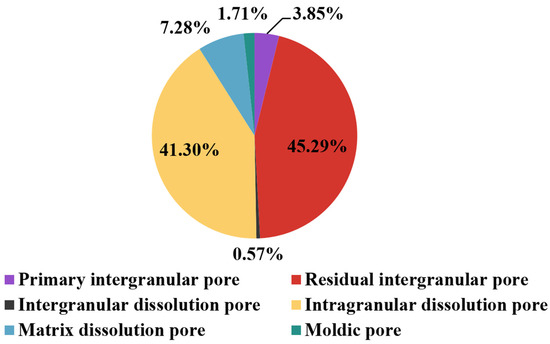
Figure 5.
Average proportion of pore types (n = 9).
Intensive compaction and cementation have significantly reduced pore development in the process of historical diagenesis, rendering dye injection challenging during the TS measurement. Most primary intergranular pores are filled with calcite, dolomite, anhydrite, or laumontite, transforming into residual pores or being completely obliterated, resulting in the current low visible porosity (average 3.3%) in TS measurement. Optical microscopy shows triangular, polygonal, and microporous aggregate morphologies with pore sizes ranging from 0.01 to 0.25 mm, with a maximum of 0.35 mm. Punctate and fine tubular pore throat (grain margin slit) can be often seen, with pore diameters less than 1 μm, and the number of coordination numbers is 0–3. They are mostly developed in poor cementation areas and have poor connectivity, as shown in Figure 6.
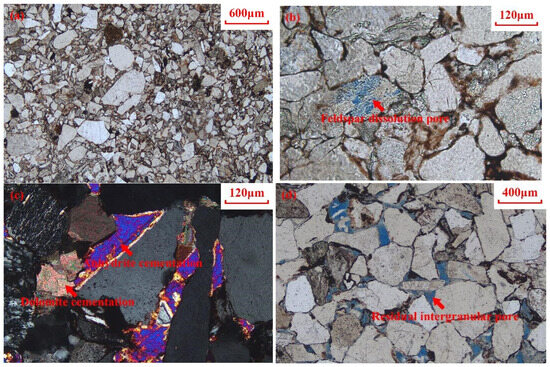
Figure 6.
Microscopic pore structure under TS imaging. (a) Poorly developed porosity (BZ-1); (b) feldspar dissolution pore (BZ-3); (c) intergranular pores completely cemented by minerals (KS-1); (d) residual intergranular pore (KS-2).
SEM analysis reveals the predominant development of micron-scale intergranular pores (D > 1 μm), micron-to-nanoscale intergranular dissolution pores (0.1 μm ≤ D ≤ 15.0 μm), and nanoscale intercrystalline pores (D < 1 μm). Some intergranular pores contain clay minerals including filamentous illite, curled smectite flakes, and semi-honeycomb/flocculent illite–smectite mixed-layer minerals (Figure 7).
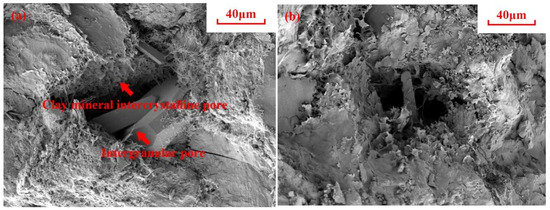
Figure 7.
Microscopic pore structure under SEM imaging. (a) Intergranular pore, clay mineral inter-crystalline pore, illite–smectite interlayer mineral (sample no. BZ-2); (b) intergranular pore, smectite (sample no. KS-2); (c) intergranular pore, illite (sample no. DB-1); (d) intragranular dissolution pore, within feldspar grains (sample no. DB-3).
3.3. Fractal Characteristics of Multiscale Pore Structure
3.3.1. Pore Scale Larger than 100 nm
The previous studies have demonstrated that the pore system of sedimentary rocks possesses fractal characteristics, which can be described by the following relationship [16]:
According to the two-dimensional parallel capillary model, Equation (1) can be transformed into
The organizing Equation (2) exists as follows:
Substituting the capillary force Equation (4) into Equation (3) yields Equation (5):
The mercury saturation in the pores can be described by Equation (6):
By substituting Equation (6) into Equation (5) and taking the logarithm of both sides, we obtain
which yields
By plotting the relationship curve with - and conducting linear fitting, the fractal dimension of the pore structure can be calculated through the slope of the fitted straight line. Based on the HPMI (D > 100 nm) results, the fractal characteristic curves of the pore structure are calculated and drawn as shown in Figure 8. The curve exhibits a distinct trilinear pattern, indicating differential fractal behaviors at varying spatial scales. To more accurately characterize the pore structure heterogeneity, the curves were divided into three fractal types (Type I, Type II, and Type III) according to the inflection points. The corresponding fractal dimensions , including , , and for each pore type derived from HPMI analysis, are summarized in Table 4.
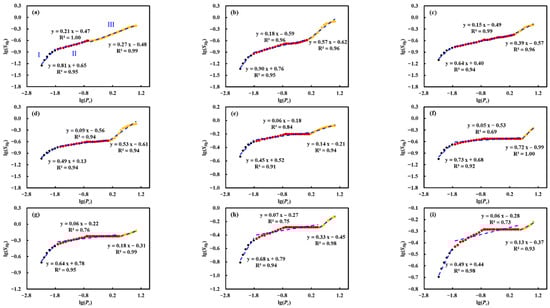
Figure 8.
Fractal dimension calculation curves based on HPMI measurement results (Here, I–III correspond to , , and , respectively; the black, red, and yellow circles represent the data points corresponding to fractal dimensions I–III; and the blue dashed line indicates the linear fitting curves corresponding to the data points of each color.). (a) BZ-1; (b) BZ-2; (c) BZ-3; (d) KS-1; (e) KS-1; (f) KS-1; (g) DB-1; (h) DB-2; (i) DB-3.
Table 4.
The fractal dimensions of the pore structures of each fractal type.
3.3.2. Pore Scale Lower than 100 nm
Nanoscale pore networks serve as the critical storage spaces in ultra-deep tight sandstone gas reservoirs, exerting substantial influence on both gas occurrence and migration mechanisms. The FHH fractal model was first proposed by Frenkel and Halsey & Hill to describe the power–law relationship between adsorption capacity and relative pressure during multilayer adsorption. The model has been extensively applied in the studies of rock pore structure [19,21,29,30]. The quantitative relationship among gas adsorption capacity, system equilibrium pressure, and fractal dimension can be expressed by the following equation [31]:
The relationship curve between and is shown in Figure 9. The curve is an approximately linear single-segment trend, indicating smooth variation in pore complexity across spatial scales. The () of Type IV fractal pore structures calculated by LPNA is presented in Table 4. The fractal dimensions of the pore structure with a D < 100 nm range from 2.53 to 2.72, with an average value of 2.58 larger than 2.50. This demonstrates considerable structural complexity and indicates moderate-to-strong heterogeneity characteristics in the nanoscale pore network.
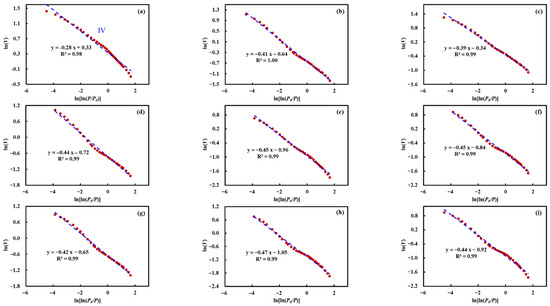
Figure 9.
Fractal dimension calculation curves based on LPNA measurement results. (Here, IV corresponds to ; the red circles represent the data points corresponding to fractal dimension IV; and the blue dashed line denotes the linear fitting curve obtained from the red data points.) (a) BZ-1; (b) BZ-2; (c) BZ-3; (d) KS-1; (e) KS-1; (f) KS-1; (g) DB-1; (h) DB-2; (i) DB-3.
4. Discussion
4.1. Comparison of Porosity and Permeability Between Laboratory Normal and In Situ Conditions for Ultra-Deep Tight Sandstone
The relationship between porosity and permeability at in situ conditions, as shown in Figure 10a, demonstrates that the natural fractures are developed in the ultra-deep tight sandstone reservoir, and the matrix that contributes most of the porosity is very tight and has very poor pore connectivity. Comparative analysis between laboratory normal conditions (3 MPa, 25 °C) and in situ conditions shows that the porosity under the laboratory normal conditions is 1.02–1.12 times (1.08 times on average) higher than that under in situ conditions (Table 5). The permeability exhibits a more pronounced increase of 4.30–54.34 times (25.30 times on average). It is indicated that the permeability undergoes significantly greater reduction under in situ conditions compared to porosity. This discrepancy primarily arises from the differential sensitivity of porosity and permeability to effective stress and temperature variations.
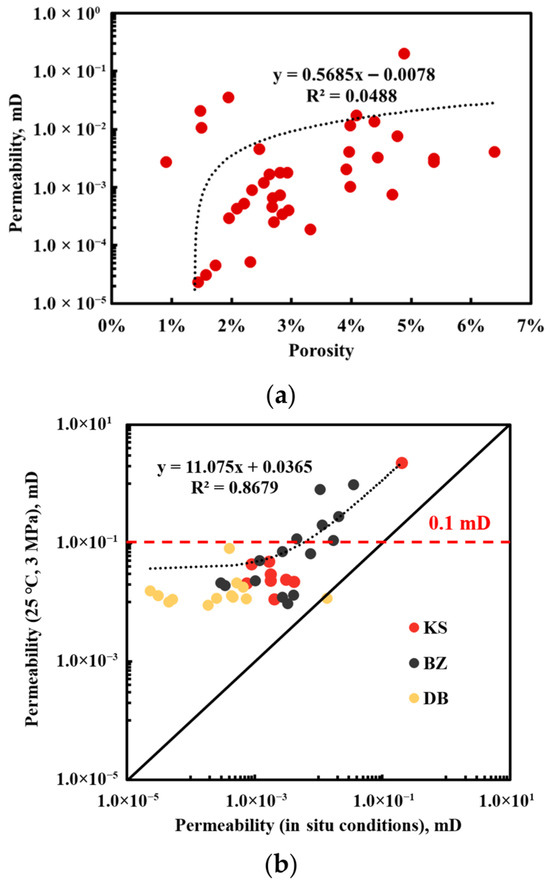
Figure 10.
Comparative diagrams of porosity and permeability under different experimental conditions. (a) Relationship between porosity and permeability at in situ conditions; (b) relationship between permeability under in situ conditions and laboratory normal conditions.
Table 5.
Comparison of porosity and permeability under 3 MPa, 25 °C, and in situ conditions.
The porosity mainly reflects the overall volume of the reservoir space in the rock. The reduction in pore space after it is subjected to effective stress is mainly related to compaction, showing a relatively linear changing trend. In contrast, the permeability not only depends on the size of the pore volume, but also is predominantly controlled by factors such as the size of the pore throat, connectivity, and the geometric characteristics of the pore structure. The above would be more particular for the compressible pore structures, including microfractures and grain-edge fractures, which serve as the dominant flow pathways. Furthermore, the elevated temperatures may induce matrix rigidity reduction, mineral thermal expansion, and clay structural alterations through bound water evaporation. These mechanisms collectively increase rock compressibility while significantly degrading the flow pathway connectivity. The relationship between the permeability at in situ conditions and that at laboratory normal conditions, as shown in Figure 10b, shows that the influence of temperature and pressure on permeability becomes significantly enhanced when the permeability is less than 0.1 mD. It is also indicated that the real porosity and permeability of an ultra-deep tight sandstone reservoir must be measured at in situ conditions.
4.2. Pore Structure Characteristics of Ultra-Deep Tight Sandstone
According to the relevant research in this paper, the pore structure types of the samples mainly include intergranular pores, intragranular pores, grain-edge fractures, microfractures, and clay mineral intercrystalline pores. Different pore structure types have different pore size distribution intervals. Therefore, the fractal characteristics of each pore structure can be qualitatively analyzed. Intergranular pores, intragranular dissolution pores, and clay mineral intercrystalline pores constitute the primary storage spaces for the gas in ultra-deep tight sandstone. The variations in pore size and geometry lead to the differential flow capacities among pore types. In general, the more homogeneous pore structures demonstrate the lower fractal dimensions, and exhibit platelike, tubular, or spherical morphologies. In addition, within the FHH fractal model framework used for the experimental data of LPNA, the higher fractal dimensions correlate with the increased adsorption surface area and capacity, indicating greater pore surface roughness.
Integrated TS and SEM analyses reveal that the pores corresponding to (average 2.65) are relatively large primary intergranular pores, residual intergranular pores, and intergranular dissolution pores. The formation of such pore structures likely involves selective cementation and dissolution, preferentially occurring at specific mineral components, unstable grain boundaries, or intergranular contacts. These processes can frequently generate complex pore structures. Additionally, clay minerals developed within the pore spaces can reduce the interconnectivity, leading to the refinement of pore throat and the complication of flow pathway. These combined effects collectively enhance both the heterogeneity and spatial complexity of the pore system, consequently resulting in elevated fractal dimensions at spatial scales.
The pore types corresponding to (average 2.10) mainly include grain margin cracks, micro-cracks, and throats that serve as the connections between large pores. The development degree of these pore structures directly affects the flow capacity of the pore network. However, due to the particularity of ultra-deep tight sandstone reservoirs, their development is influenced by late-stage compaction and diagenesis, resulting in pore-throat size reduction or complete closure. This leads to poor reservoir quality in the study area. From the perspective of the total pore size distribution curve, there is a lack of transitional pores between the left peak and the right peak. The connectivity between the pores corresponding to the two peaks is poor. The fracture-type pores, primarily formed through compaction or diagenetic tensile stresses, develop along grain boundaries or within grains. Their platelike or wedge-shaped distributions with distinct linear characteristics result in relatively ordered structures and consequently smaller fractal dimensions.
The pore types corresponding to and are mainly nanoscale pore structures, such as clay mineral intercrystalline pores and minor intragranular dissolution pores. This type of pore is generally characterized by small pore sizes, complex architectures and large specific surface areas. They serve as the critical space for gas storage in reservoirs. Notably, the clay intercrystalline pores, widely distributed among clay minerals, serve as the primary contributors to the nano-porosity systems. The visual characterization of pore structure, as shown in Figure 7, reveals that these pore structures exhibit significant complexity and surface roughness, featuring honeycomb or microporous textures (illite, mixed-layer illite/smectite, intragranular dissolution pores), and platelike or wedge-shaped textures (smectite). The above morphology results in moderate heterogeneity, as reflected by intermediate fractal dimensions ( of 2.36 on average, of 2.58 on average).
Although the fractal dimension serves as a quantitative indicator for pore structure complexity and heterogeneity, clay minerals during fluid flow are prone to edge fragmentation or detachment, potentially clogging pore throats and reducing permeability. Furthermore, the aqueous phase imbibition property may induce clay swelling that obstructs the pore throats, adversely affecting the effective flow pathways [32,33]. Therefore, the intermediate fractal dimensions do not necessarily indicate the favorable pore-throat structures. It is necessary to comprehensively evaluate the permeability of ultra-deep tight sandstone gas reservoirs by combining factors such as core flow experimental results.
5. Conclusions
- (1)
- The porosity of the sample at 3 MPa and 25 °C was 1.02 to 1.12 times (1.08 times on average) higher than in situ temperature and pressure conditions, and the permeability was 4.30 to 54.34 times higher (25.30 times on average).
- (2)
- Due to intense compaction and cementation effects, the samples from the ultra-deep tight sandstone gas reservoirs exhibit underdeveloped pore systems. The pore structure types primarily include intergranular pores, intragranular pores, grain-edge fractures, microfractures, and clay mineral intercrystalline pores.
- (3)
- The pore volume of the ultra-deep tight sandstone with D < 100 nm is mainly mesoporous, with an average of 73.37%. The average proportions of macropores and micropores are 22.29% and 4.34%, respectively.
- (4)
- The capillary pressure curves exhibit steep slopes with narrow plateaus, indicating poorly sorted pore-throat size distributions and skewed toward smaller dimensions. There is a steep drop in the middle of the capillary pressure curve, indicating low mercury removal efficiency and poor connectivity.
- (5)
- The full pore size distribution curve shows a bimodal pattern, with the left peak concentrated in the range of 100–1000 nm (34.92% proportion on average), and the right peak concentrated in D > 100 μm (accounting for 25.26% on average). These primary storage spaces lack effective connectivity. To improve connectivity, appropriate acid fracturing can be carried out.
Future research should focus on linking pore structure characteristics to reservoir-scale production behavior, incorporating 3D imaging and dynamic flow experiments to establish quantitative relationships between micro-scale pore structures and macro-scale reservoir performance. Such efforts will help translate the fundamental findings of this study into practical guidance for the efficient development of ultra-deep tight sandstone gas resources.
Author Contributions
Conceptualization, L.T., Y.Z. (Yongbin Zhang) and X.T.; methodology, X.T.; software, L.T. and M.C.; validation, X.T.; formal analysis, Y.K. and Y.L.; investigation, L.T., Y.Z. (Yongbin Zhang), Q.Z., X.P., Y.Z. (Yiguo Zhang), B.Z., J.L., P.T. and D.W.; resources, L.T., Y.Z. (Yongbin Zhang), Q.Z., X.P., Y.Z. (Yiguo Zhang), B.Z., J.L., P.T. and D.W.; data curation, X.T. and M.C.; writing—original draft preparation, L.T., Y.Z. (Yongbin Zhang) and X.T.; writing—review and editing, L.T., Y.Z. (Yongbin Zhang) and X.T.; visualization, X.T.; supervision, L.T., Y.Z. (Yongbin Zhang), Q.Z., X.P., Y.Z. (Yiguo Zhang), B.Z., J.L., P.T. and D.W.; project administration, Y.K. and M.C.; funding acquisition, Y.K. and M.C. All authors have read and agreed to the published version of the manuscript.
Funding
This research was supported by the CNPC Youth Science and Technology Project (No. Q202501.06) and the Project of the R&D Center for Ultra Deep Complex Reservoir Exploration and Development, CNPC (No. YF202408.01).
Data Availability Statement
The original contributions presented in this study are included in the article. Further inquiries can be directed to the corresponding author.
Conflicts of Interest
Authors Liandong Tang, Yongbin Zhang, Qihui Zhang, Xuehao Pei, Yiguo Zhang, Bihui Zhou, Jun Li, Pandong Tian and Di Wu were employed by R&D Center for Ultra-Deep Complex Reservoir Exploration and Development, China National Petroleum Corporation (CNPC). The remaining authors declare that the research was conducted in the absence of any commercial or financial relationships that could be construed as a potential conflict of interest.
Nomenclature
| D | Pore diameter, nm |
| Spearman’s rank correlation coefficient | |
| p | Probability value |
| ϕ1 | Porosity measured under 25 °C and 3 MPa effective stress conditions, % |
| ϕ2 | In situ porosity, % |
| k1 | Permeability measured under 25 °C and 3 MPa effective stress conditions, mD |
| k2 | In situ permeability, mD |
| r | Pore radius, nm |
| Number of pores with aperture radius greater than r | |
| n | The quantity of samples |
| Fractal dimension | |
| Volume of mercury intruded into the core, cm3 | |
| Core length, cm | |
| Capillary pressure, MPa | |
| Surface tension, mN/m | |
| Contact angle, ° | |
| Mercury saturation, % | |
| Pore volume, cm3 | |
| Slope of the fitted line | |
| Fractal Dimension of Type I Fractal Pore Structure | |
| Fractal Dimension of Type II Fractal Pore Structure | |
| Fractal Dimension of Type III Fractal Pore Structure | |
| Fractal Dimension of Type IV Fractal Pore Structure | |
| Adsorption Volume, cm3/g | |
| Saturated Vapor Pressure of Gas, Pa | |
| Actual Gas Pressure, Pa | |
| Constant |
References
- Yue, D.; Wu, S.; Xu, Z.; Xiong, L.; Chen, D.; Ji, Y.; Zhou, Y. Reservoir quality, natural fractures, and gas productivity of upper Triassic Xujiahe tight gas sandstones in western Sichuan Basin, China. Mar. Pet. Geol. 2018, 89, 370–386. [Google Scholar] [CrossRef]
- Jia, C.; Pan, X. Research processes and main development directions of deep hydrocarbon geological theories. Acta Pet. Sin. 2015, 36, 1457–1469. [Google Scholar] [CrossRef]
- Lei, Q.; Yang, Z.; Weng, D.; Liu, H.; Guan, B.; Cai, B.; Fu, H.; Liu, Z.; Duan, Y.; Liang, T.; et al. Techniques for improving fracture-controlled stimulated reservoir volume in ultra-deep fractured tight reservoirs: A case study of Kuqa piedmont clastic reservoirs, Tarim Basin, NW China. Acta Pet. Sin. 2022, 49, 1012–1024. [Google Scholar] [CrossRef]
- Jacob, A.; Peltz, M.; Hale, S.; Enzmann, F.; Moravcova, O.; Warr, L.N.; Grathoff, G.; Blum, P.; Kersten, M. Simulating permeability reduction by clay mineral nanopores in a tight sandstone by combining computer X-ray microtomography and focussed ion beam scanning electron microscopy imaging. Solid Earth 2021, 12, 1–14. [Google Scholar] [CrossRef]
- Liu, T.; Liu, Z.; Zhang, K.; Tian, F.; Zhang, Y.; Zhang, R.; Xu, C.; Liu, F.; Liu, X.; Wang, X.; et al. Method for calculating porosity in tight sandstone reservoir thin sections based on ICSO intelligent algorithm. Unconv. Resour. 2025, 6, 100147. [Google Scholar] [CrossRef]
- He, T.; Zhou, Y.; Chen, Z.; Zhang, Z.; Xie, H.; Shang, Y.; Cui, G. Fractal Characterization of the Pore-Throat Structure in Tight Sandstone Based on Low-Temperature Nitrogen Gas Adsorption and High-Pressure Mercury Injection. Fractal Fract. 2024, 8, 356. [Google Scholar] [CrossRef]
- Li, Z.; Ren, Y.; Chang, R.; Zhang, Y.; Zhang, X.; Tian, W. Clarifying the contribution of multiscale pores to physical properties of Chang 7 tight sandstones: Insight from full-scale pore structure and fractal characteristics. Front. Earth Sci. 2024, 12, 1361052. [Google Scholar] [CrossRef]
- Huyan, Y.Y.; Pang, X.Q.; Liu, T.S.; Jiang, F.J.; Chen, X.Z.; Ma, X.Q.; Li, L.L.; Shao, X.H.; Zheng, D.Y. Petrophysical characterisation of tight sandstone gas reservoirs using nuclear magnetic resonance: A case study of the upper Paleozoic strata in the Kangning area, eastern margin of the Ordos Basin, China. Aust. J. Earth Sci. 2018, 65, 863–875. [Google Scholar] [CrossRef]
- Wang, H.; Liu, Y.; Song, Y.; Zhao, Y.; Zhao, J.; Wang, D. Fractal analysis and its impact factors on pore structure of artificial cores based on the images obtained using magnetic resonance imaging. J. Appl. Geophys. 2012, 86, 70–81. [Google Scholar] [CrossRef]
- Zheng, S.; Wang, R.; Li, Z.; Qiu, L.; Zhao, J.; Shou, Q.; Liu, J. Quantitative Characterization of Microscopic Pore Structure of Tight Sandstone Gas Reservoirs Based on Micron CT Scanning. Chem. Technol. Fuels Oils 2025, 61, 408–417. [Google Scholar] [CrossRef]
- Zhang, J.; Li, X.; Wei, Q.; Sun, K.; Zhang, G.; Wang, F. Characterization of Full-Sized Pore Structure and Fractal Characteristics of Marine–Continental Transitional Longtan Formation Shale of Sichuan Basin, South China. Energy Fuels 2017, 31, 10490–10504. [Google Scholar] [CrossRef]
- Zhang, L.; Lu, S.; Xiao, D.; Gu, M. Characterization of full pore size distribution and its significance to macroscopic physical parameters in tight glutenites. J. Nat. Gas Sci. Eng. 2017, 38, 434–449. [Google Scholar] [CrossRef]
- Tian, W.; Lu, S.; Huang, W.; Wang, S.; Gao, Y.; Wang, W.; Li, J.; Xu, J.; Zhan, Z. Study on the Full-Range Pore Size Distribution and the Movable Oil Distribution in Glutenite. Energy Fuels 2019, 33, 7028–7042. [Google Scholar] [CrossRef]
- Xu, Y.; Wang, Y.; Yuan, H.; Zhang, D.; Agostini, F.; Skoczylas, F. Pore structure characterization of tight sandstone from Sbaa Basin, Algeria: Investigations using multiple fluid invasion methods. J. Nat. Gas Sci. Eng. 2018, 59, 414–426. [Google Scholar] [CrossRef]
- Mandelbrot, B.B.; Passoja, D.E.; Paullay, A.J. Fractal character of fracture surfaces of metals. Nature 1984, 308, 721–722. [Google Scholar] [CrossRef]
- Giri, A.; Tarafdar, S.; Gouze, P.; Dutta, T. Fractal pore structure of sedimentary rocks: Simulation in 2-d using a relaxed bidisperse ballistic deposition model. J. Appl. Geophys. 2012, 87, 40–45. [Google Scholar] [CrossRef]
- Li, P.; Zheng, M.; Bi, H.; Wu, S.; Wang, X. Pore throat structure and fractal characteristics of tight oil sandstone: A case study in the Ordos Basin, China. J. Pet. Sci. Eng. 2017, 149, 665–674. [Google Scholar] [CrossRef]
- Liu, X.; Nie, B. Fractal characteristics of coal samples utilizing image analysis and gas adsorption. Fuel 2016, 182, 314–322. [Google Scholar] [CrossRef]
- Wang, F.; Yang, K.; Zai, Y. Multifractal characteristics of shale and tight sandstone pore structures with nitrogen adsorption and nuclear magnetic resonance. Pet. Sci. 2020, 17, 1209–1220. [Google Scholar] [CrossRef]
- Li, K. Analytical derivation of Brooks–Corey type capillary pressure models using fractal geometry and evaluation of rock heterogeneity. J. Pet. Sci. Eng. 2010, 73, 20–26. [Google Scholar] [CrossRef]
- He, H.; Liu, P.; Xu, L.; Hao, S.; Qiu, X.; Shan, C.; Zhou, Y. Pore structure representations based on nitrogen adsorption experiments and an FHH fractal model: Case study of the block Z shales in the Ordos Basin, China. J. Pet. Sci. Eng. 2021, 203, 108661. [Google Scholar] [CrossRef]
- Cao, L.; Jiang, F.; Chen, Z.; Gao, Y.; Huo, L.; Chen, D. Data-driven interpretable machine learning for prediction of porosity and permeability of tight sandstone reservoir. Adv. Geo-Energy Res. 2025, 16, 21–35. [Google Scholar] [CrossRef]
- Liu, D.; Cheng, S.; Wang, H.; Wang, Y. A Method for Predicting Gas Well Productivity in Non-Dominant Multi-Layer Tight Sandstone Reservoirs of the Sulige Gas Field Based on Multi-Task Learning. Processes 2025, 13, 2666. [Google Scholar] [CrossRef]
- Yu, S.; Wang, C.; Chen, D.; Guo, B.; Cai, Z.; Xu, Z. Criteria and favorable distribution area prediction of Paleogene effective sandstone reservoirs in the Lufeng Sag, Pearl River Mouth Basin. Adv. Geo-Energy Res. 2022, 6, 388–401. [Google Scholar] [CrossRef]
- Yao, Z.; Fu, T.; Wang, J.; Zhang, X.; Jia, C.; Wei, W.; Deleqiatì, J.; Yu, H.; Li, J.; Wang, H. Diagenetic facies and pore evolution of tight sandstone reservoirs of the Jiamuhe formation in the Shawan sag, Junggar basin. Sci. Rep. 2025, 15, 22460. [Google Scholar] [CrossRef]
- Goldstein, J.I.; Newbury, D.E.; Michael, J.R.; Ritchie, N.W.; Scott, J.H.J.; Joy, D.C. Scanning Electron Microscopy and X-Ray Microanalysis; Springer: Berlin/Heidelberg, Germany, 2017. [Google Scholar] [CrossRef]
- Dollimore, D.; Spooner, P.; Turner, A.J.S.T. The bet method of analysis of gas adsorption data and its relevance to the calculation of surface areas. Surf. Technol. 1976, 4, 121–160. [Google Scholar] [CrossRef]
- Spearman, C. The Proof and Measurement of Association between Two Things. Am. J. Psychol. 1904, 15, 72–101. [Google Scholar] [CrossRef]
- Xiao, Q.; Yang, Z.; Wang, Z.; Qi, Z.; Wang, X.; Xiong, S. A full-scale characterization method and application for pore-throat radius distribution in tight oil reservoirs. J. Pet. Sci. Eng. 2020, 187, 106857. [Google Scholar] [CrossRef]
- Zhang, L.; Lu, S.; Xiao, D.; Li, B. Pore structure characteristics of tight sandstones in the northern Songliao Basin, China. Mar. Pet. Geol. 2017, 88, 170–180. [Google Scholar] [CrossRef]
- Pfeifer, P.; Avnir, D. Chemistry in noninteger dimensions between two and three. I. Fractal theory of heterogeneous surfaces. J. Chem. Phys. 1983, 79, 3558–3565. [Google Scholar] [CrossRef]
- Lai, Z.; Kang, Y.; Chen, M.; Huang, H.; You, L.; Bai, J. Selective dissolution of tight sandstone in an acidic environment to enhance gas flow capacity. Geoenergy Sci. Eng. 2024, 237, 212814. [Google Scholar] [CrossRef]
- Zhang, X.; Liu, Y.; Liu, Y.; Zhong, C. Influencing Factors and Application of Spontaneous Imbibition of Fracturing Fluids in Tight Sandstone Gas Reservoir. ACS Omega 2022, 7, 38912–38922. [Google Scholar] [CrossRef] [PubMed]
Disclaimer/Publisher’s Note: The statements, opinions and data contained in all publications are solely those of the individual author(s) and contributor(s) and not of MDPI and/or the editor(s). MDPI and/or the editor(s) disclaim responsibility for any injury to people or property resulting from any ideas, methods, instructions or products referred to in the content. |
© 2025 by the authors. Licensee MDPI, Basel, Switzerland. This article is an open access article distributed under the terms and conditions of the Creative Commons Attribution (CC BY) license (https://creativecommons.org/licenses/by/4.0/).