Abstract
Weathered crust karst reservoirs with intricately interconnected fractures and caves are common but challenging enhanced oil recovery (EOR) targets. This paper investigated the remaining oil distribution rules, formation mechanisms, and EOR methods through physical experiments on acrylic models resembling the geological features of weathered crust reservoirs. Acrylic models with precision dimensions and morphologies were fabricated using laser etching technology. By comparing experiments under different cave filling modes and production well locations, it was shown that a higher cave filling extent led to poorer bottom water flooding recovery due to stronger flow resistance but slower rising water cut owing to continued production from the filling medium. Multi-well water and gas injection achieved higher incremental oil recovery by alternating injection–production arrangements to establish new displacement channels and change drive energy. Gas injection recovered more attic remaining oil from upper cave regions, while subsequent water injection helped wash the residual oil in the filling medium. The findings reveal the significant effects of fracture cave morphological configuration and connectivity on remaining oil distribution. This study provides new insights and guidance for EOR design optimization catering to the unique features of weathered crust karst fractured vuggy reservoirs.
1. Introduction
Weathered crust reservoirs are a typical type of carbonate reservoir developed in marine petroliferous basins worldwide [1,2]. They are formed by long-term exposure on the surface, resulting in dissolution by meteoric water infiltration, forming a highly heterogeneous network of caves, fractures, and vugs [3,4,5,6]. This complex fracture cave system makes it challenging to efficiently develop remaining oil reserves in these reservoirs [7]. After waterflooding, large amounts of remaining oil are trapped and bypassed in unswept zones due to reservoir heterogeneity, presenting a great potential for enhanced oil recovery (EOR) [8,9,10]. Therefore, it is of great theoretical and practical significance to carry out research on the remaining oil distribution characteristics and EOR measures in this type of reservoir.
The Tarim Basin in Northwest China contains multiple large weathered crust oilfields like Tazhong and Tabi with high remaining potential [11,12]. However, the recovery factors are generally low after primary and secondary development. Previous studies have investigated geological features in typical fields. Based on an analysis of the geological characteristics of Tahe Oilfield, Lu [13] believed that fractures, pores, and residual caves are the main reservoir space in the weathered crust reservoir, and the fractures and karst conduits between wells are the main communicating media between wells. There are characteristics of multi-directional connection, multi-directional response, obvious response, and the long effective period between injection and production wells. Li [14] believed that the caves in the weathered crust reservoir are distributed in strips and networks, and the fracture cave structure has the characteristics of planar distribution, spatially discrete distribution, and a wide divination range between fractures and caves. Zhang [15] believed that cave-type, fracture-pore-type, pore-type, and fracture-type reservoirs are all developed in the weathered crust reservoir, that the development thickness of high-quality reservoirs is large, and that various reservoir parameters are better than the residual hillside.
Physical experimentation is the most important method for studying the remaining oil distribution and development mechanisms of fractured vuggy reservoirs. With the development of research, different experts and scholars have proposed various preparation techniques for physical experimental models of fractured vuggy reservoirs. Lu [16] first used marble mosaics to make a series of physical experimental models covering fractured vuggy characteristics (including single fracture, fracture network, and fractured vuggy models) and conducted single-phase and two-phase fluid flow experiments considering factors such as fracture aperture, fracture structural combination, and cave density. Li [17] used the organic glass mosaic method to make a two-dimensional fractured vuggy network model, carried out waterflooding experiments under the support of similarity criteria, and systematically analyzed the production characteristics and remaining oil distribution differences during waterflooding. Li and Zhao [18,19] laser etched organic glass to make two types of underground river fractured vuggy models, and through extensive experiments, they studied the effects of factors such as the injection rate, well placement, bottom water strength, and oil/water viscosity ratio on waterflooding production characteristics. Yuan [20] made a physical experimental model reflecting actual fractured vuggy characteristics using carbonate rock plates based on the well-tied section diagram of S48-TK478 in Tahe Oilfield, revealing the residual oil distribution rules after waterflooding in fracture cave units containing filling media. Guo [21] made various morphological three-dimensional cave models using 3D printing technology based on actual geological models and monitored the changes in oil/water saturation distribution during waterflooding experiments in real time using electrical resistance methods. Since the scale of fractures in weathered crust reservoirs ranges from microns to centimeters, and the scale of caves ranges from millimeters to meters, any experimental model must account for these multi-scale conditions to accurately reflect the true characteristics of the reservoir. However, achieving this is challenging, thus necessitating reasonable scaling and similarity equivalence.
In the development process of fractured-vuggy reservoirs, there are mainly three stages. The first stage is single-well injection–production dominated by water flooding and gas huff-n-puff. The next stage is inter-well flooding dominated by water/gas injection. The final stage is optimized injection–production focusing on improved water injection and gas–water synergy [22,23,24,25,26]. However, these production methods are all single injection–single production, single injection–multiple production, or multiple injection–multiple production systems under certain well patterns. The feasibility and related mechanisms of collaborative multiple-well water/gas injection in recovering remaining oil and increasing recovery have not been reported.
In this work, we designed and constructed physical models of weathered crust reservoirs with fracture cave systems. Bottom water flooding experiments were first conducted to analyze the remaining oil distribution under different cave filling conditions and well arrangements. Then, the potential of multi-well water and gas injection to further improve oil recovery was evaluated through multi-well flooding experiments. The results provide insights into EOR mechanisms and optimization strategies for complex weathered crust fractured vuggy reservoirs.
2. Experiments and Methods
2.1. Designing and Manufacturing Experimental Model
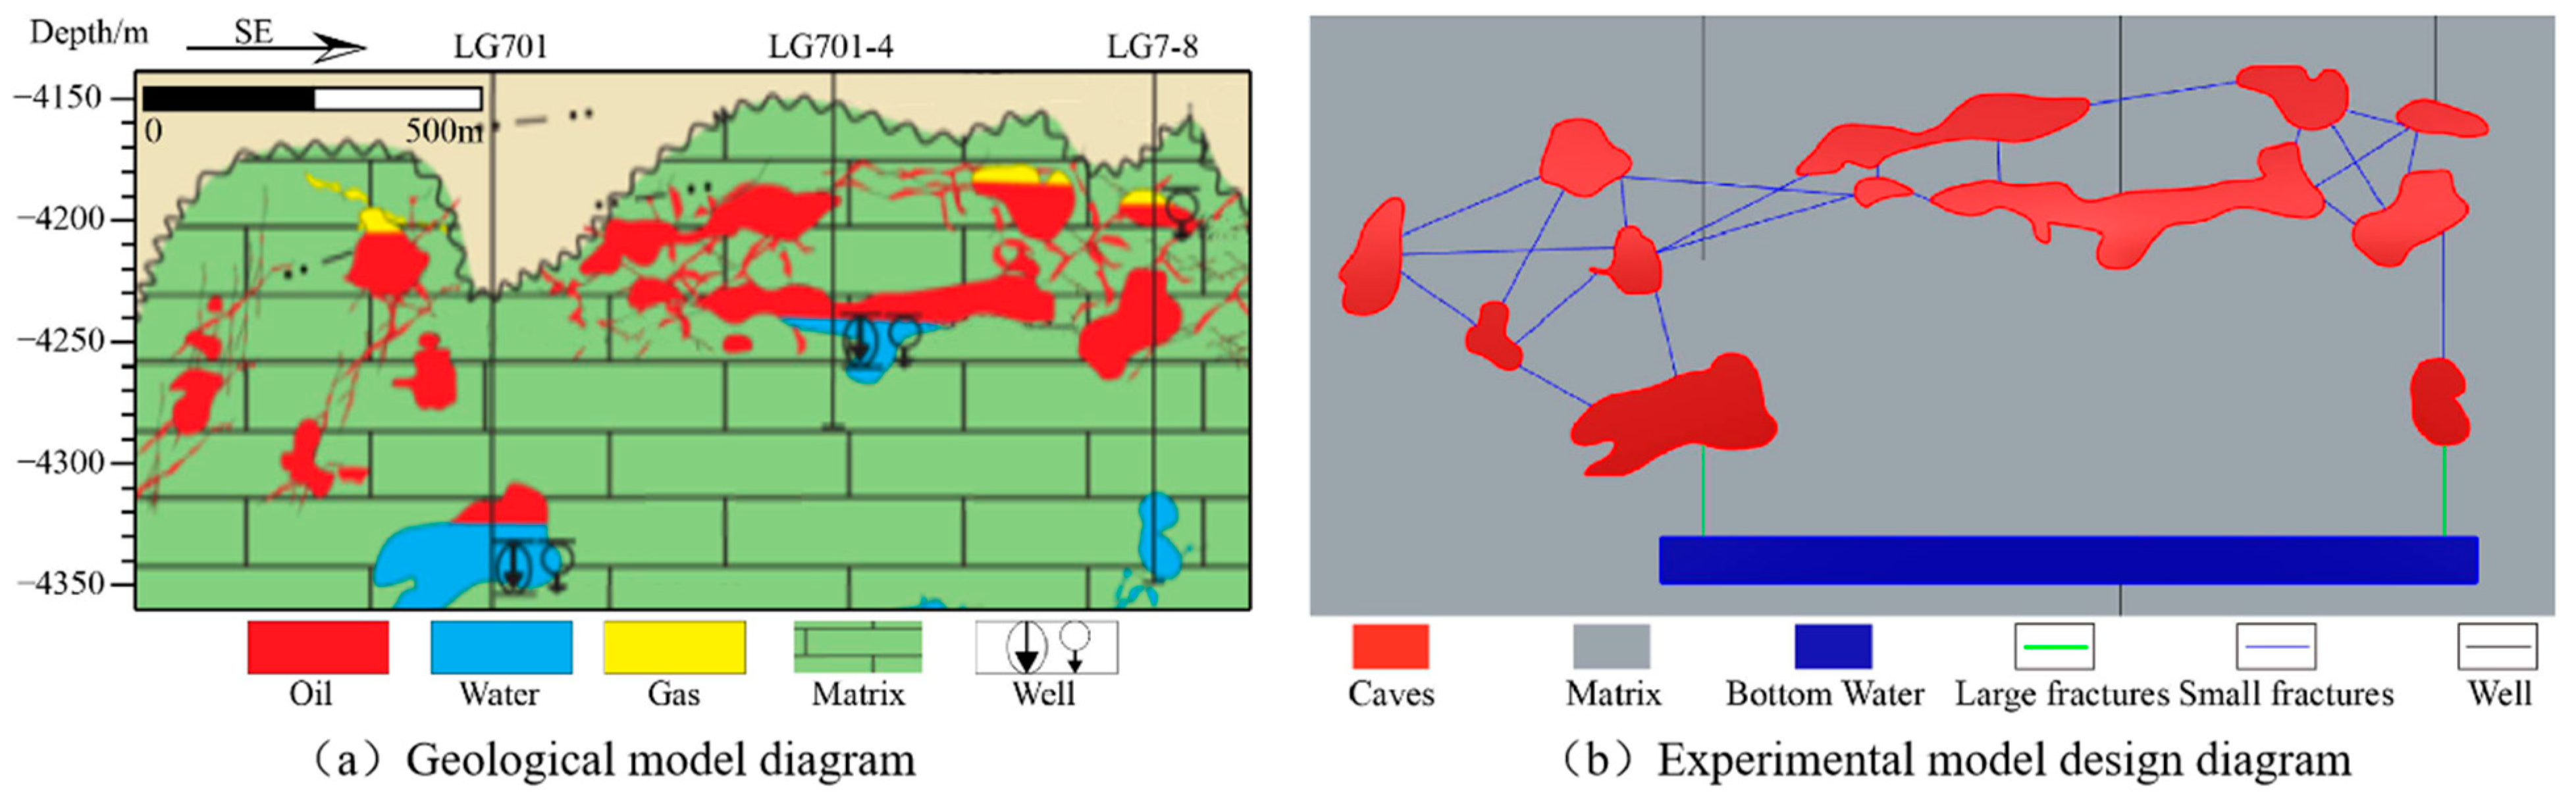
Due to atmospheric and freshwater infiltration and dissolution on the surface of carbonate rocks and the diffusion and dissolution of freshwater inside the rocks, weathering crust karst fractured vuggy reservoirs have intricately interconnected fractures and caves. The top of the controlled area of wells LG701~LG701-4-LG7-8 in an oilfield in China is a typical weathered crust reservoir. According to the well-tied geological profiles, cave morphologies were delineated using Rhino 6.0 computer-aided design (CAD) software, and random fractures were constructed to design the physical experimental model, as shown in Figure 1. The model’s overall size was 60 cm in length, 35 cm in height, and 2 cm in thickness. The depths of the caves and fractures were both 1 cm. The large fracture width was 2 mm, and the small fracture width was 0.5 mm. The wellbore radius was 4 mm.
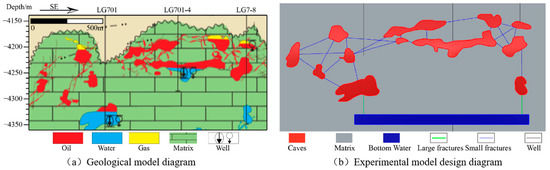
Figure 1.
Geological section and model design of weathering crust reservoirs.
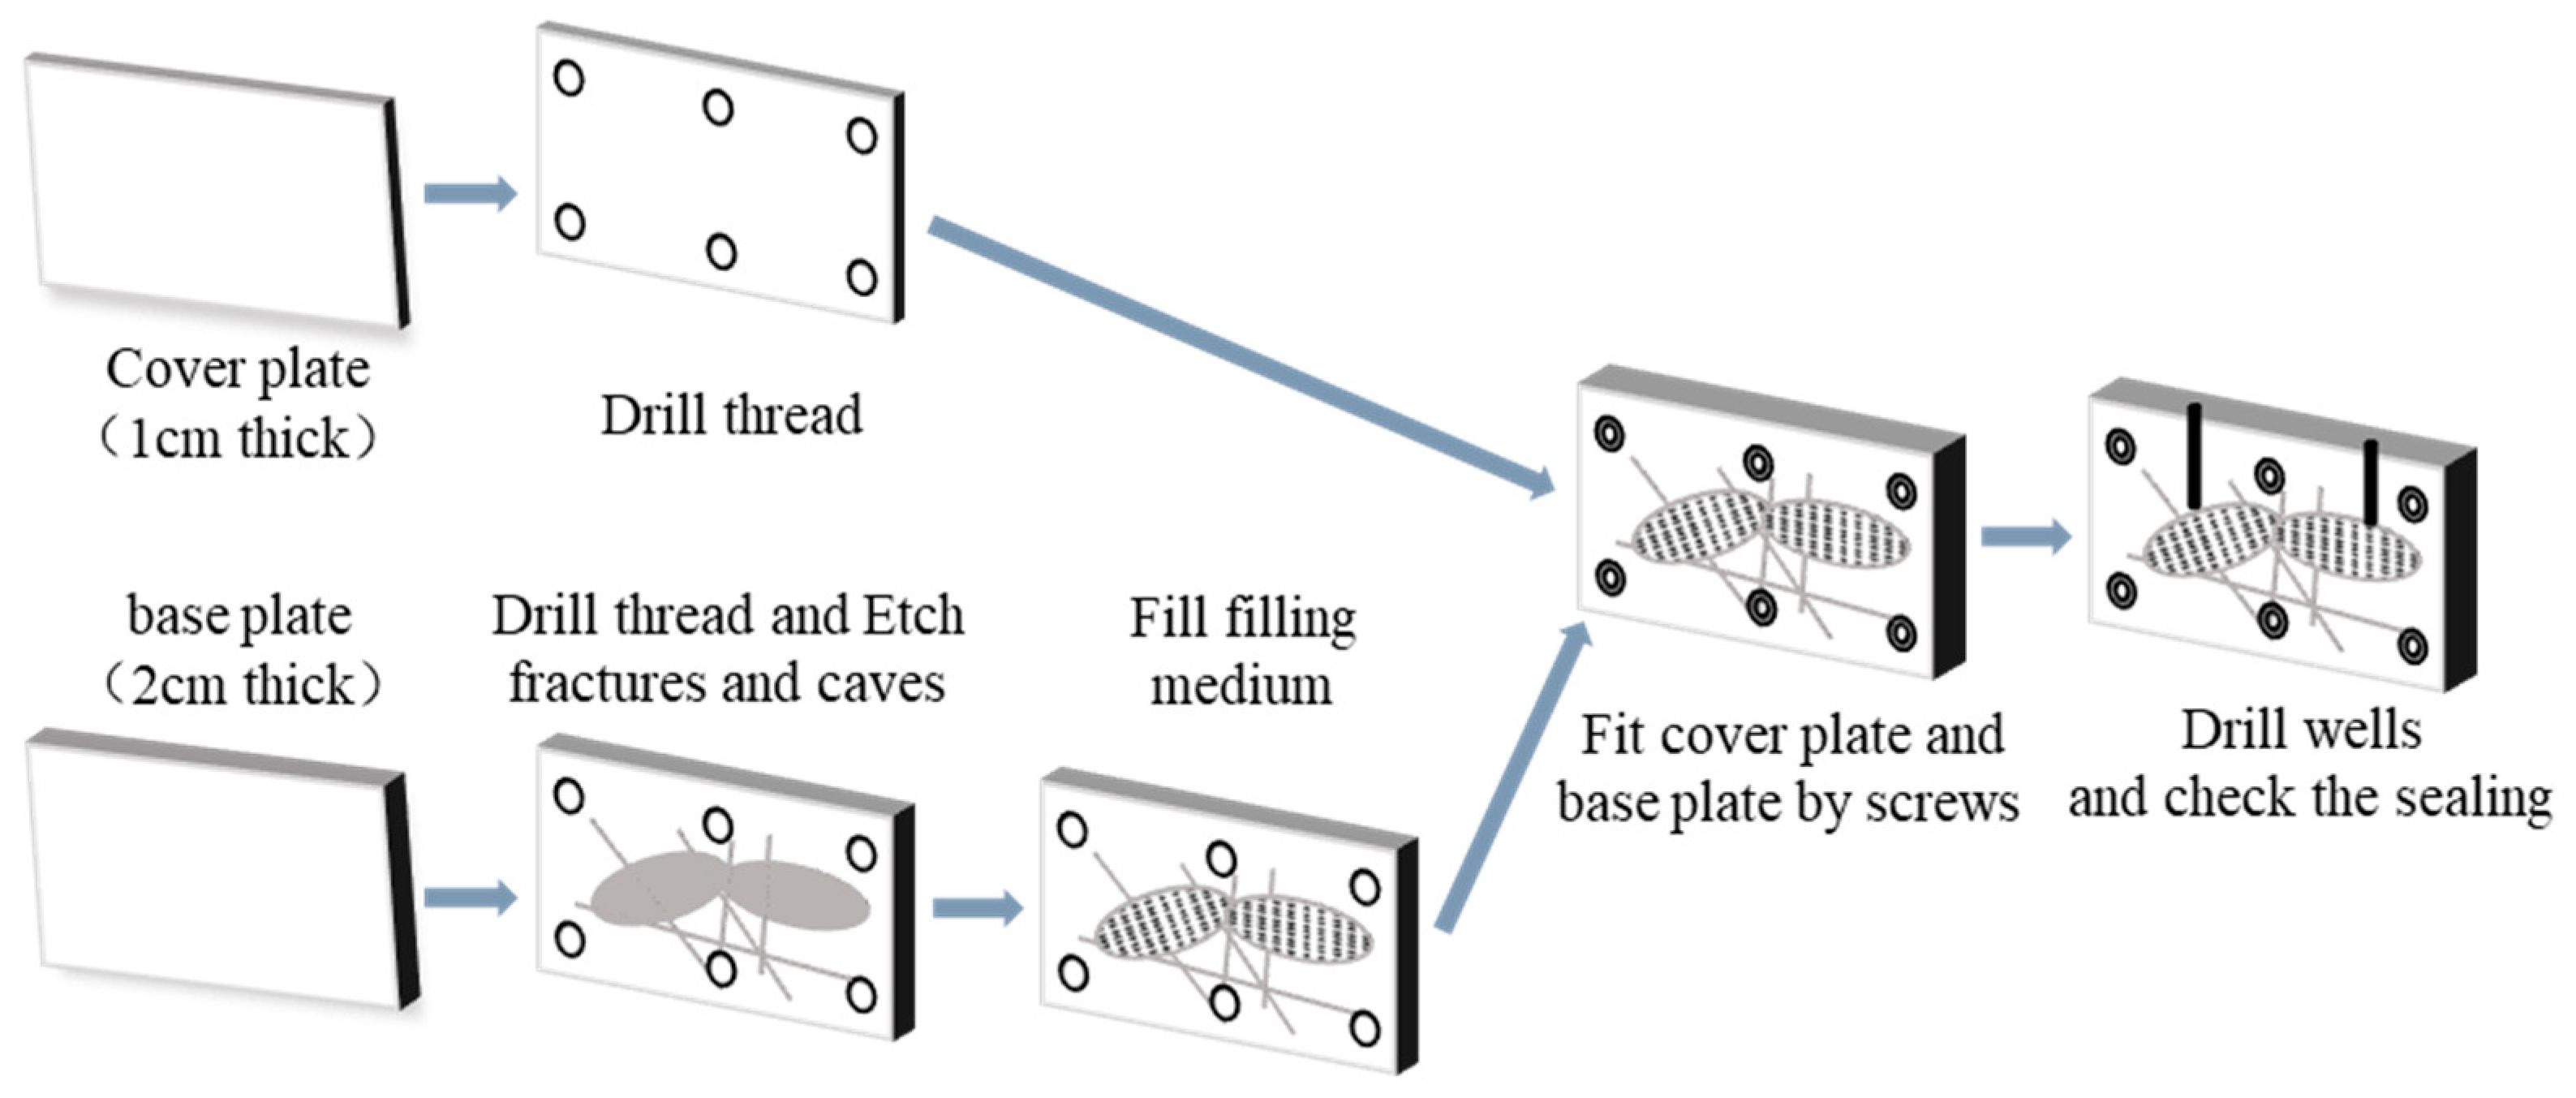
We used acrylic plates, which is an oil-wet transparent material, as the material for manufacturing physical experiment models [27,28]. The entire production process can be summarized in 6 steps: preparing two acrylic plates, laser etching, thread creation, filling the caves, assembly, and seal integrity check. A schematic diagram of the manufacturing process is shown in Figure 2.

Figure 2.
A schematic diagram of the experimental model manufacturing process [29].
2.2. Experimental Set-Up
Due to the significant differences in size, temperature, pressure, and other conditions between reservoir and laboratory conditions, it is not possible to fully replicate the reservoir in the laboratory [30]. However, to ensure the reliability of the experimental results, we applied similarity criteria to convert reservoir parameters into laboratory parameters. This approach reduces the complexity of the experiment while maintaining its scientific validity. We primarily focused on geometric similarity, dynamic similarity, kinematic similarity, and characteristic similarity, and the detailed methods can be seen in our published papers [29,31].
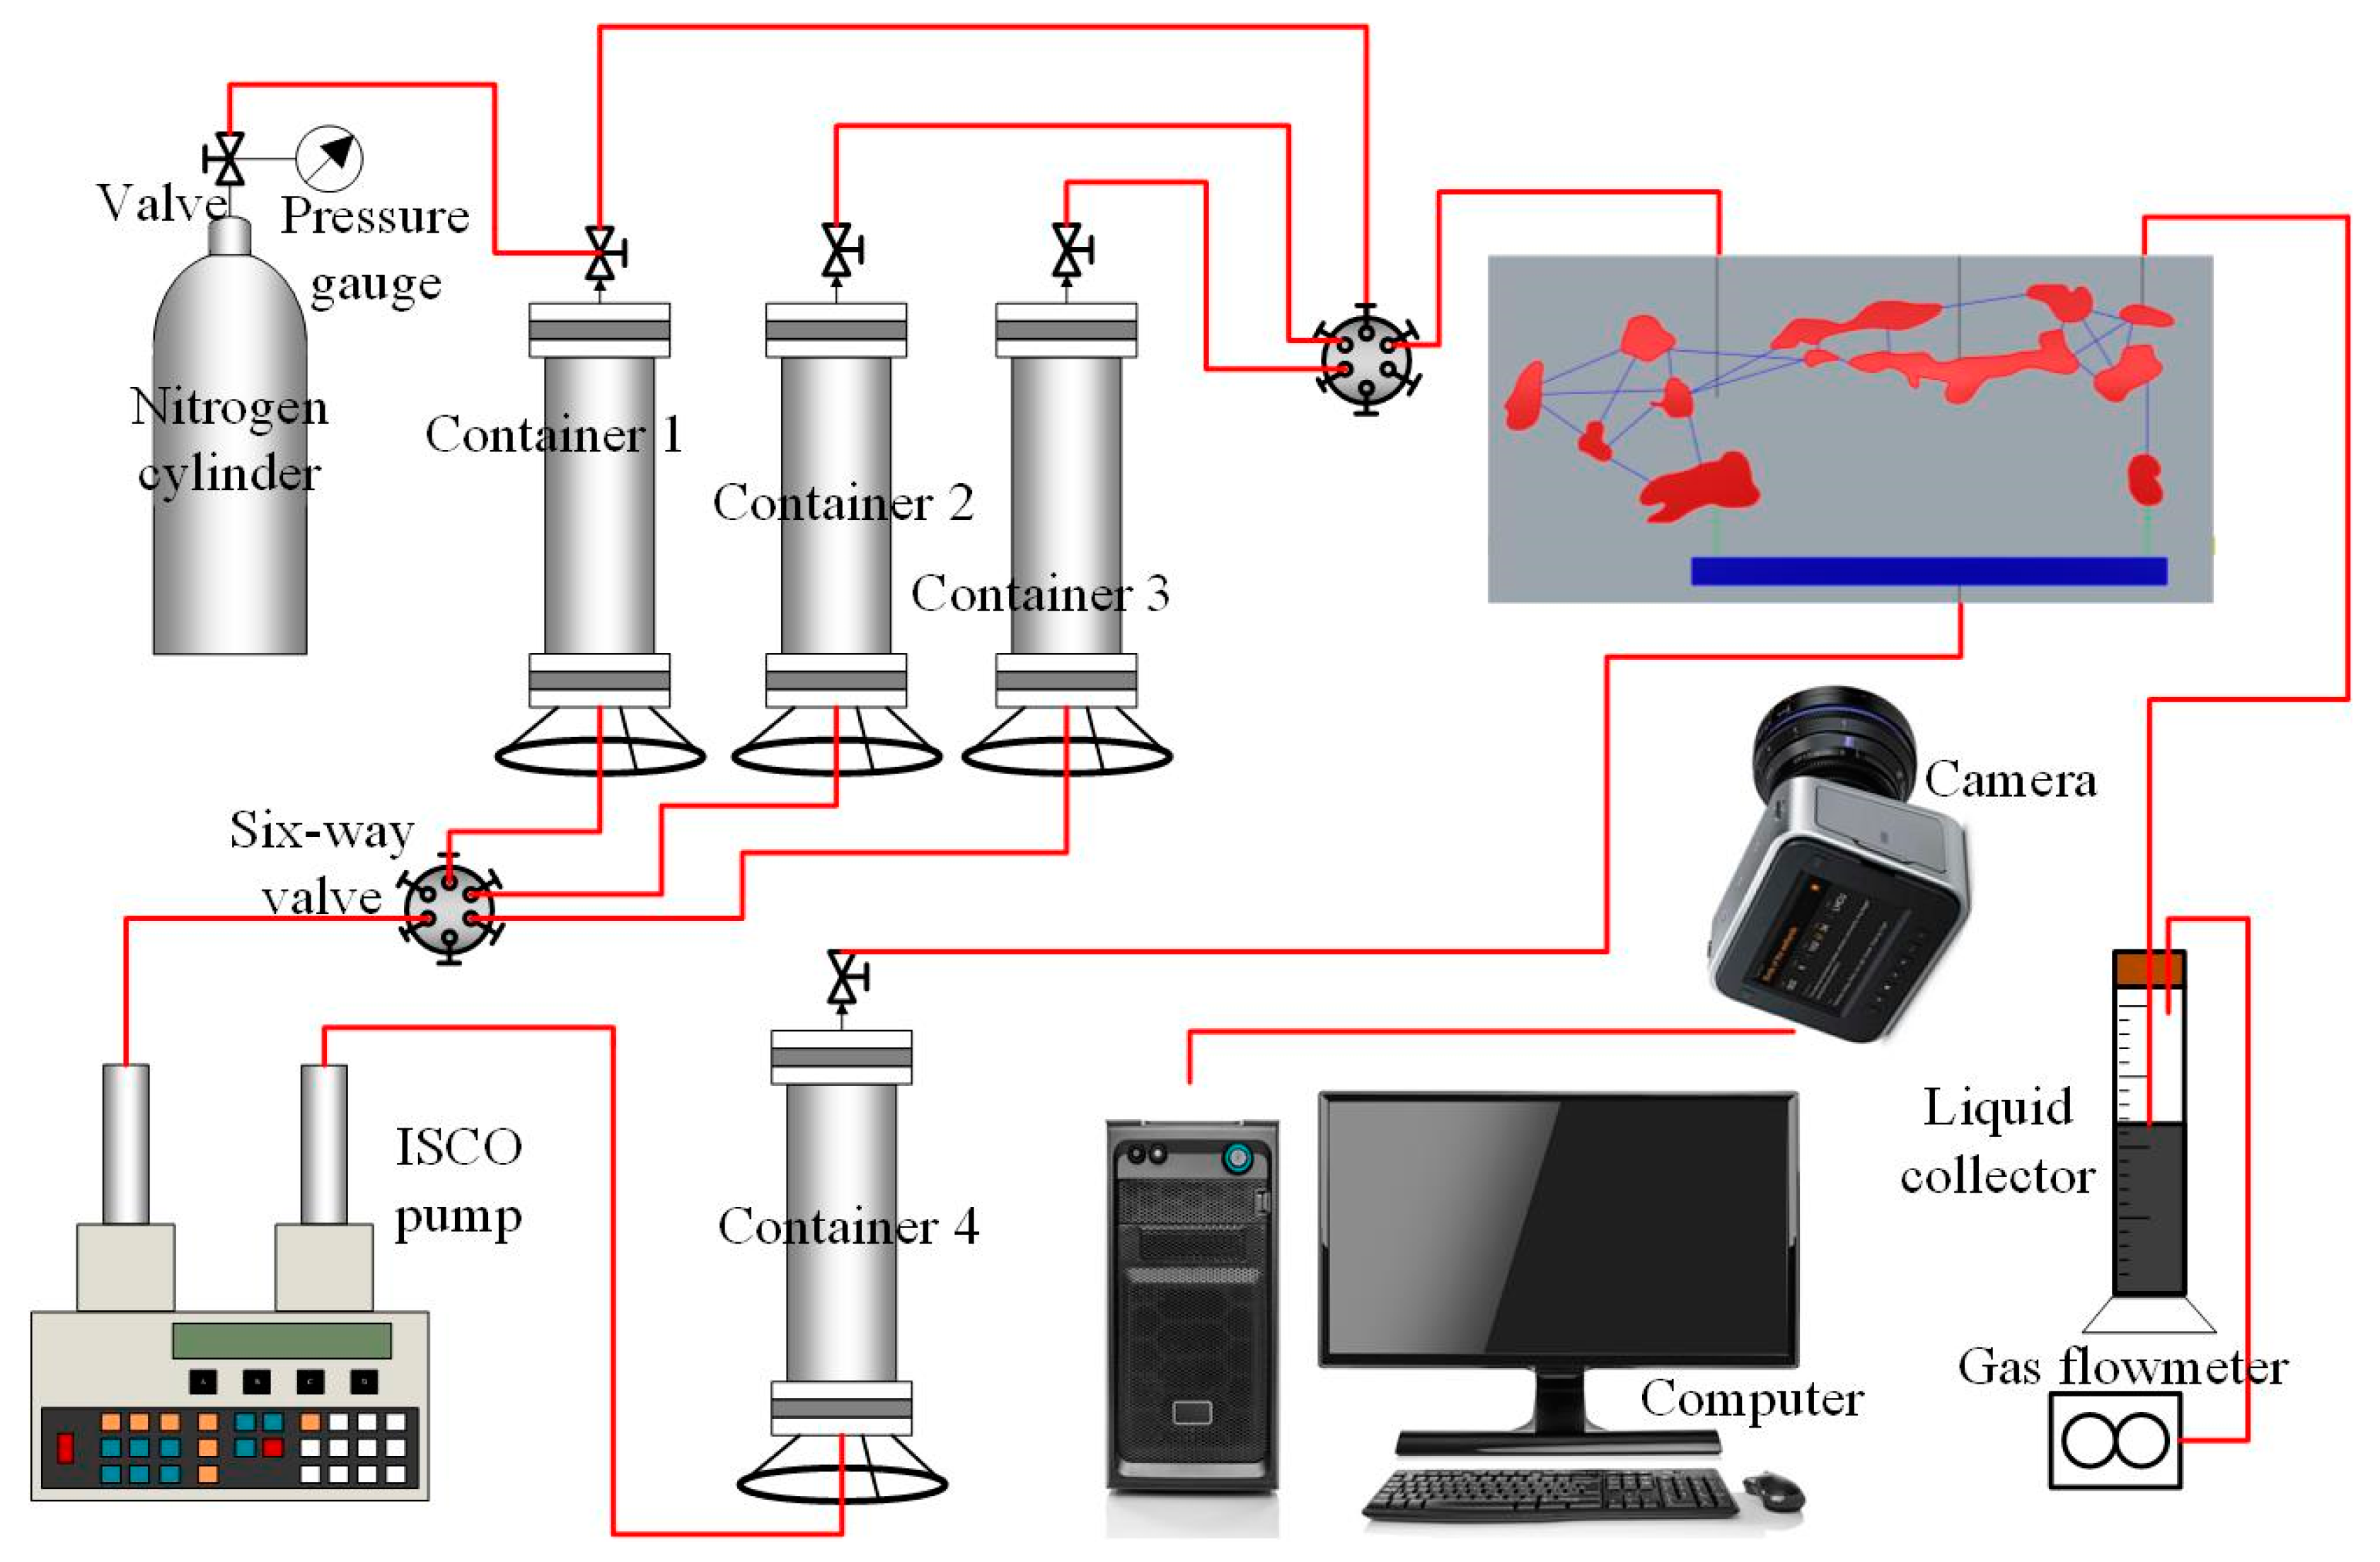
Under the guidance of the similarity criterion, the experiment was carried out at 25 °C and 101 kPa. We utilized aviation kerosene colored by Sudan III as a substitute for underground crude oil, and we used distilled water colored by methyl blue and nitrogen gas as the injection agents. In the experiment, bottom water injection was used to simulate bottom water drive oil recovery, while water or gas injection in injection or gas injection wells was used to simulate water and gas injection oil recovery. The experimental set-up was built using an ISCO pump, a nitrogen cylinder containing nitrogen, four intermediate containers, a pressure gauge, a camera, several valves, etc., as shown in Figure 3. During the experiment, oil and water production at different time periods was detected by the oil and water metering device, and the distribution of oil, gas, and water during the oil displacement process was captured in real time using the camera.

Figure 3.
A diagram of the experimental set-up. Container 1, Container 2, Container 3, and Container 4 contained experimental gas, experimental water, experimental oil, and experimental water, respectively.
2.3. Experimental Scheme and Procedures
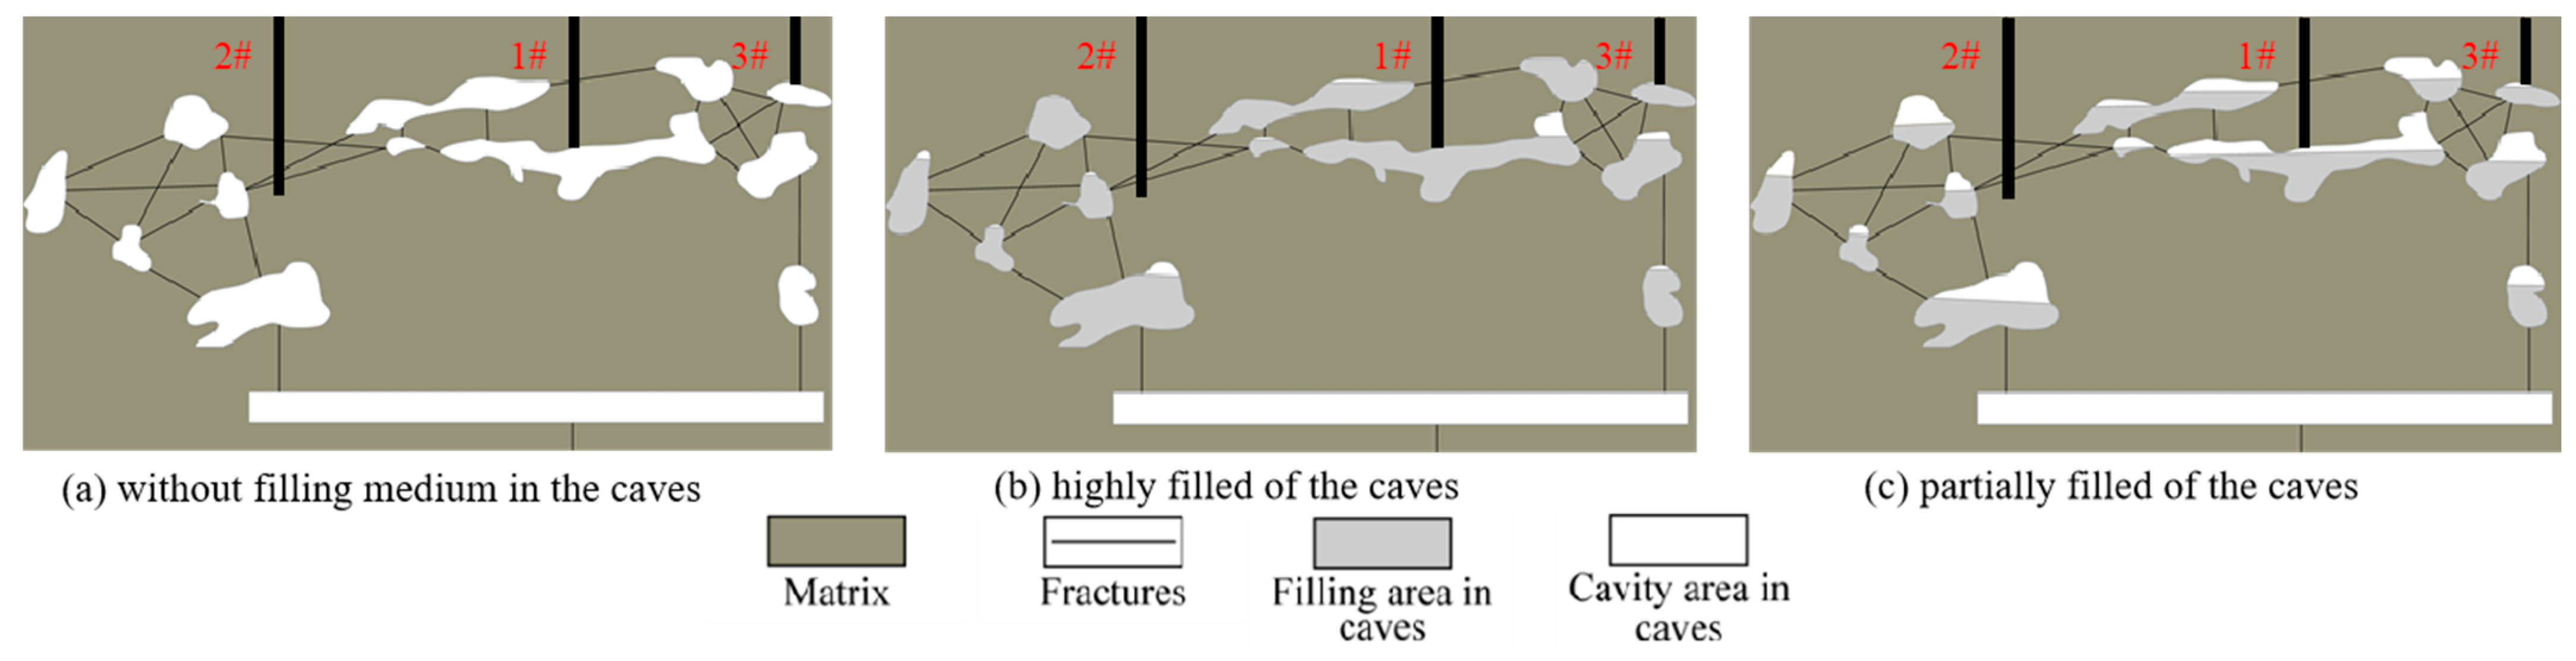
For the weathered crust reservoir, different filling modes and production well locations were considered for bottom water flooding experiments. Then, taking the partially filled caves as an example, multi-well water and gas injection experiments under different initial production well locations were carried out. Each set of the experiment had 7 stages (including the first stage of bottom water flooding); stages 2–3 were the early water injection stages, stage 4 was the middle gas injection stage, and stages 5–7 were the late water injection stages. The bottom water rate and water/gas injection rates were both 5 mL/min during the experiments. Schematic diagrams of the weathered crust reservoir models under different filling modes are shown in Figure 4. For easy identification, we named the 3 wells 1#, 2#, and 3#, representing the middle, left, and right wells, respectively. Specific experimental schemes and injection/production well arrangements are shown in Table 1 and Table 2.
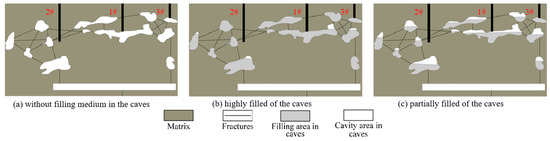
Figure 4.
Schematic diagram of weathered crust reservoir model with different filling modes. 1#, 2# and 3# represents 3 Wells.

Table 1.
The experimental set-up for bottom water flooding.
Table 2.
The well configuration during the period of multi-well water and gas injection flooding.
3. Results and Discussion
3.1. Bottom Water Flooding Rules
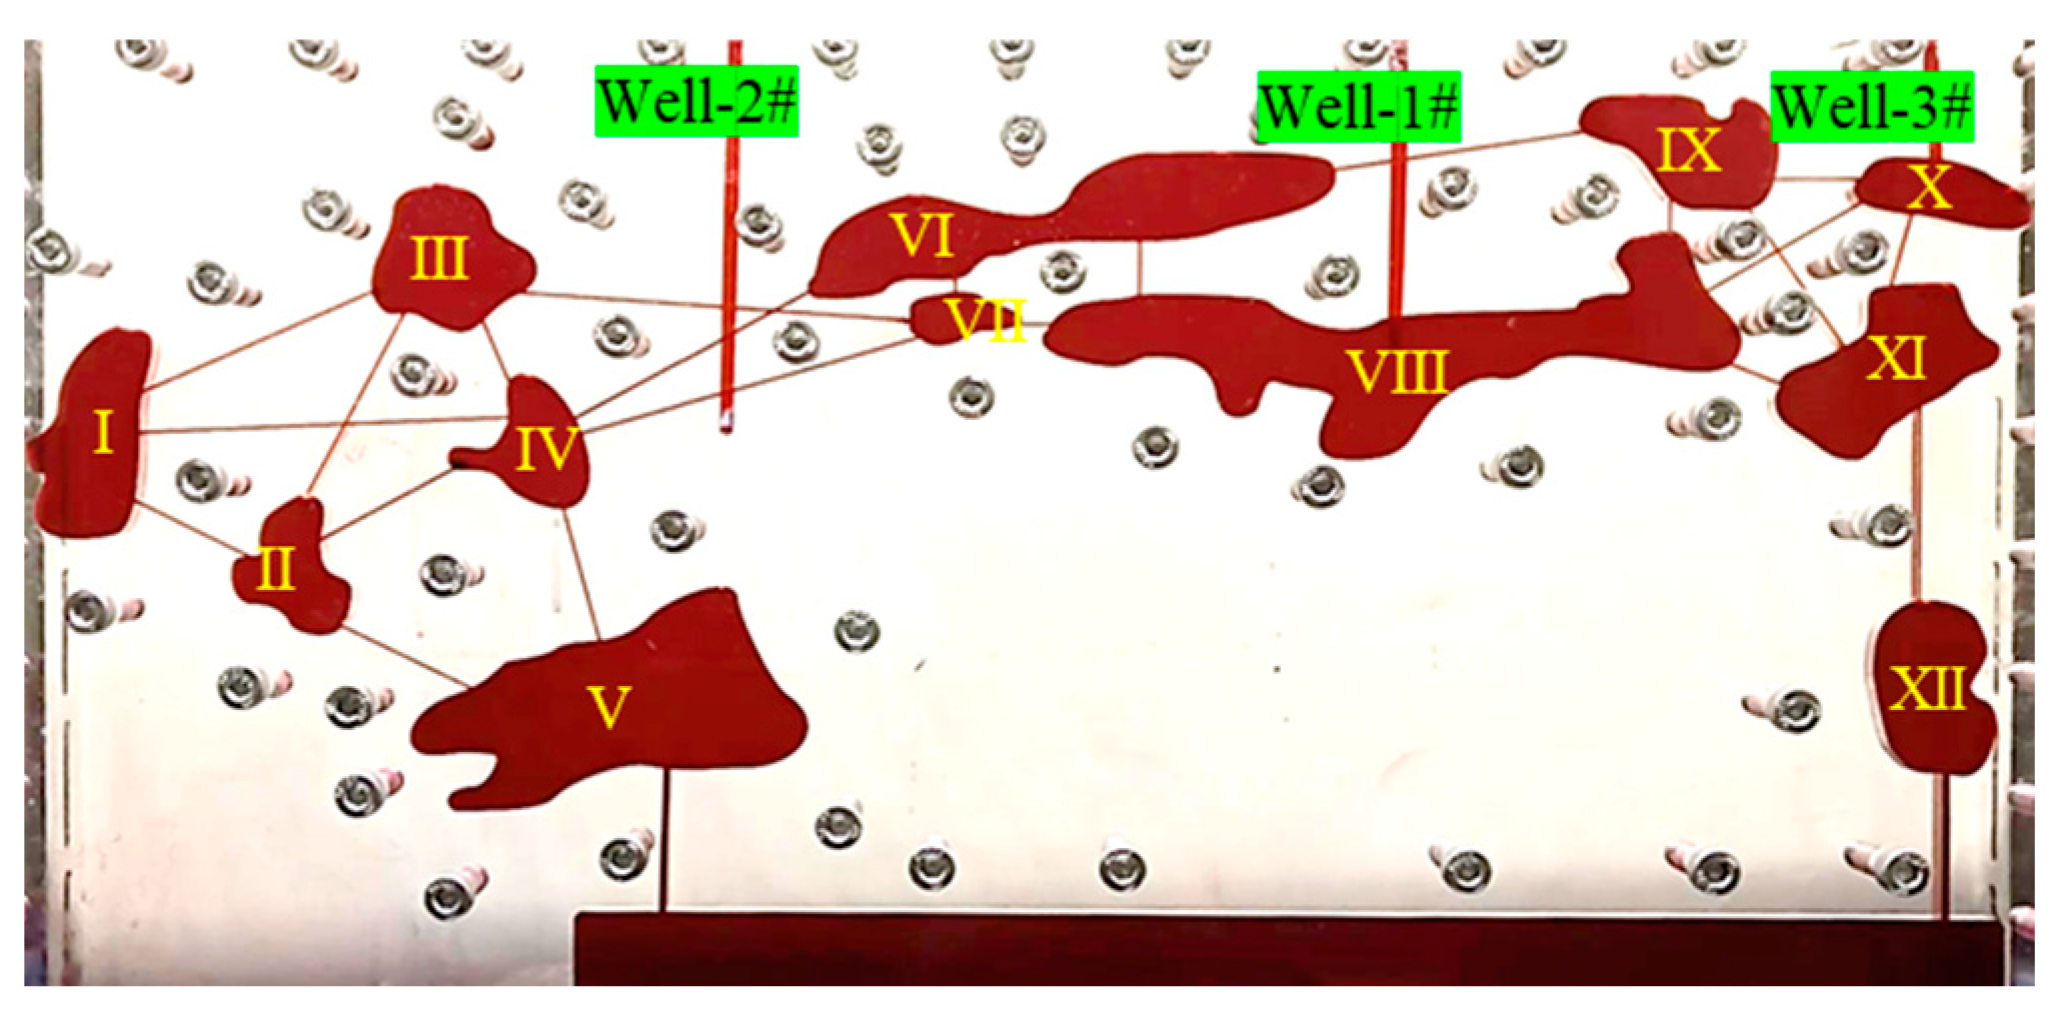
In order to distinguish the bottom water flooding characteristics and development rules in different caves of the weathered crust reservoir, the caves were first numbered as Cave I~Cave XII, as shown in Figure 5. When bottom water entered a certain cave, by comparing and analyzing the overall oil–water distribution differences under different filling modes and production well locations, the differences in bottom water flooding rules under different conditions can be basically reflected.

Figure 5.
The model saturated with oil. I–XII are the number of the caves. Well-1#, Well-2# and Well-3# are wells.
3.1.1. The Effect of Filling Modes
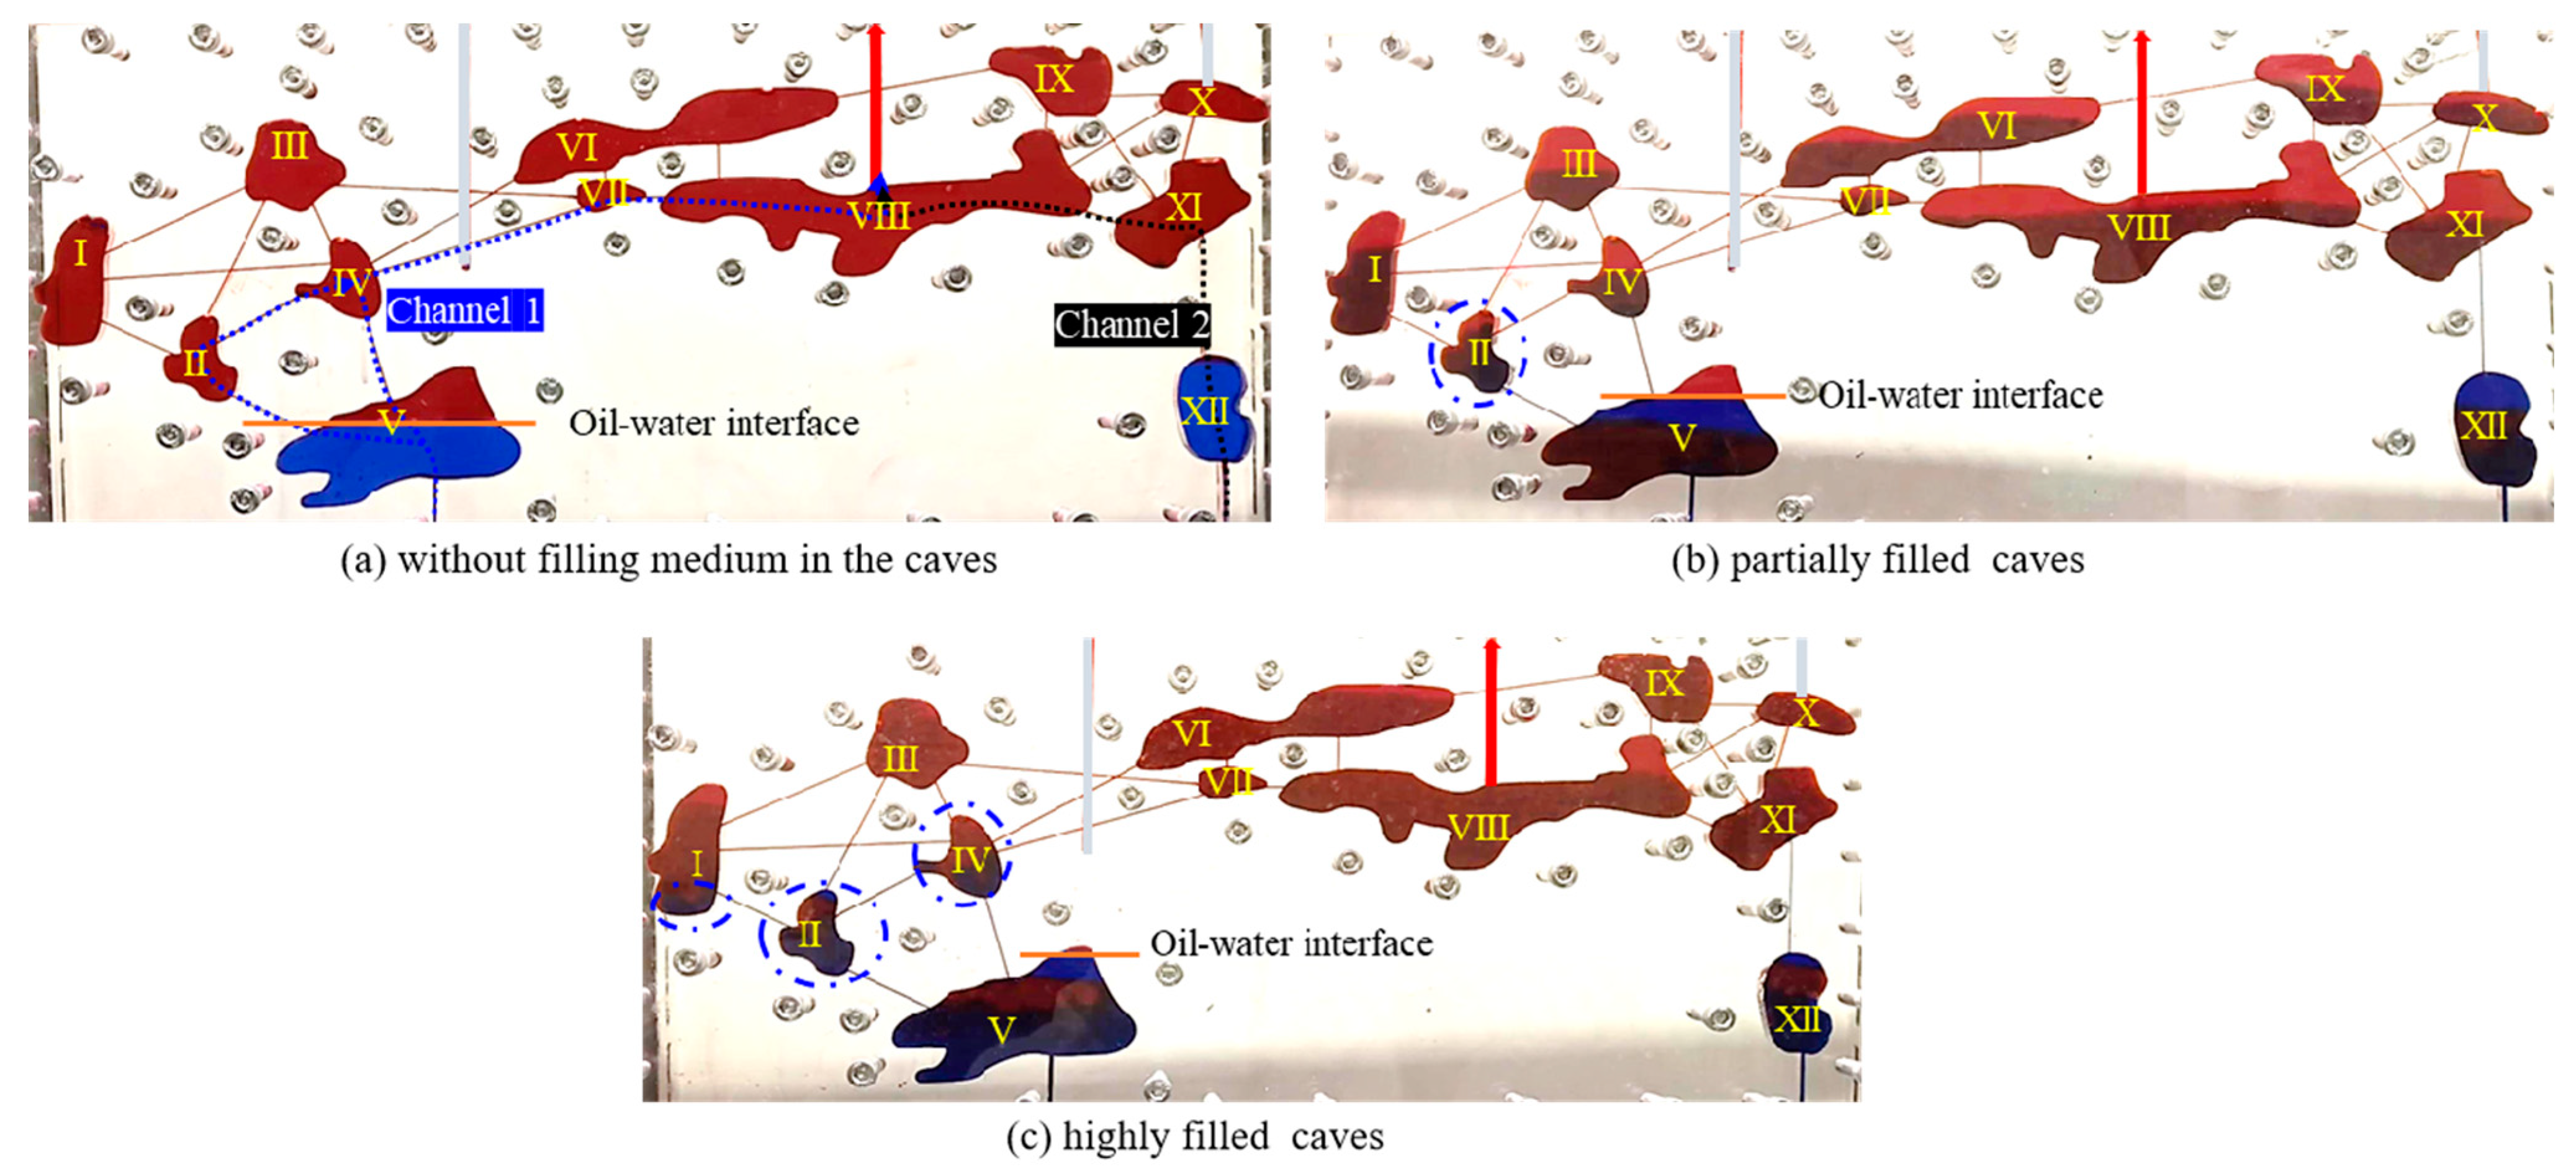
Take Well 1# as the production well for example. When the bottom water enters a cave from the bottom of the cave, a part of the water will flow along the fractures and other caves to the production well. However, due to the gravity difference between oil and water, there is always a distinct oil–water interface, which is most obvious when the cave does not have filling medium. The height of this oil–water interface can reflect the flow characteristics of oil and water. The oil–water distributions in the entire model under different filling modes when bottom water just entered Cave XI are shown in Figure 6.

Figure 6.
The oil–water distribution when bottom water just entered Cave XI with different filling modes. The orange solid lines indicate the oil-water interface. The blue and black dashed lines indicate the bottom water flooding Channel 1 and 2, respectively. The blue dotted circle box emphasize the reach of the water.
By analyzing the fractured-vuggy configuration and connectivity, it can be seen that there were two main bottom water flooding channels to the production well (marked by blue and black dashed lines in Figure 6a). Among them, there were more fractures along Channel 1, while caves were the main component along Channel 2. Since the oil–water flow resistance in the filled area of the caves was higher than that in the fractures, and the flow resistance in the fracture was higher than that in the cavity area of the caves, when there was no filling medium in the caves, the oil–water flow resistance along Channel 1 was greater than that along Channel 2. When the caves were highly filled, the flow resistance along Channel 2 was greater than that along Channel 1. When the caves were partially filled, the flow resistance in the two channels was between the other two filling modes. Based on the above flow resistance analysis, when bottom water just entered Cave XI along Channel 2, due to the difference in filling modes, there was a large difference in the spread range of caves along Channel 1. This spread range difference was mainly reflected in the number of spread caves and the oil–water interface height in Cave V. Comparing Figure 6a–c, it can be seen that when there was no filling medium in the caves, bottom water only entered Cave V. When the caves were partially filled, some water entered Cave II. When the caves were highly filled, bottom water could even enter Caves I and IV. That is, as the degree of cave filling increased, and the flow resistance along Channel 2 became closer to or even higher than Channel 1, forcing more bottom water to flow to the production well along Channel 1. Similarly, with the increase in flow resistance, bottom water overcame gravity in Cave V to increase the longitudinal spread range, making the oil–water interface higher in the cave.
3.1.2. The Effect of Production Well Locations
Taking the filling mode as an example, where the caves were partially filled, we examined the oil–water distribution in the entire reservoir when bottom water first entered Cave XI. This scenario is illustrated in Figure 7, which shows the oil–water distribution under different production well locations. From the figure, it is evident that the location of the production well had a minimal impact on the overall bottom water flooding pattern. Regardless of whether the production wells were located at Well 1#, Well 2#, or Well 3#, water only spread into Caves II, V, and XII. Notably, Cave II, which is the closest to Well 2#, exhibited the most significant spread of water when production occurred at this well.

Figure 7.
The oil–water distribution when bottom water just entered Cave XI with different production well locations.
Upon comparing Figure 6 and Figure 7, it is clear that the filling mode (i.e., the extent to which the caves were filled) had a much greater influence on the oil–water flow and distribution in the early stages of bottom water flooding within the weathered crust reservoir. This demonstrates that the initial filling conditions play a critical role in determining the flow patterns, while the well location has a relatively minor effect on the overall flooding behavior. The impact of the filling mode on the distribution of oil and water was more pronounced, influencing the efficiency of bottom water flooding and the ultimate recovery of hydrocarbons from the reservoir.
3.2. Remaining Oil Distribution Rules and Formation Mechanisms
3.2.1. The Effect of Filling Modes
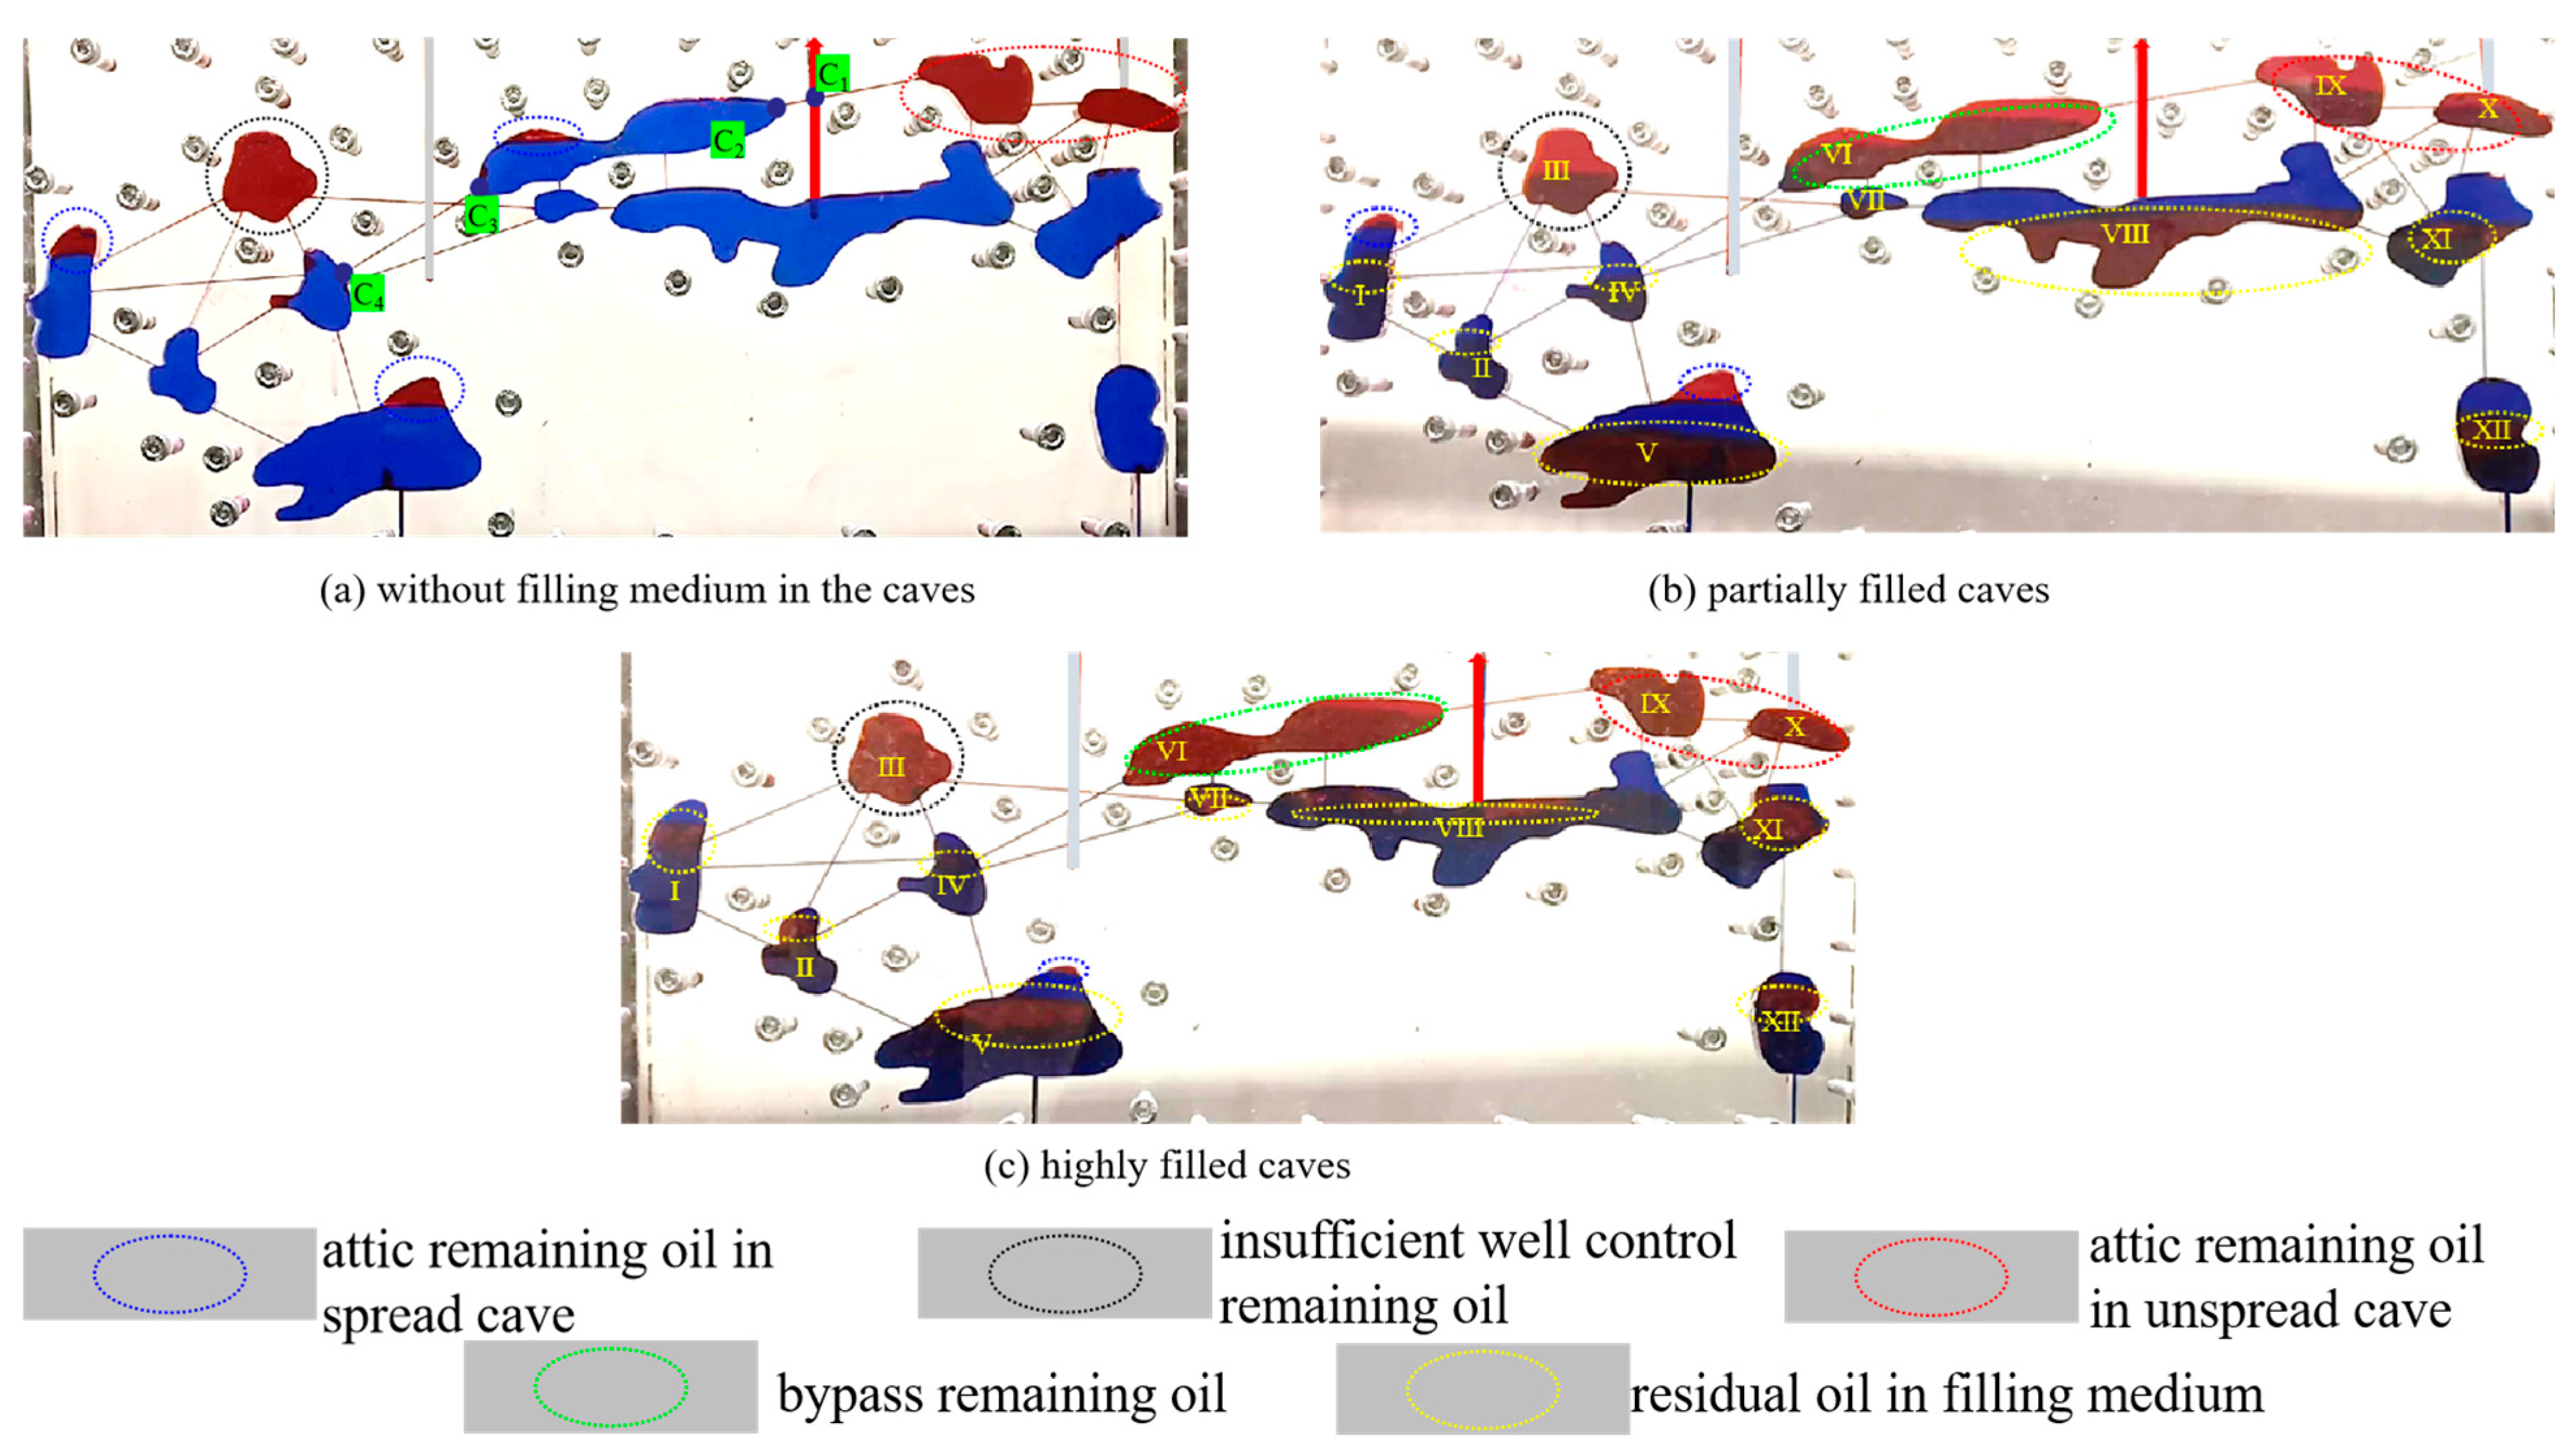
Take Well 1# as the production well for example. The oil–water distributions in the weathered crust reservoir models after bottom water flooding under different filling modes are shown in Figure 8.
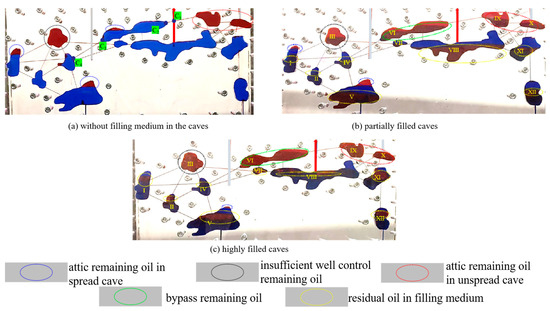
Figure 8.
The remaining oil distribution after bottom water flooding with different filling modes. C1–C4 are the intersections of the fractures, caves, and wells along the path from Cave IV to Cave VI to the production well.
According to the configuration relationship between fractures, caves, and wells, there were two connections between Well 1# and the reservoir, namely the fracture between Cave VI, Cave IX, and Cave VIII. Therefore, the oil and water flowing into the production well may have come from both sides of the fractures on the left and right sides of the production well and the lower caves simultaneously. According to Figure 8a, when there was no filling medium in the caves, Caves III, IX, and X could not be spread by water, leaving a lot of remaining oil. On one hand, this was because these three caves were located in structurally higher positions and were more affected by oil–water gravity segregation. On the other hand, it was also due to the fracture connectivity relationship and production well location, making pressure propagation difficult. Among them, Cave III was farther away from the production well and was more affected by pressure propagation. The remaining oil in this cave was classified as “insufficient well control remaining oil”. Caves IX and X were located in higher structural positions and relatively close to the production well and were relatively more affected by gravity segregation. The remaining oil in these caves was classified as “attic remaining oil”. In addition, comparing the oil–water distributions in each c, it can be seen that only the tops of Caves I and V had a certain amount of remaining oil, while the spread ranges in other cave were close to 100%. This was related to the height difference in the “oil leak point” caused by the fracture communication location. This type of remaining oil was also named “attic remaining oil”.
When the caves were partially filled or highly filled, there were differences in the remaining oil distribution in the reservoir compared with no filling medium in the caves. The differences mainly lay in two aspects. One was the spread difference in Cave VI, and the other was the spread range difference in the spread caves. For Cave VI, it could only be spread by water when there was no filling medium in the caves. This was the result of changes in the relationship between gravity and capillary resistance. We marked the intersections of the fractures, caves, and wells along the path from Cave IV to Cave VI to the production well as C1, C2, C3, and C4, as shown in Figure 8a. First, as part of the bottom water rose from Cave VIII along the wellbore to point C1, the gravity it experienced increased. At the same time, another part of the bottom water in the channel from Cave IV to point C1 gradually overcame the capillary resistance in the fracture to breakthrough point C4 to point C3. Then, when this part of water entered Cave VI through point C3, the flow resistance dropped sharply and continued to rise in the cave. Finally, when the bottom water flowed to point C2, Cave VI was almost completely spread. However, when the caves were partially filled or highly filled, in the process of the bottom water driving oil from point C4 to points C3, C2, and C1, it was also restricted by the frictional resistance in the filling medium and greater capillary resistance. When the cave was partially filled, only a small amount of water could flow into Cave VI. When the cave was highly filled, water could not enter Cave VI at all. Therefore, the remaining oil in Cave VI was formed by the bypass of this channel restriction, which can be summarized as “bypass remaining oil”.
For the spread range in the spread caves, when the caves were partially filled or highly filled, the oil displacement effect in the lower half of the filled area was significantly higher than that in the upper half. This was due to the rapid upward surge of bottom water when close to the cavity area. This remaining oil can be called “residual oil in filling medium”. When the caves were large in size and the thickness of the filling area was low, after bottom water entered the cave, it surged rapidly into the cavity area, resulting in a very small spread range in the filling area, as shown in Caves V and VIII in Figure 8b.
By measuring the amount of oil and water produced from the production well, the real-time oil recovery and water cut were calculated. The oil recovery was calculated using the following formula:
where Vo is oil production, m3; ρo is the oil density, kg/m3; and W1 and W2 are the mass of the model before and after saturating oil, kg.
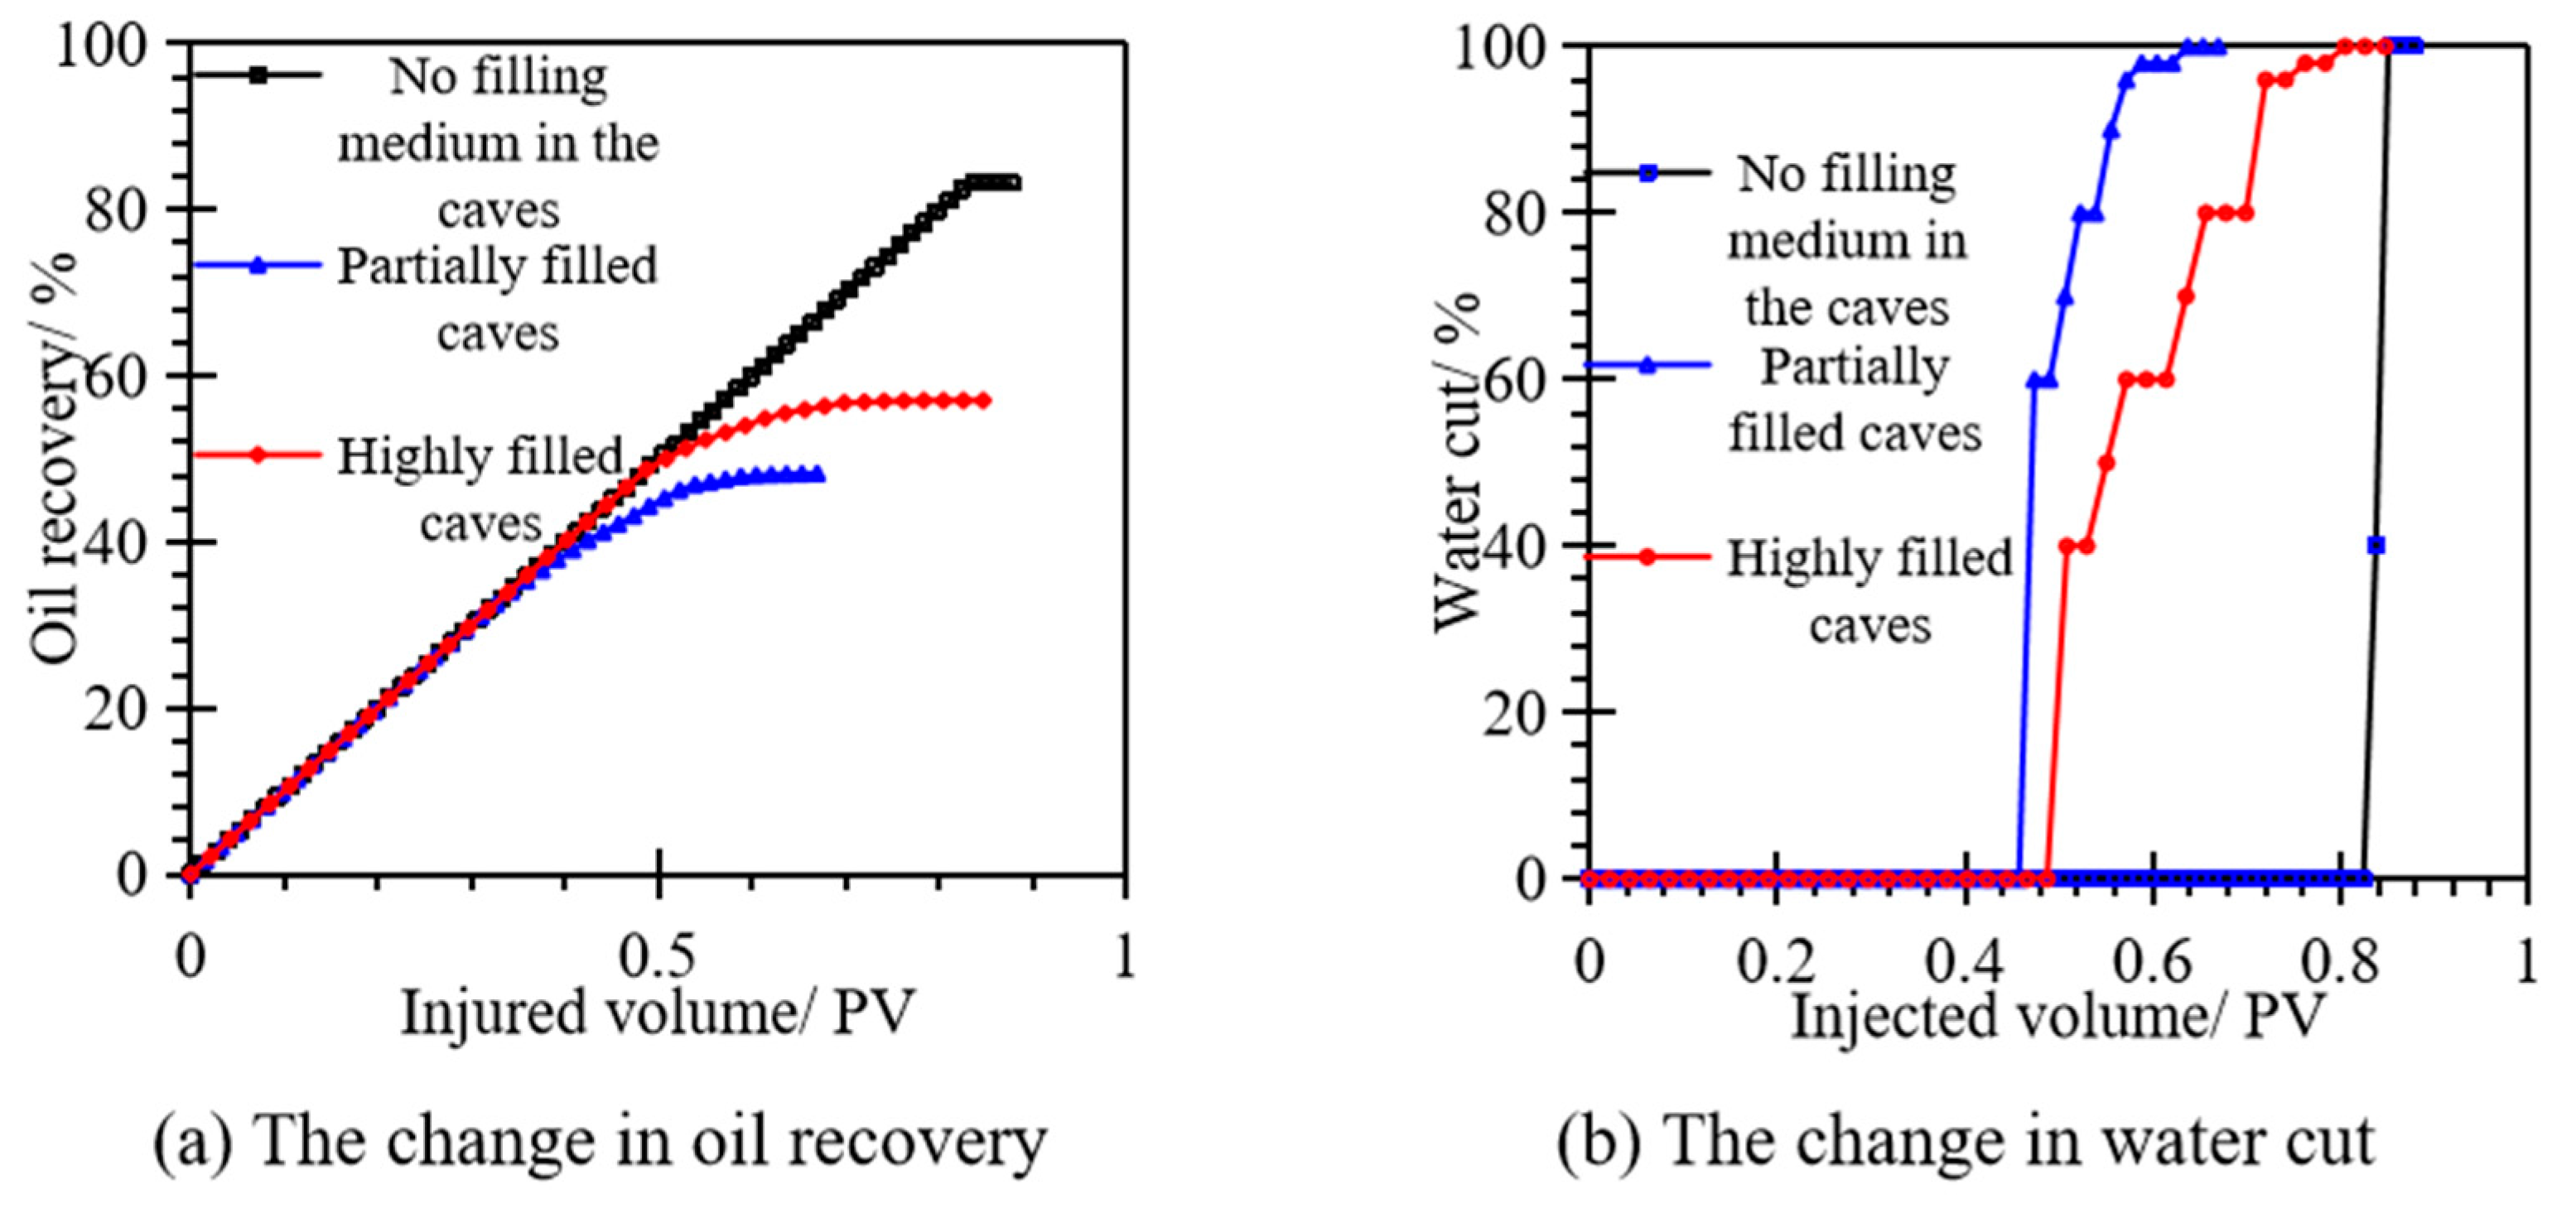
The production curves of the weathered crust reservoir during bottom water flooding under different filling modes when the production well was Well 1# are shown in Figure 9. According to Figure 9a, since the number of caves spread by bottom water and the spread range in each cave were much higher when there was no filling medium in the caves, the recovery rate was also far higher than the other two filling modes, reaching 83.2%. When the cave was partially filled, the spread range of the filling area under this filling mode was significantly lower than that when the cave was highly filled, so the recovery rate was only 48.5%. According to Figure 9b, when there was no filling medium in the caves, the oil–water interface rose horizontally in each cave. After water breakthrough, the production well was quickly flooded, so the water breakthrough time was later, and the rising speed was faster. When the caves were highly filled, oil kept being produced from the filling area, and the water cut rise rate was the slowest, rising in steps.

Figure 9.
The production curves during bottom water flooding with different filling modes.
3.2.2. The Effect of Production Well Locations
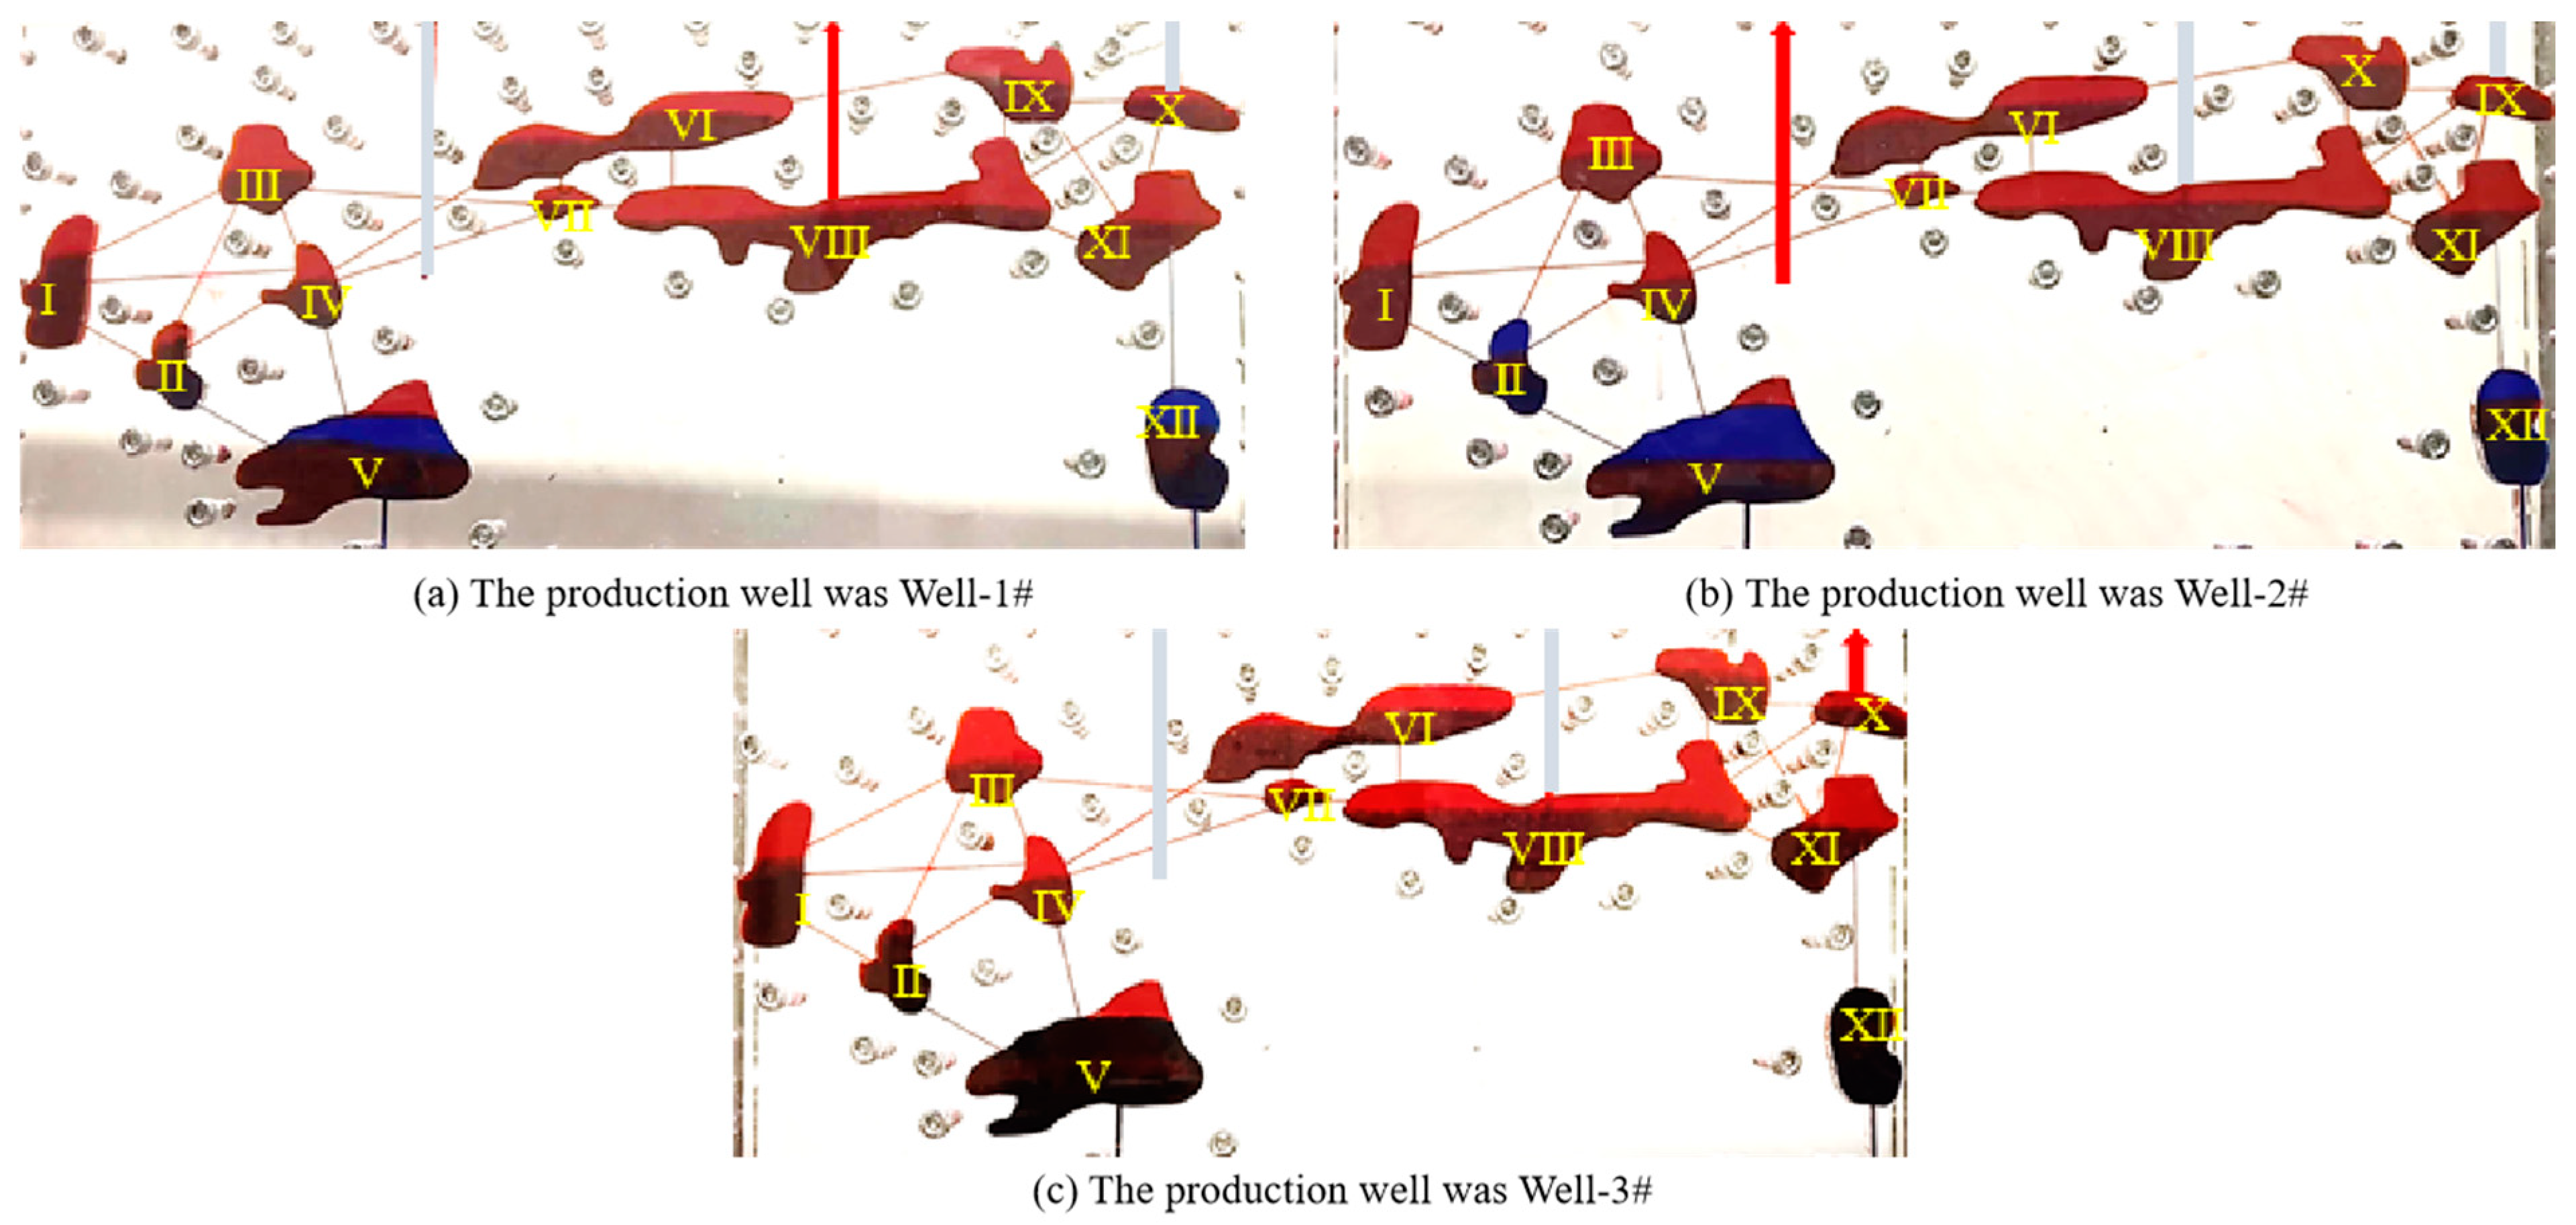
Take the filling mode as partial filling for example. The oil–water distributions after bottom water flooding in the weathered crust reservoir produced from different well locations are shown in Figure 10. Because the seepage capacity differences between the various channels were small, although the differences in production well locations were significant, the differences in remaining oil distribution were little. Only when the production well was Well 3# was there an oil leak channel at the top of Cave X. Therefore, there was no “attic remaining oil” in this cave. In this cave, a small amount of “residual oil in filling medium” was formed due to the surge of bottom water from the filling area to the cavity area.

Figure 10.
The remaining oil distribution after bottom water flooding with different production well locations.
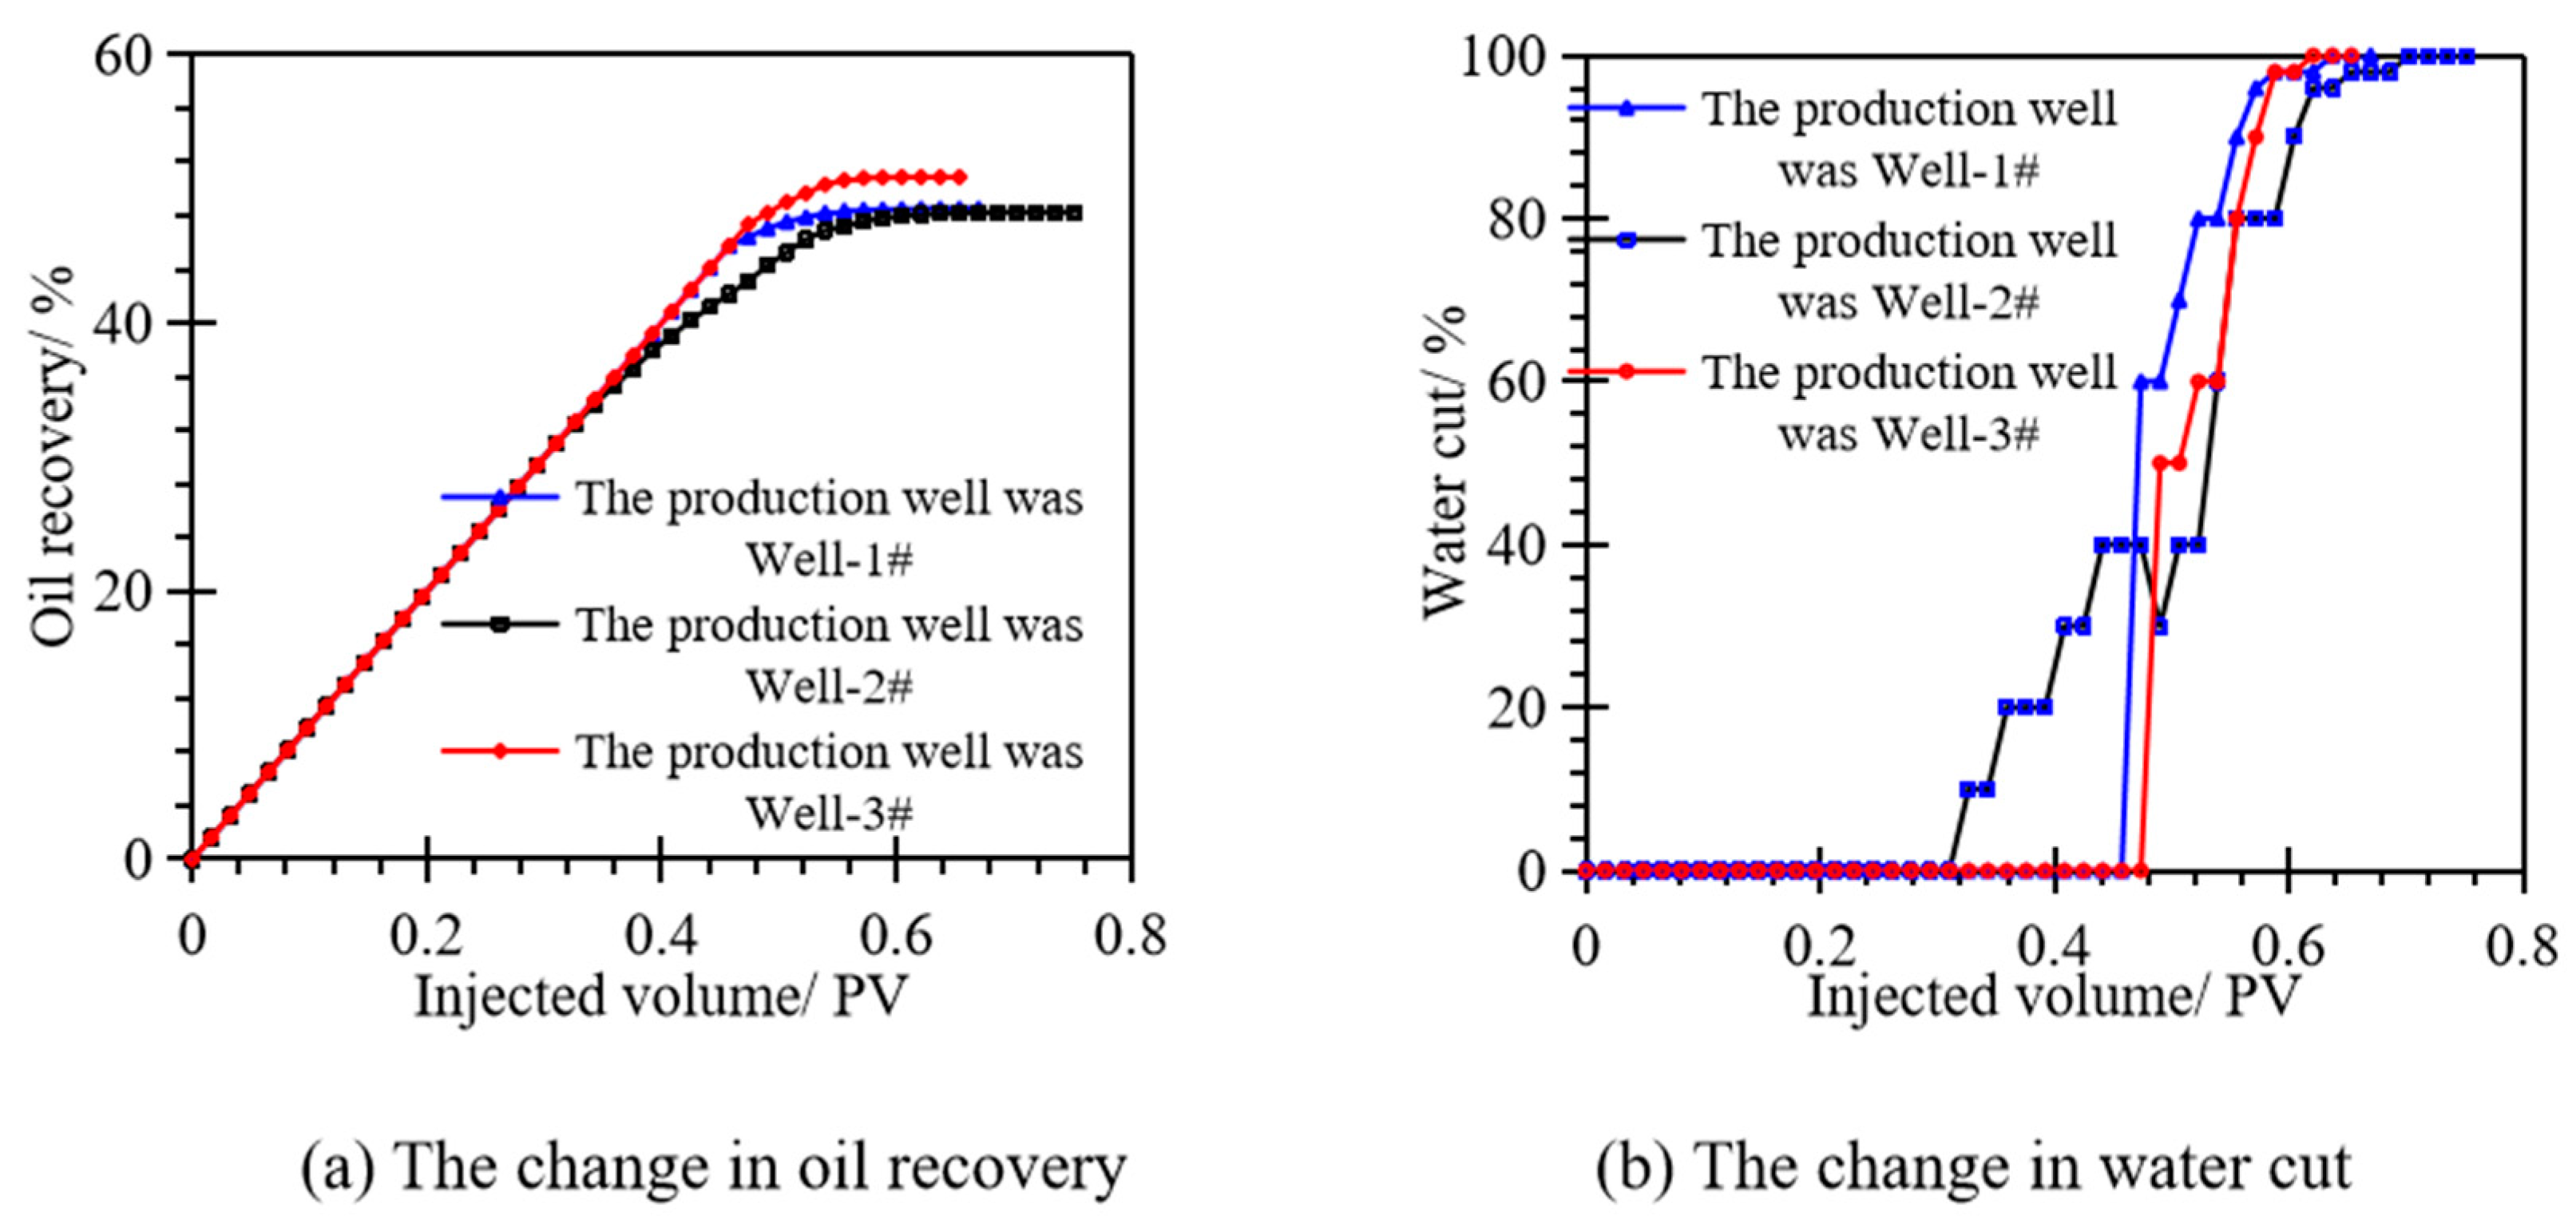
The production curves of the weathered crust reservoir during bottom water flooding under different production well locations when the filling mode was partial filling are shown in Figure 11. According to Figure 11a, since the differences in the number of spread caves and the spread range in each cave under the three well locations were small, the recovery rates were all between 48.3% and 50.9%. According to Figure 11b, although the remaining oil distribution differences after bottom water flooding under the three well locations and the recovery rates were not very different, there were differences in the types of fracture cave connections communicated with the wells under the three well locations, and the water cut change curves differed greatly. When the production well was Well 2#, the water breakthrough time was the earliest, the simultaneous oil and water production period was the longest, and the production time was also the longest. This was because the well was located in the fracture, so bottom water surged into the bottom of the well quickly, causing early water breakthrough in the production well. With multiple fractures communicating with the production well, oil and water were produced simultaneously for a long time.
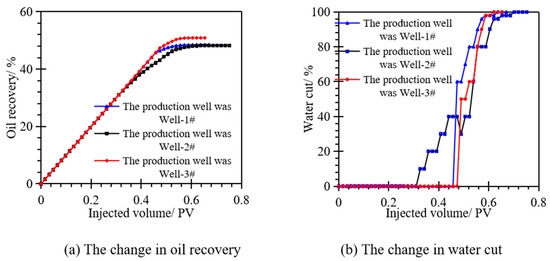
Figure 11.
The production curves during bottom water flooding with different production well locations.
3.3. Mechanism of Increasing Oil Recovery by Multi-Well Water and Gas Injection
3.3.1. Well 1# as the Initial Production Well
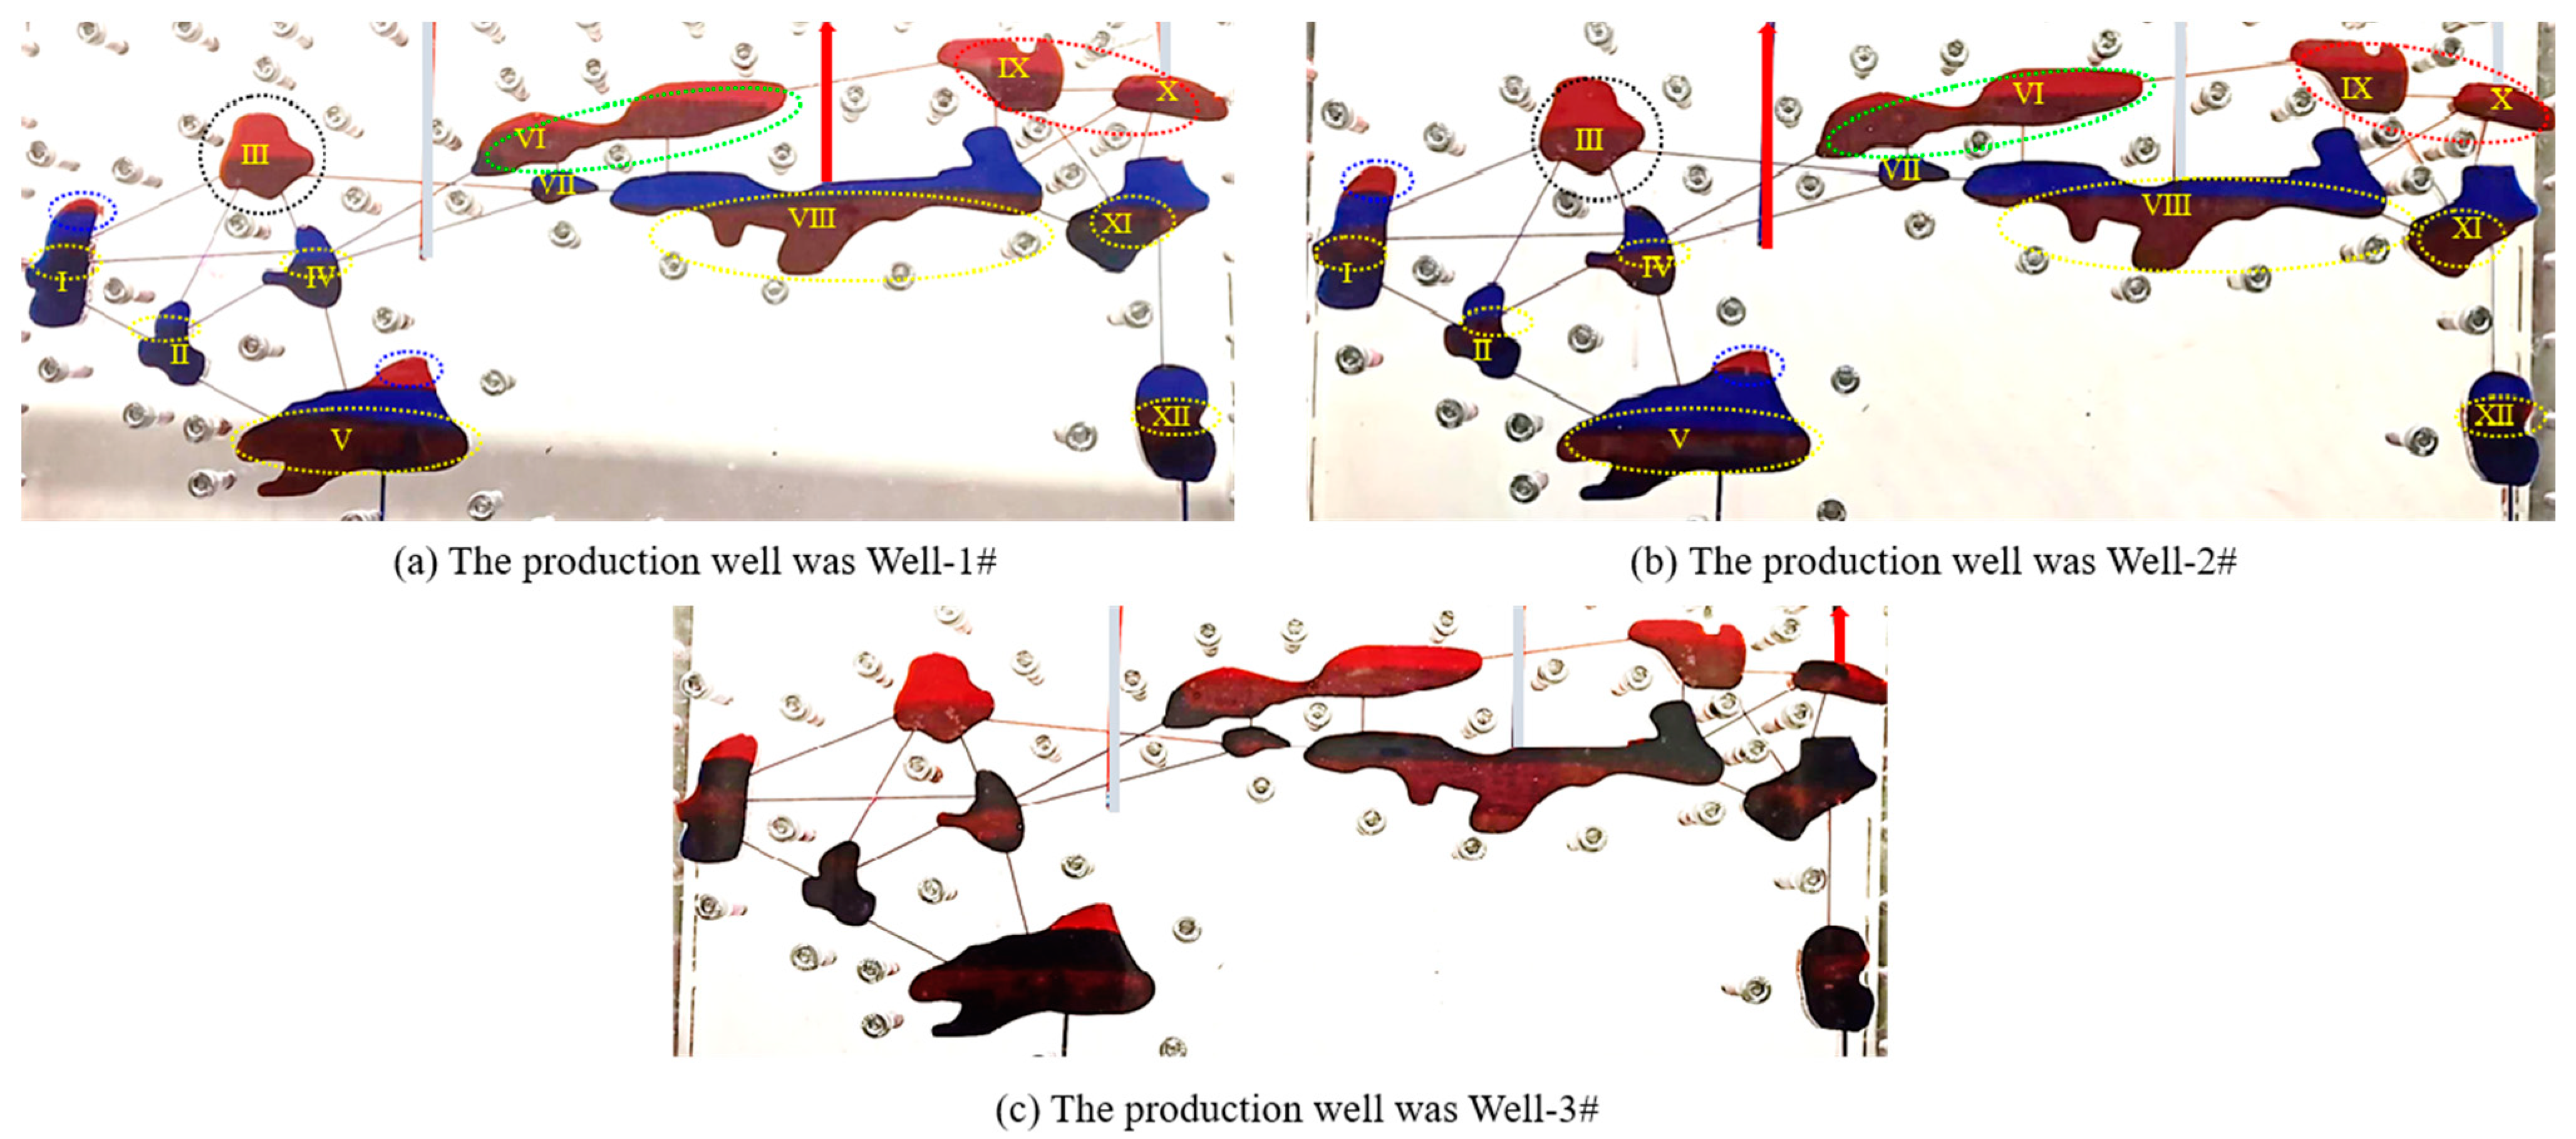
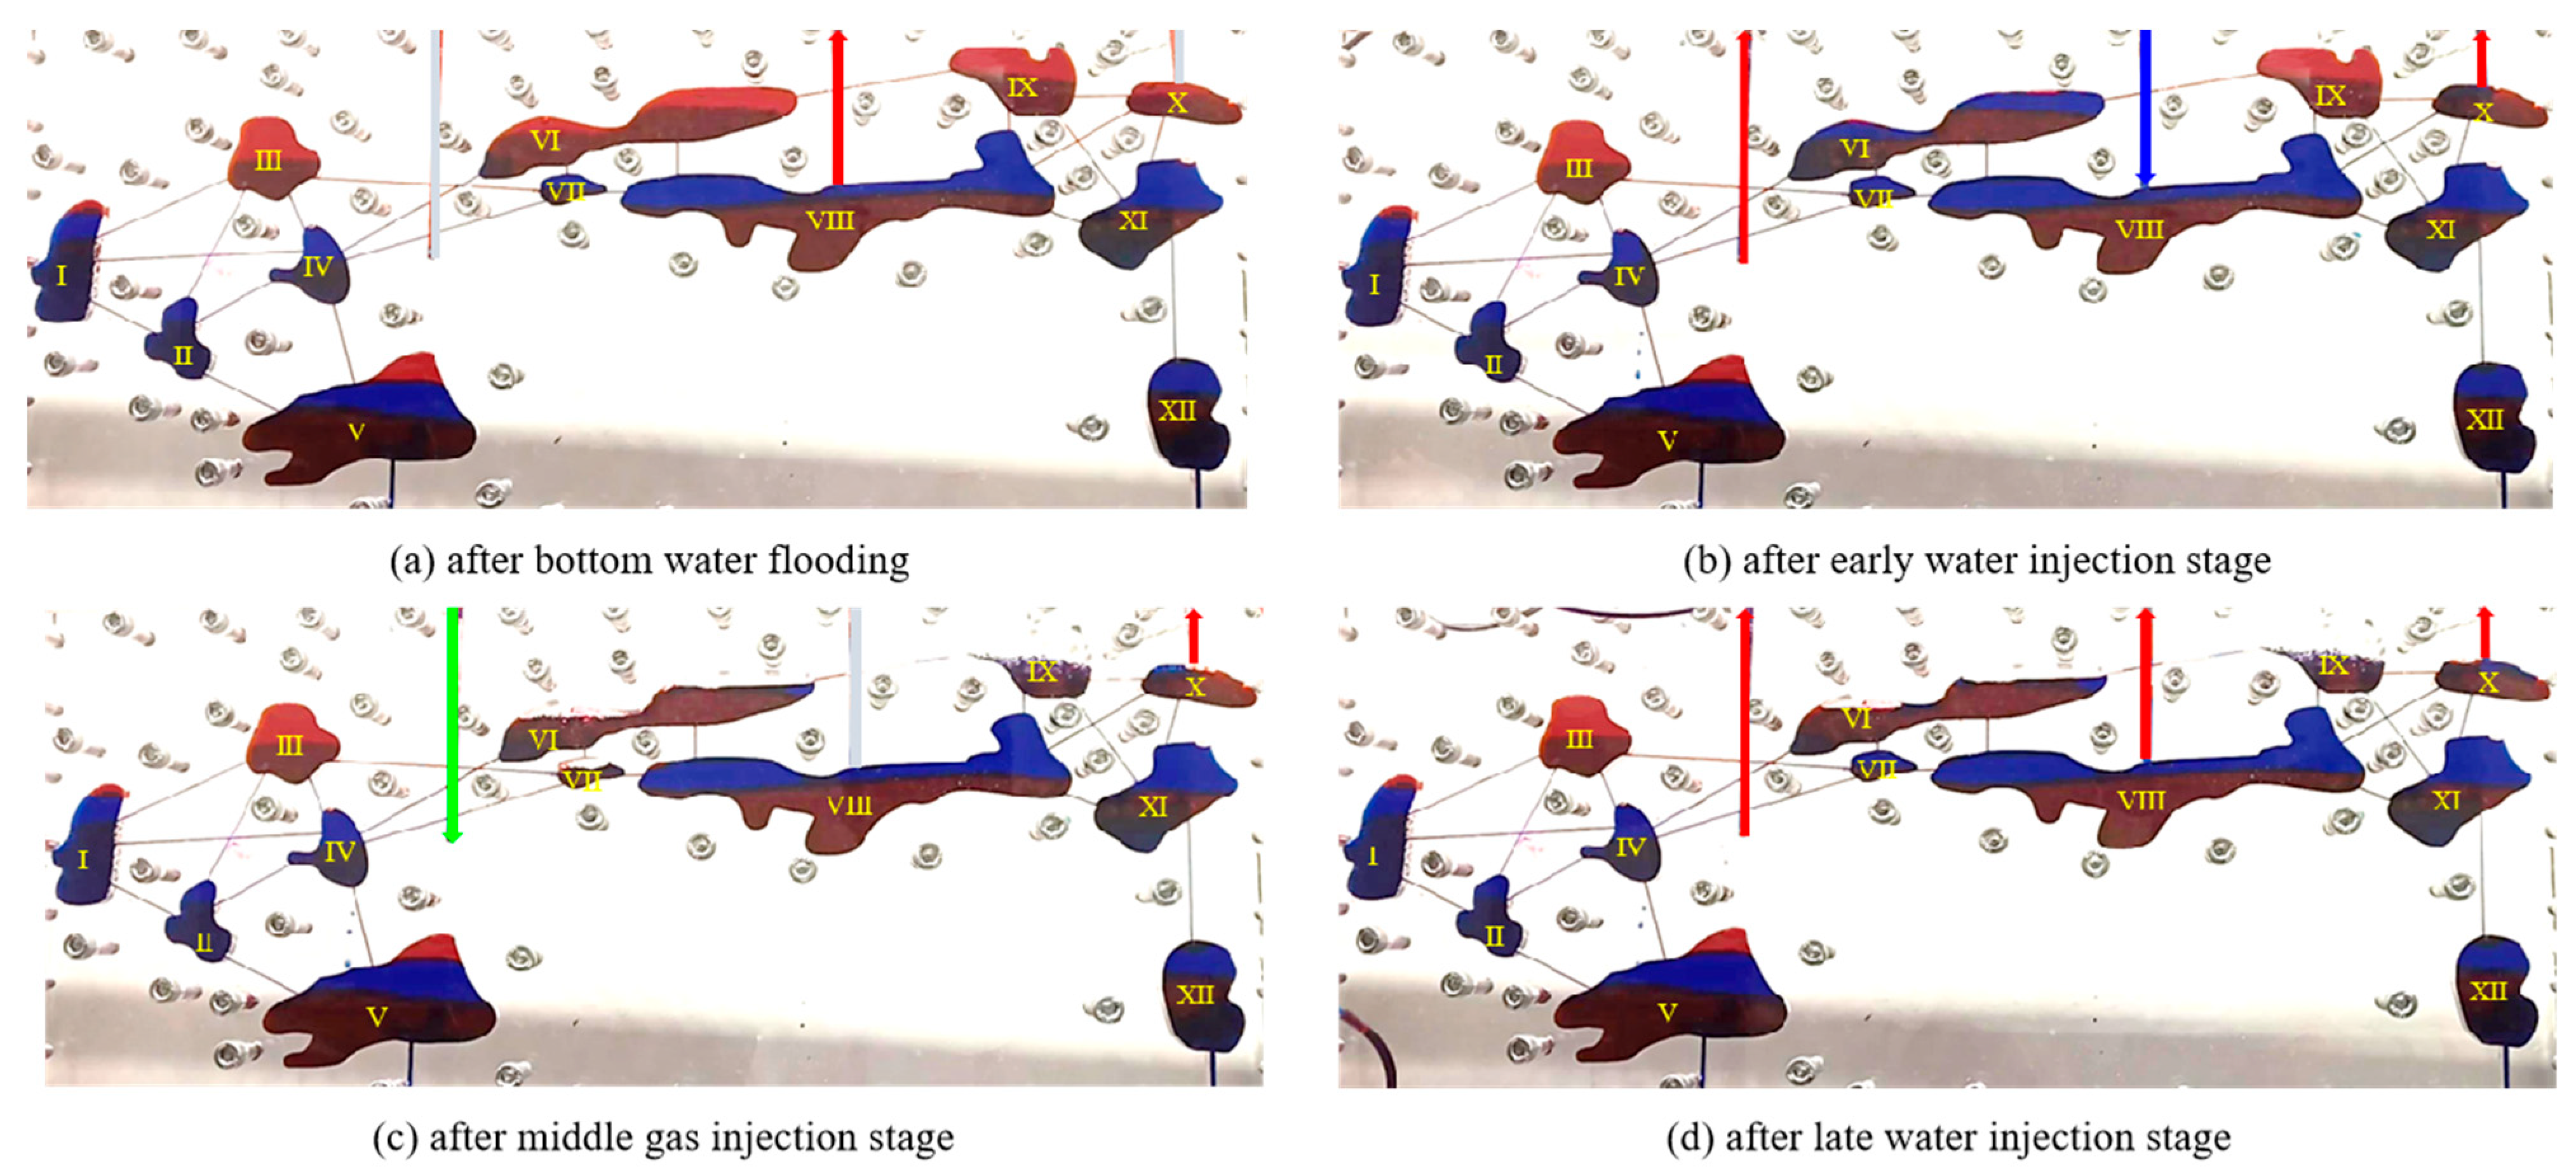
According to experimental scheme FHQ01 in Table 2, the oil, gas, and water distributions after each production stage when the initial production well was Well 1# are shown in Figure 12. Comparing Figure 12a,b, it can be seen that in the early water injection stage, the remaining oil recovered was in Cave VI and Cave X, which were “bypass remaining oil” and “attic remaining oil”, respectively. The reason for recovering the bypass remaining oil in Cave VI was that when the injection and production well locations were switched to Well 2# for injection and Well 3# for production, a new oil displacement channel from left to right was added, pushing the oil in the cave to Caves IX and X for production. The reason for recovering the remaining oil in Cave X was that using Well 3# as the production well added a new oil leak channel, breaking the attic trap.
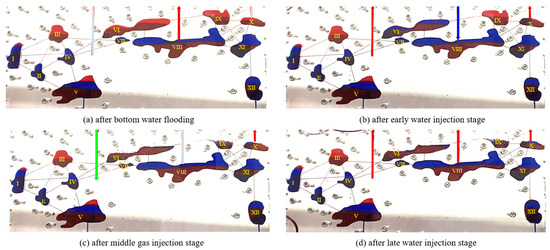
Figure 12.
The change in oil–gas–water distribution when the initial production well was Well 1# (the experimental scheme of FHQ01).
In the middle gas injection stage, the injection and production wells were Well 2# and Well 3#, respectively. Due to the gravity segregation of oil, gas, and water, the injected gas can only flow along Cave VI, Cave VII, Cave IX, and Cave X. The main remaining oil displaced in this stage was the “attic remaining oil” in Cave IX. Since the gas mainly flowed in the cavity area of the caves, the displacement effect on other “residual oil in filling medium” in the caves was poor.
In the late water injection stage, the influence of water injection on remaining oil displacement and oil–gas–water distribution change was very small. It just slightly increased the spread range of the cavity area in Cave X by changing the flow direction.
3.3.2. Well 2# as the Initial Production Well
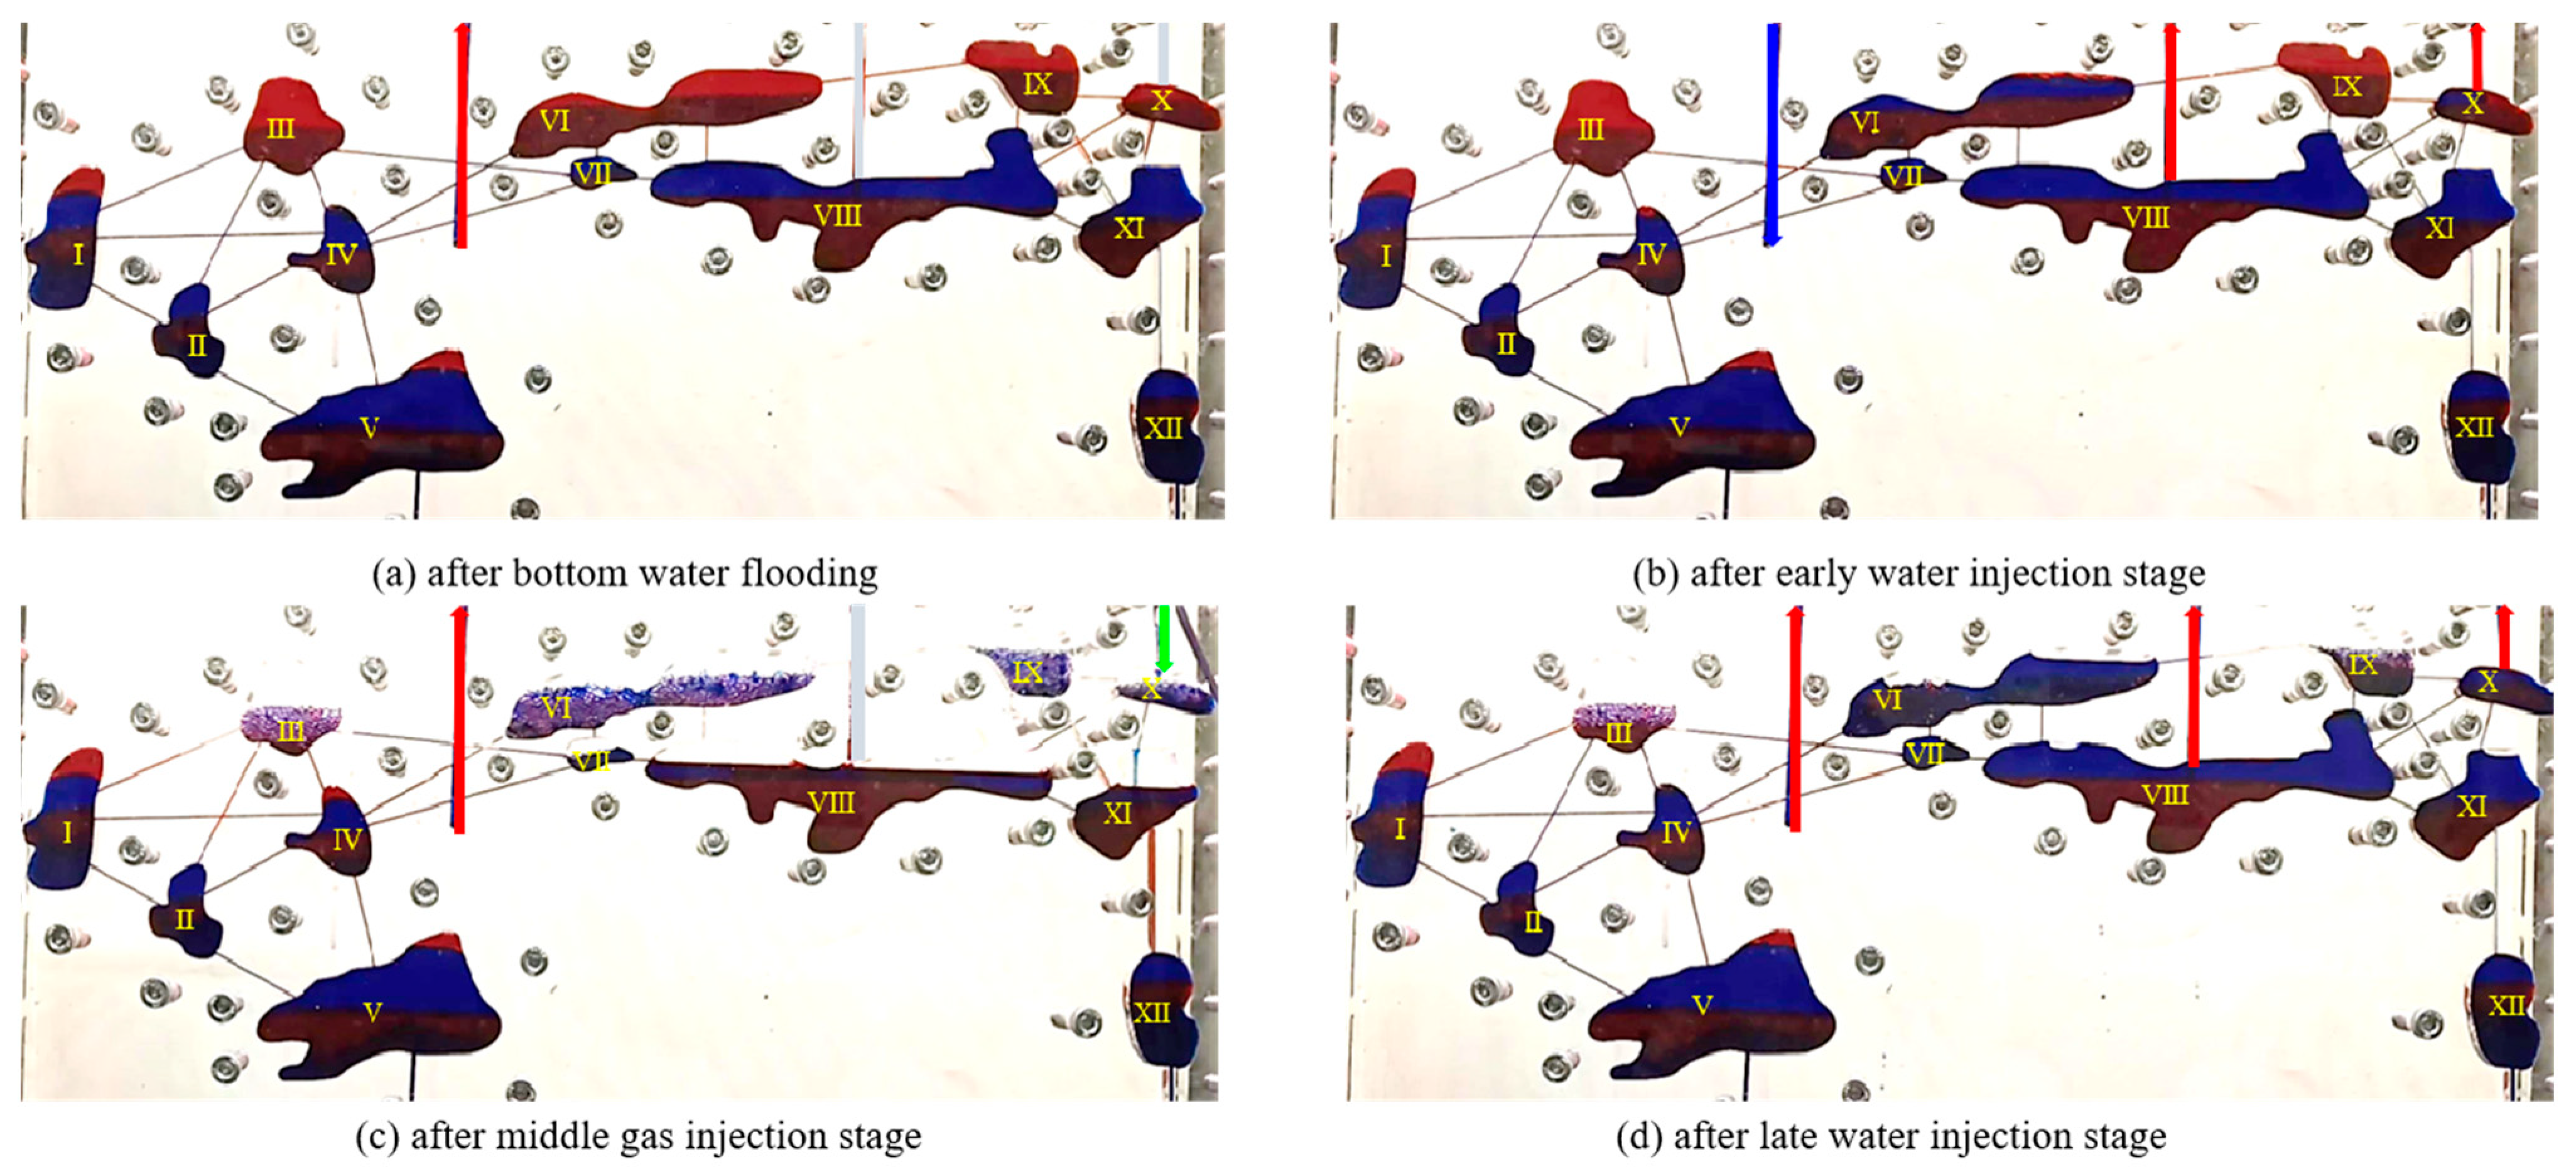
According to experimental scheme FHQ02 in Table 2, the oil, gas and water distributions after each production stage when the initial production well location was Well 2# are shown in Figure 13. Since there was also an oil displacement channel from left to right when Well 2# was used for injection and Well 1# was used for production in the early water injection stage, part of the remaining oil in Cave VI was also effectively recovered, and its oil–water distribution was consistent with that shown in Figure 12b.

Figure 13.
The change in oil–gas–water distribution when the initial production well was Well 2# (the experimental scheme of FHQ02).
Comparing Figure 12c or Figure 13c, in the middle gas injection stage, due to the difference in injection and production directions, the spread range of gas was also different. In Figure 13c, the gas injection well was higher than the production well, so the longitudinal spread range of gas was wider. The cavity area of Caves VIII and IX were effectively spread, and the spread range in Caves X and XI covered the filling area, effectively recovering the remaining oil in it. That is, high injection and low production gas injection can recover more “attic remaining oil”. In addition, since the contact area between the fracture and the well was relatively small, when the gas contacted the production well from the fracture, there was still some gas continuing to flow forward and entering Cave III, displacing the remaining oil in it. That is, cave injection and fracture production gas injection can also expand the lateral spread range, playing a role in recovering “insufficient well control remaining oil”.
In the late water injection stage, the cavity area of Caves VII, VIII, X, and XI will be occupied by water again. And after re-water injection, the filling area of Caves VI and IX can be “washed” again, playing a synergic “washing” role of gas and water.
3.3.3. Well 3# as the Initial Production Well
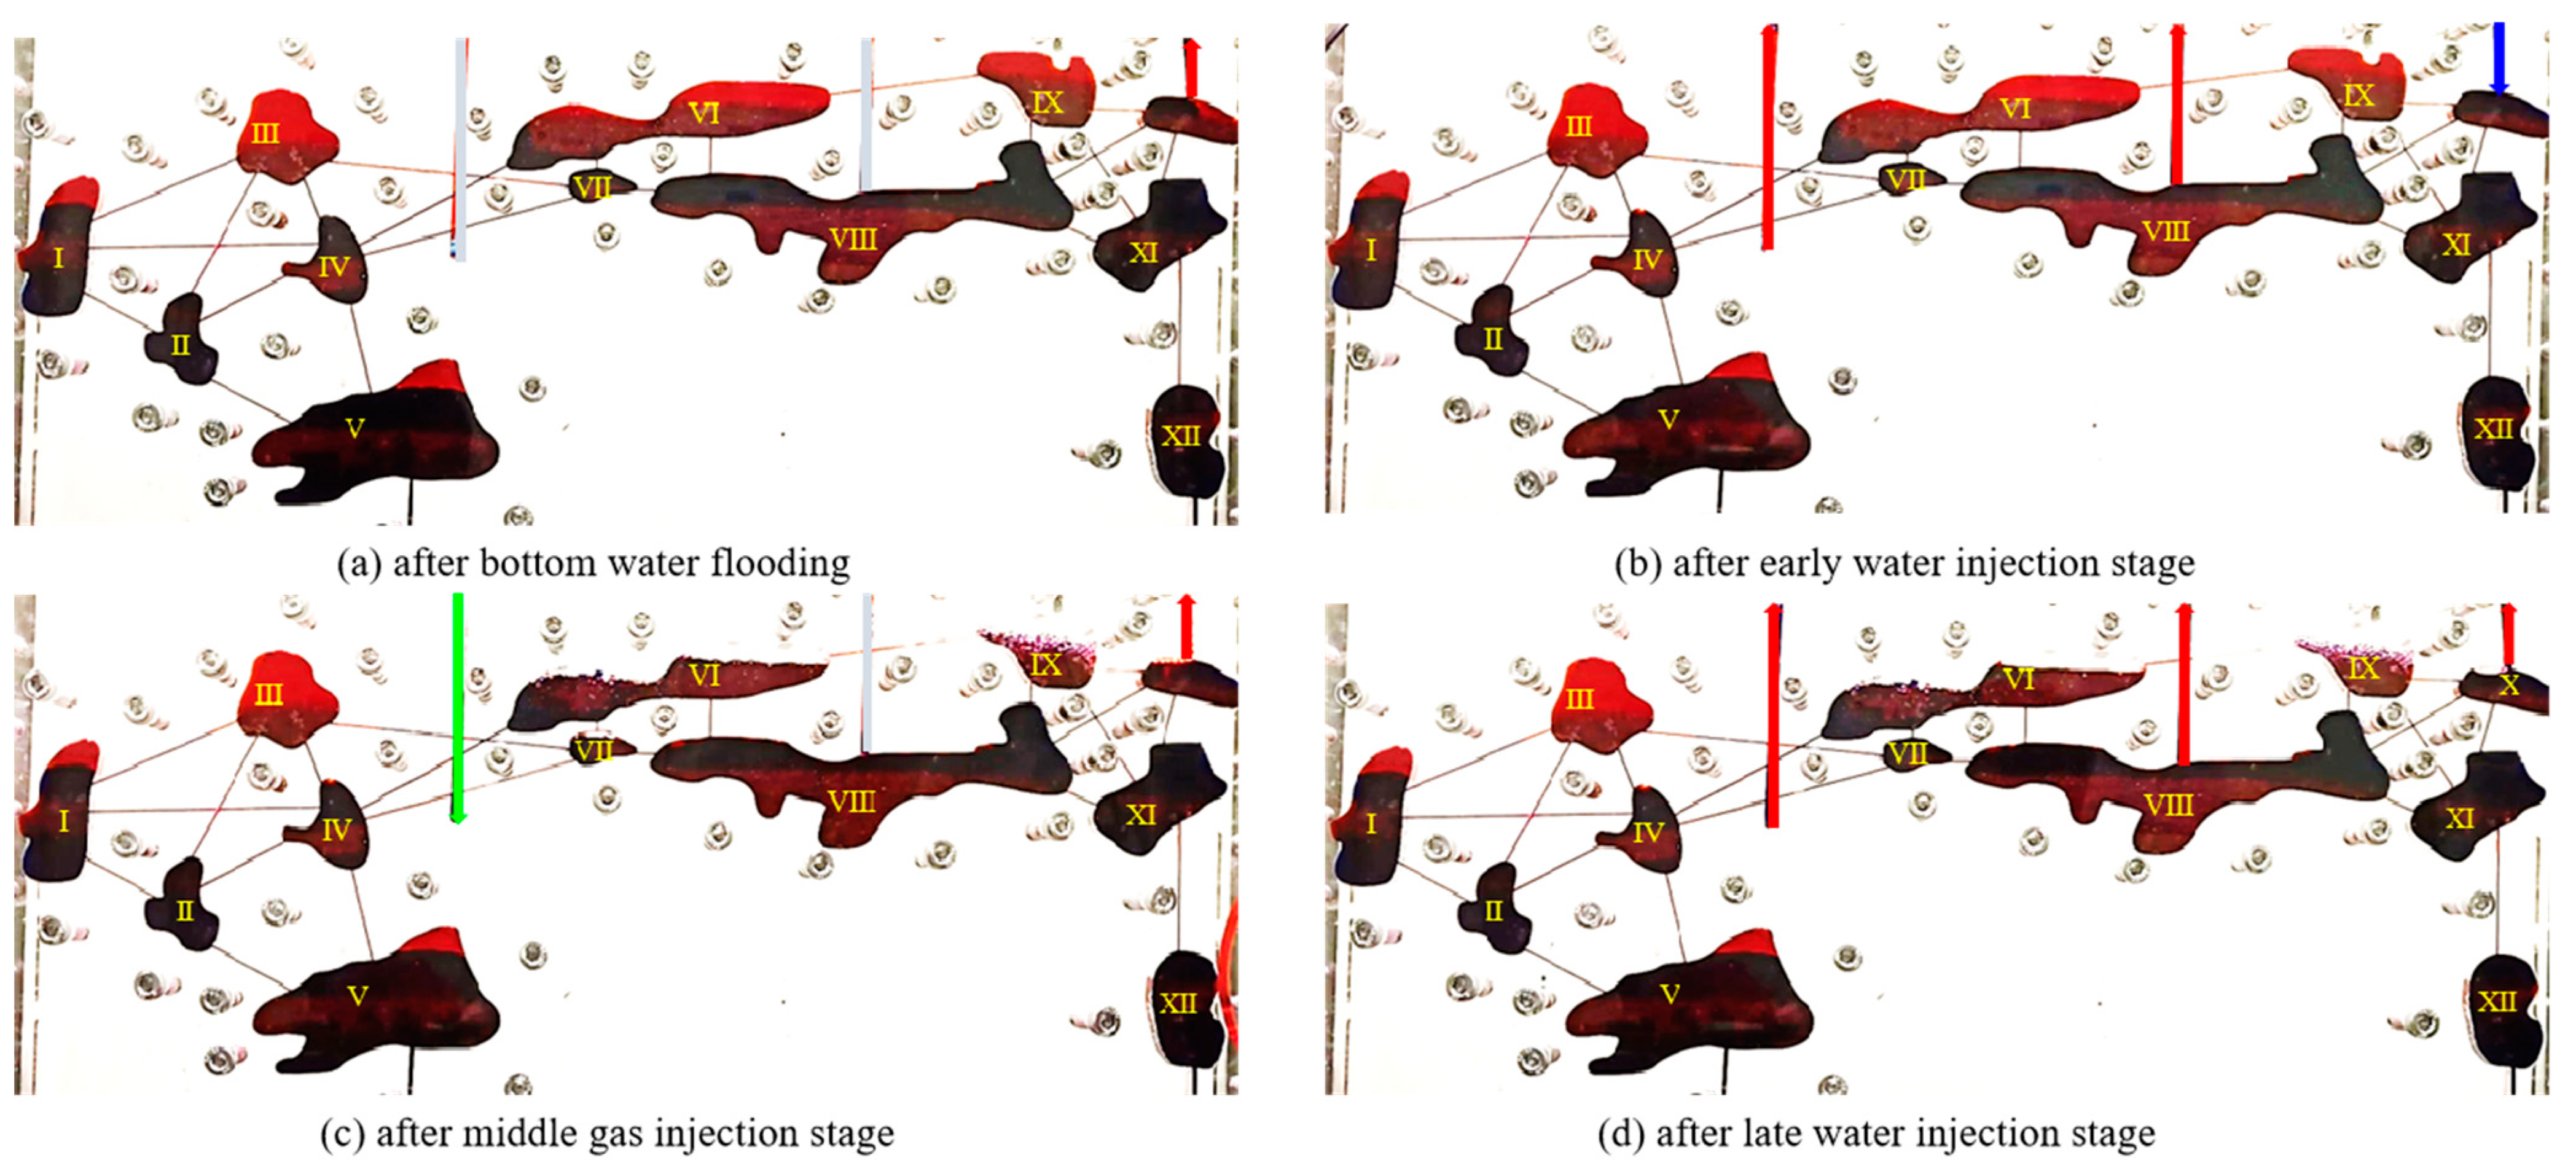
According to experimental scheme FHQ03 in Table 2, the oil, gas, and water distributions after each production stage when the initial production well location was Well 3# are shown in Figure 14.

Figure 14.
The change in oil–gas–water distribution when the initial production well was Well 3# (the experimental scheme of FHQ03).
After the early water injection stage, since the injection and production well locations were Well 3# for injection and Well 1# for production, and Well 1# for injection and Well 2# for production, respectively, the lateral oil displacement directions were both from right to left. Therefore, the remaining oil in Cave VI could not be recovered after this stage. Although more remaining oil was left after the early water injection stage under this injection and production well arrangement, the remaining oil in the cavity area of Cave VI could still be produced after the middle gas injection stage. Since the gas injection well arrangement in this experimental scheme was the same as that in experimental scheme FHQ01, and in the late alternating water injection stage, each well was set as an injection well and production well, respectively, the oil, gas, and water distributions after the middle gas injection and late water injection stages were basically the same as those in Figure 12c,d.
3.3.4. Production Performance Analysis
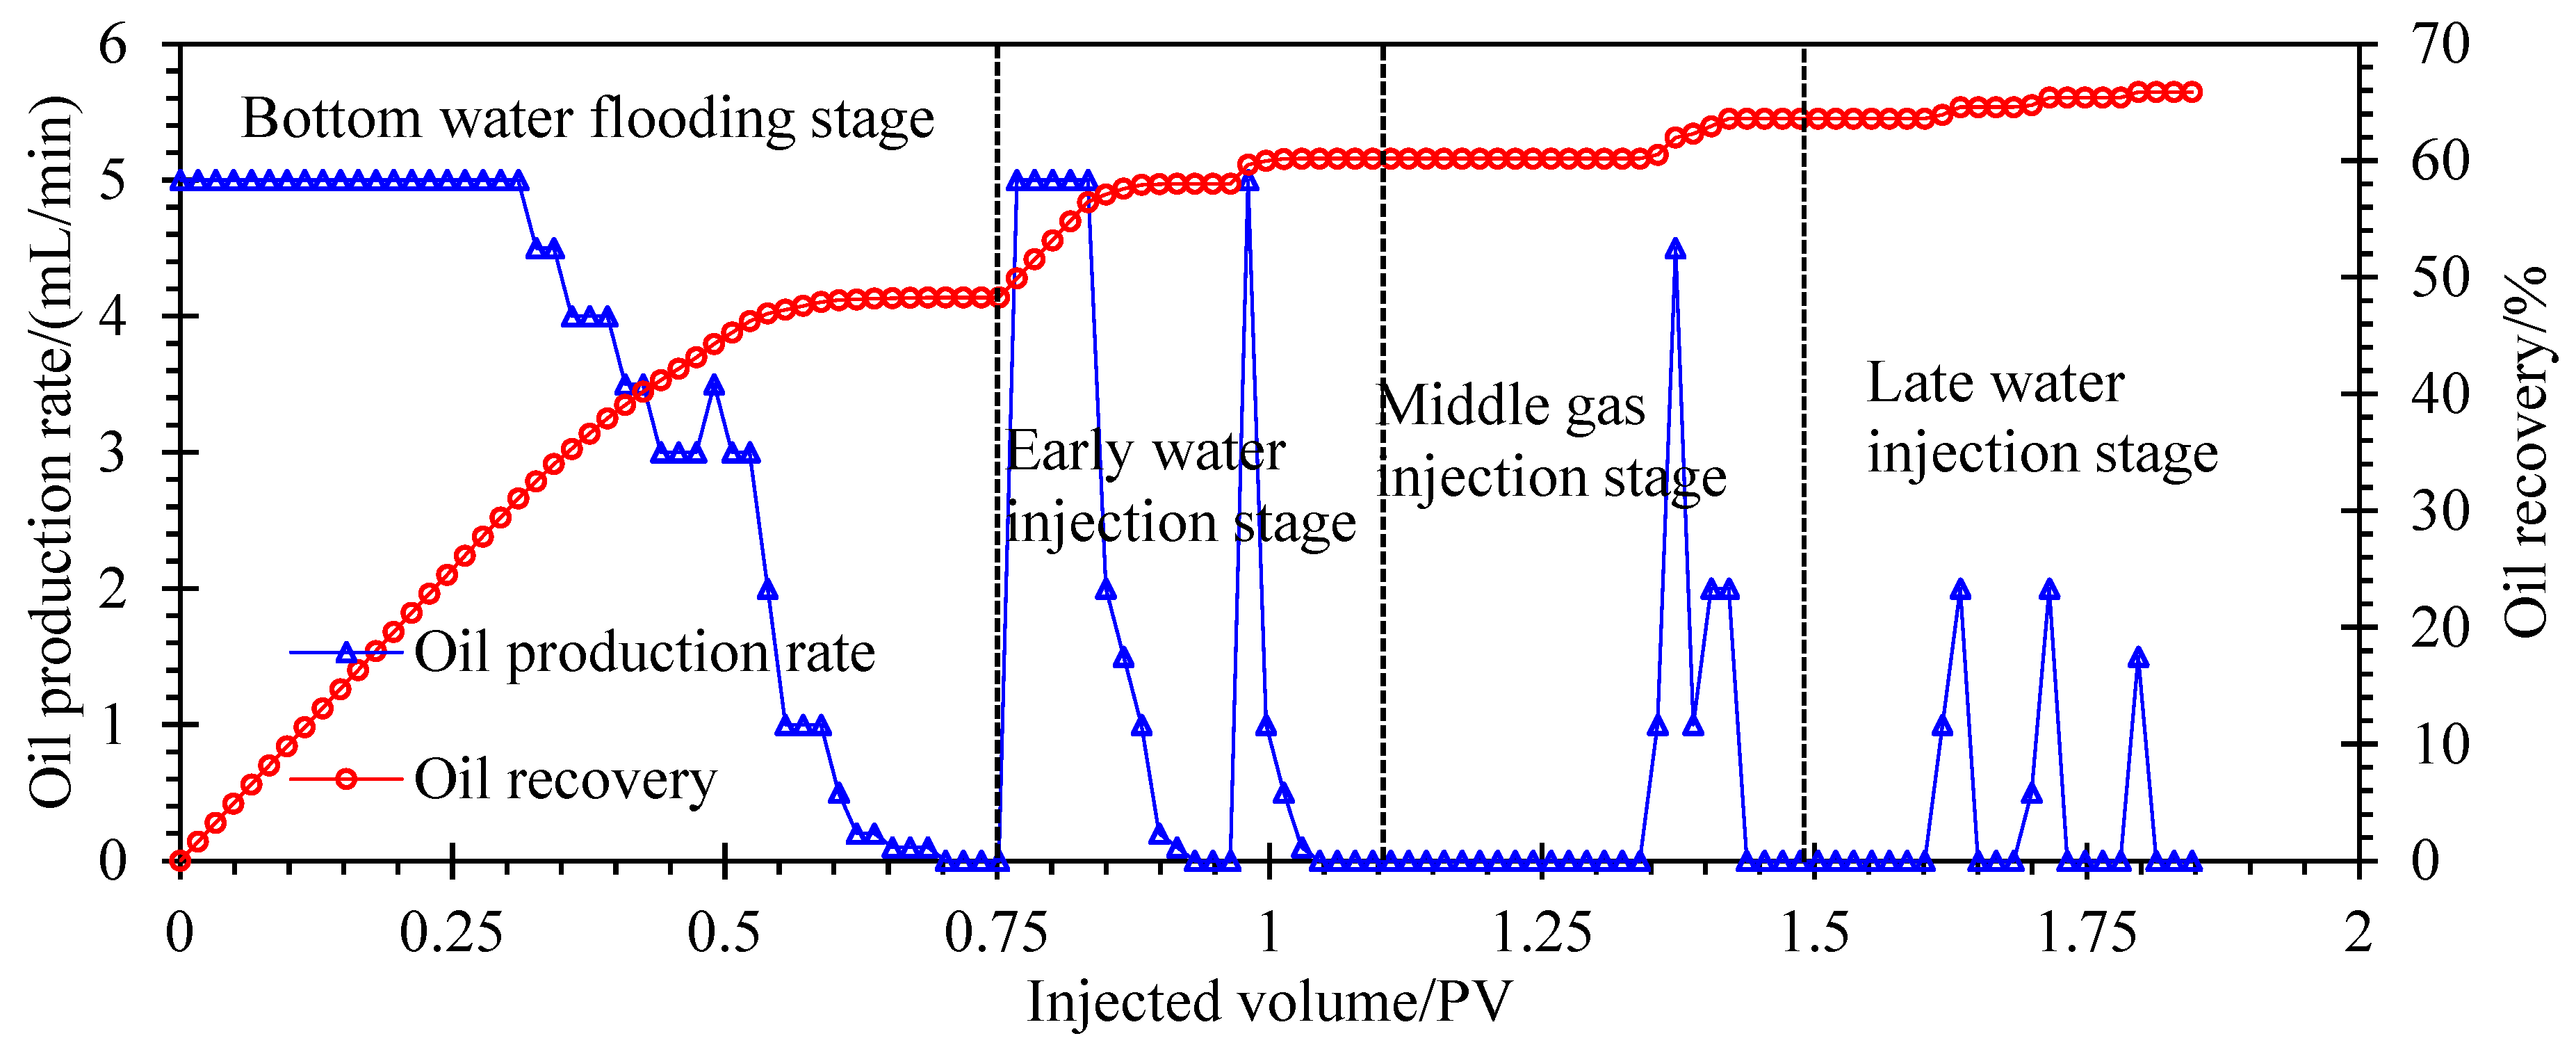
The full-process liquid production change curves of multi-well water and gas injection for the weathered crust reservoir (taking experimental scheme FHQ02 as an example) are shown in Figure 15. It can be seen from the Fig. that in the early water injection stage, the increase in the oil production rate occurred rapidly with the change in injection and production well locations, while in the middle gas injection stage, the oil production rate increased after about 0.25 PV of injection medium conversion. In the first cycle of water injection in the late water injection stage, the increase in the oil production rate also started after the injection medium converted about 0.15 PV. In the latter two stages, the delayed increase in the oil production rate and the non-timeliness of increased oil recovery did not mean that multi-well water and gas injection was invalid. On the contrary, after each rotation of injection and production well locations or a change in injection medium, the oil production rate increased to some extent, indicating that multi-well water and gas injection played a role, to varying degrees, throughout the production process. The recovery rate increased by about 11.8%, 3.4%, and 2.3% in the three stages of water and gas injection, respectively.
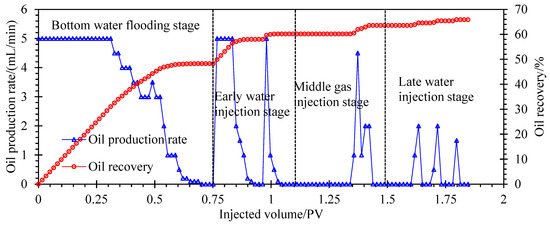
Figure 15.
The full-process liquid production change curves of multi-well water and gas injection (take the experimental scheme of FHQ02 as an example).
4. Conclusions
In this work, an acrylic physical model resembling actual geological features was constructed to investigate the remaining oil distribution rules, formation mechanisms, and EOR methods for weathered crust karst fractured vuggy reservoirs. The main conclusions are as follows:
- The physical experimental model of a weathering crust reservoir was designed by computer-aided design so that the model could accurately reflect the distribution and connectivity of complex fractures and caves and the experimental results could reflect the real reservoir development characteristics.
- A higher extent of cave filling led to poorer bottom water flooding recovery but slower rising water cut. The remaining oil was mostly distributed as attic oil in the upper positions and as residual oil in the filling medium.
- Alternating multi-well water and gas injection achieved higher incremental oil by establishing new displacement channels and changing the drive energy. Gas injection recovered more attic oil from upper cave regions, while water injection washed oil from the filling medium.
- The morphological configuration of fractures and caves had significant impacts on the remaining oil distribution. An optimized EOR design should account for fracture cave connectivity and filling medium effects.
- The physical modeling approach provided visual insights into displacement front propagation and remaining oil formation mechanisms for complex weathered crust reservoirs. The findings can guide field development planning and EOR design optimization.
Author Contributions
Conceptualization, Y.W., J.L., Z.H. and Y.C.; Methodology, Y.W., M.D. and Y.C.; Formal Analysis, Y.W. and G.S.; Investigation, Y.W.; Writing—Original Draft, W.G. and X.Z. All authors have read and agreed to the published version of the manuscript.
Funding
This research received no external funding.
Data Availability Statement
The datasets used and/or analyzed during the current study are available from the corresponding author upon reasonable request.
Conflicts of Interest
Authors Yuegang Wang, Wanjiang Guo, Gangzheng Sun, Junzhang Lin and Mingshan Ding were employed by Shengli Oilfield of Sinopec. The remaining authors declare that the research was conducted in the absence of any commercial or financial relationships that could be construed as a potential conflict of interest.
Abbreviations
| EOR | enhanced oil recovery |
| CAD | Computer-aided design |
| PV | pore volume |
References
- Yan, L.; Liu, Q.; Liu, X. Research on 3D geological modeling of fractured-vuggy carbonate reservoirs. Energy Rep. 2022, 8, 491–500. [Google Scholar] [CrossRef]
- Ran, Q.; Wang, Y.; Sun, Y.; Yan, L.; Tong, M. Chapter 9—Effective Reservoir Identification and Prediction. In Volcanic Gas Reservoir Characterization; Ran, Q., Wang, Y., Sun, Y., Yan, L., Tong, M., Eds.; Gulf Professional Publishing: Boston, MA, USA, 2014; pp. 347–391. [Google Scholar]
- Tian, F.; Luo, X.; Zhang, W. Integrated geological-geophysical characterizations of deeply buried fractured-vuggy carbonate reservoirs in Ordovician strata, Tarim Basin. Mar. Pet. Geol. 2019, 99, 292–309. [Google Scholar] [CrossRef]
- Wang, K.; Teng, J.; Deng, H.; Fu, M.; Lu, H. Classification of Void Space Types in Fractured-Vuggy Carbonate Reservoir Using Geophysical Logging: A Case Study on the Sinian Dengying Formation of the Sichuan Basin, Southwest China. Energies 2021, 14, 5087. [Google Scholar] [CrossRef]
- Li, J.; Zhang, W.; Qu, B.; Zhen, E.; Qian, Z.; Ma, S.; Qin, F.; You, Q. Physical Modeling of High-Pressure Flooding and Development of Oil Displacement Agent for Carbonate Fracture-Vuggy Reservoir. Processes 2025, 13, 71. [Google Scholar] [CrossRef]
- Geng, J.; Xiao, L.; Yue, P.; Xiao, Y.; Yang, H.; Qu, S.; Wang, X. Evaluation Method of Water Injection Development Effects in Fractured Vuggy Carbonate Reservoirs: Case Study of FI7 Strike-Slip Fault Zone. Energies 2024, 17, 5611. [Google Scholar] [CrossRef]
- Wang, J.; Wang, T.; Xu, H.; Jiang, H. Graded regulation technology for enhanced oil recovery and water shutoff in pore-cavity-fracture carbonate reservoirs. Arab. J. Chem. 2022, 15, 103907. [Google Scholar] [CrossRef]
- Yang, M.; Zhong, H.; Li, Y. Research on fluid flow mechanism of fracture-cave carbonate reservoirs based on fluid mechanics. Energy Sources Part A Recovery Util. Environ. Eff. 2025, 47, 1051–1069. [Google Scholar] [CrossRef]
- Lyu, X.; Zhu, G.; Liu, Z. Well-controlled dynamic hydrocarbon reserves calculation of fracture–cavity karst carbonate reservoirs based on production data analysis. J. Pet. Explor. Prod. Technol. 2020, 10, 2401–2410. [Google Scholar] [CrossRef]
- Zhang, X.; Huang, Z.; Lei, Q.; Yao, J.; Gong, L.; Sun, S.; Li, Y. Connectivity, permeability and flow channelization in fractured karst reservoirs: A numerical investigation based on a two-dimensional discrete fracture-cave network model. Adv. Water Resour. 2022, 161, 104142. [Google Scholar] [CrossRef]
- Yu, X.; Yang, S.-F.; Chen, H.-L.; Chen, Z.-Q.; Li, Z.-L.; Batt, G.E.; Li, Y.-Q. Permian flood basalts from the Tarim Basin, Northwest China: SHRIMP zircon U–Pb dating and geochemical characteristics. Gondwana Res. 2011, 20, 485–497. [Google Scholar] [CrossRef]
- Nechaev, V.P.; Dai, S.; Zhao, L.; Moore, T.A.; Nechaeva, E.V. The Tarim Basin, China, a prospect for plume-related Zr(Hf)-Nb(Ta)-REY-Ga-U mineralization. Ore Geol. Rev. 2021, 133, 104081. [Google Scholar] [CrossRef]
- Lu, X.B.; Rong, Y.S.; Li, X.B.; Wu, F. Construction of injection-production well pattern in fractured-vuggy carbonate reservoir and its development significance: A case study from Tahe oilfield in Tarim Basin. Oil Gas Geol. 2017, 38, 658–664. [Google Scholar] [CrossRef]
- Li, X.B.; Liu, X.L.; Yang, M.; Tan, T.; Li, Q.; Liu, H.G.; Zhang, Y.X. Study on relationship optimization of injection and production in fractured-vuggy reservoirs with different karst background. Reserv. Eval. Dev. 2020, 10, 37–42. [Google Scholar] [CrossRef]
- Zhang, Y.; Tan, F.; Qu, H.; Zhong, Z.; Liu, Y.; Luo, X.; Wang, Z.; Qu, F. Karst monadnock fine characterization and reservoir control analysis: A case from Ordovician weathering paleokarst reservoirs in Lungu area, Tarim Basin, NW China. Pet. Explor. Dev. 2017, 44, 716–726. [Google Scholar] [CrossRef]
- Lu, Z.G.; Yao, J.; Li, L.F. Experimental study on fluid flow characteristic in orthogonal fracture network. J. China Coal Soc. 2010, 35, 555–558. [Google Scholar]
- Li, A.; Zhang, D.; Yao, J.; Gao, H.; Lv, A. Physical simulation of water flooding in fractured-vuggy unit. J. China Univ. Pet. (Ed. Nat. Sci.) 2012, 36, 130–135. [Google Scholar] [CrossRef]
- Li, Y.-L.; Wu, F.; Li, X.; Tan, X.-H. Experimental study on waterflood development in large–scale karst structures. J. Pet. Sci. Eng. 2019, 175, 838–851. [Google Scholar] [CrossRef]
- Zhao, Y.; Lu, G.; Zhang, L.; Yang, K.; Li, X.; Luo, J. Physical simulation of waterflooding development in large-scale fractured-vuggy reservoir considering filling characteristics. J. Pet. Sci. Eng. 2020, 191, 107328. [Google Scholar] [CrossRef]
- Yuan, D.; Hou, J.; Song, Z.; Wang, Y.; Luo, M.; Zheng, Z. Residual oil distribution characteristic of fractured-cavity carbonate reservoir after water flooding and enhanced oil recovery by N2 flooding of fractured-cavity carbonate reservoir. J. Pet. Sci. Eng. 2015, 129, 15–22. [Google Scholar] [CrossRef]
- Guo, W.; Fu, S.; Li, A.; Xie, H.; Cui, S.; Nangendo, J. Experimental research on the mechanisms of improving water flooding in fractured-vuggy reservoirs. J. Pet. Sci. Eng. 2022, 213, 110383. [Google Scholar] [CrossRef]
- Wang, J.; Liu, H.; Ning, Z.; Zhang, H.; Hong, C. Experiments on water flooding in fractured-vuggy cells in fractured-vuggy reservoirs. Pet. Explor. Dev. 2014, 41, 74–81. [Google Scholar] [CrossRef]
- Yang, J.; Hou, J.; Qu, M.; Liang, T.; Wen, Y. Experimental study the flow behaviors and mechanisms of nitrogen and foam assisted nitrogen gas flooding in 2-D visualized fractured-vuggy model. J. Pet. Sci. Eng. 2020, 194, 107501. [Google Scholar] [CrossRef]
- Qu, M.; Hou, J.; Qi, P.; Zhao, F.; Ma, S.; Churchwell, L.; Wang, Q.; Li, H.; Yang, T. Experimental study of fluid behaviors from water and nitrogen floods on a 3-D visual fractured-vuggy model. J. Pet. Sci. Eng. 2018, 166, 871–879. [Google Scholar] [CrossRef]
- Song, Z.-J.; Li, M.; Zhao, C.; Yang, Y.-L.; Hou, J.-R. Gas injection for enhanced oil recovery in two-dimensional geology-based physical model of Tahe fractured-vuggy carbonate reservoirs: Karst fault system. Pet. Sci. 2020, 17, 419–433. [Google Scholar] [CrossRef]
- Wang, Y.; Hou, J.; Tang, Y.; Song, Z. Effect of vug filling on oil-displacement efficiency in carbonate fractured-vuggy reservoir by natural bottom-water drive: A conceptual model experiment. J. Pet. Sci. Eng. 2019, 174, 1113–1126. [Google Scholar] [CrossRef]
- Belousov, A.; Lushpeev, V.; Sokolov, A.; Sultanbekov, R.; Tyan, Y.; Ovchinnikov, E.; Shvets, A.; Bushuev, V.; Islamov, S. Hartmann–Sprenger Energy Separation Effect for the Quasi-Isothermal Pressure Reduction of Natural Gas: Feasibility Analysis and Numerical Simulation. Energies 2024, 17, 2010. [Google Scholar] [CrossRef]
- Yong, Q.; Liang, C. Synthesis of an Aqueous Self-Matting Acrylic Resin with Low Gloss and High Transparency via Controlling Surface Morphology. Polymers 2019, 11, 322. [Google Scholar] [CrossRef]
- Guo, W.; Huang, Z.; Li, A.; An, G.; Cui, S. Visual experiments of bottom water and multi-well water and gas injection flooding for fault-controlled fractured-vuggy reservoirs. Phys. Fluids 2023, 35, 083319. [Google Scholar] [CrossRef]
- Bondarenko, A.V.; Islamov, S.; Ignatyev, K.; Mardashov, D. Laboratory studies of polymer compositions for well-kill under increased fracturing. Perm J. Pet. Min. Eng. 2020, 20, 37–48. [Google Scholar] [CrossRef]
- Li, A.; Guo, W.; Fu, S.; Nangendo, J.; Xie, H.; Li, X.; An, G.; Cui, S. Experimental investigation of water flooding characteristics and residual oil distribution in filled attic caves reservoir. Pet. Sci. Technol. 2021, 39, 972–992. [Google Scholar] [CrossRef]
Disclaimer/Publisher’s Note: The statements, opinions and data contained in all publications are solely those of the individual author(s) and contributor(s) and not of MDPI and/or the editor(s). MDPI and/or the editor(s) disclaim responsibility for any injury to people or property resulting from any ideas, methods, instructions or products referred to in the content. |
© 2025 by the authors. Licensee MDPI, Basel, Switzerland. This article is an open access article distributed under the terms and conditions of the Creative Commons Attribution (CC BY) license (https://creativecommons.org/licenses/by/4.0/).