Article

Experimental Investigation on Thermo-Economic Analysis of Direct Contact Membrane Distillation for Sustainable Freshwater Production

by
Saleh M. Shalaby
1,
Farid A. Hammad
2,3,
Hamdy A. Ebeid
4,
Asaad M. Armanuos
4,
Iqbal M. Mujtaba
5,* and
Tamer A. Gado
4
1
Engineering Physics and Mathematics Department, Faculty of Engineering, Tanta University, Tanta 31511, Egypt
2
Mechanical Power Engineering Department, Faculty of Engineering, Tanta University, Tanta 31511, Egypt
3
Institute for Multiscale Thermofluids, School of Engineering, The University of Edinburgh, Edinburgh EH9 3FD, UK
4
Irrigation and Hydrolic Engineering Department, Faculty of Engineering, Tanta University, Tanta 31511, Egypt
5
Chemical Engineering Department, Faculty of Engineering & Digital Technologies, University of Bradford, West Yorkshire BD7 1DP, UK
*
Author to whom correspondence should be addressed.
Processes 2025, 13(1), 240; https://doi.org/10.3390/pr13010240
Submission received: 12 December 2024 / Revised: 7 January 2025 / Accepted: 11 January 2025 / Published: 15 January 2025
(This article belongs to the Section Sustainable Processes)

Abstract

:
Treatment of extremely saline water such as the brine rejected from reverse osmosis water desalination plants, and produced water from shale oil and non-conventional gas extraction, is considered a global problem. Consequently, in this work, hollow fiber membrane distillation (HFMD) is experimentally evaluated for desalinating extremely saline water of a salinity ranging from 40,000 to 130,000 ppm. For the purpose of comparison, the HFMD is also tested for desalinating brackish (3000–12,000 ppm) and sea (25,000–40,000 ppm) water. Firstly, the HFMD is tested at two values of feed water temperature (65 and 76 °C) and flow rate (600 and 850 L/h). The experimental results showed that the HFMD productivity significantly increases when the temperature of feed water increases. Increasing the feed water flow rate also has a positive effect on the productivity of HFMD. It is also concluded that the productivity of the HFMD is not significantly affected by increasing the salt concentration when brackish and sea water are used. The productivity also slightly decreases with increasing the salt concentration when extremely saline water is used. The decrement in the productivity reaches 27%, when the salt concentration increases from 40,000 to 130,000 ppm. Based on the conducted economic analysis, the HFMD shows a good potential for desalinating extremely saline water especially when the solar collector is used as a heat source. In this case, the cost per liter of freshwater is reduced by 21.7–23.1% when the evacuated tube solar collectors are used compared to the system using electrical heaters. More reduction in the cost per liter of freshwater is expected when a high capacity solar-powered HFMD plant is installed.

1. Introduction

The energy and water sectors are facing growing demands due to the continuous increase in population, industry activities, and climate change effects. In addition, freshwater scarcity is pervasive in many parts of the world. Consequently, the pursuit of a low-power and environmentally friendly technology for water desalination is of great interest worldwide. So far, reverse osmosis (RO) is ranked as the top technology of water desalination, where most water desalination plants around the world are RO [1,2,3]. Nevertheless, RO has some drawbacks: high specific energy consumption [4,5] and membrane fouling [6]. In addition to the main problem of RO is brine disposal and its environmental impact [7]. A huge quantity of extremely saline water of TDS reaching 70,000 ppm, in the case of a sea water desalination plant, is rejected from the numerous numbers of RO plants around the world [8]. Although RO is the top and commercially the widest used for water desalination [9], it cannot handle extremely saline water [10] mainly due to fouling and scaling issues in addition to high power consumption.
Nowadays, the evaluation of water desalination technologies at a wide range of salinities of feed water is of great interest worldwide. In this regard, humidification dehumidification (HDH) is examined by a few researchers for extremely saline water desalination [10,11]. The utilization of MD for the desalination of extremely saline water is also found in rare studies [12,13]. Hybrid-solar HDH was experimentally studied by Shalaby et al. [10] for the desalination of extremely saline water. Their proposed system includes a solar water collector of total collecting area of 2 m2, electrical heater of 6 kW, humidification and dehumidification units. Their results showed that the hybrid solar HDH efficiently operated at high values of water salinity. Their proposed system can produce 79 L/day of freshwater a the feed water salinity of 100,000 is used.
The flat plate direct contact MD is also tested by Lokare et al. [13] for desalinating the water produced from non-conventional gas extraction. They highlighted the potential of using MD for extremely saline wastewater treatment. Many studies have been conducted to optimize the performance of the MD. Xu et al. [14] studied the effect of varying the feed water temperature and flow rate on the performance of the air gap membrane distillation (AGMD). The effect of salt concentrations on AGMD productivity is also of great interest in their study. Their results reveal that increasing the feed water temperature significantly increases the freshwater productivity, while there is a little positive effect on the MD productivity when the feed flow rate increases. The freshwater productivity slightly decreases with increasing the salt concentration of the feed water [14]. A similar conclusion is also reported by Al-Obidani et al. [15]. The results obtained by Pan et al. [16] also ensure the previous results regarding the effect of feed water temperature and flow rate on the MD productivity. The effect of operating parameters on the direct contact membrane distillation DCMD is also investigated by Manawi et al. [17]. In their experiment, the effect of varying the feed water flow rate from 30 to 180 L/h on the productivity is studied at constant feed and permeate side temperatures of 70 °C and 30 °C. The effect of varying the feed water temperature between 40 and 70 °C at constant flow rate of 90 L/h is also investigated when two temperature values (30 and 40 °C) of the permeate side are considered. They found that freshwater productivity increases with increasing the flow rate until reaching the optimal value of 120 L/h. Beyond this value the increment in freshwater productivity is insignificant. They also found that increasing the operating temperature difference significantly increases freshwater productivity.
The significant positive effect of increasing the feed water temperature is also found by Hejazi et al. [18], Mustafa et al. [19], and Elcik et al. [20]. In the experiment conducted by Mustafa et al. [19], the performance of the MD for sea water desalination was studied at the same operating temperature difference (40 °C) while the cold/hot temperatures are difference: 5–45, 15–55, and 25–65 °C. Although the same operating temperature difference was applied, high freshwater production was achieved at the higher values of feed water temperature. Increasing the feedwater temperature from 50 °C to 60 °C results in increments in freshwater productivity from 12.5 kg/m2 h to 20.5 kg/m2 h, compared to 34 kg/m2 h to 58 kg/m2 h when the feedwater temperatures increase from 70 °C to 80 °C [20]. Based on the previous results, it has been ensured that there is a direct proportion between the feed water temperature through a range of 50–80 °C and MD productivity. This is directly proportional because of increasing the feed water temperature at a constant cooling temperature results in an increment in vapor pressure, which led to an increase in the permeate. This relation between the vapor pressure and feedwater temperature is described by Antoine’s equation for pure liquids and can be modified for saline solutions [21,22].
So far, a few configurations of direct contact MD such as tubular and hollow fiber MD were not evaluated for desalinating extremely saline water. The membrane areas of these MD configurations are very large; however, they occupy small volumes. So, in the current work, the hollow fiber MD is evaluated for treating extremely saline water (up to 130,000 ppm) such as the brine rejected from the RO water desalination plants and the produced water from shale oil and non-conventional gas extraction systems. The HFMD is also tested for desalinating brackish and sea water. Thermo-economic analysis is also conducted based on the experimental results when the electrical heat source is used. It is also estimated when the solar energy is used for heating the MD. The efficient performance of the proposed system at a high salinity compared with other desalination technologies in addition to the economic point of view when the solar energy is used means HFMD shows good potential for desalinating extremely saline water such as the brine of RO.

2. Experimental Work

In this section, the details of experiments prepared to evaluate the HFMD under different operating parameters such as temperature, mass flow rate, and salinity of feed water are presented. The measuring devices and experimental procedures are also discussed in this section.

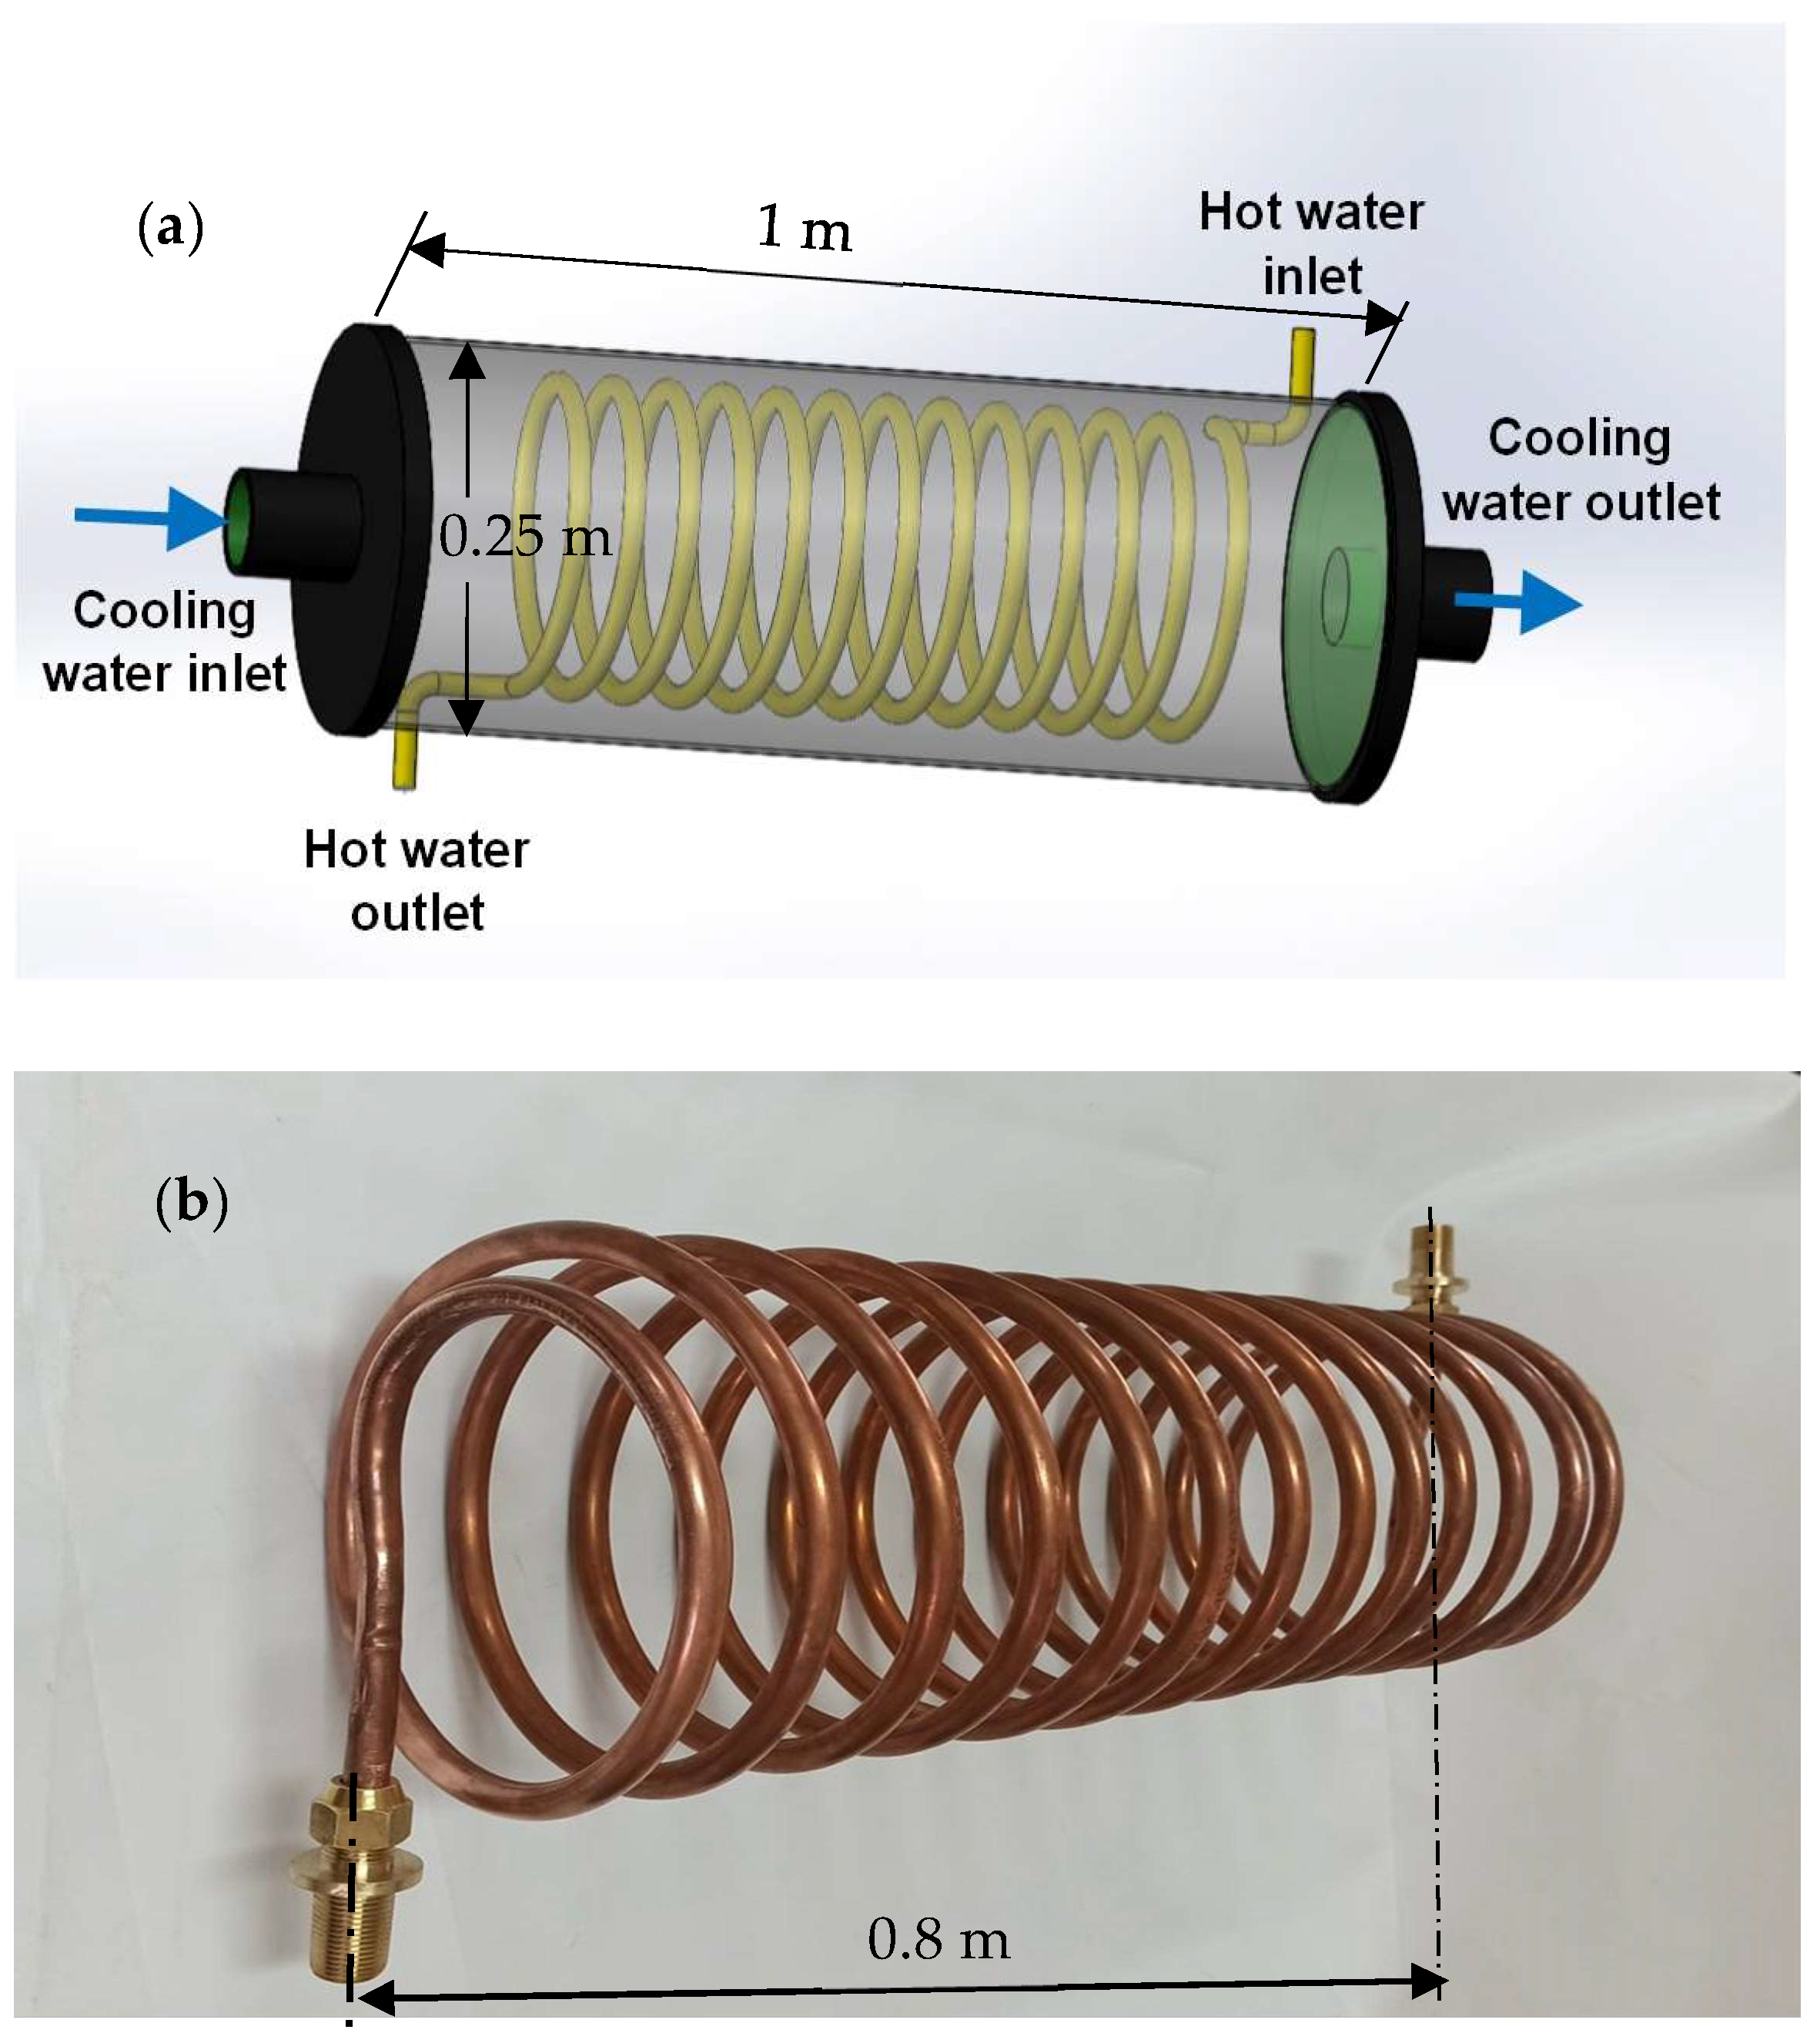
2.1. Experimental Setup and Measuring Devices

Figure 1a displays a photograph of the HFMD experimental setup. A schematic diagram of the experiment is also displayed in Figure 1b. The system consists of hollow fiber MD, feed water heating system, permeate cooling system, two pumps, and a balance. The hollow fiber direct contact membrane distillation used in this work is imported from Oxymo Technology Company, Foshan, China [23]. The specifications of the hollow fiber MD4040 are summarized in Table 1. Two electrical heaters of total power of 4 kW were used to heat the feed water. The heat exchanger shown in Figure 2a,b was used to cool down the permeate. The heat exchanger is a shell and spiral tube, where the shell is a PVC tube of inner diameter 0.25 m and 1 m length, while a spiral tube made of cooper with inner diameter 1 cm was used. The tap water, as a cooling fluid, flows though the shill via the inlet and outlet shown in Figure 2a, while distilled water flows through the spiral tube and circulates through the HFMD as the cold feed flow water. A pump of 0.5 hp was used to circulate the hot feed water and a similar one was used for circulating cold feed water through the HFMD. The feed pressure is controlled by needle valve to keep the operating pressure less than 0.5 bar, while a gate valve is used to vary the flow rate. A digital balance was used to record the freshwater productivity by noticing the increment in distillated water that circulates between the distilled water tank and the HFMD and passes through the spiral tube for cooling down. The distilled water tank (distillate collector) is weighted at the starting time and the increment in its weight after a certain time is considered the freshwater productivity of the system. In all conducted experiments, the increment in the distilled water tank (the system productivity) is recorded every 2 min. The temperature at the inlet and outlet of the MD for both feed water and permeate were measured using temperature sensors. In order to record the measured temperatures, the sensors are connected to the PC via ARDIWNO. The hot feed water flow rate was measured using a pedal wheel flow meter while the cold flow rate was measured by a rotameter. The total dissolved solids (TDSs), dissolved oxygen (DO), conductivity, and pH of the feed were measured by a YSI professional plus multi parameter.

2.2. Experimental Procedure

In this work, the HFMD was evaluated at different water types: brackish, sea, and extremely saline water. At first, the MD was assessed at different operating conditions: feed water temperatures and flow rates.
Two values of hot feed water temperature are considered in this work: 76 and 65 °C, while the cold feed water temperature ranged from 18 to 22 °C. The system is also tested at two values of hot feed water flow rate: 600 and 850 L/h, while the cold water feed flow rate is fixed at 300 L/h. In all studied cases, the productivity was recorded every 2 min during 20 min of operation. From the obtained results, the optimal operating conditions were identified. By conducting a simple analysis on the obtained results, the effect of operating temperature difference on the MD productivity can be also recognized. Then, the MD was tested when different water types (brackish, sea, and extremely saline water) were used when it was operated at the optimal studied operating parameters. When the MD was used for desalinating brackish water, the following salinities are considered: 3000, 6000, 9000, and 12,000 ppm, while the salinities 20,000, 25,000, 30,000, 35,000, and 40,000 are considered for sea water. The MD was also tested for desalinating extremely saline water for salinity, starting at 40,000 and reaching 130,000 ppm, which covers the salinities of RO brine, which reaches 70,000 ppm for sea desalination plants [8,24] and 6000–20,000 ppm for brackish water desalination plants [25].
An amount of saline water of 55 kg was prepared in the laboratory by adding a specific amount of NaCl into distilled water according to the required salinity. The amounts of NaCl were weighted using a digital balance of accuracy 0.0001 g.
The freshwater productivity was recorded after 5 min of starting the experiment to ensure that the MD reached its stable operation. After each experiment, the membrane was well cleaned by circulating fresh tap water in the two-flow sides of the HFMD for 30 min, with more care given to the cases using extremely saline water where the cleaning continued for up to 1 h.

3. Results and Discussions

In this work, the HFMD was tested at different water salinity levels: brackish, sea, and extremely saline water. Firstly, the MD was tested at different operating conditions: feed water temperature and flow rate. Then, the MD was tested when water of different salinities was used when it operated at the optimal operating values.

3.1. Operating Parameters

In this section, the flow rate and temperature of the feed water of a certain salinity of 3000 ppm are optimized. The feed water was firstly heated to 76 °C and pumped to flow through the MD with a flow rate of 850 L/h, while water of 20 °C and a mass flow rate 300 L/h was used in cold flow side. Figure 3 shows the hot and cold water temperature variation with time. After an operating time of 5 min, a dramatic drop in hot side temperature offset by a significant increase in cold water temperature is clearly noticed in Figure 3. After this time, the stability in heat transfer between the cold and hot sides has been achieved. After this passage of time the temperature profiles of the two MD water flow sides seem to be flat and parallel to each other. Average values of hot and cold feed water are found as 58.8 and 36.7 °C, which achieves an average temperature difference between the two feed sides of 22.1 °C. The productivity of the system is also recorded during the experiment where 1.26 L/h is achieved when the feed water salinity is 3000 ppm. In all experiments, the productivity is recorded after 5 min of starting the experiment to ensure that the MD reaches stable operation.
A similar profile was obtained as seen in Figure 4, when the hot feed water flow rate is dropped to 600 L/h while the other operating parameters are kept the same as above. In this case, the average hot and cold water temperatures were found to be 61.5 and 35.9 °C, while the average value of temperature difference is 25.6 °C. The productivity achieved in this case dropped to 0.74 L/h. This means that the productivity of the system decreased by 41.3% when the mass flow rate decreased from 850 to 600 L/h under the operating temperatures mentioned above.
In order to figure out the effect of feed water temperature on the performance of the HFMD, similar experiments were conducted when the initial feed water temperature was decreased to 65 °C and the higher flow rate of 850 L/h was applied, while water of 20 °C and a mass flow rate 300 L/h was used in the cold flow side. A similar profile of hot and cold temperature is obtained as shown in Figure 5. The only differences are the average hot and cold feed water temperatures of 54 and 34.5 °C, which result in a temperature difference drop of 19.5 °C, as shown in Figure 5. The productivity of the system is also decreased to 0.813 L/h, which means that the productivity decreases by 35.5% when the initial feed water temperature decreases from 76 to 65 °C when the feed water flow is kept constant at 850 L/h. In the previous case, the temperature difference, which is uncontrollable, also drops from 22.1 to 19.5 °C as mentioned above. So, it is inequitable to attribute this drop in the productivity to the decrement in initial feed temperature only and neglect the effect of the decrement in temperature difference.
The HFMD is also tested at the lower values of feed water temperature and flow rate of 65 and 600 L/h, respectively. In this case, a very low productivity is recorded of 0.378 L/h compared to 1.26 L/h recorded when the higher feed water temperature and flow rate are applied.
In all cases presented in Figure 3, Figure 4 and Figure 5, the productivity of HFMD is recorded every 2 min, then the hourly productivity is calculated at different operating temperature differences. So, the effect of the applied temperature difference on the HFMD hourly productivity can be recognized at two values of hot feed water flow rates: 600 and 850 L/h. Figure 6 shows the effect of temperature difference between hot and cold MD feed water on the system productivity at two feed flow rates, 600 and 850 L/h, when brackish water of 3000 ppm is used. The MD productivity significantly increases when the feed water flow rate is increased from 600 to 850 L/h as obviously seen in Figure 6. The hourly productivity also increases with an increase in the temperature difference to reach 1764 mL/h when the temperature difference of 33 C is applied at a feed water flow rate of 850 L/h.
Based on the previous results, the MD is efficiently operated at the higher values of feed water temperature and flow rate (76 °C, 850 L/h). The challenge here is how to apply high temperature difference for a long time as the MD operation is associated with high heat transfer between the feed water and permeate. This high heat transfer led to a significant drop in the applied temperature difference due to heat loss by conduction through the membrane, which is considered the main problem of increasing the energy consumption of the MD. So, the research on the fabrication of MD using polymers of low thermal conductivity is of great interest around the world [26].
In order to maintain the operating temperature difference at its maximum value (33 °C) achieved in the current study, additional electrical heaters are required and a higher cooling rate may be also needed. So, in the following study cases, the higher values of both hot feed water flow rate and temperature, which equal 850 L/h and 76 °C, will be used as optimal operating parameters under the current study conditions. In general, it is recommended to increase both feed water temperature and flow rate as far as the HFMD can safely operate. The previous recommendation is also supported by the results reported by Xu et al. [14], Hejazi et al. [18], Mustafa et al. [19], and Elcik et al. [20], where the MD productivity significantly increases by increasing the inlet feed water temperature through the range of 50–80 °C [20]. Increasing the feed water temperature at a constant cooling temperature results in an increment in vapor pressure, which led to an increase the permeate. This relation between the vapor pressure and feedwater temperature is described by Antoine’s equation for pure liquids and can be modified for saline solutions [21,22]. The direct proportion between the feed water temperature and the MD productivity when the temperature difference between the hot and cold sides is kept constant is also found by Mustafa et al. [19].
The positive significant effect of increasing the feed water temperature on the MD productivity is also obtained by Xu et al. [14] and Hejazi et al. [18], while a little positive effect on the MD productivity is found for the feed flow rate [14]. The results obtained by Manawi et al. [17] show that the MD productivity increases with increasing the flow rate until reaching an optimal value of 120 L/h. Beyond this value the increment in freshwater productivity is insignificant.

3.2. Investigation of the Performance of the MD for Brackish and Sea Water Desalination

The MD is tested at different brackish water salinities, 3000, 6000, 9000, and 12,000 ppm, when the hot feed water flow rate and initial temperature are 850 L/h and 76 °C, respectively. Similar experiments are also conducted at different sea water salinities: 25,000, 30,000, 35,000, and 40,000 ppm. Figure 7 shows the effect of water salinity on the MD productivity when feed water flow rate and initial temperature are 850 L/h and 76 °C, respectively, when the salinity of feed water covers the range of brackish and sea water.
The results show that there are no significant differences in freshwater productivity when the salinity increases from 3000 to 12,000. Where the productivity slightly decreases from 1280 mL/h at 3000 ppm to 1250 mL/h at 12,000 ppm.
The HFMD productivity also remains approximately constant when sea water with different salinities was used as seen in Figure 7. The slight decrement in freshwater productivity does not exceed 3.2%. The previous results reveal that the productivity of HFMD slightly decreases with increasing the salinity of feed whether brackish or sea water was used, with good agreement with the results obtained by Xu et al. [14] and Al-Obidani et al. [15]. This gives the HFMD superiority when compared to RO, where the RO needs more power when it is operated at higher salinities. The previous results give the MD good potential to treat water of higher water salinity such as the RO brine and the high polluted water rejected from shale oil and non-conventional gas extraction systems. So, in the next section, the effect of varying the salt concentration on the MD productivity at extremely high salinity is presented.

3.3. Investigation of the Performance of the MD for Deslinating Extremely Saline Water

The previous results of using MD for brackish and sea water desalination showed that the performance of the MD was insignificantly affected by the feed water TDS. So, it is crucial to employ MD for desalinating high saline water. The importance of this application gives the MD a good potential for concentrating the brine of RO and similar high saline water such as the water produced from the shale oil and non-conventional gas extraction, where the RO technology, which is ranked at the top of water desalination techniques, cannot efficiently operate with extremely saline feed water.
The hollow fiber MD was tested in this work when extremely saline feed water is used: 40,000, 70,000, 100,000, and 130,000 ppm. The hourly productivity of the HFMD slightly decreases with increasing the salt concentration when extremely saline water is used, as clearly shown in Figure 8. The decrement of freshwater productivity reaches 27% when the concentration increases from 40,000 to 130,000 ppm, taking into consideration that no additional heat is required. This shows the superiority of MD compared to RO where the later one required more power at higher salinity. A few studies are found in the literature on using MD for extremely high saline water desalination such as Xu et al. [14], Kim et al. [27], and Duong et al. [12], where these studies introduce the MD as the best technology for concentrating the brine of RO and the productivity decreases modestly with increasing feed salt concentration whatever the membrane type was. This productivity decrement was due to the reduction in vapor pressure at higher concentrations [28]. In addition, the concentration polarization at the membrane surface is another factor [29]. So, cleaning the membrane is required after each experiment especially when the extremely saline water is used. The high cost of thermal energy required for MD is a key point in this integration especially in the systems free of energy recovery devices [27]. So, in the next section, there is a detailed economic analysis for freshwater production from the proposed system for all water types. The cost per liter is also estimated when the electrical heaters are replaced by solar collectors.

4. Economic Analysis

Economic analysis for the HFMD at several types of feed water is performed in this section. The analysis considers the present (p) and operational cost. Table 2 illustrates the prices of all components of the HFMD desalination system. The HFMD price is USD 1500. Considering the membrane is replaced twice during the lifespan of the system. So, the cost of the used membrane (USD 4500) is considered 92.8% of the total cost of the desalination unit (USD 4850) as shown in Table 2.
In this analysis, the expected lifetime (n) of the system is assumed to be 30 years, with an yearly interest rate of 5%. The sinking fund factor (SFF) and the capital recovery factor (CRF) can be calculated from Equation (1) and Equation (2), respectively [30]:
S F F = i / ( 1 + i ) n 1 ,
C R F = ( S F F ) × ( 1 + i ) n .
The fixed annual cost (FAC) can be estimated as follows [30]:
F A C = P × ( C R F ) .
The analysis also considers the scrape price (S) of the unit, which can be estimated using the following equation [30,31]:
S = 0.2 × P ,
The annual scrap value (ASV) in USD can be estimated as follows [30]:
A S V = ( S F F ) × S ,
The operational cost includes the cost of maintenance (replacement and cleaning) and the cost of consumed energy by the heaters and pumps. The annual maintenance cost (AMC) and annual electrical energy cost (AEEC) are calculated using Equation (6) and Equation (7), respectively [30]:
A M C = 0.15 × F A C ,
A E E C = E E C   k W h ( c o s t   o f   E l e c t r i c i t y / k W h ) 365 .
where the EEC (kWh) is the daily electrical energy consumption. The annual cost (AC) in USD can be calculated as follows [30]:
A C = F A C + A M C + A C E E C A S V ,
The cost of distilled water per liter (CPL) in USD/L is estimated as follows [30]:
C P L = A C / A P .
where AP (L) is the annual productivity. The cost analysis is also conducted when the electrical heaters are assumed to be replaced by evacuated tube solar collectors (ETSCs).
The calculated values of the several economic parameters are reported in Table 3. The cost of electricity is considered of 0.045 USD/kWh according to the Egyptian electricity commercial prices.
The cost per liter ( C P L ) for the proposed system is found within the range of 0.208–0.304 USD/L as summarized in Table 4. It is noticed that the cost of annual electrical energy consumption is 80.1% of the annual cost. It is very important to mention that part of this energy can be recovered from the heat exchanger (the chiller). The cost of freshwater production of the proposed system is considerably higher than similar systems using MD technology, which found in the range of 0.0017–0.015 USD/L for small capacity plants (≤0.5 m3/day) [33]. Keep in mind that the costs obtained in the current study are calculated for very small capacity systems (<0.025 m3/day), in addition to the mentioned costs of freshwater found in the literature for brackish and sea water desalination plants (≤35,000 ppm).
The obtained cost of freshwater from the proposed system is also relatively high compared to solar-powered HDH (0.052 to 0.096 USD/L) [34,35,36], while it is close to the cost values of solar distillers reported by Shalaby et al. [37] (0.171–0.25 USD/L). These costs of thermal desalination (MD, HDH, and solar distiller) are considered very high compared to RO, where RO achieves a very low cost of water production reaching 0.0009–0.004 USD/L at a small capacity [33]. It also found 0.0015 USD/L [38] when a battery-less PV integrated with a cooling system is used as the main source of power under the weather of Tanta, Egypt, while the RO achieves 0.0085 USD/L [39] when a battery-less PV was used under the weather conditions of Thirasia island, Greece. So, the RO is the best technology for brackish and sea water desalination. On the other hand, thermal desalination systems are recommended for desalinating water of a high salinity (more than 40,000 ppm). The integration between the MD and RO for concentrating the brine is also recommended. In these specific cases, the RO cannot efficiently operate.
To a obtain meaningful comparison, the proposed MD desalination system is compared to the other thermal desalination system used for extremely saline water. In this regard, the cost of freshwater produced from the current MD desalination system is found to be 0.271 USD/L at 100,000 pm compared to 0.112 USD/L when the hybrid-solar HDH was used to desalinate extremely saline water (100,000 ppm) [10]. The high cost of the MD compared to the hybrid solar HDH for extremely saline water was due to the high electrical power consumption required to heat the feed water of MD. So, using solar energy as a renewable source is considered a perfect solution to reduce the cost of water production of the MD. In this regard, Banat et al. [40] found that the cost of freshwater produced by the MD can be reduced to 0.015 USD/L when solar still is used to heat the MD feed water.
In this section, the cost of freshwater production is estimated when the two electrical heaters are replaced by two evacuated tube solar collectors (ETSCs) of total power 4 kW. It is assumed that the ETSCs can operate efficiently for 6 h per day. The cost of electrical heaters (USD 50) in Table 2 is replaced by the cost of the two ETSCs, which is USD 600. So, the total cost of the desalination unit powered by solar energy will be USD 5400. The fixed annual cost, annual electrical energy cost, and annual cost is recalculated based on the assumed conditions for ETSCs, as shown in Table 3. The annual cost of this case is reduced to USD 457.15 compared to USD 1750.7 when ETSCs are used. It is assumed that the desalination unit operated for only 6 h/day when ETSCs are used compared to 18 h/day for the case of electrical heaters. So, the annual productivity also changes, as seen in Table 4. From the results of Table 4, the CPL is reduced to 0.16–0.238 for water for feed water salinity varies from 3000 to 130,000 ppm when the ETSCs are used. According to these values, it concluded that the cost of water production decreases by 21.7–23.1% when the ETSCs are used to provide the required heat to the HFMD. Despite this reduction in freshwater production cost when solar energy is used, this cost is still high compared to similar solar-powered MD systems. This may be due to two factors: first, the cost estimated in this study based on experimental work for a very low-capacity system includes only one small membrane. Second, the pumping costs can be optimized in high-capacity desalination plants as it is difficult to find a small pump to match the small capacity plant in the current system.
It is very important to mention that the purpose of integration MD with RO is not only for freshwater production but also for RO brine disposal, which is also of great importance. Based on the previous results introduced in this study, the integration between RO and MD has the most potential and is the recommended application of MD where it is used for concentrating the RO brine and improving the productivity of the desalination plant as well.

5. Conclusions

In the current study, the HFMD was tested at different water types: brackish and sea water in addition to extremely saline water. A wide range of water salinities was used (3000–130,000 ppm). From the experimental results and economic analysis presented in study, the conclusions and recommendations are as follows:
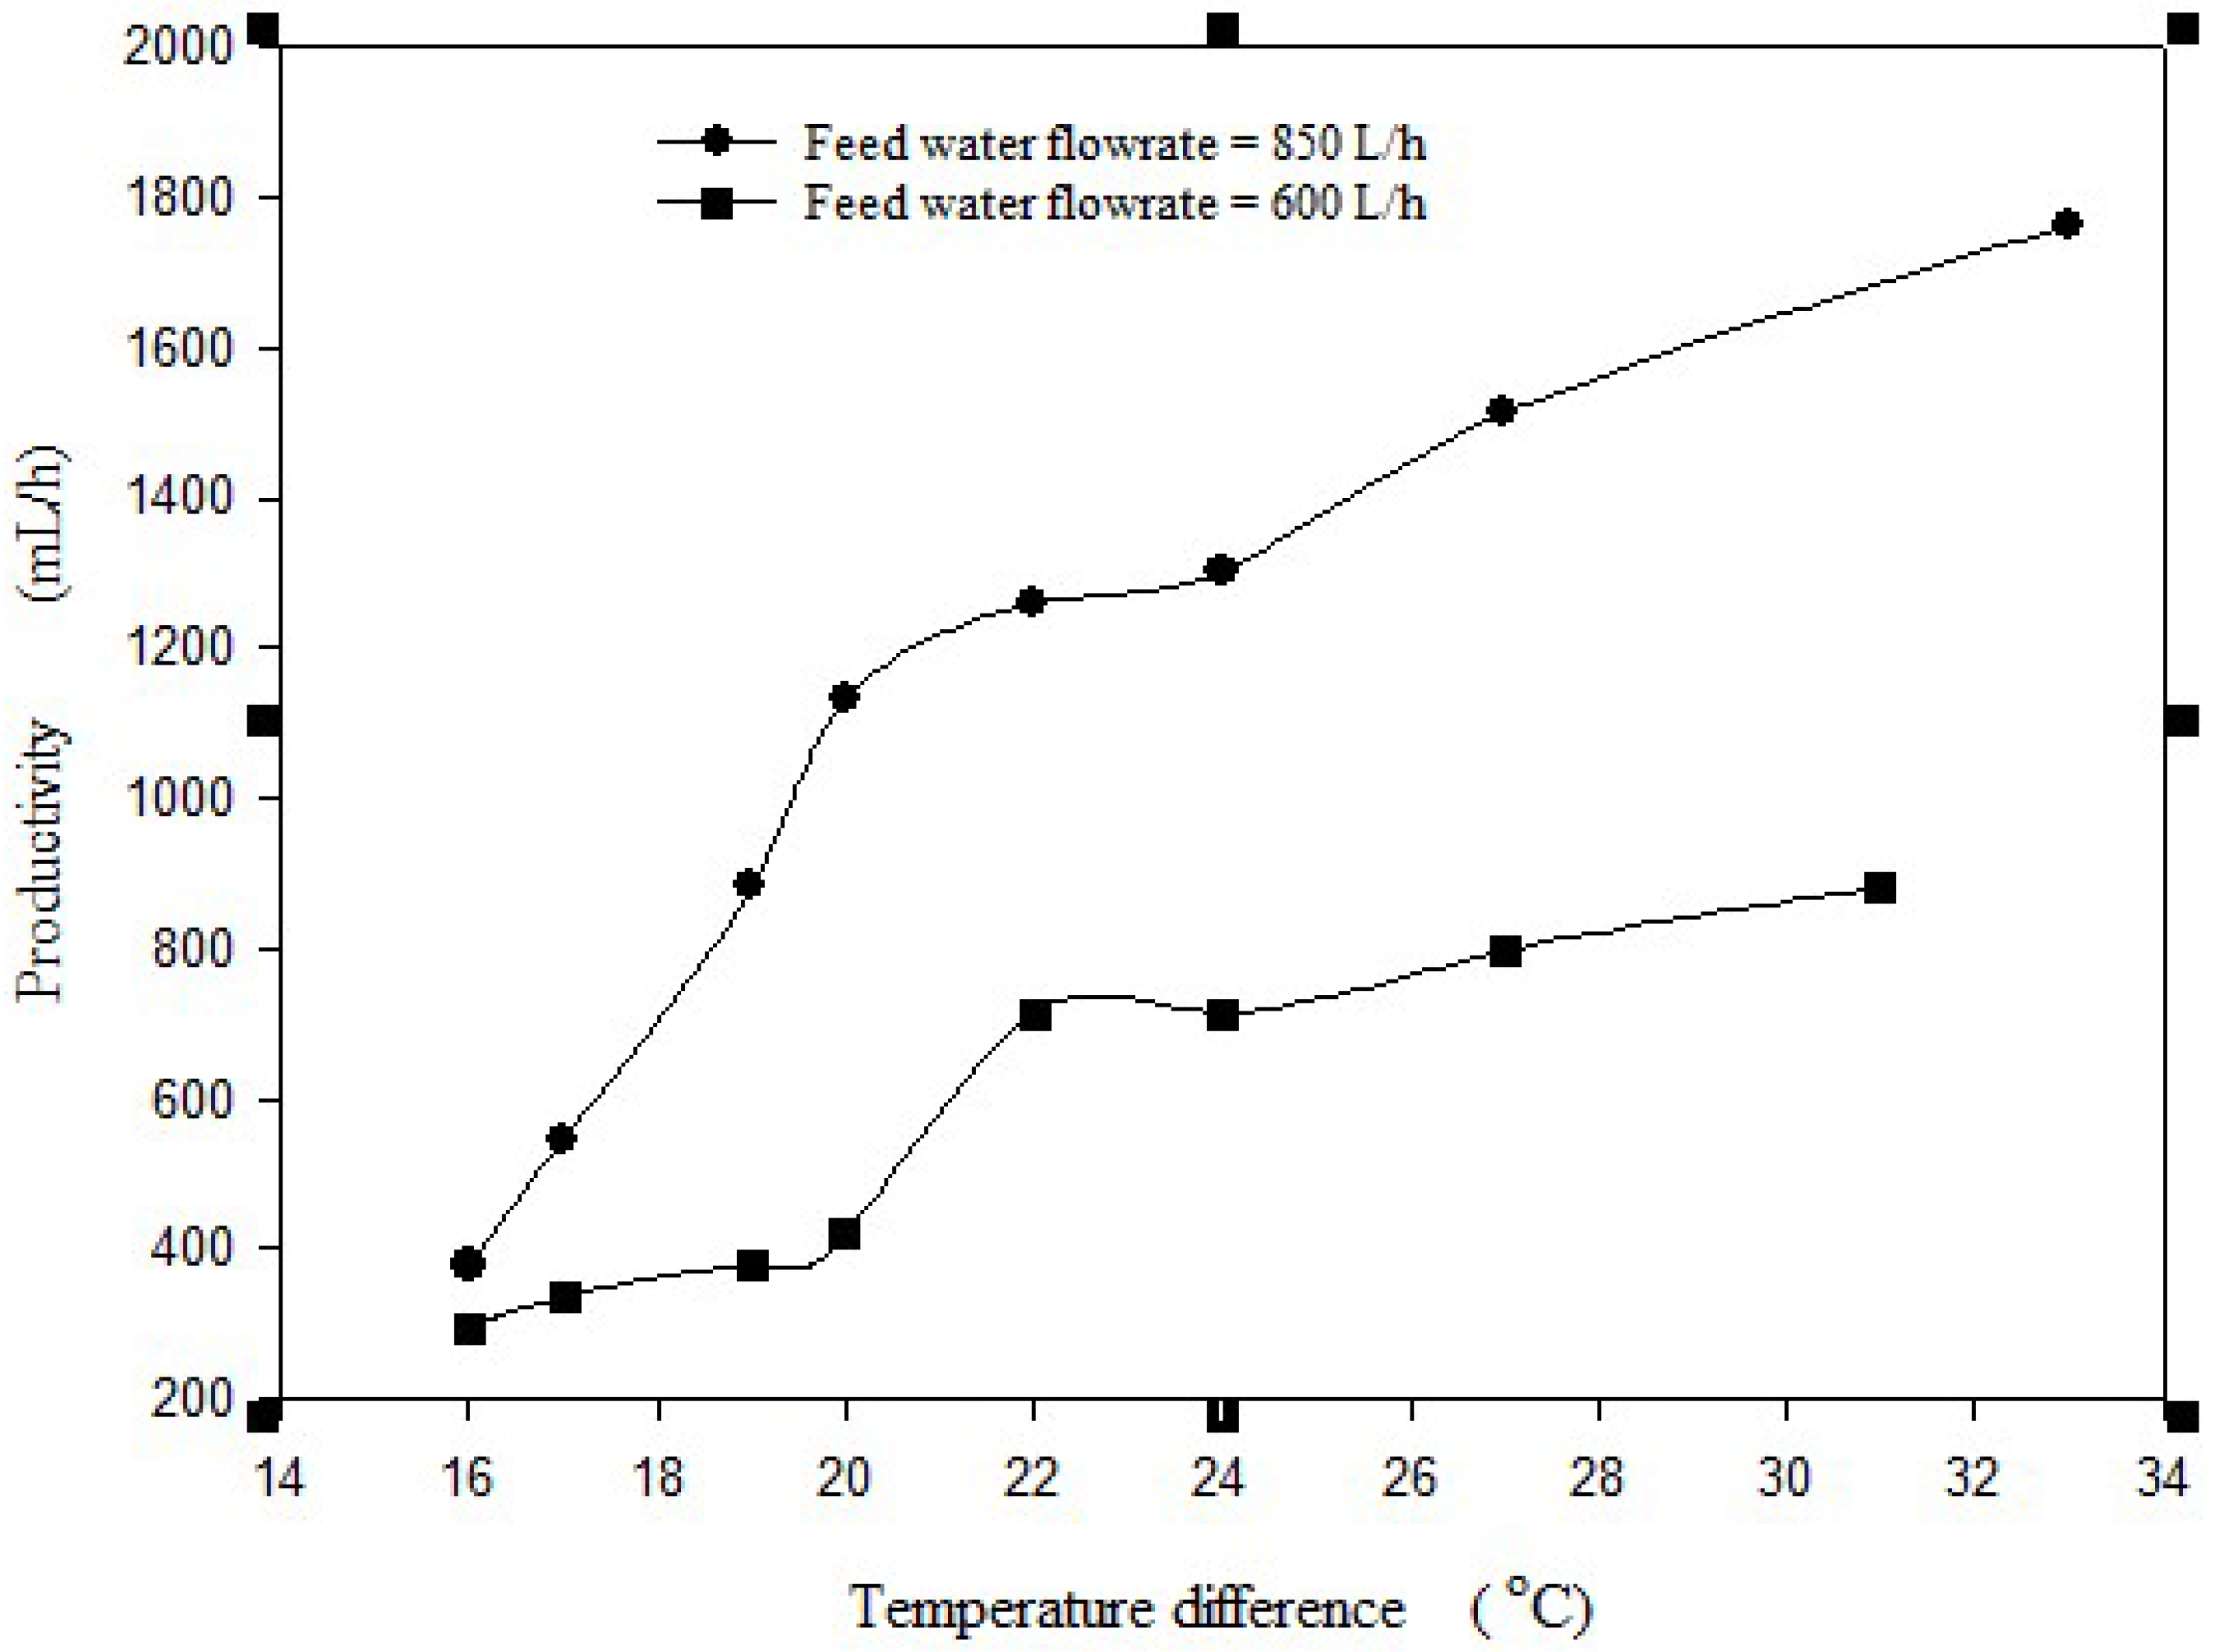
  • The productivity of HFMD significantly increases with increasing the hot feed water temperature and mass flow rate under the studied ranges of 65–76 °C and 600–850 L/h, respectively.
  • The productivity of HFMD is not significantly affected by increasing the salinity of water even when brackish or sea water is used.
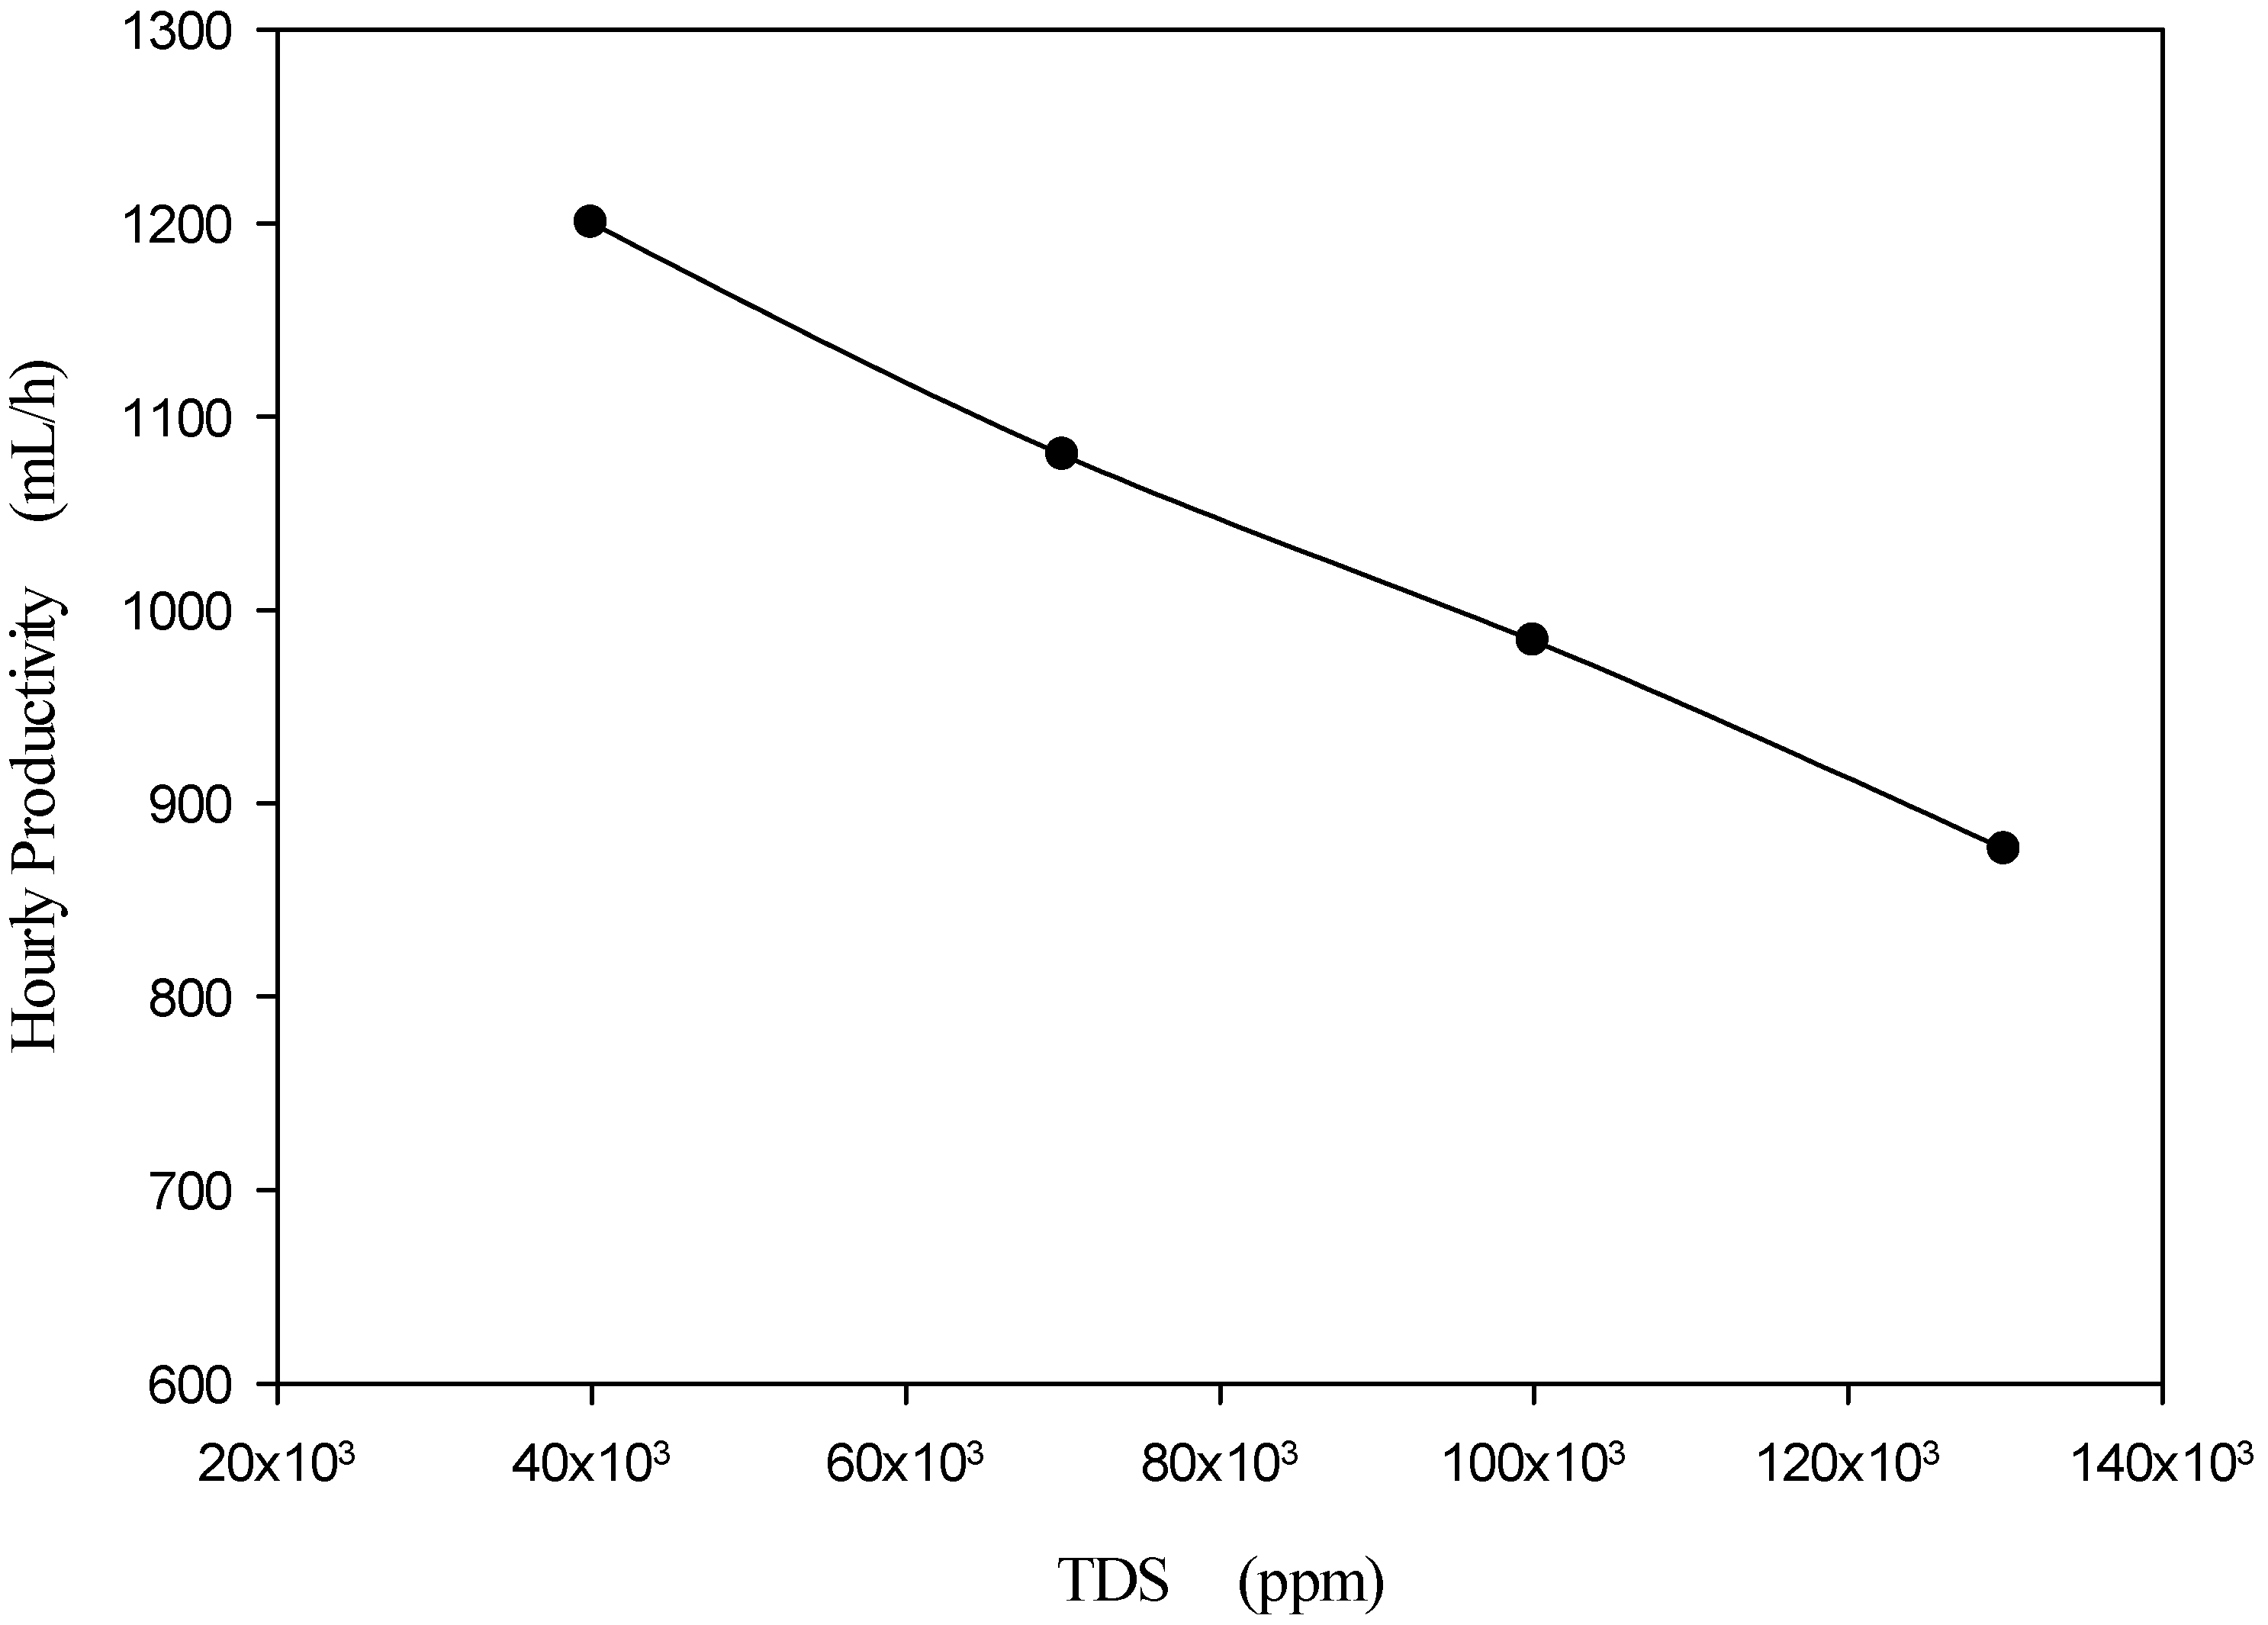
  • The productivity of HFMD slightly decreases with increasing salinity when extremely saline water is used.
  • The selection of HFMD system is associated with high cost per liter where it achieves 0.208–0.212 and 0.215–0.222 USD/L when brackish and sea water was used, respectively. So, it is not recommended to use HFMD for desalinating brackish and sea water, where the RO is the first choice as it achieves at least 1/10 of the costs of MD.
  • According to the costs achieved by HFMD (0.222–0.304 USD/L) when extremely saline water was used (40,000–130,000 ppm), the HFMD is considered the second choice after hybrid solar HDH.
  • It is recommended to use solar collectors to provide the heat required to operate the HFMD.
  • It is also recommended to operate the HFMD in vacuum mode to decrease the heat transfer between the hot and cold streams, which leads to decreasing the electrical power consumption.
  • The cost of water production decreases by 21.7–23.1% when solar collectors are used to provide the required heat to the HFMD.
  • Integrating solar energy and the HFMD system will lead to the extremely saline water desalination technologies or at least compete with the solar HDH technology.
  • The integration between RO and MD is the most potential and recommended application of MD where it is used for concentrating the RO brine and improving the productivity of the desalination plant as well.

Author Contributions

Methodology, H.A.E.; validation, H.A.E.; formal analysis, H.A.E. and F.A.H.; resources, S.M.S. and I.M.M.; data curation, A.M.A. and T.A.G.; writing—original draft, H.A.E. and F.A.H.; writing—review and editing, S.M.S., A.M.A., I.M.M. and T.A.G.; supervision, S.M.S. and I.M.M.; project administration, S.M.S. All authors have read and agreed to the published version of the manuscript.

Funding

This research received no external funding.

Data Availability Statement

The data that support the findings of this study are available from the corresponding author upon reasonable request.

Conflicts of Interest

The authors declare that they have no known competing financial interests or personal relationships that could have appeared to influence the work reported in this paper.

References

  1. Burn, S.; Hoang, M.; Zarzo, D.; Olewniak, F.; Campos, E.; Bolto, B.; Barron, O. Desalination techniques—A review of the opportunities for desalination in agriculture. Desalination 2015, 364, 2–16. [Google Scholar] [CrossRef]
  2. Ahmed, F.E.; Hashaikeh, R.; Hilal, N. Solar powered desalination—Technology, energy and future outlook. Desalination 2019, 453, 54–76. [Google Scholar] [CrossRef]
  3. Abdelkareem, M.A.; El Haj Assad, M.; Sayed, E.T.; Soudan, B. Recent progress in the use of renewable energy sources to power water desalination plants. Desalination 2018, 435, 97–113. [Google Scholar] [CrossRef]
  4. Greenlee, L.F.; Lawler, D.F.; Freeman, B.D.; Marrot, B.; Moulin, P. Reverse osmosis desalination: Water sources, technology, and today’s challenges. Water Res. 2009, 43, 2317–2348. (In English) [Google Scholar] [CrossRef]
  5. Service, R.F. Desalination Freshens Up. Science 2006, 313, 1088–1090. [Google Scholar] [CrossRef]
  6. Suo, Y.; Ren, Y. Research on the mechanism of nanofiltration membrane fouling in zero discharge process of high salty wastewater from coal chemical industry. Chem. Eng. Sci. 2021, 245, 116810. [Google Scholar] [CrossRef]
  7. Shalaby, S.M.; Sharshir, S.W.; Kabeel, A.E.; Kandeal, A.W.; Abosheiasha, H.F.; Abdelgaied, M.; Hamed, M.H.; Yang, N. Reverse osmosis desalination systems powered by solar energy: Preheating techniques and brine disposal challenges—A detailed review. Energy Convers. Manag. 2022, 251, 114971. [Google Scholar] [CrossRef]
  8. Ahmad, M.; Williams, P. Assessment of desalination technologies for high saline brine applications—Discussion Paper. Desalination Water Treat. 2011, 30, 1–15. [Google Scholar] [CrossRef]
  9. Shalaby, S.M.; Hammad, F.A.; Zayed, M.E. Current progress in integrated solar desalination systems: Prospects from coupling configurations to energy conversion and desalination processes. Process Saf. Environ. Prot. 2023, 178, 494–510. [Google Scholar] [CrossRef]
  10. Shalaby, S.M.; Kabeel, A.E.; Moharram, B.M.; Fleafl, A.H. Experimental study of hybrid solar humidification dehumidification system for extremely saline water desalination. Energy Convers. Manag. 2021, 235, 114021. [Google Scholar] [CrossRef]
  11. Thiel, G.P.; Tow, E.W.; Banchik, L.D.; Chung, H.W.; Lienhard, J.H. Energy consumption in desalinating produced water from shale oil and gas extraction. Desalination 2015, 366, 94–112. [Google Scholar] [CrossRef]
  12. Duong, H.C.; Chivas, A.R.; Nelemans, B.; Duke, M.; Gray, S.; Cath, T.Y.; Nghiem, L.D. Treatment of RO brine from CSG produced water by spiral-wound air gap membrane distillation—A pilot study. Desalination 2015, 366, 121–129. [Google Scholar] [CrossRef]
  13. Lokare, O.R.; Tavakkoli, S.; Wadekar, S.; Khanna, V.; Vidic, R.D. Fouling in direct contact membrane distillation of produced water from unconventional gas extraction. J. Membr. Sci. 2017, 524, 493–501. [Google Scholar] [CrossRef]
  14. Xu, J.; Singh, Y.B.; Amy, G.L.; Ghaffour, N. Effect of operating parameters and membrane characteristics on air gap membrane distillation performance for the treatment of highly saline water. J. Membr. Sci. 2016, 512, 73–82. [Google Scholar] [CrossRef]
  15. Al-Obaidani, S.; Curcio, E.; Macedonio, F.; Di Profio, G.; Al-Hinai, H.; Drioli, E. Potential of membrane distillation in seawater desalination: Thermal efficiency, sensitivity study and cost estimation. J. Membr. Sci. 2008, 323, 85–98. [Google Scholar] [CrossRef]
  16. Pan, J.; Zhang, F.; Wang, Z.; Sun, S.-P.; Cui, Z.; Jin, W.; Bamaga, O.; Abulkhair, H.; Albeirutty, M.; Drioli, E. Enhanced anti-wetting and anti-fouling properties of composite PFPE/PVDF membrane in vacuum membrane distillation. Sep. Purif. Technol. 2022, 282, 120084. [Google Scholar] [CrossRef]
  17. Manawi, Y.M.; Khraisheh, M.; Fard, A.K.; Benyahia, F.; Adham, S. Effect of operational parameters on distillate flux in direct contact membrane distillation (DCMD): Comparison between experimental and model predicted performance. Desalination 2014, 336, 110–120. [Google Scholar] [CrossRef]
  18. Hejazi, M.-A.A.; Bamaga, O.A.; Al-Beirutty, M.H.; Gzara, L.; Abulkhair, H. Effect of intermittent operation on performance of a solar-powered membrane distillation system. Sep. Purif. Technol. 2019, 220, 300–308. [Google Scholar] [CrossRef]
  19. Mustafa, I.; Kilibay, A.; Alhseinat, E.; Almarzooqi, F. Enhanced Membrane Distillation Water Flux through Electromagnetism. Chem. Eng. Process. -Process Intensif. 2021, 169, 108597. [Google Scholar] [CrossRef]
  20. Elcik, H.; Fortunato, L.; Alpatova, A.; Soukane, S.; Orfi, J.; Ali, E.; AlAnsary, H.; Leiknes, T.; Ghaffour, N. Multi-effect distillation brine treatment by membrane distillation: Effect of antiscalant and antifoaming agents on membrane performance and scaling control. Desalination 2020, 493, 114653. [Google Scholar] [CrossRef]
  21. Naidu, G.; Jeong, S.; Vigneswaran, S. Influence of feed/permeate velocity on scaling development in a direct contact membrane distillation. Sep. Purif. Technol. 2014, 125, 291–300. [Google Scholar] [CrossRef]
  22. Khayet, M. Membranes and theoretical modeling of membrane distillation: A review. Adv. Colloid Interface Sci. 2011, 164, 56–88. [Google Scholar] [CrossRef] [PubMed]
  23. Oxymo Technology Company, China. Available online: https://oxymembrane.com/product/membrane-distillation-ptfe-membrane/ (accessed on 1 April 2021).
  24. Ali Ahmed, H.J.; Lee, T.L.; Shaikh, J.M. An investigation on asset allocation and performance measurement for unit trust funds in Malaysia using multifactor model: A post crisis period analysis. Int. J. Manag. Financ. Account. 2011, 3, 22–31. [Google Scholar] [CrossRef]
  25. Park, K.; Burlace, L.; Dhakal, N.; Mudgal, A.; Stewart, N.A.; Davies, P.A. Design, modelling and optimisation of a batch reverse osmosis (RO) desalination system using a free piston for brackish water treatment. Desalination 2020, 494, 114625. [Google Scholar] [CrossRef]
  26. Eykens, L.; Reyns, T.; De Sitter, K.; Dotremont, C.; Pinoy, L.; Van der Bruggen, B. How to select a membrane distillation configuration? Process conditions and membrane influence unraveled. Desalination 2016, 399, 105–115. [Google Scholar] [CrossRef]
  27. Kim, J.; Park, M.; Shon, H.K.; Kim, J.H. Performance analysis of reverse osmosis, membrane distillation, and pressure-retarded osmosis hybrid processes. Desalination 2016, 380, 85–92. [Google Scholar] [CrossRef]
  28. Alkhudhiri, A.; Darwish, N.; Hilal, N. Treatment of high salinity solutions: Application of air gap membrane distillation. Desalination 2012, 287, 55–60. [Google Scholar] [CrossRef]
  29. Banat, F.A.; Simandl, J. Theoretical and experimental study in membrane distillation. Desalination 1994, 95, 39–52. [Google Scholar] [CrossRef]
  30. Fath, H.E.S.; El-Samanoudy, M.; Fahmy, K.; Hassabou, A. Thermal-economic analysis and comparison between pyramid-shaped and single-slope solar still configurations. Desalination 2003, 159, 69–79. [Google Scholar] [CrossRef]
  31. Kumar, S.; Tiwari, G.N. Life cycle cost analysis of single slope hybrid (PV/T) active solar still. Appl. Energy 2009, 86, 1995–2004. [Google Scholar] [CrossRef]
  32. Ettouney, H.M.; El-Dessouky, H.T.; Faibish, R.S.; Gowin, P.J. Evaluating the Economics of Desalination. Chem. Eng. Prog. 2002, 98, 32–39. [Google Scholar]
  33. Nthunya, L.N.; Bopape, M.F.; Mahlangu, O.T.; Mamba, B.B.; Van der Bruggen, B.; Quist-Jensen, C.A.; Richards, H. Fouling, performance and cost analysis of membrane-based water desalination technologies: A critical review. J. Environ. Manag. 2022, 301, 113922. [Google Scholar] [CrossRef] [PubMed]
  34. Hamed, M.H.; Kabeel, A.E.; Omara, Z.M.; Sharshir, S.W. Mathematical and experimental investigation of a solar humidification–dehumidification desalination unit. Desalination 2015, 358, 9–17. [Google Scholar] [CrossRef]
  35. El-Agouz, S.A.; Abugderah, M. Experimental analysis of humidification process by air passing through seawater. Energy Convers. Manag. 2008, 49, 3698–3703. [Google Scholar] [CrossRef]
  36. Abdel Dayem, A. A Pioneer Solar Water Desalination System: Experimental Testing and Numerical Simulation. Energy Sci. Technol. J. 2011, 1, 33. [Google Scholar]
  37. Shalaby, S.; Kabeel, A.E.; Moharram, B.E.; Shama, A.; Abosheiasha, H.A. Experimental study on the single basin solar still integrated with shell and spiral finned tube latent heat storage system enhanced by copper oxide nanoparticles. Environ. Sci. Pollut. Res. 2023, 30, 27458–27468. [Google Scholar] [CrossRef]
  38. Shalaby, S.M.; Elfakharany, M.K.; Mujtaba, I.M.; Moharram, B.M.; Abosheiasha, H.F. Development of an efficient nano-fluid cooling/preheating system for PV-RO water desalination pilot plant. Energy Convers. Manag. 2022, 268, 115960. [Google Scholar] [CrossRef]
  39. Manolakos, D.; Mohamed, E.S.; Karagiannis, I.; Papadakis, G. Technical and economic comparison between PV-RO system and RO-Solar Rankine system. Case study: Thirasia island. Desalination 2008, 221, 37–46. [Google Scholar] [CrossRef]
  40. Banat, F.; Jumah, R.; Garaibeh, M. Exploitation of solar energy collected by solar stills for desalination by membrane distillation. Renew. Energy 2002, 25, 293–305. [Google Scholar] [CrossRef]
Figure 1. Experimental setup, (a) photograph of HFMD, (b) schematic diagram of the HFMD experiment.
Processes 13 00240 g001
Figure 2. (a) Schematic diagram for the heat exchanger used for cooling down the permeate, (b) photograph of the hot water carrying coil.
Processes 13 00240 g002
Figure 3. The variation of hot and cold water temperature with time when the feed water flow rate, temperature, and salinity are 850 L/h, 76 °C, and 3000 ppm, respectively.
Processes 13 00240 g003
Figure 4. The variation of hot and cold water temperature with time when the feed water flow rate, temperature, and salinity are 600 L/h, 76 °C, and 3000 ppm, respectively.
Processes 13 00240 g004
Figure 5. The variation of hot and cold water temperature with time when the feed water flow rate, temperature, and salinity are 850 L/h, 65 °C, and 3000 ppm, respectively.
Processes 13 00240 g005
Figure 6. The effect of varying the temperature difference on the MD productivity, at two values of hot feed water flow rate.
Processes 13 00240 g006
Figure 7. The effect of varying water salinity on the MD productivity when the hot feed water flow rate and temperature are 850 L/h and 76 °C, respectively, under typical values of brackish and sea water salinities.
Processes 13 00240 g007
Figure 8. The effect of salt concentration on the MD productivity at extremely high salinity when the hot feed water flow rate and temperature are 850 L/h and 76 °C, respectively.
Processes 13 00240 g008
Table 1. The specifications of the hollow fiber MD4040.
ParameterSpecification
Membrane materialPTFE
Housing materialCPVC
Module dimensions, diameter/length (mm)90/1230
Pore size (µm)0.15
Fiber inner/outer diameter (mm)0.8/1.53
Porosity %55%
Water penetration pressure (bar)>3
Maximum feed water flow rate (L/h)1000
Effective area (m2)7
Maximum feed water pressure (bar)0.5
Operation temperature (°C)≤90
Table 2. The costs of several parts of the desalination unit.
ItemNumber of UnitsCost/Unit (USD)Total Cost (USD) (Electrical Heaters/Solar Collector)
Hollow fiber MD4040315004500
Electrical heater/solar collector (2 kW)22550/600
Heat exchanger1100100
Pump (0.5 hp)250100
Other--100100
Total cost4850/5400
Table 3. The data and assumed values used in the economic analysis.
ParameterReferencesValue (Electricity/Solar)
P (USD)From Table 24850/5400
i (%/year)5% [32]5%
n (year)30 [32]30
SFF (dimensionless)Equation (1)0.015
CRF (dimensionless)Equation (2)0.065
FAC (USD)Equation (3)315.26/351
S (USD)Equation (4)970
ASV (USD)Equation (5)14.55
AMC (USD)Equation (6)47.3
EEC (kWh)The consumed power × operational time85.4/4.47
AEEC (USD)Equation (7)1402.7/73.4
AC (USD)Equation (8)1750.7/457.15
CPL (USD/L)Equation (9)
AP (L)Calculated based on the measured productivity
Table 4. The calculated costs of freshwater produced by the HFMD system at different salinities.
Salinity
(ppm)
AP (L)
(Using Electrical Heaters)
CPL (USD/L)
(Using Electrical Heaters)
AP (L)
(If Solar Collectors Are Used)
CPL (USD/L)
(If Solar Collectors Are Used)
30008409.60.2082803.20.16
60008350.50.2092783.50.164
90008317.60.2112772.50.165
12,0008245.40.2122748.50.166
25,0008146.80.2152715.60.168
30,0008100.80.2162700.30.169
35,0008015.40.2182671.80.171
40,00078840.22226280.174
70,0007095.60.2482365.20.193
100,0006464.90.27121550.212
130,0005755.30.3041918.40.238
Disclaimer/Publisher’s Note: The statements, opinions and data contained in all publications are solely those of the individual author(s) and contributor(s) and not of MDPI and/or the editor(s). MDPI and/or the editor(s) disclaim responsibility for any injury to people or property resulting from any ideas, methods, instructions or products referred to in the content.

