Abstract
This study presents a combined numerical and experimental analysis of heat and mass transfer in mare’s milk during vacuum sublimation drying, which is a process essential for producing high-quality powdered products. The numerical model was developed using two-dimensional simulations and validated against experimental data obtained for varying sample thicknesses (3 mm, 5 mm, and 7 mm). Results demonstrated a strong agreement between the model and experimental temperature data, with a coefficient of determination () of 95% during the sublimation process. The findings revealed that thinner samples (3 mm) exhibited a 20% faster drying rate than thicker samples (7 mm), highlighting the critical role of sample thickness in sublimation dynamics. Additionally, the effects of heat flux distribution and mass loss due to sublimation were analyzed to understand the drying dynamics. This study highlights the importance of optimizing process parameters such as chamber pressure, shelf temperature, and sample thickness to enhance drying efficiency and reduce processing time. The findings provide valuable insights for scaling vacuum sublimation drying of mare’s milk for industrial applications.
1. Introduction
Vacuum freeze-drying is a highly efficient dehydration process that occurs at temperatures below the triple point of water. This technique enables the preservation of sensitive materials, such as pharmaceuticals, perishable foods, and nutritional products, by directly converting ice into vapor without passing through the liquid phase [1,2,3]. Despite its wide applications and engineering significance, freeze-drying is resource-intensive, time-consuming, and costly, requiring innovative approaches to improve its efficiency and scalability.
Mare’s milk, celebrated for its low fat content, digestibility, and rich nutritional profile, holds significant cultural and economic value in Kazakhstan. It is also renowned for its anti-aging and restorative properties [4,5]. Transforming fresh mare’s milk into powder via vacuum sublimation drying extends its shelf life, eases transportation, and ensures nutrient retention. However, the high water content and complex nutrient composition of mare’s milk present unique challenges for the freeze-drying process, necessitating precise control over drying conditions to optimize efficiency while maintaining product quality. Unlike cow, buffalo, or sheep milk, mare’s milk contains approximately 1.21% fat, 6.37% lactose, and 2.14% protein, making it similar to human milk and suitable for individuals with specific dietary needs [6]. intolerance Its high lactose content promotes beneficial gut microbiota, while its low fat and protein concentrations make it easier to digest. Although global production of mare’s milk is lower than that of other dairy animals, it holds significant economic potential due to its increasing popularity as a functional food. In Kazakhstan, where mare’s milk is deeply embedded in cultural traditions, its industrial processing into powder or supplements through advanced drying methods such as vacuum sublimation can enhance its shelf life and commercial value.
The vacuum sublimation drying process has gained increasing attention due to its ability to preserve the sensory and nutritional properties of mare’s milk, but it remains energy-intensive and costly [4,5]. Several mathematical models have been developed to describe freeze-drying processes [7,8,9,10]. Among these, the one-dimensional sorption-sublimation model by Liapis and Litchfield [10] is the most widely adopted, accounting for the simultaneous sorption and sublimation of moisture. However, the model is one-dimensional, with the sublimation interface shifting as drying progresses. Liapis and Litchfield employed a one-dimensional moving interface [11], which requires a one-dimensional material with no bends. While effective, this model oversimplifies spatial variability in temperature and moisture distribution. Subsequent advancements, such as the two-dimensional models by Tang et al. [12] and Mascarenhas et al. [13], and three-dimensional models by Scutella et al. [14], offer greater accuracy but remain computationally intensive and lack validation for food products like mare’s milk. Similarly, Srinivasan et al. [15] focus on the numerical investigation of heat and mass transfer in the freeze-drying of milk within a vial. Their study extends to the analysis of phase changes and mass transfer dynamics that influence the freeze-drying process. The results highlight the crucial role of heat flux and moisture removal in determining freeze-drying performance, thus offering valuable practical recommendations for optimizing such processes in the dairy industry.
Recent research has emphasized the importance of optimizing freeze-drying processes to enhance energy efficiency and product quality. For instance, Vilas et al. [16] developed real-time optimization techniques to reduce drying time by up to 30% without compromising quality. Levin et al. [17] demonstrated that increasing pore size enhances mass transfer rates, optimizing drying efficiency. Shao et al. [18] used cellular automaton models to achieve high accuracy in predicting moisture and temperature dynamics, while Chen et al. [19] combined numerical modeling and experimental validation to provide insights into the vacuum freeze-drying of kiwifruit. Despite these advancements, significant gaps remain in understanding the complex interactions between heat transfer, mass transfer, and product properties during the sublimation drying of mare’s milk [20,21,22,23,24].
This study aims to develop a comprehensive two-dimensional numerical model to simulate the heat and mass transfer processes during vacuum sublimation drying of mare’s milk. By integrating experimental data and examining critical factors such as sample thickness and chamber pressure, this research seeks to uncover the underlying mechanisms driving sublimation drying. The findings provide valuable insights for optimizing the drying process, reducing energy consumption and processing time, and ensuring scalability and quality for industrial applications.
2. Materials and Methods
Vacuum freeze-drying allows you to obtain high-quality products, but it requires significant energy consumption and takes more than 25 h. To reduce the cost of experiments, the optimal implementation of the vacuum freeze-drying process was determined using numerical modeling.
2.1. Experimental Setup
This section presents an experimental study on mare’s milk during the vacuum freeze-drying process, conducted to validate the accuracy of the numerical results.
In our experimental setup, the tray size is cm and the thickness of the poured mare’s milk is 3, 5, and 7 mm, sto take into account the symmetry of the domain structure, we consider a cm domain shown in Figure 1. The region is divided into two parts, referred to as the dried and frozen regions. As sublimation occurs, the interface shifts towards the bottom of the tray, leading to an increase in the thickness of the dry layer above the interface. The primary drying process is considered complete when the sublimation interface reaches the bottom of the tray.
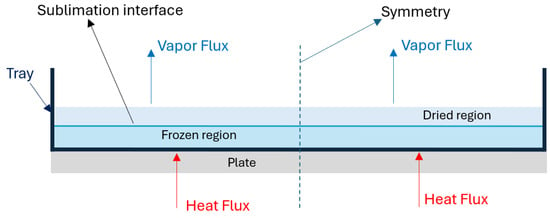
Figure 1.
Domainof interest.
Experimental apparatus. The main equipment for the experimental study is a shelf-type vacuum freeze-drying unit (model: ZLGJ-300) made by Zhengzhou Huachen Instrument (Zhengzhou, China) [25] and as shown in Figure 2. The specifications are listed in Table 1. Moisture content analysis was performed using the Evlas-2M moisture analyzer, and the final product was weighed with a high-precision electronic scale. The experimental material is placed within the drying chamber, where, under low-temperature and -pressure conditions, the ice within the material sublimates into water vapor. This vapor is then transported through the vacuum piping system to the condensing chamber for condensation.
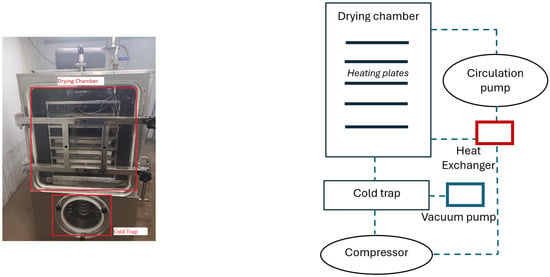
Figure 2.
Experimental setup. (left) Photo and (right) overall design structure of shelf-type vacuum freeze-drying unit.

Table 1.
Key features of the freeze-drying unit.
Experimental procedure. In this study, mare’s milk sourced from the Talgar district near Almaty, Kazakhstan, was used as the experimental material. The milk was first filtered to remove any impurities and then poured into stainless steel trays measuring 50 cm × 45 cm × 3 cm. To investigate the effect of sample thickness on the sublimation drying process, uniform milk layers were prepared with thicknesses of 3 mm, 5 mm, and 7 mm. The trays were then placed inside a shelf-type vacuum freeze-drying chamber (Model: ZLGJ-300).
Pre-Freezing. Before the drying process began, the trays were kept at a pre-freezing temperature of −50 °C for 3–5 h, depending on the sample thickness. This step ensured the complete freezing of the moisture within the sample. The freezing process was carefully monitored to achieve uniform ice crystal formation, a crucial factor for efficient sublimation.
Drying Conditions. Once the pre-freezing stage was complete, the vacuum chamber pressure was reduced from atmospheric pressure () to approximately 100 Pa.
The shelf temperature was gradually increased from −30 °C to 50 °C during the sublimation drying process. This heating profile was designed to facilitate moisture removal while preventing overheating and quality degradation of the sample.
Monitoring and Measurements. Temperature sensors were inserted into the milk samples to monitor real-time temperature changes during the drying process. Chamber pressure and sample temperature were recorded every three minutes using the freeze-drying system’s built-in data acquisition system. To determine the residual moisture content, the Evlas-2M moisture analyzer was used. The final moisture content of the dried product was ensured to remain below 4%, as required by industry standards, with most cases falling within the range of 3–4%. Experimental data collected during this process are publicly available and can be accessed here [26].
Completion of Drying. The sublimation drying process typically lasted 20–25 h, depending on the sample thickness. The process was considered complete when the sample weight stabilized, indicating the removal of all free water through sublimation. The final dried product was visually inspected and is displayed in Figure 3.
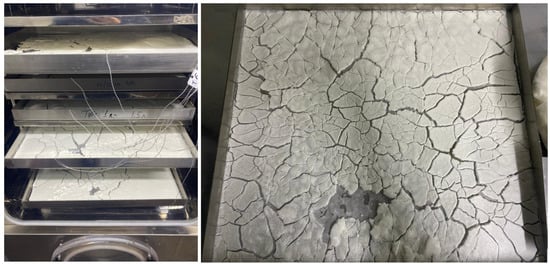
Figure 3.
Dried mare’s milk.
Challenges and Considerations. The sublimation drying phase, being the most energy-intensive stage of the freeze-drying process, posed specific challenges, such as maintaining uniform heat distribution and ensuring consistent pressure levels throughout the chamber. These challenges were mitigated by precise control of operating parameters and careful monitoring of the drying conditions.
Measurement of Moisture Content. To determine the moisture content of the mare’s milk samples during the vacuum sublimation drying process, we used the Evlas-2M moisture analyzer, a high-precision instrument designed for accurate moisture content analysis in food and biological products. The measurement process involved collecting dried samples at 3 h intervals throughout the drying process to track moisture loss precisely.
Before measurement, samples were cooled to ambient temperature to avoid thermal effects that could affect the moisture readings. Each sample was weighed using a high-precision electronic balance before and after drying to determine the total moisture loss. The following calculation was used to determine the moisture content:
where is the moisture content percentage; is the initial weight of the sample before drying; and is the final weight of the dried sample. The measurements were conducted at regular intervals, and the recorded data were averaged over three independent trials to ensure statistical accuracy. The final moisture content of the samples was confirmed to be below 4%, meeting industry standards for powdered milk products.
The Evlas-2M analyzer was calibrated regularly following the manufacturer’s specifications to maintain measurement accuracy and reliability throughout the experimental process. Data collected from this analysis were used to validate the numerical model by comparing predicted moisture content profiles with experimental results.
2.2. Numerical Modeling
Assumptions. In this study, a few assumptions are made to simplify the modeling process, as outlined below:
- 1.
- Rigid Solid Matrix: The solid matrix structure of mare’s milk is considered rigid. This means that the matrix does not deform or change its structure during the sublimation drying process.
- 2.
- Infinitesimally Thin Interface: There exists a continuous, infinitesimally thin interface between the dried and frozen regions of the milk. This interface is used to track the progress of the sublimation front.
- 3.
- Water Vapor Transfer: Water vapor transfer in the dried region follows Darcy’s law. This implies that the movement of water vapor is driven by a pressure gradient, and the porous structure of the dried region is assumed to behave like a rigid porous medium.
- 4.
- Porous Matrix below Glass Transition: The porous matrix remains rigid as long as its temperature stays below the glass transition temperature. This assumption ensures that the physical structure of the dried region does not change during sublimation.
- 5.
- Thermal Properties Averaged by Composition: The thermal properties of mare’s milk (specific heat capacity, density, and thermal conductivity) are approximated using a weighted average of its individual components (water, fat, protein, lactose, and ash). This assumption is made due to the lack of precise data on the thermal properties of mare’s milk in the literature.
Governing Equations. The heat transfer occurring within the frozen product can be outlined as follows [27]:
where is the density, is the specific heat capacity, T is the temperature, t is time, k is the thermal conductivity, H is the latent heat of sublimation, is porosity, is ice density, and S is ice saturation.
where is water vapor density; u is the Darcy velocity, which is calculated in Equation (3); and is the Knudsen mass diffusivity.
where is the Darcy’s permeability, represents the dynamic viscosity, and is the water vapor pressure. It could be correlated with water vapor density through the ideal gas law.
Vapor pressure can be calculated from the obtained density in Equation (8) from the following:
where is the universal gas constant, and is molecular weight.
Initial and Boundary Conditions. At the outset, the pressure within the dried region is assumed to be equal to that of the drying chamber. Additionally, the sample material is considered uniform and isothermal across both the dried and frozen regions at the start of the sublimation drying process. Therefore, the initial conditions are:
where represents the chamber pressure (in Pascals), and denotes the initial temperature (in Kelvin) of the sample material at the start of the sublimation drying process
The mass transfer (in terms of pressure and vapor flux) boundary conditions are as follows.
At the top surface:
At the lateral surface:
Since water vapor is produced at the sublimation interface, the vapor flux boundary condition is established at this interface:
The heat transfer boundary conditions of dry region:
The heat transfer boundary conditions of frozen region:
The heat transfer boundary conditions in the sublimation interface:
where is the sublimation interface temperature (in Kelvin).
Parameters and Thermal Physical Properties. There is no precise information about the thermal conductivity, density, and specific heat capacity of mare’s milk in the literature yet, therefore the thermal conductivity, density, and specific heat capacity of mare’s milk can be calculated based on its composition.
The density of mare’s milk can be estimated as a weighted average of the densities of its components. The general formula is:
where is the weight fraction of component i (e.g., water, fat, protein), and is the density of component i.
The specific heat capacity () of a mare’s milk can also be estimated as a weighted average of the specific heat capacities of its components:
where is the specific heat capacity of component i.
Thermal conductivity () of mare’s milk (which contains water, fat, protein, lactose, and ash) is calculated based on the weighted average method. This method assumes that the overall thermal conductivity of a mixture is the sum of the thermal conductivities of its individual components, each weighted by its volume or mass fraction in the mixture
The typical composition of mare’s milk is as follows [6]: water ∼89.86%, fat ∼1.21%, protein ∼2.14%, lactose ∼6.37%, and ash: ∼0.42%
Using the provided composition of mare’s milk and Formulas (17)–(19), we can determine the following calculated solid matrix properties:
- :
- 1351.92 kg/
- :
- 2197.42 J/kg K
- :
- 0.350 W/m K
To account for the variation in thermophysical properties across the solution domain based on ice saturation , volume-averaged properties must be defined. The parameter S ranges from 0, indicating dried cells, to 1, indicating frozen cells, while values between 0 and 1 represent the sublimation cells at the interface. The volume-averaged density and heat capacity are expressed as:
The volume-averaged thermal conductivity, based on the parallel model for heat conduction in porous media, is given as:
By setting , the final properties of the dried product are obtained [27].
Table 2 presents the input data utilized for the current numerical solution

Table 2.
Input parameters of freeze-drying process modeling.
Numerical method. The numerical simulation is performed in a two-dimensional framework using COMSOL Multiphysics 6.0. This software utilizes the finite element method to discretize the governing equations for heat and mass transfer during the freeze-drying process in porous media. In this study, the Heat Transfer in Porous Media module is used to solve the energy equation, while the Transport of Diluted Species module handles mass transport. Darcy’s law is employed to model vapor flow through the porous medium, and the phase indicator variable is used to track the transition between frozen and dried phases during the sublimation process. The simulation applies a stepwise heat flux to the bottom surface for conduction heating, while the top and side surfaces are modeled as insulated. Initial conditions for temperature and vapor density are set based on the frozen state of the material, with full ice saturation at the start of the process. The simulation uses a Backward Differentiation Formula (BDF) time-stepping method, along with the PARDISO solver, to handle the non-linearities of the system. These parameters are selected to achieve a balance between solution accuracy and computational efficiency, leading to precise predictions of temperature distribution, pressure, sublimation rates, and overall drying time.
Mesh Independence Study. To ensure numerical accuracy and validate the reliability of the simulation results, a structured triangular mesh was used in the computational domain. The mesh was generated using COMSOL Multiphysics with an “Extremely Fine” element size setting, yielding a total of 1418 triangular elements as shown in Table 3. Key mesh quality metrics included a minimum element quality of 0.705 and an average element quality of 0.9052, ensuring high numerical stability and accuracy.

Table 3.
Summary of mesh statistics.
The mesh independence study confirmed that refining the mesh further (e.g., increasing the number of elements) produced negligible changes in key simulation outputs, such as temperature distribution and sublimation front position. Therefore, the current mesh resolution was deemed sufficient for the study.
3. Results and Discussion
In this section, we analyze the experimental results obtained and discuss the numerical simulation outcomes based on the governing equations. We also compare the experimental data with the numerical simulations and conduct comparative analyses with results from other researchers whose work aligns with our topic.
3.1. Experiment and Simulation Verification
Multiple experiments were conducted using sample thicknesses of 3, 5, 7, and 9 mm. In the 9 mm case, the moisture content of the final product exceeded 10%, so we focused on cases with thicknesses under 7 mm. In the current experiment, the initial temperature of the milk was 30 °C, and the initial chamber pressure was 58,640 Pa. The entire experiment lasted 24.8 h, of which 4.15 h were allocated to pre-freezing, and 9.9 h to the sublimation process. During sublimation, the chamber pressure ranged from 512 to 110 Pa, and the temperature varied between −43.7 °C and 0 °C. The final 10.85 h were used to dry the remaining moisture content. Detailed data can be found in [26]. During the sublimation process, the temperature was increased stepwise by −50 °C, −40 °C, −30 °C, −20 °C, −10 °C, and 0 °C, increasing every two hours. The subsequent drying phase took 2 h at 20 °C, 3 h at 30 °C, and 5.85 h at 50 °C. Since the temperature was increased stepwise, these conditions were carefully included in the numerical calculations.
Figure 4 presents a comparison between the numerical and experimental data for temperature variation during both the primary and secondary drying processes. In this experimental scenario, the sample had a thickness of 5 mm.
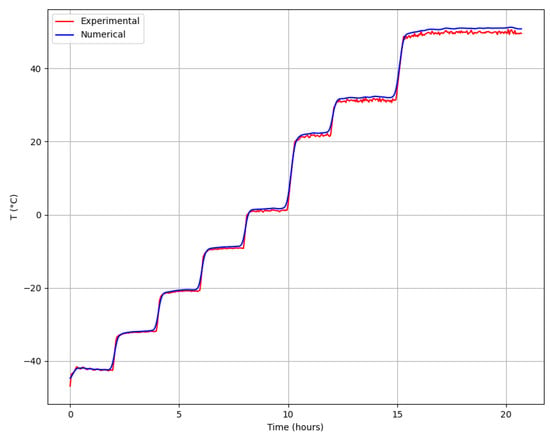
Figure 4.
Comparison of experimental and numerical temperature profiles for a sample thickness of 5 mm. The high value (0.95) demonstrates the accuracy of the numerical model in predicting temperature changes during the drying process.
Figure 4 clearly shows that the numerical simulation results closely correspond to the experimental data. In the simulation, the cooling and heating supplied beneath the tray were modeled using a step function.
The goodness of fit was evaluated using the coefficient of determination (). The value was calculated using the formula:
where represents the experimental temperature values, are the numerical simulation temperature values, and is the mean of the experimental temperature values. An R² value of 0.95 was observed during the sublimation and drying process, indicating strong agreement between the model and experimental data. As shown in Figure 4, the temperature profiles predicted by the numerical model closely match the experimental data, validating the model’s ability to simulate heat and mass transfer in the sublimation drying process.
To verify the accuracy of the simulation results, a comparison was made with the data obtained by López-Quiroga et al. [31], who modeled the sublimation drying process of skim milk. The predicted sublimation front position shows good agreement with the results of López-Quiroga et al., as shown in Figure 5.
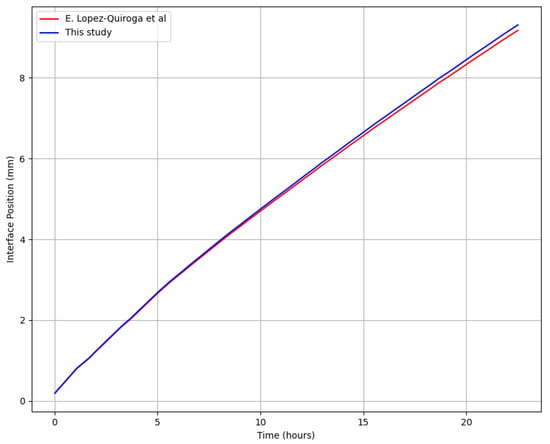
Figure 5.
Comparison of the current prediction with the results of López-Quiroga et al. [31].
At the initial stage of the sublimation drying process, a considerable amount of latent heat is required for sublimation, leading to a decrease in the sample temperature. As the sublimation front advances, the surface temperature of the dried region gradually increases. However, during the final ten hours of drying, a noticeable discrepancy arises between the experimental and simulated data. This suggests that the modeled heat transfer from the shelf is higher than what was observed in the experiment.
3.2. Sublimation Drying Process Analysis
The sublimation drying process was analyzed by examining the heat transfer and moisture content distributions within the drying chamber. The numerical model provided detailed insights into the spatial and temporal evolution of these variables.
The heat transfer analysis focused on evaluating the temperature gradients and heat flux within the drying chamber. The numerical simulations revealed significant temperature gradients at the beginning of the drying process due to the large thermal load imposed by the phase change from ice to vapor.
Figure 6 illustrates the temperature distribution of mare’s milk samples during the sublimation drying process under standard conditions. Throughout the drying process, heat transferred from the shelf moves from the frozen region to the sublimation interface. Mass loss during sublimation occurs as water vapor is generated at the sublimation front and transported through the dried layer, reducing the total mass of the sample and causing the sublimation front to move downward toward the heat source as drying progresses. This dynamic process is driven by the continuous removal of water vapor, which maintains the vapor pressure gradient essential for sustaining mass transfer throughout the drying process. It is crucial to note that the frozen and dried regions exhibit different thermophysical characteristics. Specifically, the heat capacity and thermal conductivity are higher in the frozen region compared to the dried region, resulting in a more uniform temperature distribution and a slower temperature rise in the frozen area. In contrast, the dried region absorbs radiant heat more intensively, causing a faster temperature increase.
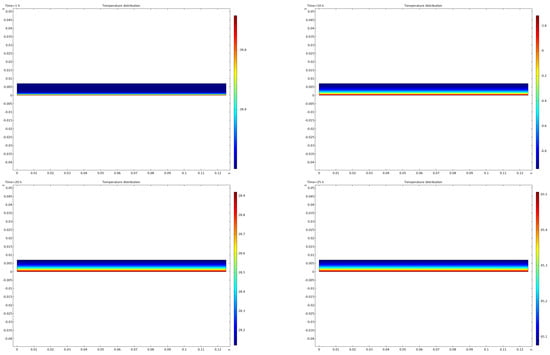
Figure 6.
Heat flux distribution at various time intervals.
During the sublimation drying process, structural changes such as cracks and flakes can develop due to mechanical stresses caused by uneven drying and differential shrinkage between the dried and frozen regions. These structural changes are visible in Figure 3 and are attributed to the shrinkage of the dried layer as water vapor escapes. Although our current numerical model assumes a rigid porous matrix with no structural deformation, these phenomena could influence both heat and mass transfer processes. Cracks can create additional vapor flow pathways, enhancing mass transfer by reducing vapor diffusion resistance. However, they may also cause localized heat loss through increased surface area exposed to the vacuum environment. Flake formation could impede heat transfer if detached layers act as thermal barriers. Future improvements to the numerical model could incorporate structural deformation through a poromechanical approach to simulate the effects of cracking and flaking on drying kinetics.
Figure 7 illustrates the moisture content distribution. The initial stage of drying shows a rapid decrease in moisture content near the surfaces in contact with the shelves, where heat is supplied. As drying progresses, the moisture front moves right to left, and the drying rate decreases.
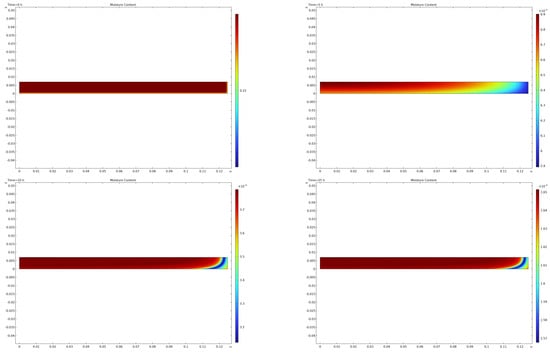
Figure 7.
Moisture content distribution at various time intervals.
Coupled Heat and Mass Transfer Dynamics. The vacuum sublimation drying process inherently involves coupled heat and mass transfer mechanisms. As heat is supplied from the bottom of the sample tray, it is conducted through the frozen region until it reaches the sublimation front. Here, ice undergoes phase change, consuming latent heat while generating water vapor. This coupling between heat transfer and mass transfer defines the drying kinetics.
The generated water vapor diffuses through the porous dried layer, driven by a vapor pressure gradient created between the sublimation front and the low-pressure vacuum environment. This process was modeled using Darcy’s law for vapor transport and Knudsen diffusion, as described in the Numerical Modeling section. The simultaneous flow of heat and vapor ensures continuous sublimation while moving the sublimation front downward.
The coupling becomes evident when comparing the experimental and numerical results. Figure 8 demonstrates that thinner samples exhibit faster drying due to reduced diffusion distances for vapor transport, enabling more efficient mass transfer. Conversely, thicker samples experience slower drying because the thicker dried layer creates additional resistance to vapor flow. This interplay between heat and mass transfer explains the observed drying behavior and validates the proposed numerical model.
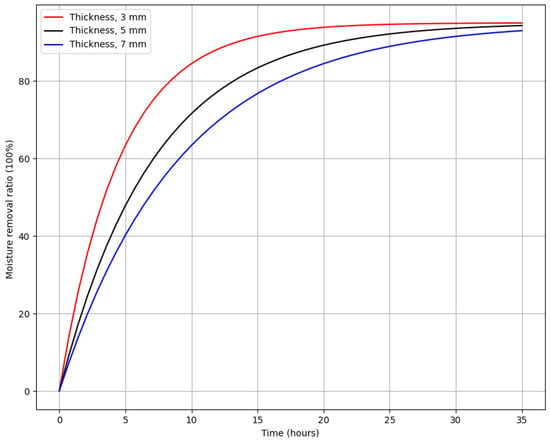
Figure 8.
Impact of sample thickness on the moisture removal rate during the vacuum sublimation drying process. While moisture content was measured at both the center and edges of samples in different experiments, the data presented here reflect measurements taken at the center of the samples for consistency in comparing different thicknesses.
Moisture content measurements were conducted at both the center and edges of the samples throughout multiple experiments to evaluate spatial variability in the drying process. However, for the specific results presented in Figure 8, measurements were taken only at the center of the samples to provide a consistent comparison across different thicknesses. This approach highlights the critical role of sample thickness in determining the drying rate, as the center typically experiences slower moisture removal due to reduced heat transfer compared to the edges.
The influence of sample thickness on the degree of moisture removal was also evaluated. Sample thickness varied from 3 mm to 7 mm, while the shelf temperature was set at −50 °C and the chamber pressure at 110 Pa.
Figure 8 shows the influence of sample thickness on the degree of moisture removal.
The graph illustrates the relationship between moisture removal ratio and time for three different material thicknesses: 3 mm, 5 mm, and 7 mm. The moisture removal ratio, expressed as a percentage, increases over time for all thicknesses, with thinner samples drying faster. The red line, representing the 3 mm thickness, shows the quickest moisture removal, reaching nearly 90% within 10 h. The black line, representing the 5 mm sample, follows a slower curve, requiring about 15 h to achieve a similar moisture removal percentage. The blue line, corresponding to the 7 mm sample, shows the slowest drying rate, reaching 90% moisture removal only after approximately 20 h. This demonstrates that thinner samples dry more quickly because the shorter diffusion distance allows moisture to escape more efficiently, while thicker samples require more time to reach the same level of moisture removal. Understanding this trend is crucial in optimizing drying processes such as vacuum sublimation, where the thickness of the material plays a significant role in the drying time.
Based on the findings from this study, maintaining a sample thickness of less than 5 mm during vacuum sublimation drying is recommended to ensure compliance with international standards, which require a final moisture content of less than 4%. Thicker samples increase the risk of higher residual moisture content, which could compromise the quality and shelf life of the final product.
For industrial-scale applications, employing larger trays to handle greater sample volumes and incorporating multiple trays within the drying chamber can improve the economic efficiency of the process. This approach allows for higher throughput while maintaining compliance with product quality standards. However, drying thin samples in small trays may be less economically viable due to increased energy consumption and longer drying times relative to the product output.
Future investigations will focus on optimizing the freeze-drying process by integrating advanced modeling techniques and real-time control systems. These studies aim to balance product quality and economic feasibility, ensuring the scalability of vacuum sublimation drying for mare’s milk.
4. Conclusions
In this study, numerical modeling and experimental investigation of heat and mass transfer during the vacuum sublimation drying of mare’s milk were conducted. The developed two-dimensional numerical model accurately predicted the dynamics of sublimation front movement, temperature distribution, and moisture removal, achieving a strong agreement with experimental data, indicated by a coefficient of determination (R²) of 0.95. The results demonstrated that increasing shelf temperature accelerates moisture removal, enhancing overall drying efficiency. Sample thickness played a critical role in determining drying time, with thinner samples (3 mm) drying 20% faster than thicker samples (7 mm) due to shorter diffusion distances.
While the study primarily focused on heat and mass transfer dynamics, it also emphasized the practical significance of optimizing process parameters such as chamber pressure, shelf temperature, and sample thickness to improve drying efficiency and reduce processing time.
In further work, we plan to expand the model to 3D for more detailed analysis, integrate optimization algorithms to improve energy efficiency, and validate the model with other food products. We also aim to incorporate real-time process control, analyze nutrient retention in more detail, and collaborate with industry for large-scale application and practical validation.
Author Contributions
Conceptualization, A.R. and N.I.; methodology, A.A. and A.R.; software, A.A.; writing—review and editing, A.A. and N.I.; visualization, S.B. and A.B. All authors have read and agreed to the published version of the manuscript.
Funding
This research is funded by the Committee of Science of the Ministry of Science and Higher Education of the Republic of Kazakhstan (Grant No. BR21881957).
Data Availability Statement
The original contributions presented in this study are included in the article. Further inquiries can be directed to the corresponding authors.
Conflicts of Interest
The authors declare that they have no conflicts of interest.
References
- Pikal, M.J. Freeze Drying Encyclopedia of Pharmaceutical Technology, 3rd ed.; Taylor & Francis: London, UK, 2006; pp. 275–305. [Google Scholar]
- Musaev, A.; Sadykova, S.; Anambayeva, A.; Saizhanova, M.; Balkanay, G.; Kolbaev, M. Mare’s Milk: Composition, Properties, and Application in Medicine. Arch. Razi Inst. 2021, 76, 1125. [Google Scholar] [CrossRef] [PubMed]
- Kushugulova, A.; Kozhakhmetov, S.; Sattybayeva, R.; Nurgozhina, A.; Ziyat, A.; Yadav, H.; Marotta, F. Mare’s Milk as a Prospective Functional Product. Funct. Foods Health Dis. 2018, 8, 548. [Google Scholar] [CrossRef][Green Version]
- Ratti, C. Hot Air and Freeze-Drying of High-Value Foods: A Review. J. Food Eng. 2001, 49, 311–319. [Google Scholar] [CrossRef]
- Kremer, D.M.; Pikal, M.J.; Petre, W.J.; Shalaev, E.Y.; Gatlin, L.A.; Kramer, T. A Procedure to Optimize Scale-Up for the Primary Drying Phase of Lyophilization. J. Pharm. Sci. 2009, 98, 307–318. [Google Scholar] [CrossRef]
- Jastrzebska, E.; Wadas, E.; Daszkiewicz, T.; Pietrzak-Fiecko, R. Nutritional Value and Health-Promoting Properties of Mare’s Milk: A Review. Czech J. Anim. Sci. 2017, 62, 511–518. [Google Scholar] [CrossRef]
- Nastaj, J.F.; Witkiewicz, K. Mathematical Modeling of the Primary and Secondary Vacuum Freeze Drying of Random Solids at Microwave Heating. Int. J. Heat Mass Transf. 2009, 52, 4796–4806. [Google Scholar] [CrossRef]
- Nastaj, J.F.; Witkiewicz, K.; Wilczynska, B. Experimental and Simulation Studies of Primary Vacuum Freeze-Drying Process of Random Solids at Microwave Heating. Int. Commun. Heat Mass Transf. 2008, 35, 430–438. [Google Scholar] [CrossRef]
- Georgiev, K.; Kosturski, N.; Margenov, S.; Starý, J. On Adaptive Time Stepping for Large-Scale Parabolic Problems: Computer Simulation of Heat and Mass Transfer in Vacuum Freeze-Drying. J. Comput. Appl. Math. 2009, 226, 268–274. [Google Scholar] [CrossRef]
- Liapis, A.I.; Litchfield, R.J. Optimal Control of a Freeze Dryer-I: Theoretical Development and Quasi Steady State Analysis. Chem. Eng. Sci. 1979, 34, 975–981. [Google Scholar] [CrossRef]
- Liapis, A.I.; Litchfield, R.J. Numerical Solution of Moving Boundary Transport Problems in Finite Media by Orthogonal Collocation. Comput. Chem. Eng. 1979, 3, 615–621. [Google Scholar] [CrossRef]
- Tang, M.M.; Liapis, A.I.; Marchello, J.M. A Multi-Dimensional Model Describing the Lyophilization of a Pharmaceutical Product in a Vial. In Proceedings of the 5th International Drying Symposium, Cambridge, MA, USA, 13–16 August 1986; Mujumdar, A.S., Ed.; Hemisphere Publishing Corporation: New York, NY, USA, 1986; pp. 57–64. [Google Scholar]
- Mascarenhas, W.J.; Akay, H.U.; Pikal, M.J. A Computational Model for Finite Element Analysis of the Freeze-Drying Process. Comput. Methods Appl. Mech. Eng. 1997, 148, 105–124. [Google Scholar] [CrossRef]
- Scutella, B.; Plana-Fattori, A.; Passot, S.; Bourles, E.; Fonseca, F.; Flick, D.; Trelea, I.C. 3D Mathematical Modelling to Understand a Typical Heat Transfer Observed in Vial Freeze Drying. Appl. Therm. Eng. 2017, 126, 226–236. [Google Scholar] [CrossRef]
- Srinivasan, G.; Muneeshwaran, M.; Raja, B. Numerical Investigation of Heat and Mass Transfer Behavior of Freeze Drying of Milk in Vial. Heat Mass Transf. 2019, 55, 2073–2081. [Google Scholar] [CrossRef]
- Vilas, C.; Alonso, A.; Balsa-Canto, E.; López-Quiroga, E.; Trelea, I.C. Model-Based Real-Time Operation of the Freeze-Drying Process. Processes 2020, 8, 325. [Google Scholar] [CrossRef]
- Levin, P.; Buchholz, M.; Meunier, V.; Kessler, U.; Palzer, S.; Heinrich, S. Comparison of Knudsen Diffusion and the Dusty Gas Approach for the Modeling of the Freeze-Drying Process of Bulk Food Products. Processes 2022, 10, 548. [Google Scholar] [CrossRef]
- Shao, J.; Jiao, F.; Nie, L.; Wang, Y.; Du, Y.; Liu, Z. Study on Sublimation Drying of Carrot and Simulation by Using Cellular Automata. Processes 2023, 11, 2507. [Google Scholar] [CrossRef]
- Chen, B.-L.; Jang, J.-H.; Amani, M.; Yan, W.-M. Numerical and Experimental Study on the Heat and Mass Transfer of Kiwifruit during Vacuum Freeze-Drying Process. Alex. Eng. J. 2023, 73, 427–442. [Google Scholar] [CrossRef]
- Zhang, H.; Zhang, J.; He, L. Effects of the Sample’s Porous Structure on the Process of Vacuum Freeze Drying. In Proceedings of the 2010 4th International Conference on Bioinformatics and Biomedical Engineering, Chengdu, China, 18–20 June 2010. [Google Scholar] [CrossRef]
- Scutella, B.; Passot, S.; Bourles, E.; Fonseca, F.; Trelea, I.C. How Vial Geometry Influences Heat Transfer and Product Temperature during Freeze Drying. J. Pharm. Sci. 2016, 106, 770–778. [Google Scholar] [CrossRef]
- Altybay, A.; Ruzhansky, M.; Tokmagambetov, N. A parallel hybrid implementation of the 2D acoustic wave equation. Int. J. Nonlinear Sci. Numer. Simul. 2020, 21, 821–827. [Google Scholar] [CrossRef]
- Altybay, A.; Tokmagambetov, N. Numerical simulation and parallel computing of acoustic wave equation in isotropic heterogeneous media. CMES Comput. Model. Eng. Sci. 2024, 141, 1867–1881. [Google Scholar] [CrossRef]
- Altybay, A.; Darkenbayev, D.; Mekebayev, N. Parallel numerical simulation of the 2D acoustic wave equation. Int. J. Electr. Comput. Eng. (IJECE) 2024, 14, 6519–6525. [Google Scholar] [CrossRef]
- Experimental Setup. Available online: http://www.yuxiang17.com/productshow_161.html (accessed on 20 November 2024).
- Experimental Data. Available online: https://github.com/Arshynbek/Freeze-drying- (accessed on 20 November 2024).
- El-Maghlany, W.M.; Bedir, A.E.; Elhelw, M.; Attia, A. Freeze-Drying Modeling via Multi-Phase Porous Media Transport Model. Int. J. Therm. Sci. 2019, 135, 509–522. [Google Scholar] [CrossRef]
- Wang, W.; Hu, D.; Pan, Y.; Chen, G. Numerical Investigation on Freeze-Drying of Aqueous Material Frozen with Pre-Built Pores. Chin. J. Chem. Eng. 2016, 24, 116–125. [Google Scholar] [CrossRef]
- Nam, J.H.; Song, C.S. Numerical Simulation of Conjugate Heat and Mass Transfer during Multi-Dimensional Freeze Drying of Slab-Shaped Food Products. Int. J. Heat Mass Transf. 2007, 50, 4891–4900. [Google Scholar] [CrossRef]
- Warning, A.D.; Arquiza, J.M.R.; Datta, A.K. A Multiphase Porous Medium Transport Model with Distributed Sublimation Front to Simulate Vacuum Freeze Drying. Food Bioprod. Process. 2015, 94, 637–648. [Google Scholar] [CrossRef]
- Lopez-Quiroga, E.; Antelo, L.T.; Alonso, A.A. Time-Scale Modeling and Optimal Control of Freeze-Drying. J. Food Eng. 2012, 111, 655–666. [Google Scholar] [CrossRef]
Disclaimer/Publisher’s Note: The statements, opinions and data contained in all publications are solely those of the individual author(s) and contributor(s) and not of MDPI and/or the editor(s). MDPI and/or the editor(s) disclaim responsibility for any injury to people or property resulting from any ideas, methods, instructions or products referred to in the content. |
© 2025 by the authors. Licensee MDPI, Basel, Switzerland. This article is an open access article distributed under the terms and conditions of the Creative Commons Attribution (CC BY) license (https://creativecommons.org/licenses/by/4.0/).