Article

Performance of CO2 Adsorption on Modified Activated Carbons Derived from Okara Powder Waste: Impacts of Ammonia Impregnation

1
School of Chemistry and Life Sciences, Hanoi University of Science and Technology, No. 1 Dai Co Viet, Hai Ba Trung, Hanoi 100000, Vietnam
2
Institute of Sustainability for Chemicals, Energy, and Environment (ISCE2, A*STAR), 1 Pesek Road, Jurong Island, Singapore 627833, Singapore
*
Author to whom correspondence should be addressed.
Processes 2024, 12(9), 2024; https://doi.org/10.3390/pr12092024
Submission received: 14 August 2024 / Revised: 11 September 2024 / Accepted: 18 September 2024 / Published: 20 September 2024
(This article belongs to the Special Issue Application of Biochar in Environmental Research)

Abstract

:
The activated carbons (ACs) derived from okara powder waste with high surface areas were modified with ammonia aqueous solution impregnation in an autoclave to enhance their CO2 adsorption properties. The impregnated ACs were characterized, where the chemical composition and properties of the ACs were analyzed by SEM-EDX and FTIR. Activated carbons were functionalized with ammonia aqueous solution (25%) through a hydrothermal process within 24, 48, and 72 h. The adsorption performance of CO2 onto carbon samples was experimentally evaluated through a TPD CO2 measurement. FTIR spectra confirm the N-containing in N-modified activated carbons and the presence of the –C=O stretch and N-H groups. CO2 uptakes of activated carbons are 0.24; 1.78; 2.24; and 1.26 mmol/g, which are relatively comparable with those of activated carbons studied in the literature.

1. Introduction

Carbon dioxide (CO2) emissions are causing anthropogenic climate change and global warming, which is a challenge for human beings in this century and needs to be addressed [1,2,3,4,5]. Among technological approaches, adsorption technologies by using solid adsorbents, which include natural calcium materials [6], metal–organic framework (MOF) materials, zeolites, and activated carbons [7,8], have been considered promising solutions to mitigate CO2. These adsorption approaches are promising due to their low energy requirement, simplicity, cost-effectiveness, and scalability [9,10]. Of the solid adsorbents, activated carbons synthesized from biomass with high surface areas are gaining attention for their low cost, high surface area, high porosity, and large-scale application potentials [11,12].
Basic groups (amine groups) are known to enhance the structural, alkalinity, and chemical properties and adsorption efficiency [9,10,13] of activated carbons [14]. Amine groups can be increased onto the activated carbons by wet [14] or dry impregnation methods, depending on whether aqueous or gaseous NH3 was injected into activated carbons at different temperatures [10,15]. Thermal modification using NH3 is normally known as amination, and the temperature ranges are normally from 200 °C to 800 °C [15]. Through the heating process, NH3 disbands to various free radicals such as NH2, NH, atomic H, and N. These free radicals will then react with carbons to produce N-functionalities such as -CN, pyridinic, and pyrrolic [15]. When ammonia impregnation is applied, it is expected that the amount of incorporated N will be improved on the activated carbons [16]; this leads to enhancing the CO2 adsorption capacity [9,10,13] since CO2 is acidic. For instance, Zhang [9] used microwave irradiation under N2 atmosphere and NH4OH impregnation to increase the CO2 adsorption up to 3.75 mmol/g at 1 atm and 20 °C [9]. Ava Heidari [13] used ammonia solution with heat modification to achieve a CO2 adsorption capacity of up to 3.22 mmol/g at 1 bar and 30 °C [13]. However, impregnating activated carbons into a basic solution or through the wet impregnation process might result in blocking pores in the structures of activated carbons [16] and lead to adsorption decrease [9].
Okara powder waste, often considered food processing waste [17] and discarded or underutilized during soy bean production processes, represents an environmentally friendly feedstock for activated carbon production by fast pyrolysis processes [18,19]. In addition, okara powder waste is abundant, easy to collect, and economical. In mass composition, okara powder waste mainly consists of 45.73% C; 52.43% O; and 1.74% K [18]. Moreover, the hydrothermal process has been known to be a simple, inexpensive chemical thermal method [20] used to improve the adsorption properties of activated carbon [19,21,22]. This research aims to evaluate the impacts of ammonia aqueous solution impregnation through hydrothermal treatment at 200 °C on relatively high-surface-area okara powder waste activated carbons toward CO2 adsorption capacity. The textural structures of the modified ACs derived from okara powder waste were characterized. The functional groups and composition of the elements of the ACs were further analyzed by Fourier transform infrared spectroscopy (FTIR). The adsorption of CO2 on the original and modified ACs was measured, discussed, and reported in this study. By investigating this bio-waste material, the research not only addresses sustainability issues but also contributes to waste valorization [23].

2. Materials and Methods

2.1. Materials and Instruments

Original activated carbons were prepared from pyrolysis processes with dry KOH (Xilong, China) activation. The high surface area (594 m2/g) [18] was obtained from a two-step carbonization and activation method. First, okara powder waste was sun-dried and oven-dried before it went through a vertical and horizontal pyrolysis setup (Lenton thermal, Hope Valley, S33 6RB, UK) in a N2 flow of 1.8 L/min to obtain the biochar. Pyrolysis temperature is set at 550 °C; heating rate 3 °C/min; residence time 1 h; and a N2 flow of 1.8 L/min. After that, the biochar was impregnated with dry KOH and went through washing and re-pyrolysis steps with the pyrolysis temperature set at 550 °C; heating rate 3 °C/min; and residence time 1 h before testing their BET surface area values. These steps were described in detail in a previous study [18].

2.2. Modification of ACs

The original activated carbons have surface areas of 594 m2/g and were divided into 4 samples where sample 1 (denoted S1-original AC) remains the original activated carbon with high surface areas. Before the surface modification, the AC was dried in an oven (Nabertherm, Germany) at 100 °C for 24 h and kept in a zip bag. Sample 2 (denoted sample S2−AC−NH4OH−24h) was impregnated with NH3 solution 25% (Xilong, China) in an autoclave and kept in an oven (Nabertherm, 28865 Lilienthal, Germany) at 200 °C, a common hydrothermal temperature, for 24 h. A 75 mL ammonia aqueous solution (25%, Xilong, China) was added to 0.5 g of the original AC; the heating rate was 3 °C/min. Sample 3 (denoted as S3−AC−NH4OH−48 h) and sample 4 (denoted as S4−AC−NH4OH−72h) were activated carbons with NH3 solution 25% (Xilong, China) impregnated in an oven (Nabertherm, 28865 Lilienthal, Germany) at 200 °C for 48 and 72 h, respectively.

2.3. SEM-EDX

A Jeol JCM-7000 microscope (Tokyo, Japan) was used to perform the scanning electron microscopy (SEM) images of the samples. SEM images were captured at 3000 magnifications. EDX analyses were examined with a 10 kV acceleration voltage by the same instrument.

2.4. Fourier Transform Infrared Spectroscopy (FTIR)

The surface FTIR spectra were taken with a Thermal Scientific–NICONET iS5050 FTIR (Alvarado, TX, USA) instrument. The samples were dried in a vacuum desiccator (Jeio, Korea) before being mixed with KBr powder and pressed with a Specac hydraulic press (Kent, England). Data acquisition was obtained automatically from the standard software package installed in a connected computer. The samples were run after a pure KBr sample known as a baseline result. The spectrometer collected 1800 spectra in the range of 400–4000 cm−1, with a resolution of 2 cm−1.

2.5. Temperature Programmed Desorption of CO2 on ACs

TPD is a useful technique used to characterize adsorbed species to find acidic and basic sites on the surface, chemically bonded surface, or organic compound adsorbed on the surface of the sample [24,25]. TPD coupled to the mass spectrometry (MS) instrument was provided by Micrometrics, AUTOCHEM–2950 (Micromeritics Instrument Corp., Norcross, GA, USA). The experiments were carried out in a TPD cell placed into a stainless steel, cylindrical heating block. A total of 100 mg of the sample was placed in a quartz reactor. The degassing process takes place within 15 min with helium (99.99%) flow at 300 °C; the heating rate was 3 °C/min; and then the sample was cooled to 50 °C s for CO2 chemisorption in 10% CO2/helium. Then, the TPD-CO2 temperature increased up to 500 °C; the heating rate was 10 °C/min; and then this temperature was maintained at 30 min for desorption [24,26,27].

2.6. Thermogravimetric Analysis/Mass Spectrometry (TGA-MS)

TG-MS is a thermal characterization technique by which the sample mass is monitored as a function of temperature or time. A Netzsch STA 449 F5 Jupiter instrument (Netzsch, Germany) is used in our experiments of this work. N2 is used at a flow rate of 50 mL/min in the first temperature range of room temperature 50 °C and 20 mL/min in the temperature range of 50 °C to 800 °C [18,28].

3. Results and Discussions

3.1. Impact on Morphology and Composition of Activated Carbons

SEM photographs of the original activated carbon and modified samples are shown in Figure 1. It is observed from the figure that the external surface of all the activated carbon samples shows some pores. Visually, the carbon samples present similar structures [29,30].
From Table 1, we can see that there is no N in the raw AC sample. For samples S2, S3, and S4, with an increase in hydrothermal time, the N concentrations in the mass of those samples are 4.34; 6.05; and 1.58 (%), while the N concentration in the atom is 4.17; 5.70; and 1.16, respectively. The C/N atom ratio clearly shows that the AC modified with NH4OH for 48 h (S3) possesses the highest N content. The N content in hydrothermal processes might be changed and influenced by hydrothermal temperature and time [31,32]. Interestingly, N decreases to 1.58% in mass and K increases significantly to 15.07% in mass in sample S4. The decrease in the N concentration in sample S4 (when hydrothermal duration is 72 h) may be due to the NH3 desorption from pores in this sample in a too-long heating treatment process [31]. The N content also decreases, probably due to inorganic N in AC being transferred into the aqueous product (process water) during the hydrothermal process of 72 h [33]. The increase in the K content in sample S4 might be because the available K was adsorbed on the surface of the hydrochar by physical adsorption, causing the formation of more stable K [33]. Thus, samples S2 and S3 with a reasonable heating time (24 h and 48 h) may have a better CO2 adsorption ability due to higher N content. Of these four samples, Cl only appears in the original AC; this is possibly because the Cl impurities remain from the washing step using aqueous HCl solutions of the AC preparation steps [18].
The EDX results of sample S2 are illustrated in Figure 2. The result shows that this sample has the highest oxygenated groups compared to other samples (S1, S3, and S4). This sample also contains a Si concentration of 3.23% in mass and 1.55% in atoms, which is relatively high compared to the literature of between 0.09 and 1.21% [18,34].

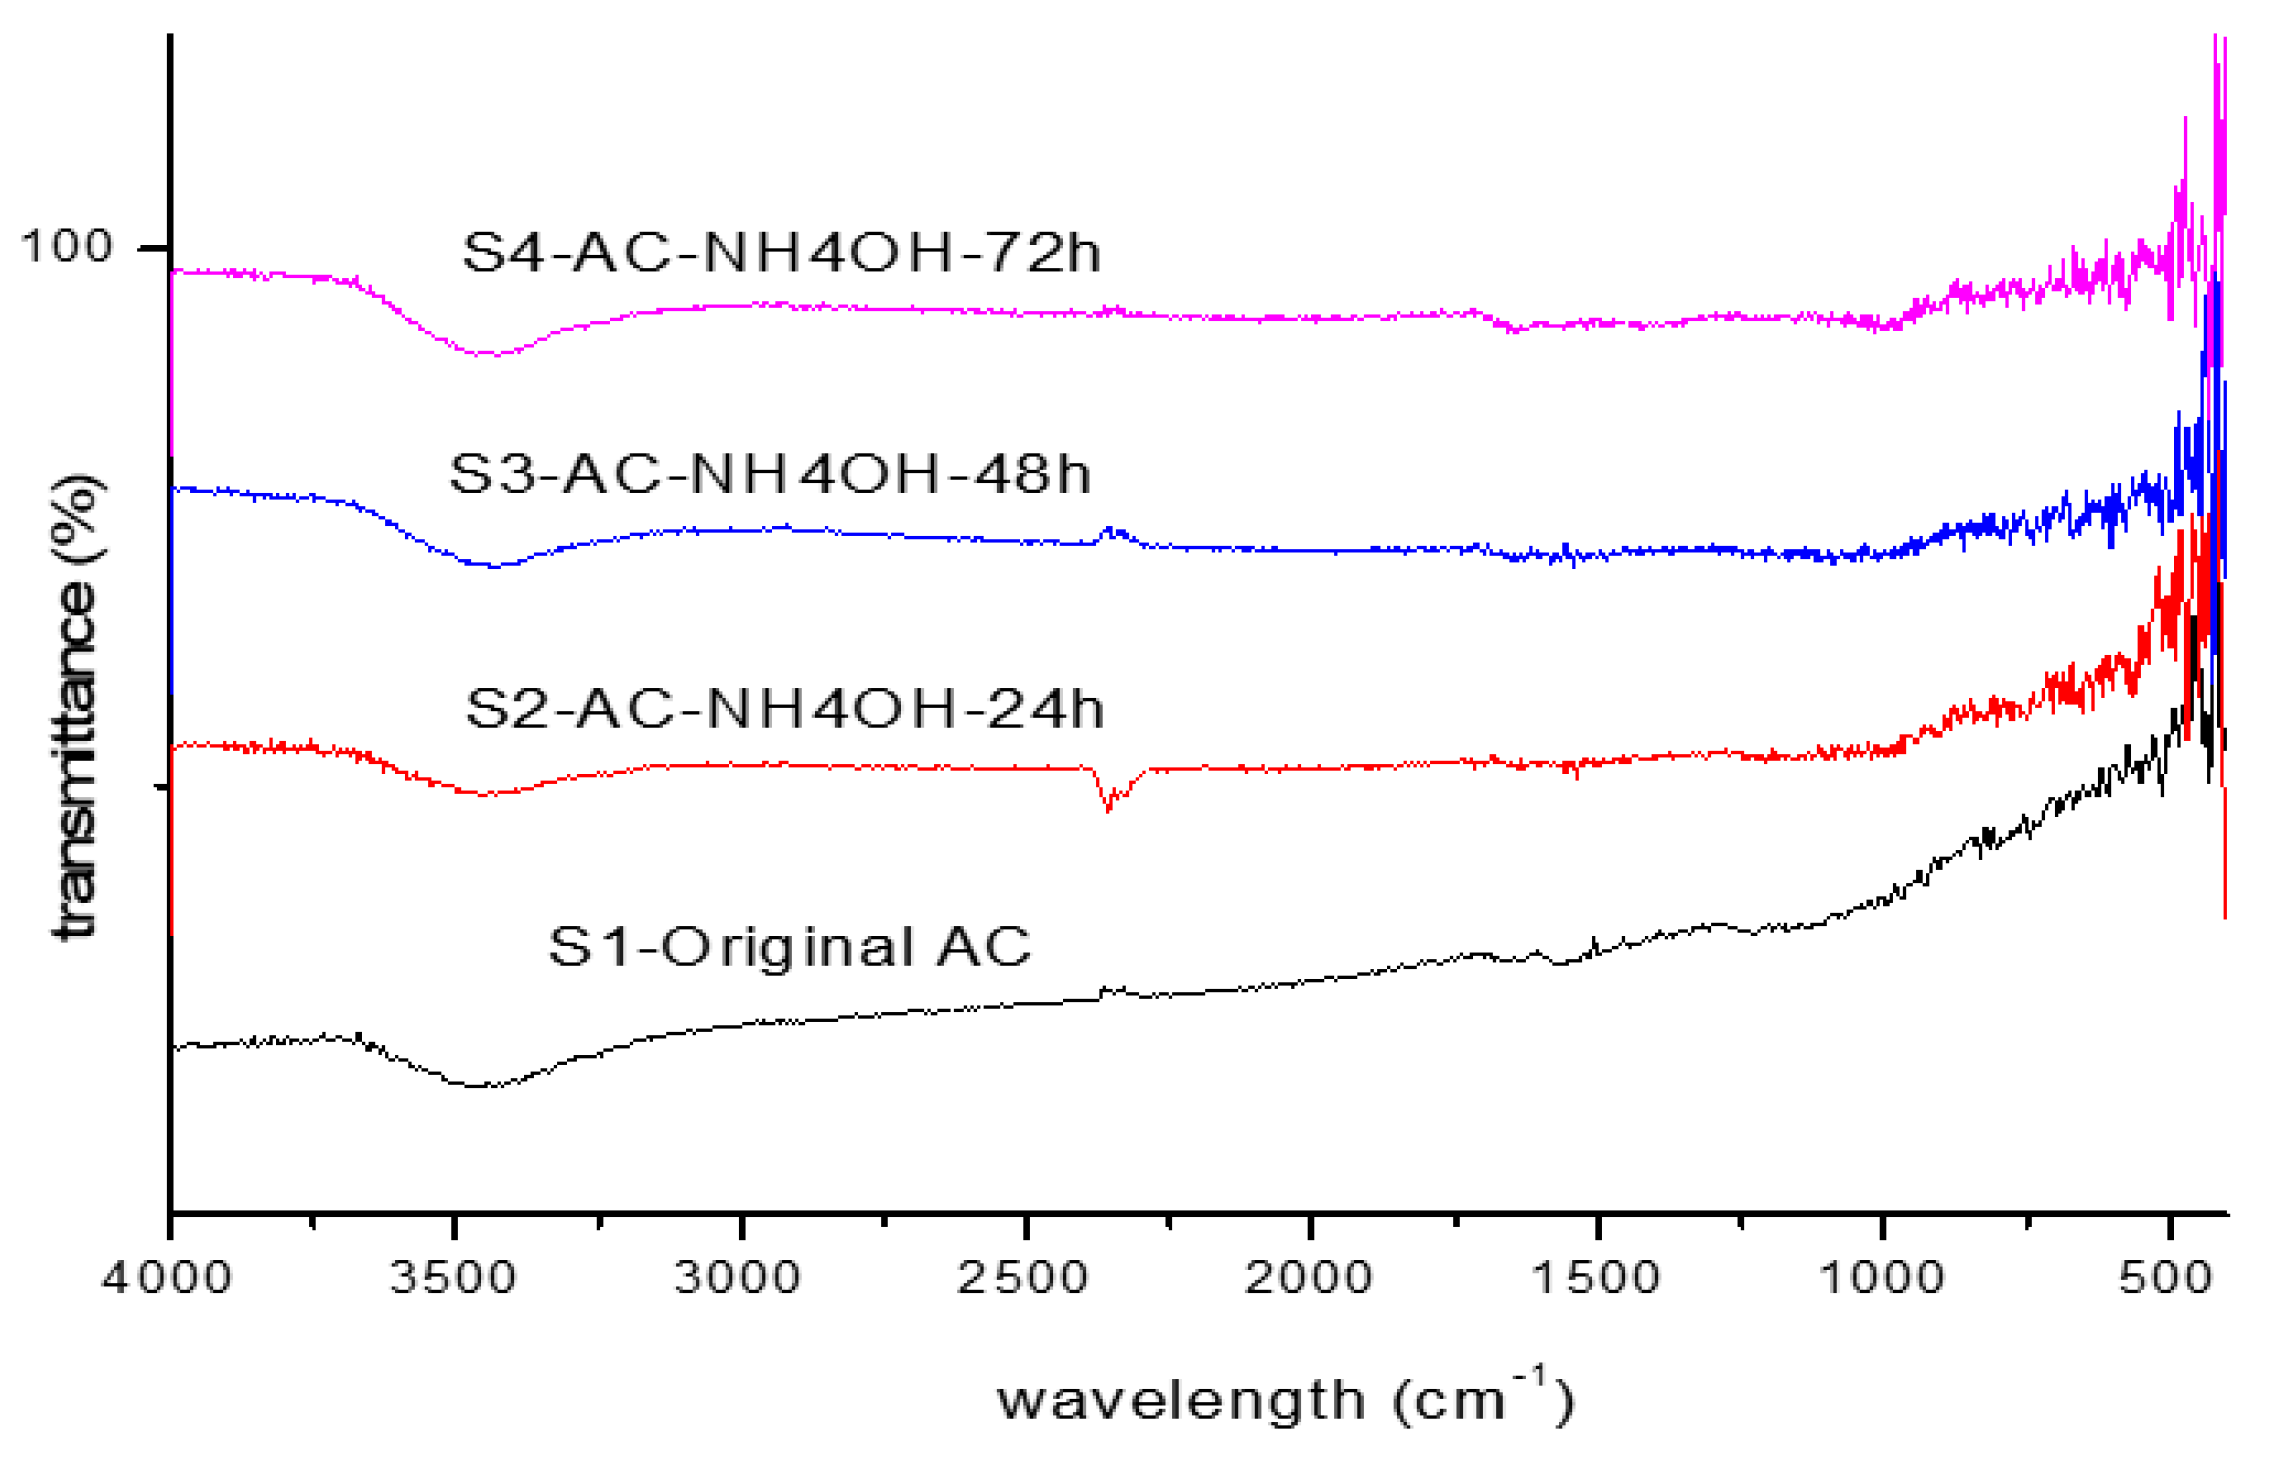
3.2. Impact on Functional Groups of Activated Carbons

Functional groups and complexes inside the samples were analyzed through infrared spectra analysis. The FTIR spectra of these four samples are shown in Figure 3.
Visually, the FTIR analysis results of the four investigated samples show quite similar spectra. Around the wavelength of 2358 cm−1, corresponding to the –C=O stretch [35,36], a small peak appears at samples S1-original AC, S3−AC−NH4OH-24, and S4-AC−NH4OH−72h. The FTIR spectra confirm the presence of N-containing groups in ammonia-modified activated carbons (samples S2−AC−NH4OH−24h, S3−AC−NH4OH-24, and S4−AC−NH4OH−72h). The characteristic band at wavelengths of 3432 cm−1 and 3442 cm−1 of both the treated and untreated AC spectra shown could be due to the –OH asymmetric stretching vibration or the presence of N−H groups [18,37,38].
The process of CO2 adsorption consists of physical and chemical sorption. The physical sorption mechanism happens when the CO2 molecule transports to the active sites in the pores of ACs. In contrast, chemisorption happens when the CO2 molecule reacts or interacts with various surface functional groups inside the ACs [7,39]. The presence of the above-mentioned functional groups confirms the chemisorption mechanism inside the AC samples.

3.3. Impact on CO2 Adsorption Ability

CO2 adsorption experiments through the break-through apparatus were carried out with samples S1–S4. The CO2 uptake capacity of these samples was compared with previous studies, as illustrated in Table 2.
In this work, CO2 uptake capacity was calculated from the desorbed CO2 amount in the TPD CO2 measurement. The results exhibit a strong difference between the S1-original AC sample compared with S2−AC−NH4OH−24h and S3−AC−NH4OH−48h and with the cited literature research. Specifically, S1−Original AC has much lower CO2 uptake compared to S2−AC−NH4OH−24h and S3−AC−NH4OH−48h, as shown in Figure 4, since these samples have been modified with NH groups.
As the content of N is highest in the S3−AC−NH4OH−48h sample, as described in the EDX results, this sample also has the highest CO2 uptake, which is a reasonable value compared to the CO2 uptake reported by other researchers in the literature. Thus, it can be concluded that the treatment with NH4OH for 48h is optimal among these four tests for the modification of ACs to adsorb CO2.
The BJH desorption dA/dlog(w) pore area plot of sample S1−original AC is shown in Figure 5. The result of Figure 5 indicates that the S1-original AC contains several pores, and most of the pores fall into the size range of 23–60 Å. These pores are because of the interparticle spaces, which presumably occur from the release of gas during the pyrolysis process of the okara powder waste [47].
The isotherm linear plot of sample S1−original AC is provided in Figure 6. It was observed that the N2 adsorption measured at a temperature of −196 °C increased in the case of sample S1−original AC. A high N2 adsorption at a low relative pressure (under 0.1 P/Po) indicates a high volume of micropores with a thin pore size distribution. The capillary condensation or multilayer adsorption from the gas phase into the mesopores occurs in the range of relative pressure P/Po = 0.45–1. This indicates the presence of mesopores in this sample [48].
Looking at Table 1, we find that the commercial ACs, carrot peels peanut shell char, etc., have a slightly better CO2 uptake compared to our synthesized ACs. From our best estimation, our estimated cost of AC production is approximately 0.55 USD/kg. This estimated cost includes the raw okara powder waste, KOH, N2, and electricity consumption only, but this estimated cost excludes the equipment and labor costs. According to our best knowledge and estimation, the production cost is much lower than most of the ACs in the market and also lower than ACs synthesized from other biomass precursors [49,50], which were over 1 USD/kg. Therefore, okara powder waste can be considered a cost-effective and promising feedstock source from a scale-up and eco-environmental point of view.

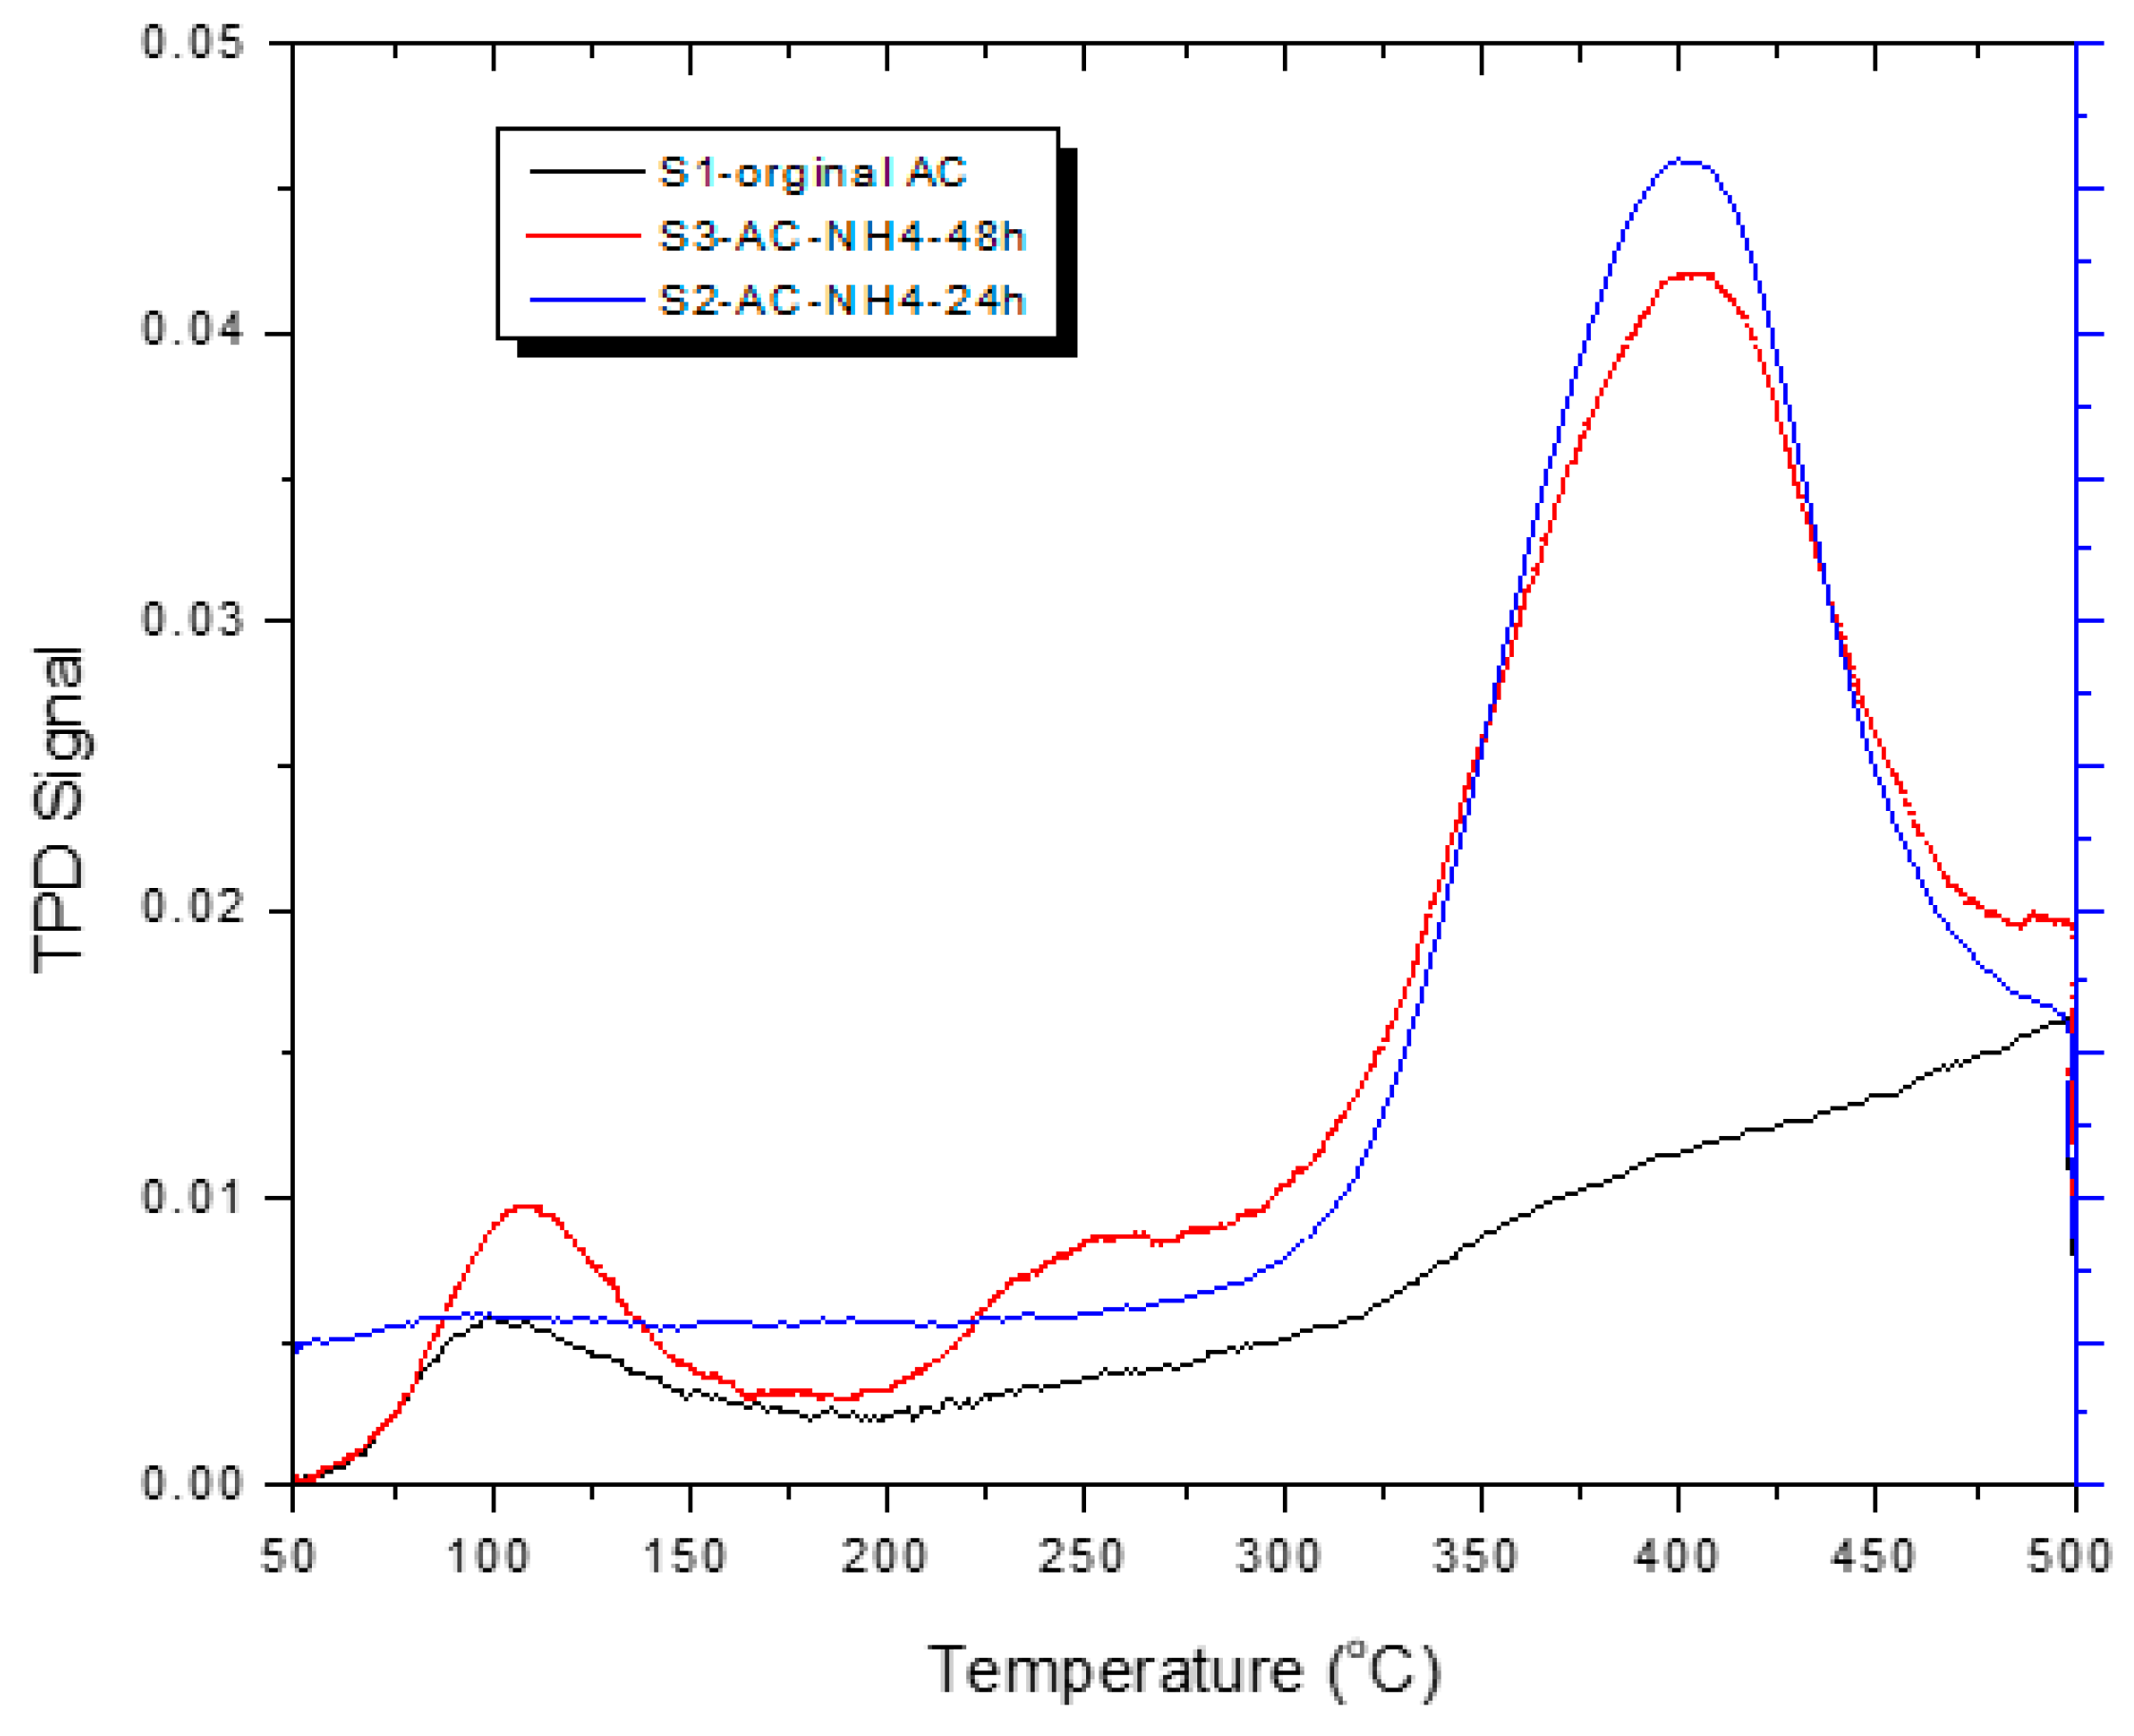
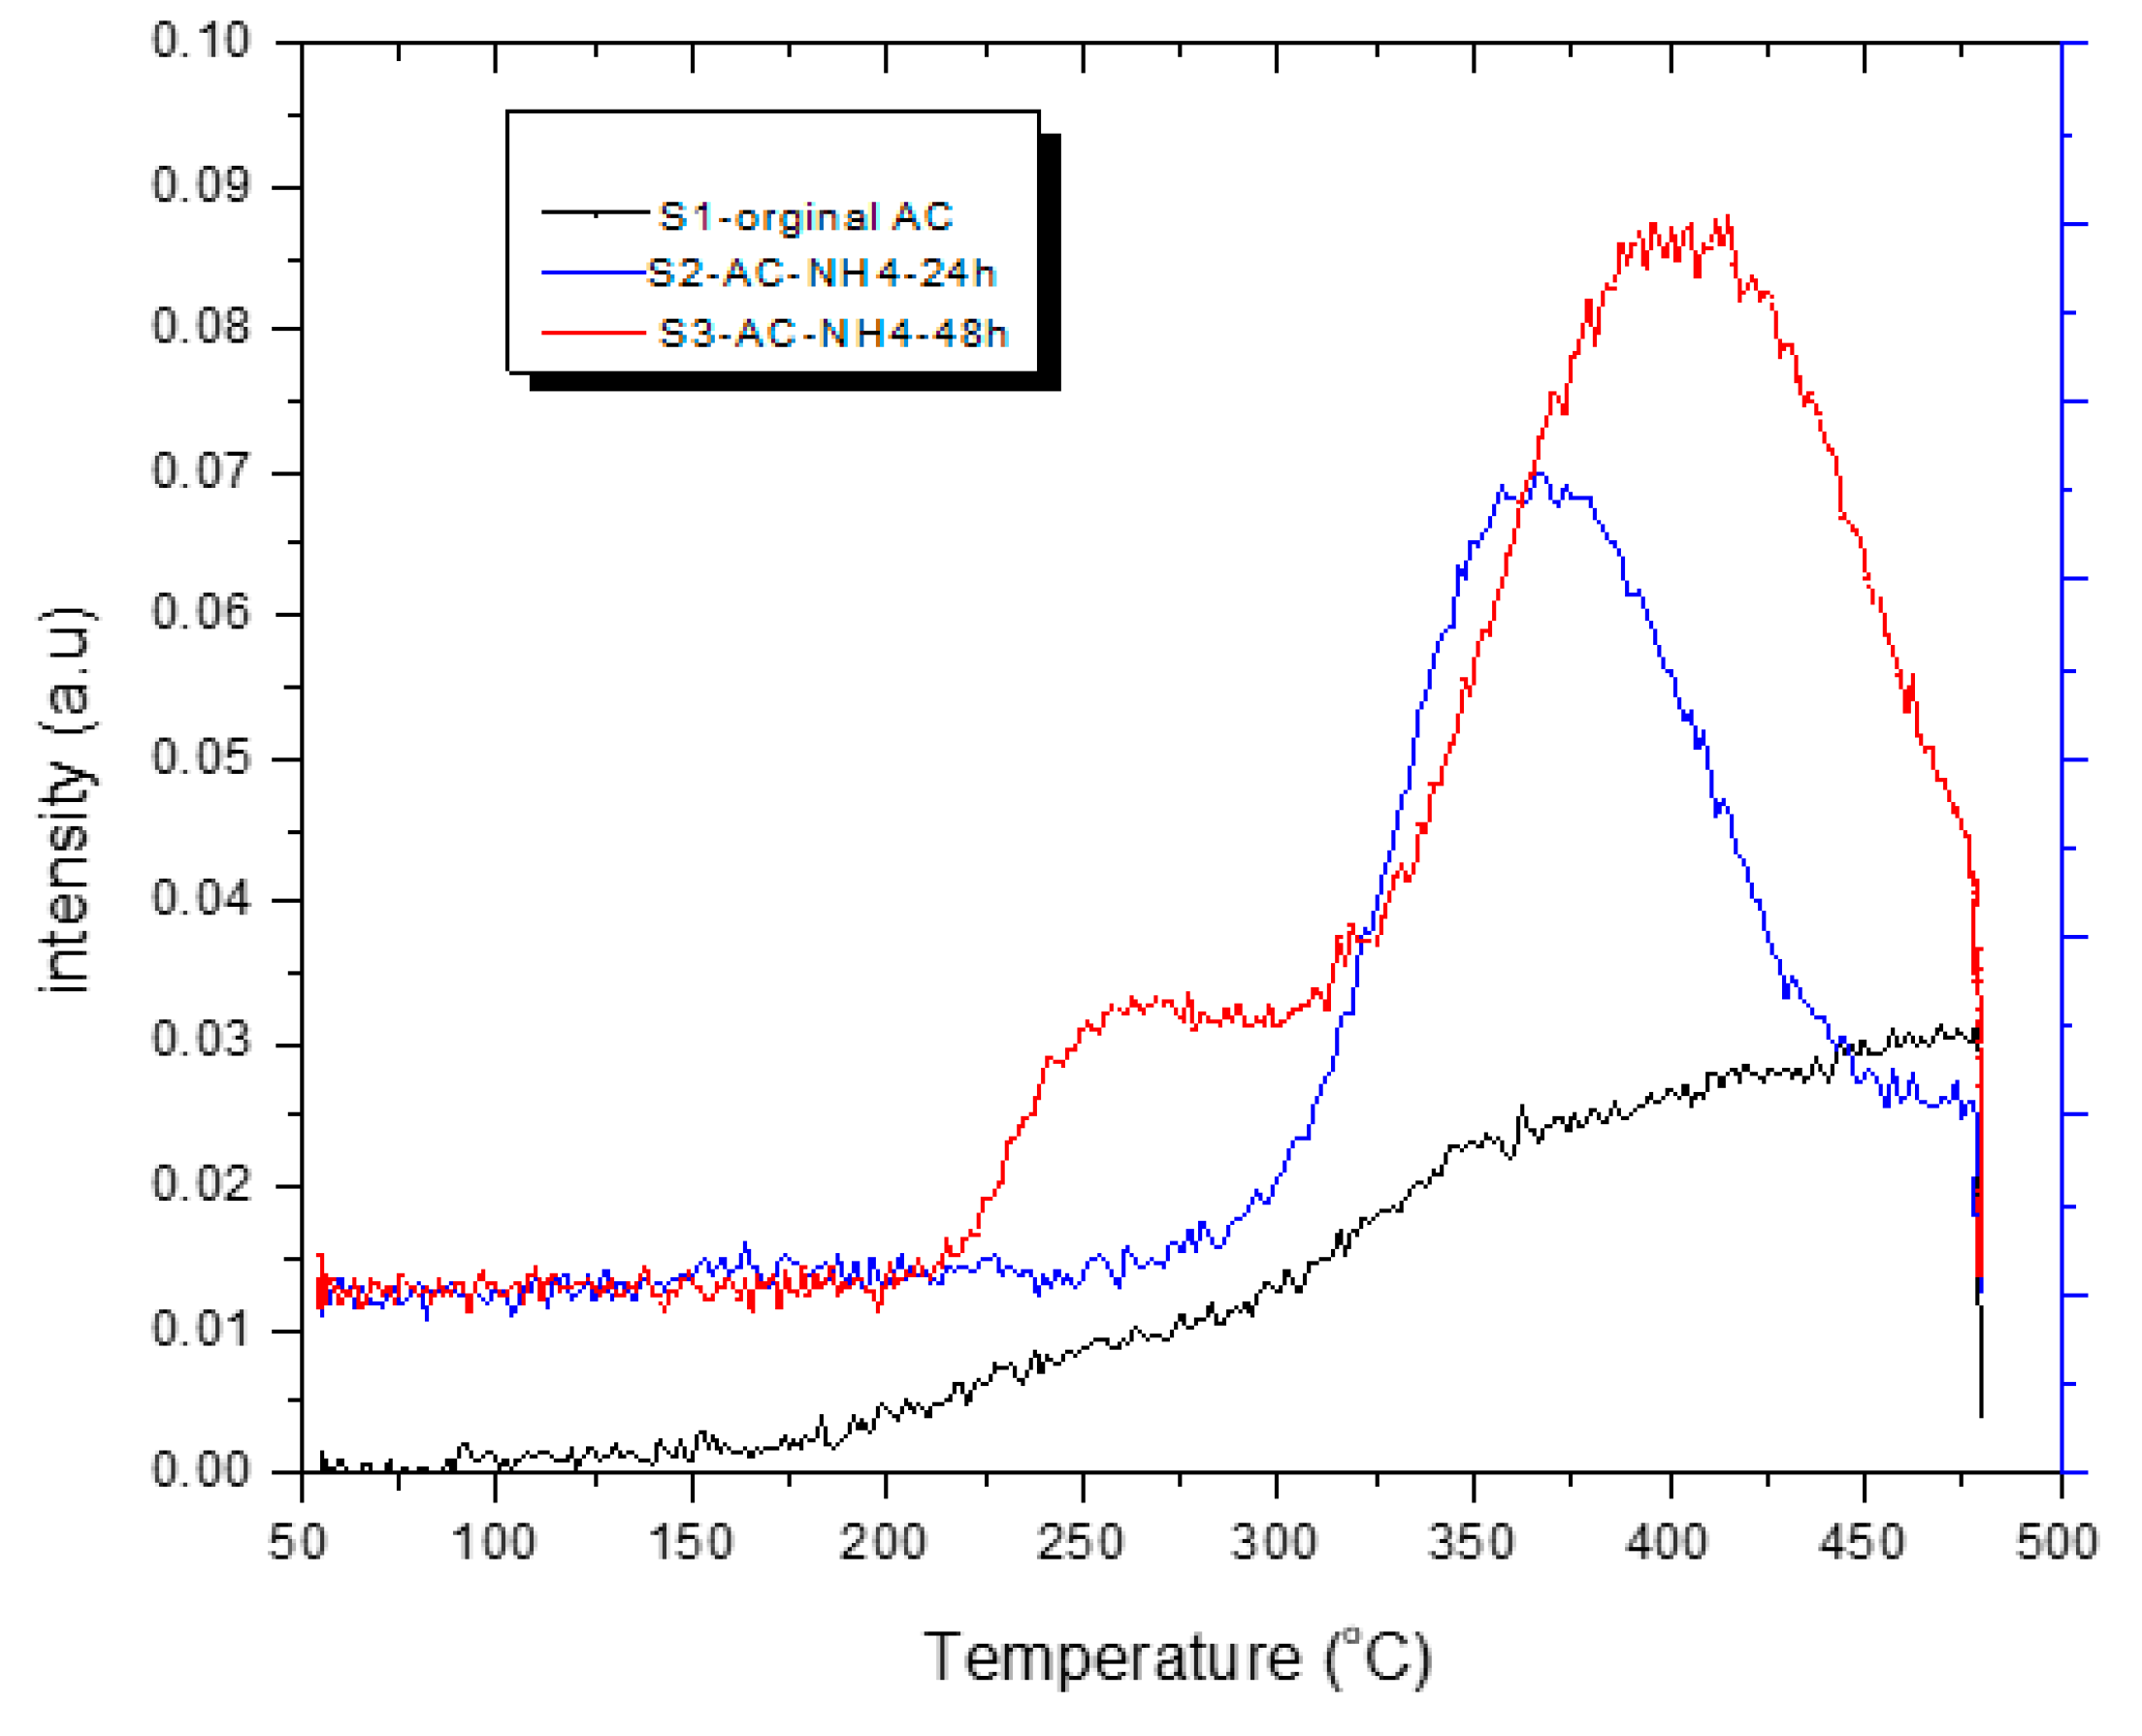
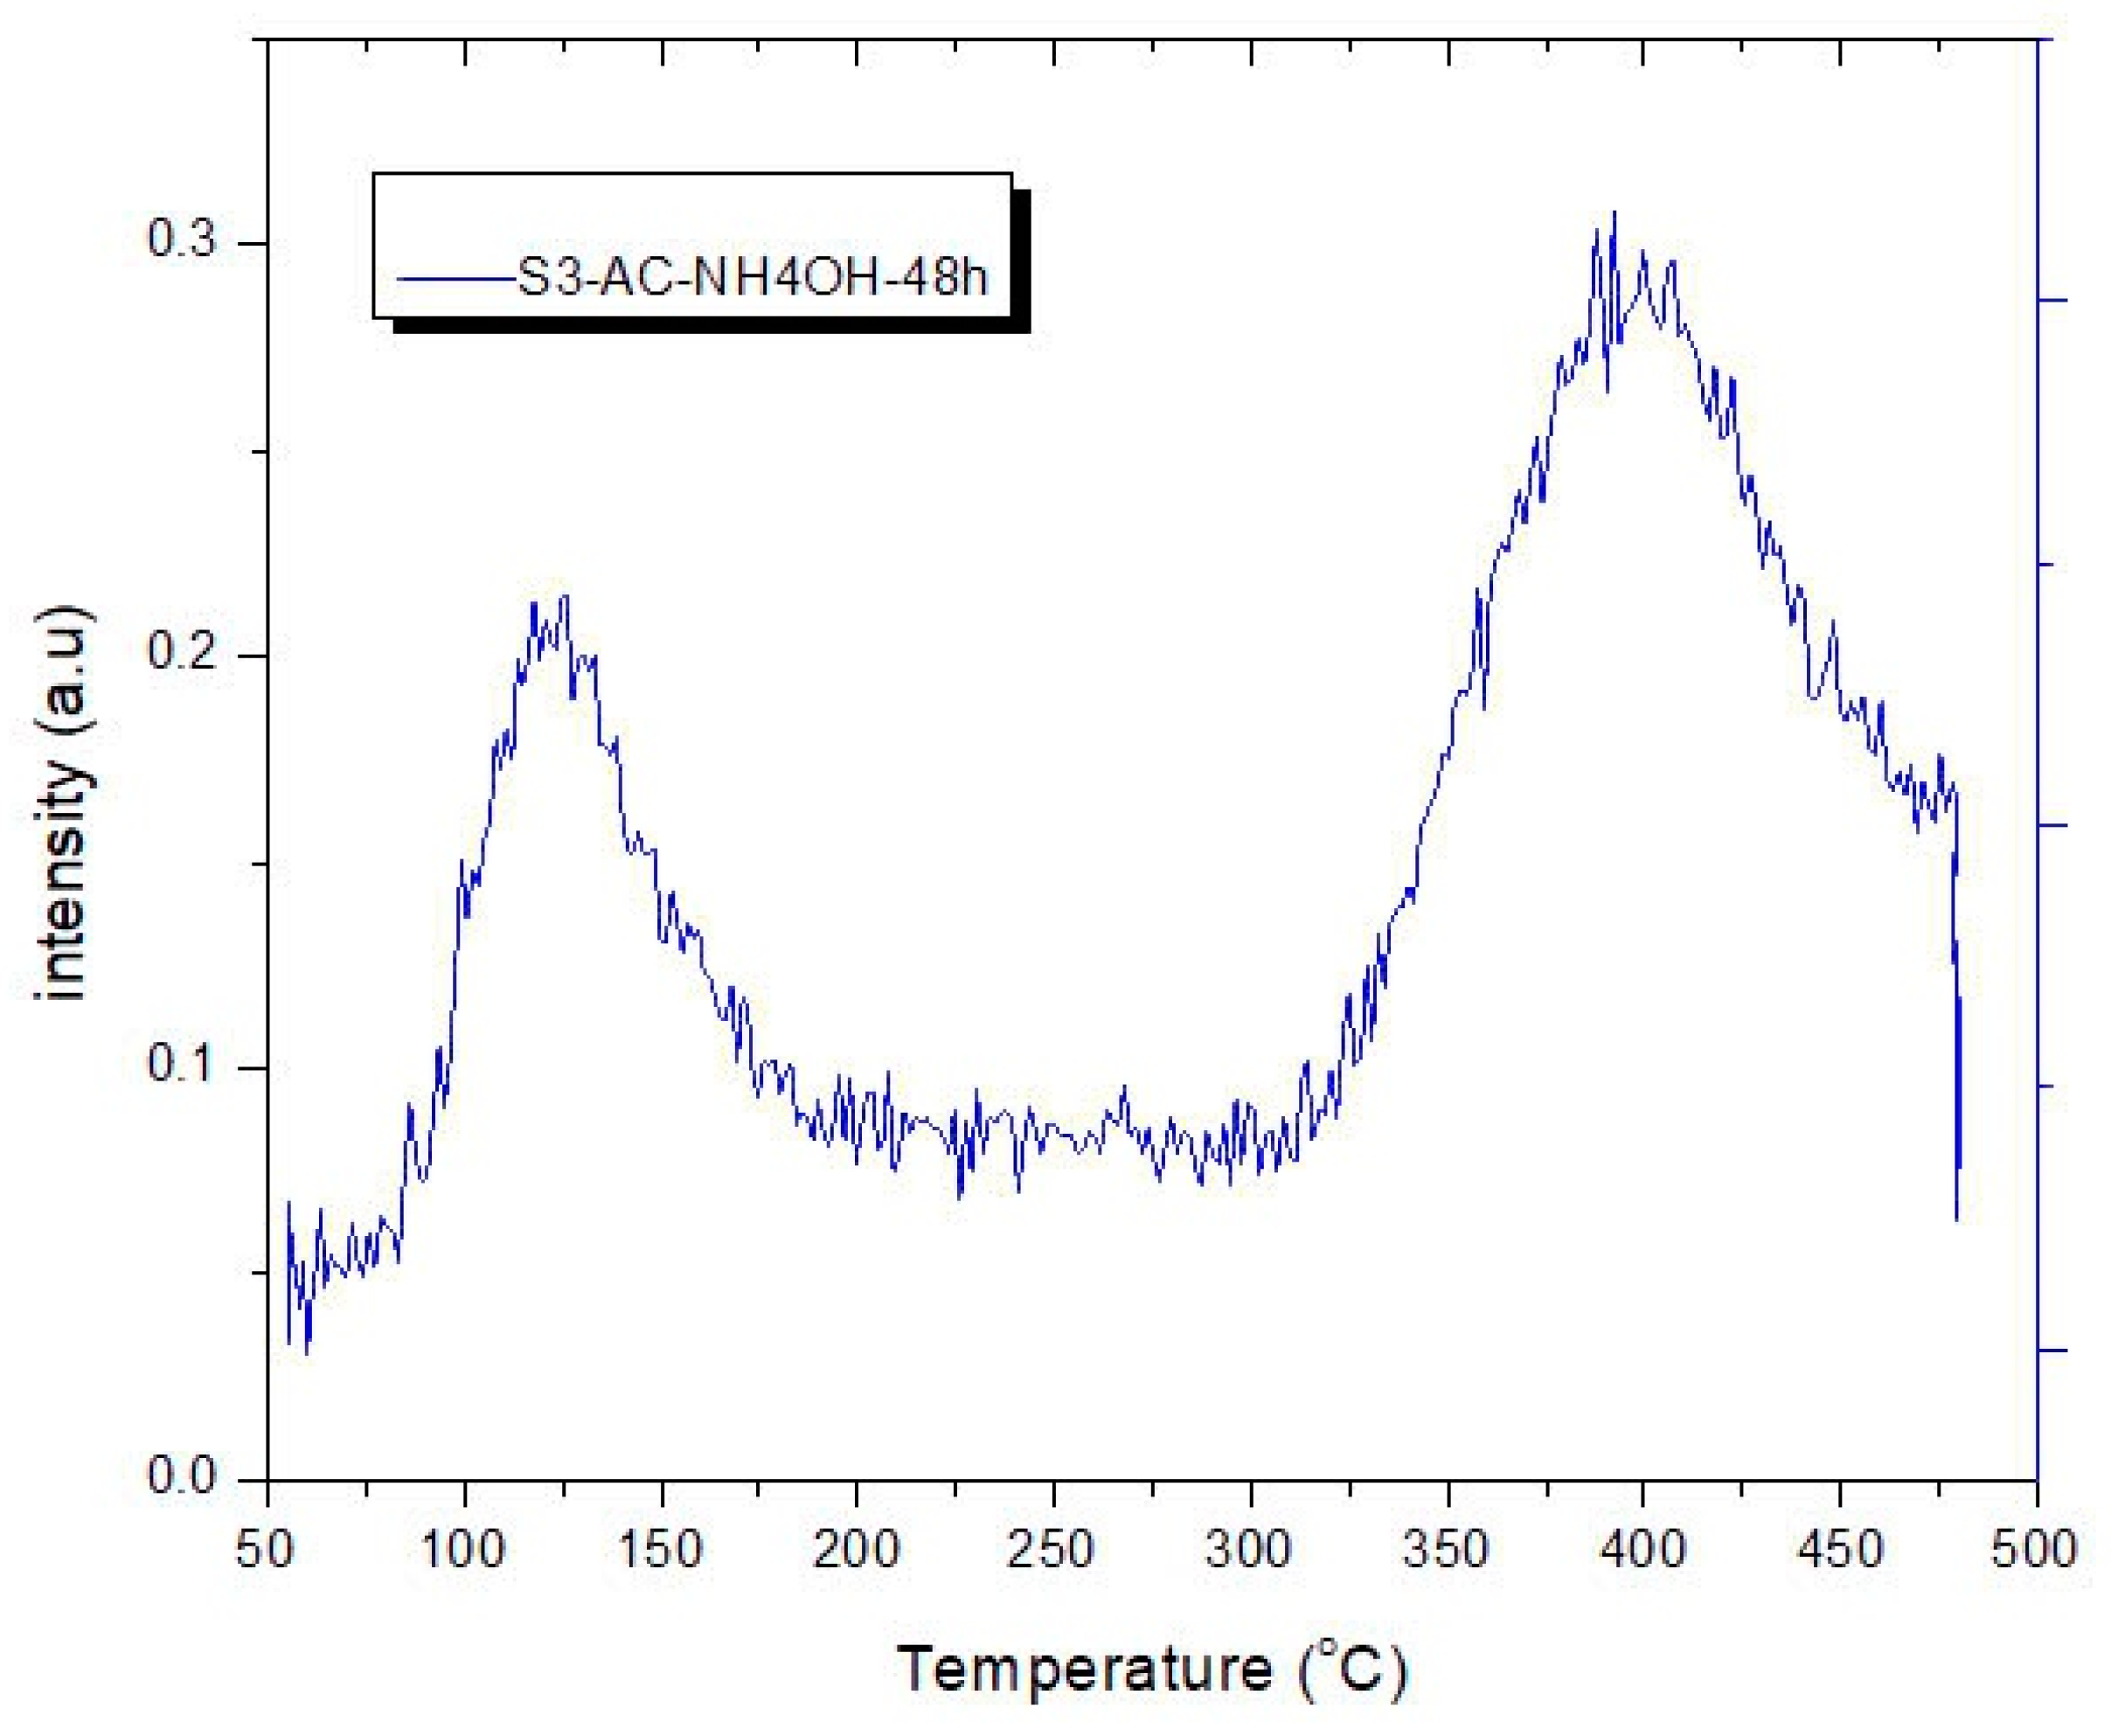
3.4. CO2 Temperature-Programmed Desorption (CO2-TPD) Experimental Results

The CO2-TPD experimental results are shown in Figure 7. From the TPD profiles, the S1−Original AC has its peak in the low-temperature region (50–180 °C), while S2-AC-NH4OH-24h and S3−AC−NH4OH−48h have their peaks in the high-temperature region (290–500 °C), representing that the original AC only weakly adsorbs CO2, while the modified samples strongly adsorb CO2 so that they release CO2 at high temperatures [51]. Figure 5 shows that when the adsorption temperatures increased, the intensity of the peaks rose, reaching the highest values at 400 °C, which is in good agreement with the literature [52]. The CO2−TPD for sample S1−Original AC implies that as the temperature reached 97 °C, there was a small amount of released CO2. For samples S2−AC−NH4−24h and S3−AC−NH4OH−48h, when the temperature reached 400 °C, there was a significant amount of released CO2, possibly because of the desorption of CO2 and the decomposition of other functional groups inside the samples [30,53,54]. The release of CO2 below 400 °C indicates that there are carboxylic groups presented in the surface of the different activated carbon samples [30].
The developed ACs were kept in a desiccator for regeneration purposes with conditions of room temperature and room pressure. A TPD−CO2 analysis of sample S3−AC−NH4OH−48h was conducted to find out its performance in its second adsorption tests.
The masses of the released CO2 and NH3 were monitored during the TPD CO2 measurement, according to the method described in the literature [53]. The results of mass 44 for CO2 are shown in Figure 8. The changes in mass intensity with temperatures fit quite well with the TPD CO2 profiles in the high-temperature range of the samples, showing the fact that CO2 was released at high temperatures from 220 to 475 °C. The peak in the temperature range of 275 °C to 300 °C of the S3−AC−NH4OH−48h sample can be attributed to the chemical sorption of CO2 on different sites, namely the medium and strong basic sites inside the sample [55].
Additionally, the mass 17 of NH3 of sample S3 was also examined, as shown in Figure 9, to see if NH3 functionalized in AC materials is also released during the increase in temperature. Here, the signals were also observed at low-temperature regions and thus fit with the TPD CO2 profile of the samples. Therefore, the released NH3 contributes to the peaks at low temperatures (50–175 °C) in the TPD CO2 profile of the S3−AC−NH4OH−48h sample. NH3 was also released at high temperatures. Thus, the modification of ACs by NH4OH solution only resulted in a weak bond with AC.

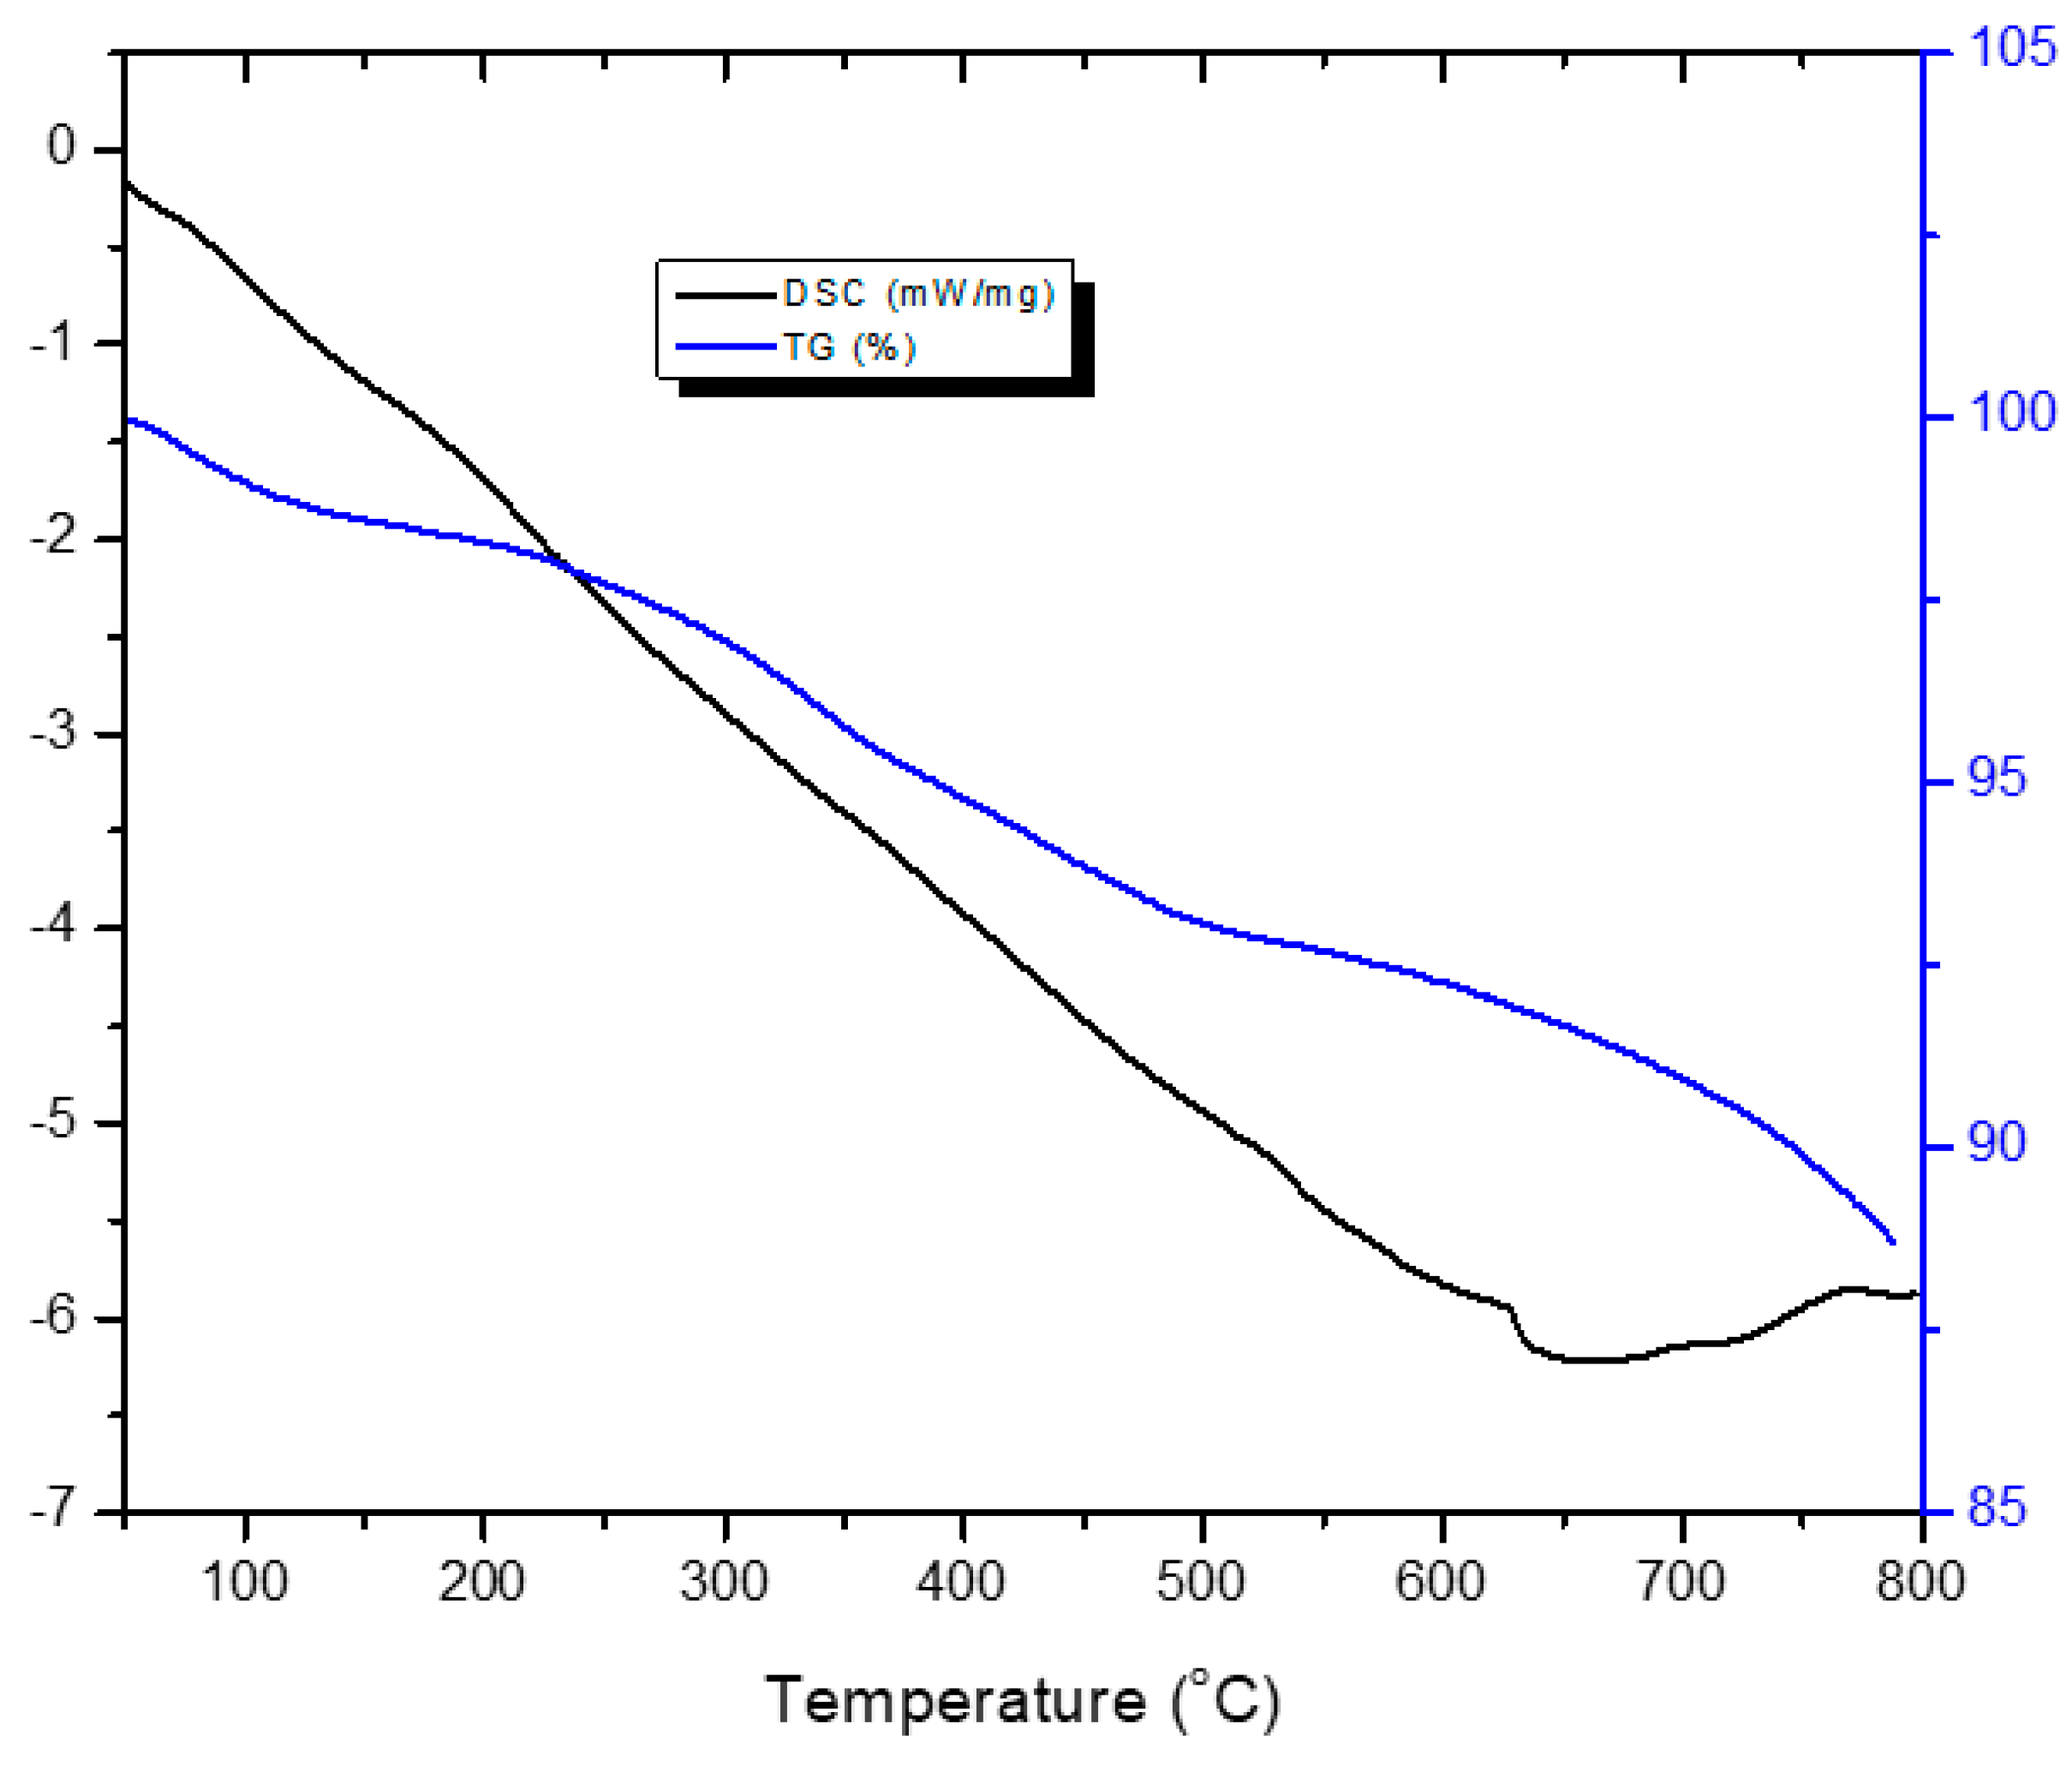
3.5. TG–DSC Analysis

The TGA−DSC profile of sample S3−AC−NH4OH−48h is presented in Figure 10. It can be seen from this figure that the mass of this sample starts decreasing when temperatures are lower than 200 °C (the first stage), then decreases significantly from the temperature range of 200 °C to 600 °C (the second stage), and decreases slightly again when the temperature is from 600 °C to 800 °C (third stage) [18]. The first stage can be known as the drying stage when the aqueous ammonia solution evaporates. The second stage, or carbonization stage, occurs due to the thermal decomposition or degradation of cellulose and hemicellulose inside the AC. The third stage, known as the combustion stage, occurs when the temperature exceeds 600 °C, and the thermogravimetric curve also gradually reduces due to the gradual decomposition of the residues into carbon. Hence, at a temperature of 600 °C, the decomposition of the AC is considered to be completed [18]. The residue mass of this sample is 88.68%.
The DSC profile of sample S3-AC−NH4OH−48h indicates an evident endothermic peak when the temperature reaches 650 °C. This is possibly due to the decomposition of the remaining functional groups inside the AC after the hydrothermal process [18]. No exothermic peak is shown.

4. Conclusions and Outlooks

Activated carbons (ACs) were derived from okara powder waste and activated by KOH for CO2 adsorption. The surface of ACs was impregnated with ammonia aqueous solution using a hydrothermal process at 200 °C to enhance CO2 adsorption. The prepared activated carbon samples were characterized with SEM−EDX and FTIR. Ammonia impregnation improved the morphology of the activated carbons. The amounts of the basic groups on the carbon surfaces increased. The performance of CO2 uptake onto okara-based activated carbons was evaluated at different hydrothermal durations. The amount of CO2 adsorbed onto ACs increased when the hydrothermal and impregnation time increased. The presence of the –C=O stretch and N−H groups was confirmed. CO2 uptakes of four AC samples were 0.24; 1.78; 2.24; and 1.26 mmol/. Impregnation of ammonia aqueous solution increased CO2 uptake. These findings have implications for advancing carbon capture technologies [5], promoting the use of agricultural byproducts [23] and sustainable development [56,57].
Looking forward, several new approaches can be researched to further advance this study. First, investigating a broader range of ammonia impregnation conditions such as dry ammonia impregnation and activation processes could give additional optimizations for CO2 uptake capacity. Additionally, investigating the adsorption isotherm simulation computational modeling might give new insights into the CO2 uptake mechanisms and capacity. Combining ammonia impregnation with other modification strategies, such as doping with additional heteroatoms or integrating advanced material composites, may further enhance CO2 adsorption properties. Expanding the research to various other feedstocks for activated carbon production and comparing their performance may provide a more comprehensive understanding of the material’s adsorption performance.

Author Contributions

Conceptualization, T.-D.H.; methodology, T.-D.H.; validation, T.-D.H., M.T.L. and Y.L.; Formal analysis, T.-D.H.; investigation, T.-D.H., M.T.L. and Y.L.; resources, T.-D.H. and M.T.L.; data curation, T.-D.H. and M.T.L.; writing—original draft preparation, T.-D.H.; writing—review and editing, T.-D.H., M.T.L. and Y.L., visualization, T.-D.H.; supervision, M.T.L.; project administration, M.T.L.; funding acquisition, T.-D.H., M.T.L. and Y.L. All authors have read and agreed to the published version of the manuscript.

Funding

T.-D.H. scholarship was funded by the German Academic Exchange Service (DAAD, No. 57315854. Research budget was funded by the Project on training and fostering human resources in science and technology inland and abroad using the state budget (Project 2395). The APC was funded by MDPI.

Data Availability Statement

The data presented in this study are available in this article. Data supporting the reported results can be provided upon request.

Acknowledgments

T.-D.H. sincerely thanks the RoHan Project funded by the German Academic Exchange Service (DAAD, No. 57315854) and the Federal Ministry for Economic Cooperation and Development (BMZ) of Germany inside the framework of the “SDG Bilateral Graduate School program” for funding T.-D.H. a Ph.D. scholarship and for conversing consumable chemicals, sample analyzing expenses. Technical and administrative supports from the GeViCat center were also appreciated. M.T.L. thanks the Project on training and fostering human resources in science and technology inland and abroad using the state budget (Project 2395) for supporting research budget. T.-D.H. would also like to thank MDPI for waiving the APC fees for the publication of this paper.

Conflicts of Interest

The authors declare no conflicts of interest concerning the research, authorship, and/or publication of this article. The funders had no role in the design of the study; in the collection, analyses, or interpretation of the data; in the writing of the manuscript; or in the decision to publish the results.

References

  1. Mac Dowell, N.; Fennell, P.S.; Shah, N.; Maitland, G.C. The role of CO2 capture and utilization in mitigating climate change. Nat. Clim. Change 2017, 7, 243–249. [Google Scholar] [CrossRef]
  2. Bandh, S.A.; Malla, F.A.; Hoang, T.D.; Qayoom, I.; Mohi-Ud-Din, H.; Bashir, S.; Betts, R.; Le, T.T.; Nguyen Le, D.T.; Linh Le, N.V.; et al. Track to reach net-zero: Progress and pitfalls. Energy Environ. 2024. [Google Scholar] [CrossRef]
  3. Hoang, T.D.; Nghiem, N. Recent developments and current status of commercial production of fuel ethanol. Fermentation 2021, 7, 314. [Google Scholar] [CrossRef]
  4. Sezali, N.A.A.; Ong, H.L.; Villagracia, A.R.; Hoang, T.D. Bio-based nanomaterials for energy application: A review. Vietnam J. Chem. 2024, 62, 1–12. [Google Scholar] [CrossRef]
  5. Malla, F.A.; Dung, T.; Bandh, S.A.; Malla, A.A.; Wani, S.A. Circular Economy to Decarbonize Electricity. In Renewable Energy in Circular Economy, 1st ed.; Bandh, S.A., Malla, F.A., Hoang, A.T., Eds.; Springer International Publishing: Cham, Switzerland, 2023; pp. 71–87. [Google Scholar]
  6. Nobre, L.C.; Teixeira, P.; Pinheiro, C.I.; Palavra, A.M.; Calvete, M.J.; Nieto de Castro, C.A.; Nobre, B.P. The Treatment of Natural Calcium Materials Using the Supercritical Antisolvent Method for CO2 Capture Applications. Processes 2024, 12, 425. [Google Scholar] [CrossRef]
  7. Hoang, T.D.; Bandh, S.A.; Malla, F.A.; Qayoom, I.; Bashir, S.; Peer, S.B.; Halog, A. Carbon-Based Synthesized Materials for CO2 Adsorption and Conversion: Its Potential for Carbon Recycling. Recycling 2023, 8, 53. [Google Scholar] [CrossRef]
  8. Azmi, N.Z.M.; Buthiyappan, A.; Raman, A.A.A.; Patah, M.F.A.; Sufian, S. Recent advances in biomass based activated carbon for carbon dioxide capture–A review. J. Ind. Eng. Chem. 2022, 116, 1–20. [Google Scholar] [CrossRef]
  9. Zhang, Z.; Xu, M.; Wang, H.; Li, Z. Enhancement of CO2 adsorption on high surface area activated carbon modified by N2, H2 and ammonia. J. Chem. Eng. 2010, 160, 571–577. [Google Scholar] [CrossRef]
  10. Pevida, C.; Plaza, M.G.; Arias, B.; Fermoso, J.; Rubiera, F.; Pis, J.J. Surface modification of activated carbons for CO2 capture. Appl. Surf. Sci. 2008, 254, 7165–7172. [Google Scholar] [CrossRef]
  11. Qasem, N.A.; Ben-Mansour, R. Adsorption breakthrough and cycling stability of carbon dioxide separation from CO2/N2/H2O mixture under ambient conditions using 13X and Mg-MOF-74. Appl. Energy 2018, 230, 1093–1107. [Google Scholar] [CrossRef]
  12. Abuelnoor, N.; AlHajaj, A.; Khaleel, M.; Vega, L.F.; Abu-Zahra, M.R. Activated carbons from biomass-based sources for CO2 capture applications. Chemosphere 2021, 282, 131111. [Google Scholar] [CrossRef] [PubMed]
  13. Heidari, A.; Younesi, H.; Rashidi, A.; Ghoreyshi, A.A. Evaluation of CO2 adsorption with eucalyptus wood based activated carbon modified by ammonia solution through heat treatment. J. Chem. Eng. 2014, 254, 503–513. [Google Scholar] [CrossRef]
  14. Gholidoust, A.; Atkinson, J.D.; Hashisho, Z. Enhancing CO2 adsorption via amine-impregnated activated carbon from oil sands coke. Energy Fuels 2017, 31, 1756–1763. [Google Scholar] [CrossRef]
  15. Abd, A.A.; Othman, M.R.; Kim, J. A review on application of activated carbons for carbon dioxide capture: Present performance, preparation, and surface modification for further improvement. Environ. Sci. Pollut. Res. 2021, 28, 43329–43364. [Google Scholar] [CrossRef] [PubMed]
  16. Przepiórski, J.; Skrodzewicz, M.; Morawski, A.W. High temperature ammonia treatment of activated carbon for enhancement of CO2 adsorption. Appl. Surf. Sci. 2004, 225, 235–242. [Google Scholar] [CrossRef]
  17. Feng, J.Y.; Wang, R.; Thakur, K.; Ni, Z.J.; Zhu, Y.Y.; Hu, F.; Zhang, J.G.; Wei, Z.J. Evolution of okara from waste to value added food ingredient: An account of its bio-valorization for improved nutritional and functional effects. Trends Food Sci. Technol. 2021, 116, 669–680. [Google Scholar] [CrossRef]
  18. Hoang, T.D.; Liu, Y.; Le, M.T. Synthesis and Characterization of Biochars and Activated Carbons Derived from Various Biomasses. Sustainability 2024, 16, 5495. [Google Scholar] [CrossRef]
  19. Abi Bianasari, A.; Khaled, M.S.; Hoang, T.D.; Reza, M.S.; Bakar, M.S.A.; Azad, A.K. Influence of combined catalysts on the catalytic pyrolysis process of biomass: A systematic literature review. Energy Convers. Manag. 2024, 309, 118437. [Google Scholar] [CrossRef]
  20. Tran, T.K.; Huynh, L.; Nguyen, H.L.; Nguyen, M.K.; Lin, C.; Hoang, T.D.; Hung, N.T.Q.; Nguyen, X.H.; Chang, S.W.; Nguyen, D.D. Applications of engineered biochar in remediation of heavy metal (loid) s pollution from wastewater: Current perspectives toward sustainable development goals. Sci. Total Environ. 2024, 926, 171859. [Google Scholar] [CrossRef]
  21. Adame-Pereira, M.; Durán-Valle, C.J.; Fernández-González, C. Hydrothermal Carbon Coating of an Activated Carbon—A New Adsorbent. Molecules 2023, 28, 4769. [Google Scholar] [CrossRef]
  22. Gupta, V.K.; Singh, L.P.; Chaudhary, M.; Kushwaha, S. A novel approach to develop activated carbon by an ingenious hydrothermal treatment methodology using Phyllanthus emblica fruit stone. J. Clean. Prod. 2021, 288, 125643. [Google Scholar]
  23. Hoang, T.D.; Van Anh, N.; Yusuf, M.; Ali SA, M.; Subramanian, Y.; Hoang Nam, N.; Minh Ky, N.; Le, V.G.; Thi Thanh Huyen, N.; Abi Bianasari, A.; et al. Valorization of Agriculture Residues into Value-Added Products: A Comprehensive Review of Recent Studies. Chem. Rec. 2024, 24, e202300333. [Google Scholar] [CrossRef]
  24. Kourtelesis, M.; Kousi, K.; Kondarides, D.I. CO2 hydrogenation to methanol over La2O3-promoted CuO/ZnO/Al2O3 catalysts: A kinetic and mechanistic study. Catalysts 2020, 10, 183. [Google Scholar] [CrossRef]
  25. Ghimbeu, C.M.; Gadiou, R.; Dentzer, J.; Schwartz, D.; Vix-Guterl, C. Influence of surface chemistry on the adsorption of oxygenated hydrocarbons on activated carbons. Langmuir 2010, 26, 18824–18833. [Google Scholar] [CrossRef] [PubMed]
  26. Hu, Y.H.; Ruckenstein, E. Temperature-programmed desorption of CO adsorbed on NiO/MgO. J. Catal. 1996, 163, 306–311. [Google Scholar] [CrossRef]
  27. Liu, C.J.; Lobban, L.L.; Mallinson, R.G. (Eds.) Experimental investigations on the interaction between plasmas and catalyst for plasma catalytic methane conversion (PCMC) over zeolites. In Studies in Surface Science and Catalysis, 2nd ed.; Elsevier: Louvain-la-Neuve, Belgium, 1998; Volume 119, pp. 361–366. [Google Scholar]
  28. Jayaraman, K.; Kok, M.V.; Gokalp, I. Thermogravimetric and mass spectrometric (TG-MS) analysis and kinetics of coal-biomass blends. Renew. Energy 2017, 101, 293–300. [Google Scholar] [CrossRef]
  29. Almoneef, M.M.; Jedli, H.; Mbarek, M. Experimental study of CO2 adsorption using activated carbon. Mater. Res. Express 2021, 8, 065602. [Google Scholar] [CrossRef]
  30. Ghouma, I.; Jeguirim, M.; Sager, U.; Limousy, L.; Bennici, S.; Däuber, E.; Asbach, C.; Ligotski, R.; Schmidt, F.; Ouederni, A. The potential of activated carbon made of agro-industrial residues in NOx immissions abatement. Energies 2017, 10, 1508. [Google Scholar] [CrossRef]
  31. Wang, T.; Zhai, Y.; Zhu, Y.; Wang, Z.; Xiao, H.; Peng, C.; Wang, B.; Li, C. What is the influence of the nitrogen-containing composition during hydrothermal carbonization of biomass? A new perspective from mimic feedstock. Bioresour. Technol. Rep. 2019, 5, 343–350. [Google Scholar] [CrossRef]
  32. Leng, L.; Yang, L.; Leng, S.; Zhang, W.; Zhou, Y.; Peng, H.; Li, H.; Hu, Y.; Jiang, S.; Li, H. A review on nitrogen transformation in hydrochar during hydrothermal carbonization of biomass containing nitrogen. Sci. Total Environ. 2021, 756, 143679. [Google Scholar] [CrossRef]
  33. Xiong, J.; Chen, S.; Wang, J.; Wang, Y.; Fang, X.; Huang, H. Speciation of main nutrients (N/P/K) in hydrochars produced from the hydrothermal carbonization of swine manure under different reaction temperatures. Materials 2021, 14, 4114. [Google Scholar] [CrossRef] [PubMed]
  34. Amalina, F.; Abd Razak, A.S.; Krishnan, S.; Sulaiman, H.; Zularisam, A.W.; Nasrullah, M. Biochar production techniques utilizing biomass waste-derived materials and environmental applications–A review. Hazard. Mater. 2022, 7, 100134. [Google Scholar] [CrossRef]
  35. Abdullah, A.H.D.; Chalimah, S.; Primadona, I.; Hanantyo, M.H.G. (Eds.) Physical and chemical properties of corn, cassava, and potato starchs. In IOP Conference Series: Earth and Environmental Science, 2nd ed.; IOP Publishing: Briston, UK, 2018; Volume 160, p. 012003. [Google Scholar]
  36. Li, J.; Wang, Z.; Yang, X.; Hu, L.; Liu, Y.; Wang, C. Evaluate the pyrolysis pathway of glycine and glycylglycine by TG–FTIR. J. Anal. Appl. Pyrol. 2007, 80, 247–253. [Google Scholar] [CrossRef]
  37. Jiménez-García, E.A.; Pérez-Huertas, S.; Pérez, A.; Calero, M.; Blázquez, G. Recycling PVC Waste into CO2 Adsorbents: Optimizing Pyrolysis Valorization with Neuro-Fuzzy Models. Processes 2024, 12, 431. [Google Scholar] [CrossRef]
  38. Moyo, M.; Nyamhere, G.; Sebata, E.; Guyo, U. Kinetic and equilibrium modelling of lead sorption from aqueous solution by activated carbon from goat dung. Desalin Water Treat. 2016, 57, 765–775.38. [Google Scholar] [CrossRef]
  39. Petrovic, B.; Gorbounov, M.; Soltani, S.M. Influence of surface modification on selective CO2 adsorption: A technical review on mechanisms and methods. Micropor Mesopor Mat. 2021, 312, 110751. [Google Scholar] [CrossRef]
  40. Wang, B.; Côté, A.P.; Furukawa, H.; O’Keeffe, M.; Yaghi, O.M. Colossal cages in zeolitic imidazolate frameworks as selective carbon dioxide reservoirs. Nature 2008, 453, 207–211. [Google Scholar] [CrossRef]
  41. Goetz, V.; Pupier, O.; Guillot, A. Carbon dioxide-methane mixture adsorption on activated carbon. Adsorption 2006, 12, 55–63. [Google Scholar] [CrossRef]
  42. González Plaza, M.; González García, A.S.; Pevida García, C.; Pis Martínez, J.J.; Rubiera González, F. Valorisation of spent coffee grounds as CO2 adsorbents for postcombustion capture applications. Appl. Energy 2012, 99, 272–279. [Google Scholar] [CrossRef]
  43. Li, D.; Ma, T.; Zhang, R.; Tian, Y.; Qiao, Y. Preparation of porous carbons with high low-pressure CO2 uptake by KOH activation of rice husk char. Fuel 2015, 139, 68–70. [Google Scholar] [CrossRef]
  44. Serafin, J.; Narkiewicz, U.; Morawski, A.W.; Wróbel, R.J.; Michalkiewicz, B. Highly microporous activated carbons from biomass for CO2 capture and effective micropores at different conditions. J. CO2 Util. 2017, 18, 73–79. [Google Scholar] [CrossRef]
  45. Wang, R.; Wang, P.; Yan, X.; Lang, J.; Peng, C.; Xue, Q. Promising porous carbon derived from celtuce leaves with outstanding supercapacitance and CO2 capture performance. ACS Appl. Mater. Interfaces 2012, 4, 5800–5806. [Google Scholar] [CrossRef]
  46. Li, D.; Tian, Y.; Li, L.; Li, J.; Zhang, H. Production of highly microporous carbons with large CO2 uptakes at atmospheric pressure by KOH activation of peanut shell char. J. Porous Mater. 2015, 22, 1581–1588. [Google Scholar] [CrossRef]
  47. Wang, T.; Wu, L.; Xu, X.; Sun, Y.; Wang, Y.; Zhong, W.; Du, Y. An efficient Co3S4/CoP hybrid catalyst for electrocatalytic hydrogen evolution. Sci. Rep. 2017, 7, 11891. [Google Scholar] [CrossRef] [PubMed]
  48. Kiełbasa, K.; Kamińska, A.; Niedoba, O.; Michalkiewicz, B. CO2 adsorption on activated carbons prepared from molasses: A comparison of two and three parametric models. Materials 2021, 14, 7458. [Google Scholar] [CrossRef] [PubMed]
  49. Asadi-Sangachini, Z.; Galangash, M.M.; Younesi, H.; Nowrouzi, M. The feasibility of cost-effective manufacturing activated carbon derived from walnut shells for large-scale CO2 capture. Environ. Sci. Pollut. Res. 2019, 26, 26542–26552. [Google Scholar] [CrossRef] [PubMed]
  50. Lima, I.M.; McAloon, A.; Boateng, A.A. Activated carbon from broiler litter: Process description and cost of production. Biomass Bioenerg. 2008, 32, 568–572. [Google Scholar] [CrossRef]
  51. Fakeeha, A.H.; Kasim, S.O.; Ibrahim, A.A.; Abasaeed, A.E.; Al-Fatesh, A.S. Influence of nature support on methane and CO2 conversion in a dry reforming reaction over nickel-supported catalysts. Materials 2019, 12, 1777. [Google Scholar] [CrossRef]
  52. Zhao, B.; Wang, J.; Zhu, D.; Song, G.; Yang, H.; Chen, L.; Sun, L.; Yang, S.; Guan, H.; Xie, X. Adsorption characteristics of gas molecules (H2O, CO2, CO, CH4, and H2) on CaO-based catalysts during biomass thermal conversion with in situ CO2 capture. Catalysts 2019, 9, 757. [Google Scholar] [CrossRef]
  53. Li, N.; Ma, X.; Zha, Q.; Kim, K.; Chen, Y.; Song, C. Maximizing the number of oxygen-containing functional groups on activated carbon by using ammonium persulfate and improving the temperature-programmed desorption characterization of carbon surface chemistry. Carbon 2011, 49, 5002–5013. [Google Scholar] [CrossRef]
  54. Thommes, M.; Morlay, C.; Ahmad, R.; Joly, J.P. Assessing surface chemistry and pore structure of active carbons by a combination of physisorption (H2O, Ar, N2, CO2), XPS and TPD-MS. Adsorption 2011, 17, 653–661. [Google Scholar] [CrossRef]
  55. Lu, Z.; Sun, K.; Wang, J.; Zhang, Z.; Liu, C. A highly active Au/In2O3-ZrO2 catalyst for selective hydrogenation of CO2 to methanol. Catalysts 2020, 10, 1360. [Google Scholar] [CrossRef]
  56. Hoang, T.D.; Ky, N.M.; Thuong, N.T.N.; Nhan, H.Q.; Ngan, N.V.C. Artificial intelligence in pollution control and management: Status and future prospects. In Artificial Intelligence and Environmental Sustainability, 1st ed.; Algorithms for Intelligent Systems, Ong, H.L., Doong, R., Naguib, R., Lim, C.P., Nagar, A.K., Eds.; Springer: Singapore, 2022; pp. 23–43. [Google Scholar]
  57. Gan, Y.X. Activated carbon from biomass sustainable sources. C 2021, 7, 39. [Google Scholar] [CrossRef]
Figure 1. SEM images of samples: (a) S1−original AC, (b) S2−AC−NH4OH−24h, (c) S3−ACNH4OH−48h, (d) S4−NH4OH−72h.
Processes 12 02024 g001
Figure 2. EDX spectra of sample S2.
Processes 12 02024 g002
Figure 3. FTIR spectra of S1−original AC, S2−AC−NH4OH−24h, S3-AC−NH4OH-48h, and S4−AC−NH4OH−72h.
Processes 12 02024 g003
Figure 4. CO2 uptake capacity of 4 samples.
Processes 12 02024 g004
Figure 5. BJH desorption dA/dlog(w) pore area plot of sample S1−original AC.
Processes 12 02024 g005
Figure 6. Isotherm linear plot of sample S1-original AC.
Processes 12 02024 g006
Figure 7. TPD−CO2 spectra for samples S1−original−AC, S2−AC−NH4OH−24h, and S3−AC−NH4OH−48h.
Processes 12 02024 g007
Figure 8. The mass intensity of mass 44 (CO2) for samples S1−original AC, S2−AC−NH4OH−24h, and S3−AC−NH4OH−48h.
Processes 12 02024 g008
Figure 9. The mass intensity of mass 17 (NH3) for sample S3−AC−NH4OH−48h.
Processes 12 02024 g009
Figure 10. TGA−DSC analysis under N2 flow of sample S3−AC−NH4OH−48h.
Processes 12 02024 g010
Table 1. Chemical composition of different samples S1–S4.
ElementsS1
(Original AC)
S2
(AC−NH4OH−24h)
S3
(AC−NH4OH−48h)
S4
(AC−NH4OH−72h)
Mass%Atom%Mass%Atom%Mass%Atom%Mass%Atom%
C88.3995.6366.6474.5771.2578.2971.3087.74
Al1.160.562.081.040.970.472.061.13
Si1.810.843.231.55
Cl3.051.12
K5.591.862.480.854.901.6525.079.48
N 4.344.176.055.701.581.16
O 21.2217.8316.8213.88
Total100100100100100100100100
C/N atom
ratio
- 17.88 13.74 75.63
Table 2. Comparison of CO2 adsorption data with those of other research in the literature.
Adsorbents Sample CodeTemperature (K)Impregnation Method and AgentCO2 Uptake (mmol/g)References
OkaraS1-original/raw
or unmodified AC
298Chemical, wet, NH4OH0.24This work
Crystallized
materials
ZIF−100298-1.05[40]
OkaraS4−AC−NH4OH−72h298Chemical, wet, NH4OH1.26This work
Commercial AC Norit RB2298 -1.5[41]
OkaraS2−AC−NH4OH−24h298Chemical, wet, NH4OH1.78This work
OkaraS3−AC−NH4OH−48h298Chemical, wet, NH4OH2.24This work
Zeolite-based
adsorbents
13x298-2.27[11]
Commercial ACsCommercial ACs298Chemical, wet, NH4OH2.92[9]
Coffee grounds-298Chemical, wet, KOH3.00[42]
Eucalyptus wood-298Chemical, H3PO43.22[13]
Rice husk char-298Chemical, wet, KOH3.71[43]
Carrot peels-298Chemical, wet, KOH4.18[44]
Celtuce leaves-298Chemical, wet, KOH4.36[45]
Peanut shell char-298Chemical, wet, KOH4.41[46]
MOFMg−MOF−74298-5.77[11]
Disclaimer/Publisher’s Note: The statements, opinions and data contained in all publications are solely those of the individual author(s) and contributor(s) and not of MDPI and/or the editor(s). MDPI and/or the editor(s) disclaim responsibility for any injury to people or property resulting from any ideas, methods, instructions or products referred to in the content.

