Abstract
The interest in combined heat and solar power (CHP) systems has increased due to the growing demand for sustainable energy with low carbon emissions. An effective technical solution to address this requirement is using a parabolic trough solar collector (PTC) in conjunction with a Rankine cycle (RC) heat engine. The solar-powered Rankine cycle (SPRC) system is a renewable energy technology that can be relied upon for its high efficiency and produces clean energy output. This study describes developing a SPRC system specifically for electricity generation in Aden, Yemen. The system comprises parabolic trough collectors, a thermal storage tank, and a Rankine cycle. A 4E analysis of this system was theoretically investigated, and the effects of various design conditions, namely the boiler’s pinch point temperature and steam extraction from the high-pressure turbine, steam extraction from the intermediate-pressure turbine, and condenser temperature, were studied. Numerical simulations showed that the system produces a 50 MW net. The system’s exergetic and energy efficiencies are 30.7% and 32.4%. The planned system costs 2509 USD/h, the exergoeconomic factor is 79.43%, and the system’s energy cost is 50.19 USD/MWh. The system has a 22.47 kg/MWh environmental carbon footprint. It is also observed that the performance of the cycle is greatly influenced by climatic circumstances. Raising the boiler’s pinch point temperature decreases the system’s performance and raises the environmental impact.
1. Introduction
The importance of renewable energy stems from its clean sustainable nature, offering a solution to reduce our reliance on fossil fuels, which are major contributors to climate change [1,2]. The adoption of renewable sources is not only becoming more cost-effective but also more accessible, presenting a viable alternative. Integrating renewable energy into power generation systems poses challenges but is essential for transitioning towards a sustainable energy future [3,4]. The variability of renewable sources like solar and wind means that they only generate power under certain conditions, necessitating innovative solutions for power plants to provide a reliable energy supply [5,6].
Exergy is a thermodynamic concept that measures the maximum useful work obtainable from a system as it reaches equilibrium with its environment [7]. The exergy concept, developed to conserve energy, is a solid thermal system assessment tool. It uses the second rule of thermodynamics to locate and size inefficiencies. A comprehensive second law of thermodynamics analysis may assist in uncovering energy conservation options, even while system irreversibility cannot be eliminated [8]. Engineers struggle to design cost-effective systems owing to increased energy demand and limited natural resources. Exergoeconomics examines exergy and economic restrictions to provide insights beyond thermodynamic and financial judgments. This method assesses resource, financial, and manufacturing inefficiencies to improve resource use. Exergoeconomics costs process flow streams to determine the economic impact of inefficiency. This assessment optimizes new facility designs and product costs [6].
Numerous studies have delved into advancements within solar power plants, examining various technologies, design considerations, and performance evaluations and identifying areas for improvement. Schnatbaum [9] analyzed parabolic trough solar thermal plants, suggesting importing solar power from North Africa to Central Europe for consistent electricity to meet varying network demands. Al-Elanjawy and Yilmaz [10] studied the integration of solar thermal energy at Baghdad’s Besmaya NGCC power plant, finding that it reduced emissions by 99%, from 2,119,318 to 18,064 tonnes/year. Desai et al. [11] proposed a graphical method to simplify choosing between steam and organic Rankine cycles and solar collectors for power plants, optimizing design decisions based on cost and efficiency without detailed simulations. Sachdeva et al. [12] explored a solar-powered triple-combined cycle with zero emissions, consisting of Brayton, Rankine, and organic Rankine cycles, analyzing thermodynamics to optimize performance and efficiency, yielding a prototype basis for future enhancements. Mirjavad et al. [13] compared two thermodynamic cascade cycles, System A (steam Rankine and organic Rankine cycles) and System B (steam Rankine and Kalina cycles), by varying mass flow rate and pressure levels. The Kalina cycle was more efficient than the bottom cycle in a solar-driven system, with similar economic outcomes. Shi et al. [14] proposed a novel liquefied air energy storage (LAES) system integrating solar energy, Rankine cycle, and seawater desalination to enhance system power and efficiency and desalination output, showing significant improvements in system efficiencies and freshwater production. Porto-Hernandez et al. [15] developed a mathematical model to optimize mass flow ratios and heat exchanger area fractions to maximize net power output and second law efficiency in steam Rankine cycle (SRC) power plants. Esfandiari et al. [16] found that solar absorption refrigeration (SAR) cools the compressor’s air intake in a gas–steam combined cycle power plant, increasing power production and efficiency, particularly during peak demand in hot climes. Zaho et al. [17] proposed integrating compressed steam energy storage with a thermal power plant’s Rankine cycle to improve peak shaving. Extensive analyses showed that it reduces coal consumption, improves exergy efficiency, and extends peak regulation operation and economic benefits. Assareh et al. [18] introduced a system combining a solar Rankine cycle and an organic Rankine cycle with a Brayton cycle gas turbine, enhancing environmental and production efficiency, with a detailed performance and economic analysis indicating optimal function in cooler climates like Mashhad, Iran. Matjanov et al. [19], who studied integrating solar energy into the 155 MW Tashkent power plant’s steam cycle for replacing regenerative feed water heaters and parts of the economizer, showing that higher solar heat temperatures significantly enhance solar-to-electric efficiency and reduce fossil fuel use. Ehtiwesh et al. [20] developed a dynamic model of a direct steam generation (DSG) solar power system with a steam accumulator using Simulink and MATLAB to meet a Libyan hospital’s fluctuating electricity needs, featuring advanced controls for safe operation and efficiency. Sornek et al. [21] evaluated a micro-cogeneration system powered by biomass, utilizing a modified Rankine cycle for potential retrofitting optimizations, achieving up to 9 kW output and a 97.9% energy utilization factor, supporting sustainable energy goals through renewable sources. Huang and Marefati [22] assessed a solar-enhanced municipal solid waste incineration plant, finding it produced 16.1% more energy and had higher efficiencies, with an 8.93% lower levelized cost of electricity despite higher costs. Adibhatla and Kaushik [23] analyzed the economic and environmental benefits of integrating solar energy with coal-fired plants in India, highlighting significant efficiency, fuel savings, and emissions reduction from solar-aided feed water heating (SAFWH) despite higher initial costs. Bolatturk et al. [24] analyzed Turkey’s Çayırhan thermal power plant, showing thermal and second law efficiencies of 38% and 53%, with the highest exergy losses and costs occurring in the boiler, turbine, and condenser. Sadi and Arabkoohsa [25] improved the electricity cost of a hybrid solar–waste power plant from USD 0.202 to USD 0.137 per MJ by optimizing its exergy efficiency, achieving cost reductions of up to 26% in summer and 10% in winter. Elsafi [26] found that reheating in a direct steam generation solar plant improved steam quality by 9.1% at the turbine exit, slightly raising electricity costs by 2% with minimal efficiency impact. Nafchi et al. [27] developed an exergoeconomic model for a solar tower–hydrogen gas turbine power plant, finding that increasing solar irradiation by 36% enhanced exergy efficiency by 13%, with the solar tower showing the highest exergy destruction and capital costs. Elmorsy et al. [28] compared solar power technologies in integrated systems, finding Fresnel collectors the most efficient and cost-effective, reducing investment costs to 2545 USD/kW and producing energy at 36.75 USD/MWh. Ahamad et al. [29] optimized a solar Rankine cycle with three refrigerants, enhancing energy efficiency to 75.07% and reducing power costs by 68% while increasing ecological efficiency by 16%, with significant exergy losses in the receiver, heliostat, and turbine. Javadzadeh and Baghernejad [30] enhanced a hybrid solar thermal power plant (STPP) by integrating a Luz system (LS-3) collector, which increased the turbine’s steam temperature to reduce exergy destruction from 6.61 MW to 3.1 MW and raised exergy efficiency from 7% to 11.97%. Adibhatla and Kaushik [31] found that integrating solar energy into a natural gas CCPP using DSG and PTCs increased output by 7.84%, improved efficiencies to 53.79% and 27.39%, and reduced electricity costs from 0.074 to 0.067 USD/kWh. Talal et al. [32,33] discussed the advantages of integrating solar thermal energy with gas turbines in Iraq, highlighting the economic and efficiency gains over traditional systems and advocating for adopting integrated solar combined cycle (ISCC) plants to improve Iraq’s energy infrastructure. Dabwan and Pei [34] assessed traditional and solar-integrated gas turbine trigeneration plants, finding that a configuration combining a 126-hectare solar field with a 130 MWe plant cut emissions by 114 kilotonnes and set energy prices at 5.75 USD/kWh. Zahedi al. [35] developed an energy recovery system with various cycles for hot exhaust gas, achieving up to 73.7% exergy and 71.8% energy efficiencies, but carbon capture decreased them to 51.9% and 50.5%. Abdel Dayem and Al-Ghamd [36] developed a numerical simulation for a solar power plant using direct steam generation (DSG) technology, finding that the superheated steam configuration yielded 45% higher power but 10% lower efficiency compared with saturated steam, with performance peaking under Makkah’s climate, generating around 40 MW and 8062 MWh annually in spring and autumn.
This research focuses on using the potential of solar technology in Aden, Yemen to suggest the design of the first solar power plant in the country. This study seeks to devise a comprehensive framework for incorporating a 50 MW solar-powered Rankine cycle (SPRC) system to reduce the significant electricity deficit in Aden, Yemen.
2. Materials and Methods
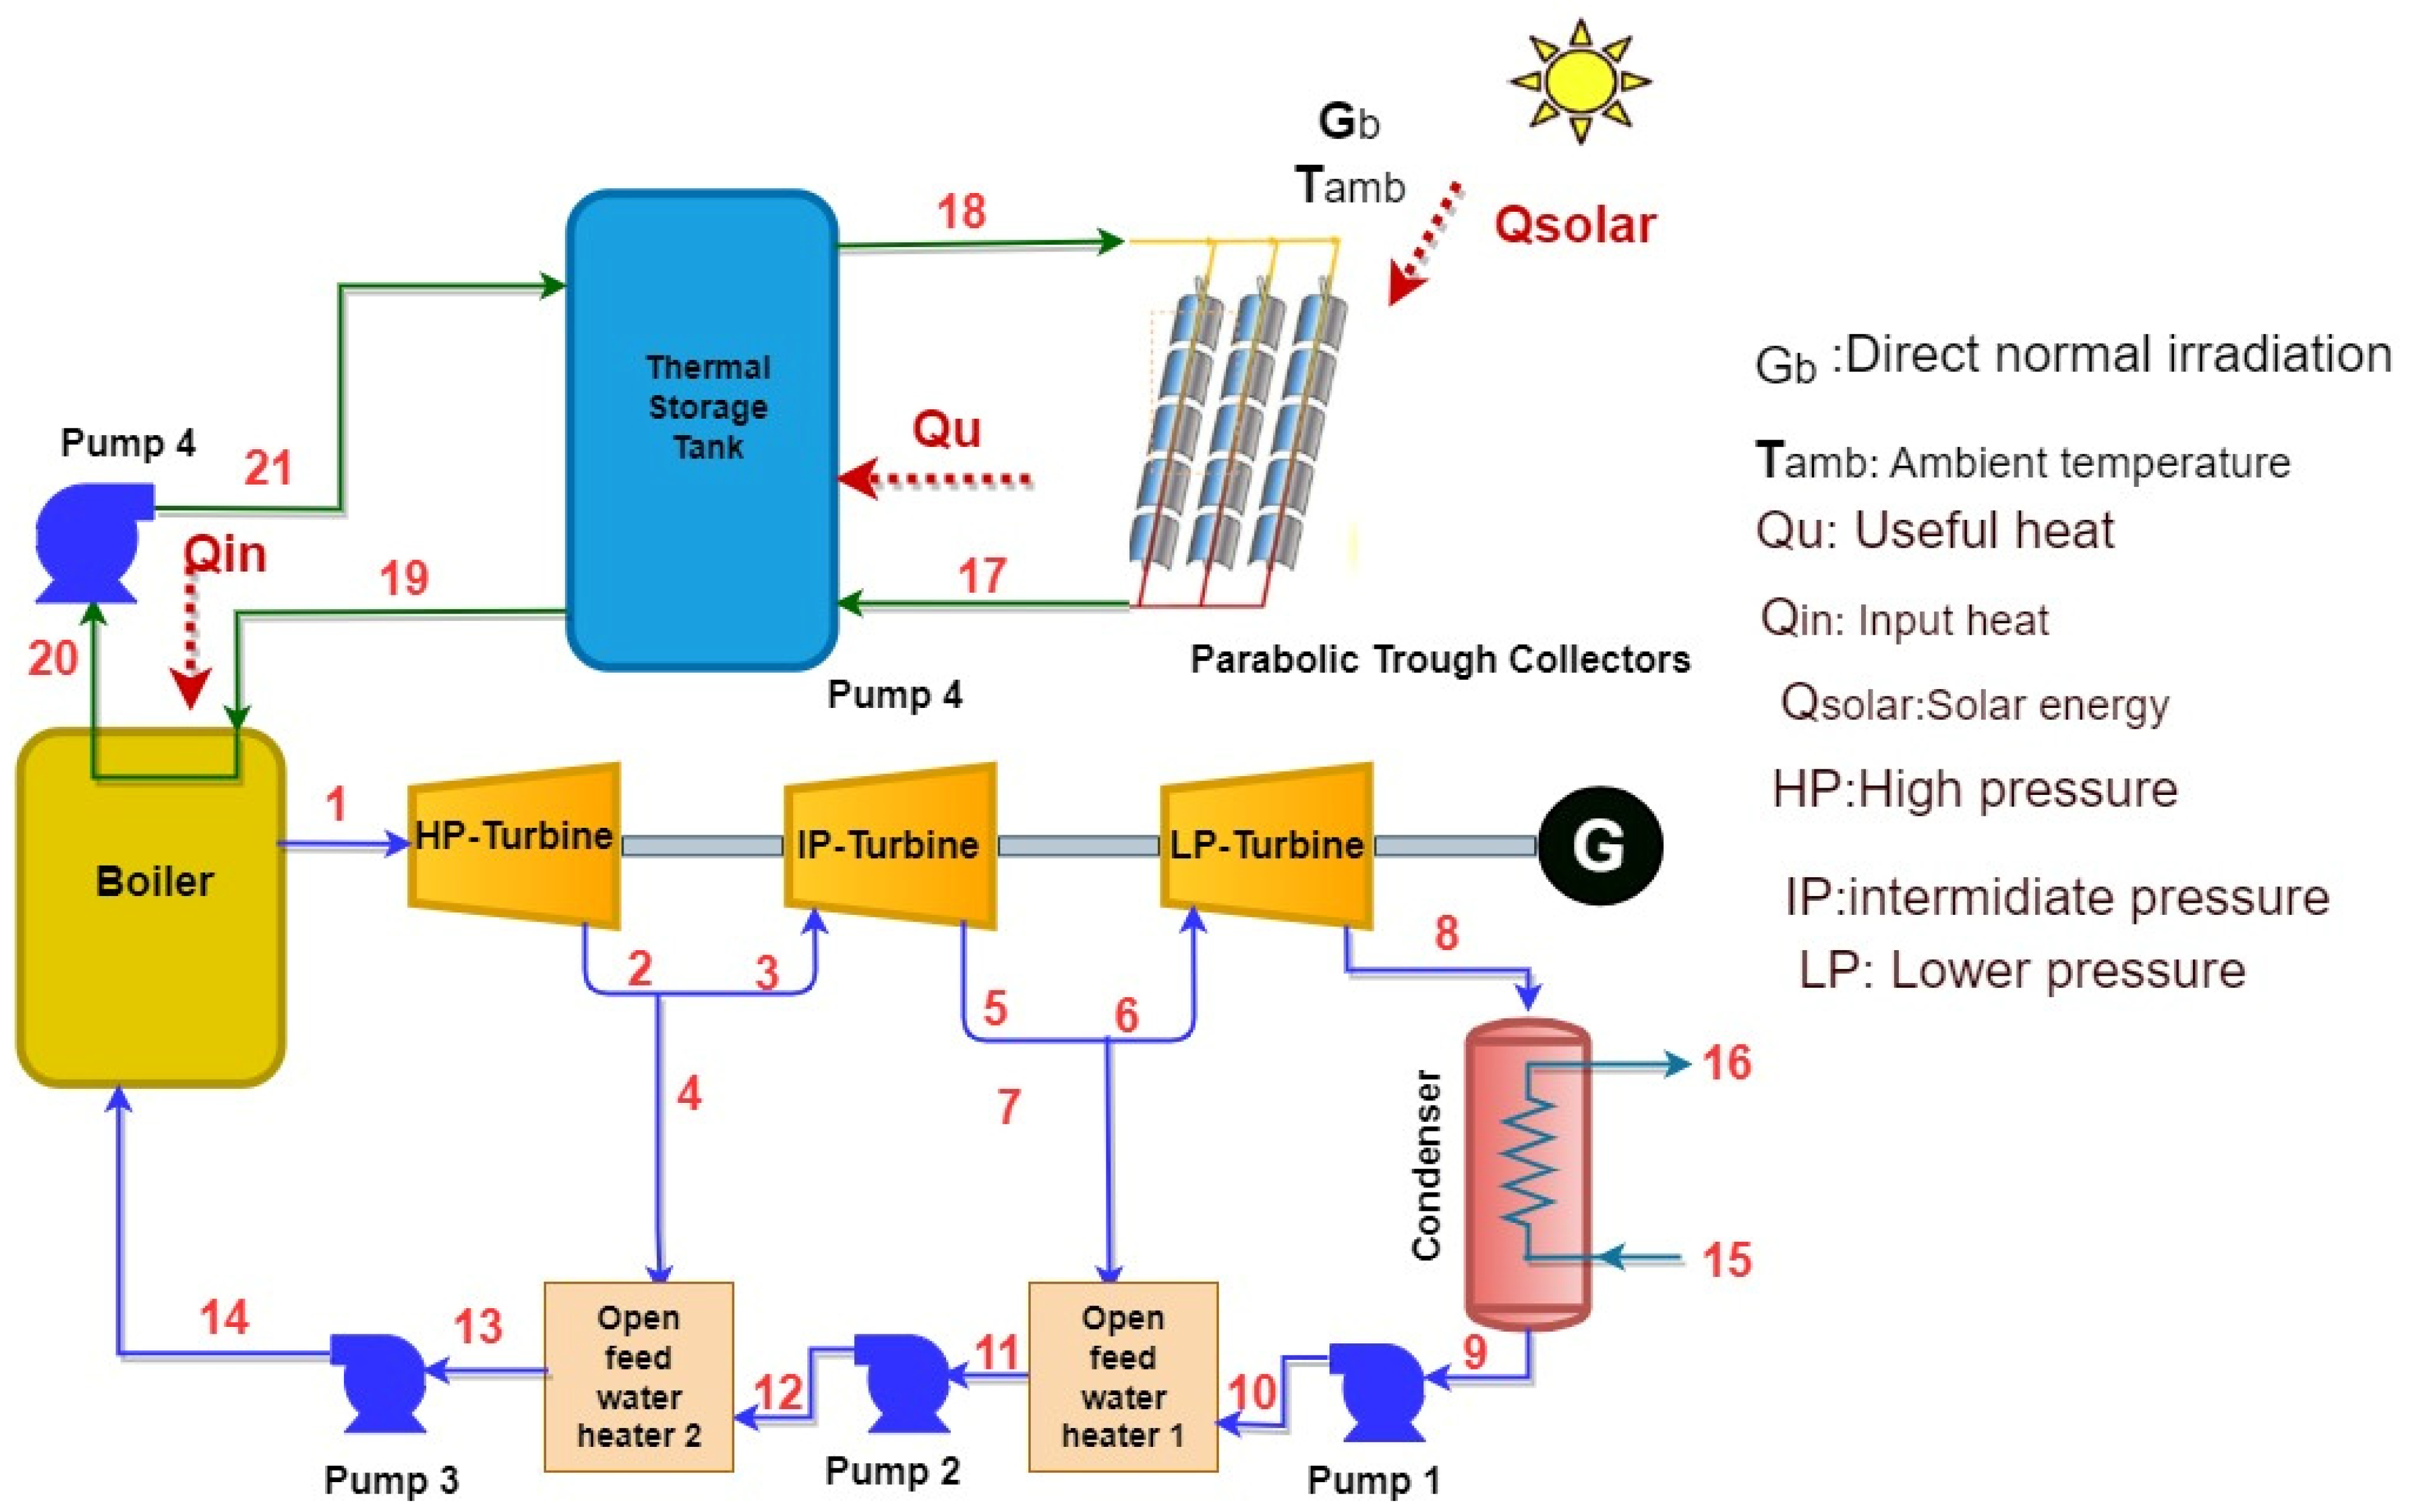
Rankine cycles rely on thermal energy storage and parabolic trough solar collectors (PTCs), as seen in Figure 1. PTCs convert solar light into heat, which is then used to heat the working fluid. The collector field circuit and storage tank employ molten salt as their working fluid. The salt travels from the bottom of the tank to the collector field, where it is heated, then travels back up to the top [37]. The salt, now molten and heated, makes its way to the boiler to heat the RC’s working fluid, and then it makes its way back down to the TST, closing the loop. The TST’s heated molten salt powers the controlled combustion engine. Under assumptions governed by the first and second laws of thermodynamics and generic equations for energy, exergy, and cost, Engineering Equations Solver (EES) software was used to perform a thermodynamic evaluation of the SPRC system. Several assumptions underpin the SPRC system’s thermodynamic and thermoeconomic analyses as follows:
- The reference state temperature (T0) and pressure (P0) are set at 25 °C and 1 bar, respectively.
- Both kinetic and potential energy are regarded as constant.
- The system does not lose heat to its surroundings and has a negligible pressure drop.
- Compressors, pumps, and turbines operate in an adiabatic manner.
- The system operates under steady-state conditions.
- The temperature of the sun is around 6000 Kelvin.

Figure 1.
Schematic of the solar-powered Rankine cycle (SPRC) system.
Each component of the created model has been separately modeled using thermodynamics. Using certain formulas, the system analyzes mass, energy, exergy, and exergy economics. Table 1 provides a full breakdown of the operational and technical characteristics used in the analysis.

Table 1.
Summary of design point parameters.
3. Process Analysis
This section outlines the methods used to conduct energy, exergoeconomic, and environmental analyses.
3.1. Energy Analysis
Energy analyses help evaluate existing systems and plan new designs. Understanding energy distribution and use requires examining energy trends. The first law of thermodynamics is used to evaluate the energy efficiency of the developed system and describe its results in this study. The following equations show energy conservation for each system component [38,39]:
The developed model’s first law efficiency is calculated as [40]:
This is the formula for the developed system’s power output:
The system’s heat and exergy input can be determined as follows [41]:
References [41,42] were used to derive the energy equations for the parabolic solar collector. The PTC ought to think about two kinds of energy, one of which is thermal energy. There are two types of solar energy: the input (), which comes from the sun as a whole, and the output (), which is the heat transferred to the system. In addition, the literature [43,44] was used to derive the thermodynamic model for thermal energy storage.
3.2. Figures, Tables, and Schemes
Exergy analysis is highly advantageous to crafting strategies that enhance energy efficiency. Moreover, implementing exergy analysis allows for quantifying a system’s capacity for useful work. Researchers employ exergy evaluation as an effective method to develop simulations and forecast the thermal behavior of energy systems. For every component of the system, the overall energy balance can be expressed as [43,45]:
The developed model’s second law efficiency is calculated as [40,46]:
Table 2 provides a summary of the energy and exergy balance equations for every component of the system.
Table 2.
Energy and exergy balance equations for every component of the system.
3.3. Exergoeconomic Analysis
Exergoeconomics uses principles from exergy analysis and cost appraisal to reduce costs [47]. Thermodynamics and economics are also examined to determine how an energy conversion plant’s cost performance might be assessed. It analyzes exergy destruction and losses to find thermodynamic inefficiencies in these systems. Understanding the costs of these inefficiencies is essential for improving the system’s economic efficiency and lowering product costs [48,49]. The general equation for the exergy cost balance of each component in the system can be expressed as follows [50]:
The equations cited in the literature were utilized to deduce the exergoeconomic analysis for every component of the model. Table 3 provides the calculations needed to estimate the overall equipment costs. Also, Table 4 displays the cost balance and auxiliary equations of the components utilized in the designed system.
Table 3.
Overall equipment costs for each component [51,52].
Table 4.
Cost balance equations used in the designed system.
3.4. Environmental Analysis
Implementing the solar-powered Rankine cycle will decrease the usage of fossil fuels and ultimately reduce pollutant emissions. Given that the proposed system does not involve the burning of fossil fuels, it only considers the emission of resulting from the use of electricity, which is required to power equipment like pumps. This emission is computed as [53]:
The emission conversion factor, denoted as , has a value of 0.968 kg/kWh.
4. Results and Discussion
Table 5 contains a comparative study to validate a system design’s accuracy using previously published data [54]. It compares the two sets of data using several parameters to assess consistency. The current study’s values matched the literature’s, indicating good agreement. High-pressure turbine (HPT) inlet pressure, condenser pressure, steam mass flow rate, net power output, Rankine cycle efficiency, required thermal energy, heat transfer fluid (HTF) temperatures, and mass flow rates at different system points are compared in the table. These results indicate that Tehrani and Taylor’s findings are similar to the current study, with a few small differences. The table shows a slight variation of 0.66% in the condenser pressure, with the present study recording a slightly lower pressure. No variation is observed in the HPT inlet pressure; both studies report 987 bar. The present study shows a slightly higher net power output (1.32% higher). RC’s mass flow rate and thermal energy parameters show minimal variations, 0.08% and 0.21%, respectively, indicating close agreement between the two studies. There is a slight discrepancy of 0.96% in thermal efficiency, with the present study being slightly more efficient. There are no differences in HTF temperatures at boiler entry and exit; both studies report the same temperatures. This also shows no HTF mass flow rate variation, with both studies recording 141 kg/s.
Table 5.
Comparison between values derived from the literature and this current study’s findings.
4.1. Results of Energy and Exergy Analysis
Table 6 compiles the results of the energy, exergy, exergoeconomic, and environmental assessments conducted for this study. The system has a net output power of about 50 MW. The system’s exergetic and energy efficiencies are computed to be 30.7% and 32.4%, respectively. The proposed system’s overall cost rate is 2509 USD/h. This includes capital investment at 1993 USD/h, exergy destruction at 489.14 USD/h, and environmental costs at 26.96 USD/h. Therefore, the exergoeconomic factor is computed to be 79.43%, and the system’s unit cost of specific energy is 50.19 USD/MWh. The results show that the environmental carbon footprint of the system is 22.47 kg/MWh.
Table 6.
Output values in the SPRC system.
Table 7 presents an exergy analysis of each solar-powered Rankine cycle system component. The study reveals that the system captures 154.4 MW of exergy from solar energy and produces a total exergy output of 50 MW. A considerable exergy loss of 38.38 MW occurs primarily in the parabolic trough collector (PTC). Additionally, the table specifies the exergy efficiency rates for various components, indicating that the PTC has the lowest efficiency at 45.7%, while the thermal energy storage (TES), boiler, and high-pressure turbine (HPT) exhibit the highest efficiencies.
Table 7.
Exergy analysis for each component of the SPRC system.
Table 8 displays the total exergy input and loss across the solar-powered Rankine cycle system. The cumulative exergy dissipation across all components is roughly 101.02 MW, representing approximately 65.44% of the total exergy input into the system. The system provides a network of 50 MW, which accounts for approximately 32.4% of the total. Approximately 2.61% of the remaining exergy is discharged along with the water flow in the condenser.
Table 8.
Total exergy input and loss in the solar-powered Rankine cycle system.
Figure 2a,b illustrate the differences in exergy dissipation among solar and additional system components. Figure 2a illustrates that the parabolic trough collector (PTC) accounts for a significant exergy destruction of 83.83 MW, while the combined exergy destruction from all other system components totals only 17.72 MW. Greater differences in temperature result in increased energy depreciation. As Figure 2b illustrates, the PTC collectors suffer the most exergy degradation as a result of the greatest temperature differential, which is measured at 82.5%. This large exergy loss is mainly caused by the PTC’s reduced efficiency and the greater entropy production at higher temperatures.
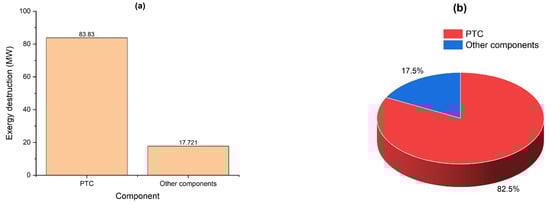
Figure 2.
Differences in exergy destruction among solar and other system components: (a) exergy destruction in MW and (b) exergy destruction percentage.
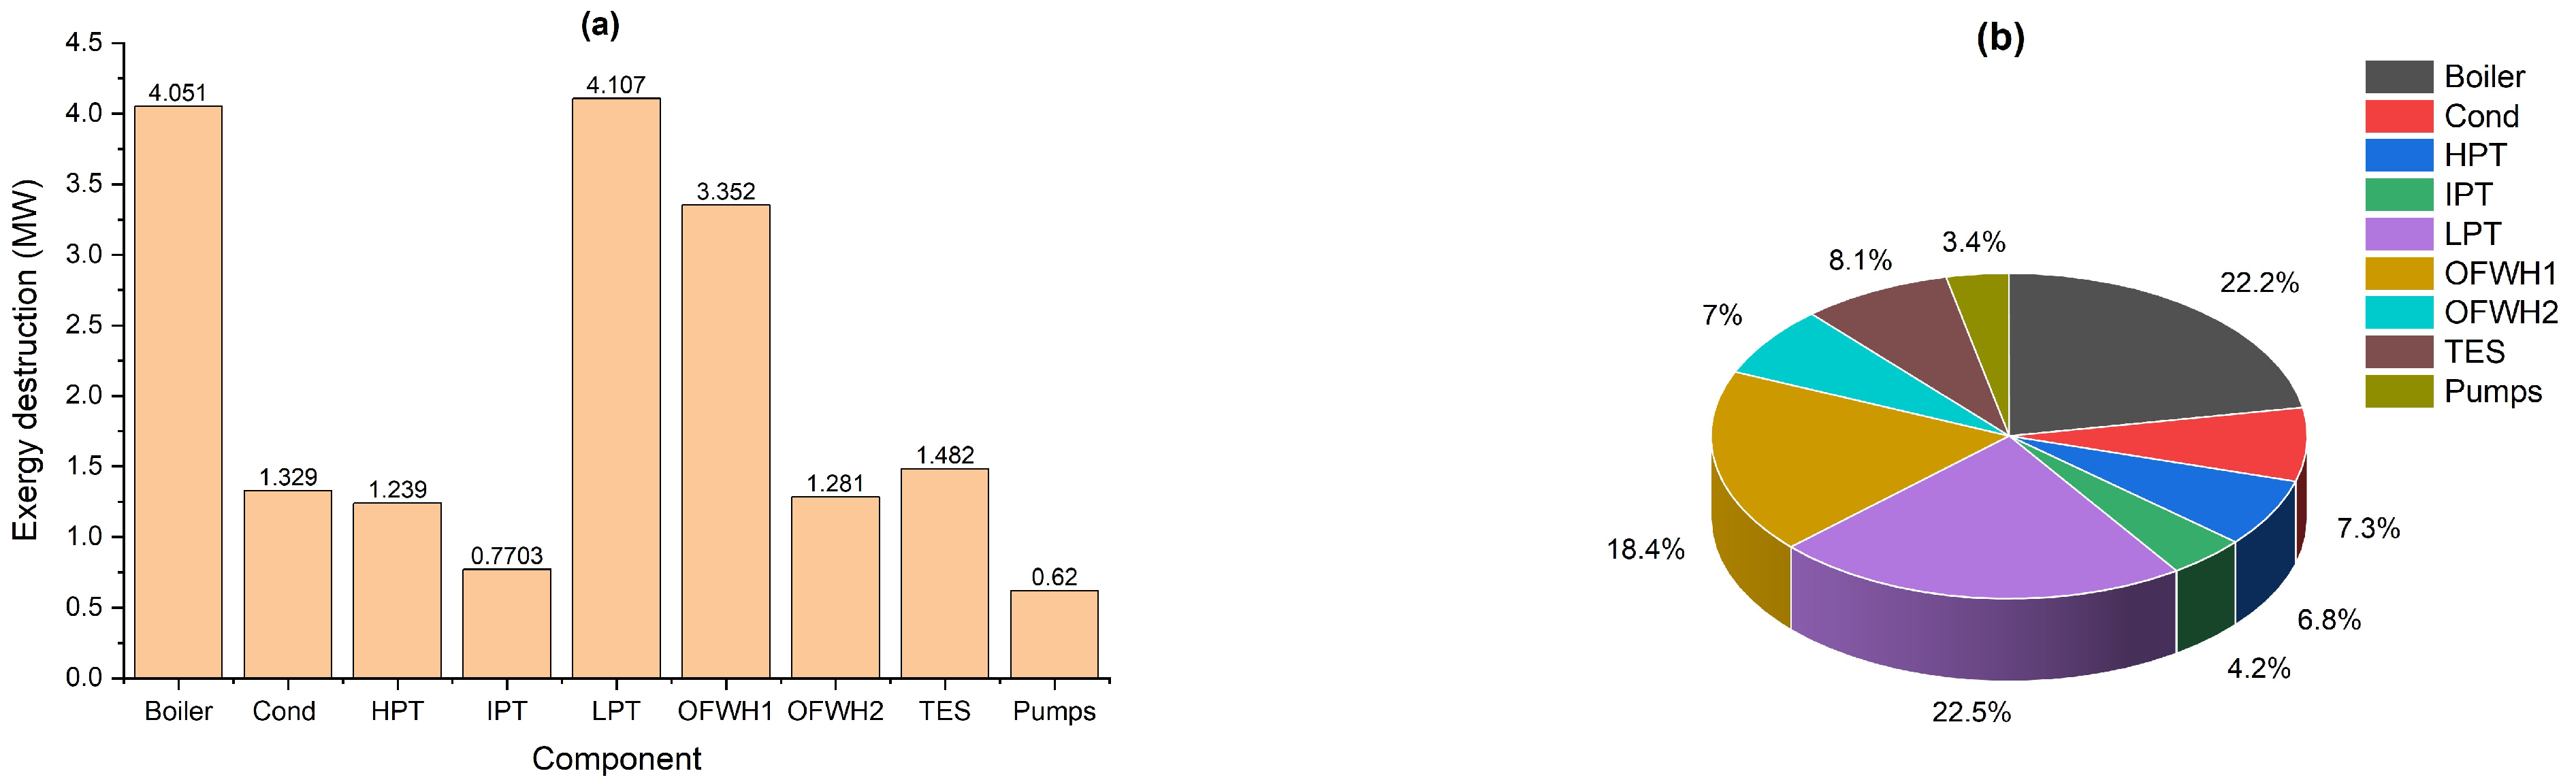
Figure 3a,b illustrate the key components experiencing the most significant exergy destruction within the analyzed system, totaling 17.72 MW, excluding the PTC collectors. The highest level of energy destruction occurs in the low-pressure turbine (LPT), totaling 4.107 MW, closely followed by the boiler, with 4.051 MW of exergy destruction, as depicted in Figure 3a. The significant loss in these components is attributed to high entropy production. Among the turbines, the intermediate-pressure turbine (IPT) experiences the most minor exergy destruction, recorded at 0.77 MW. According to Figure 3b, the LPT, boiler, and OFWH1 contribute 22.5%, 22.2%, and 18.4% of the total exergy destruction of 17.72 MW, respectively.

Figure 3.
Differences in exergy destruction for all system components except PTC: (a) exergy destruction in MW and (b) exergy destruction percentage.
4.2. Results of Exergy Economy Analysis
Exergy economics analysis assesses the system through both thermodynamic and economic lenses. Table 9 details the exergy devastation cost (), capital investment costs (), total system cost ( + ), and exergy economic factor () for each component in the system. Exergy destruction directly influences the total system costs. The findings present that the total cost of exergy destruction is 489.14 USD/h. The greatest exergy destruction costs are found in the low-pressure turbine (LPT), amounting to 119.3 USD/h, with the OFWH1 closely following at 98.38 USD/h. The lowest costs of exergy destruction occur in the pumps. The table further indicates that 76.32% of the capital cost investment, equating to 1521 USD/h, is lost to the PTC collectors, while the remaining components account for just 23.7%.
Table 9.
Exergoconomic analysis for the SPRC system components.
The exergy economic factor (), depicts how investment costs relate to exergy destruction costs. A low value indicates a need to enhance component efficiency through increased financial input. For instance, the values for the condenser and thermal energy storage in the system are notably low (<4%), suggesting areas where more investment might be warranted. On the other hand, a high value suggests that reducing expenditure on a component could be advantageous, reflecting its high efficiency. In this case, the pumps in the system show a high value (>69%). Excluding the pumps, the four components in the system with the highest values are the high-pressure turbine, intermediate-pressure turbine, boiler, and low-pressure turbine. The values for these components are recorded at 69.53%, 69.81%, 60.08%, and 49.6%, respectively. Given their impact on efficiency, these elements should be prioritized for cost reduction relative to other system parts.
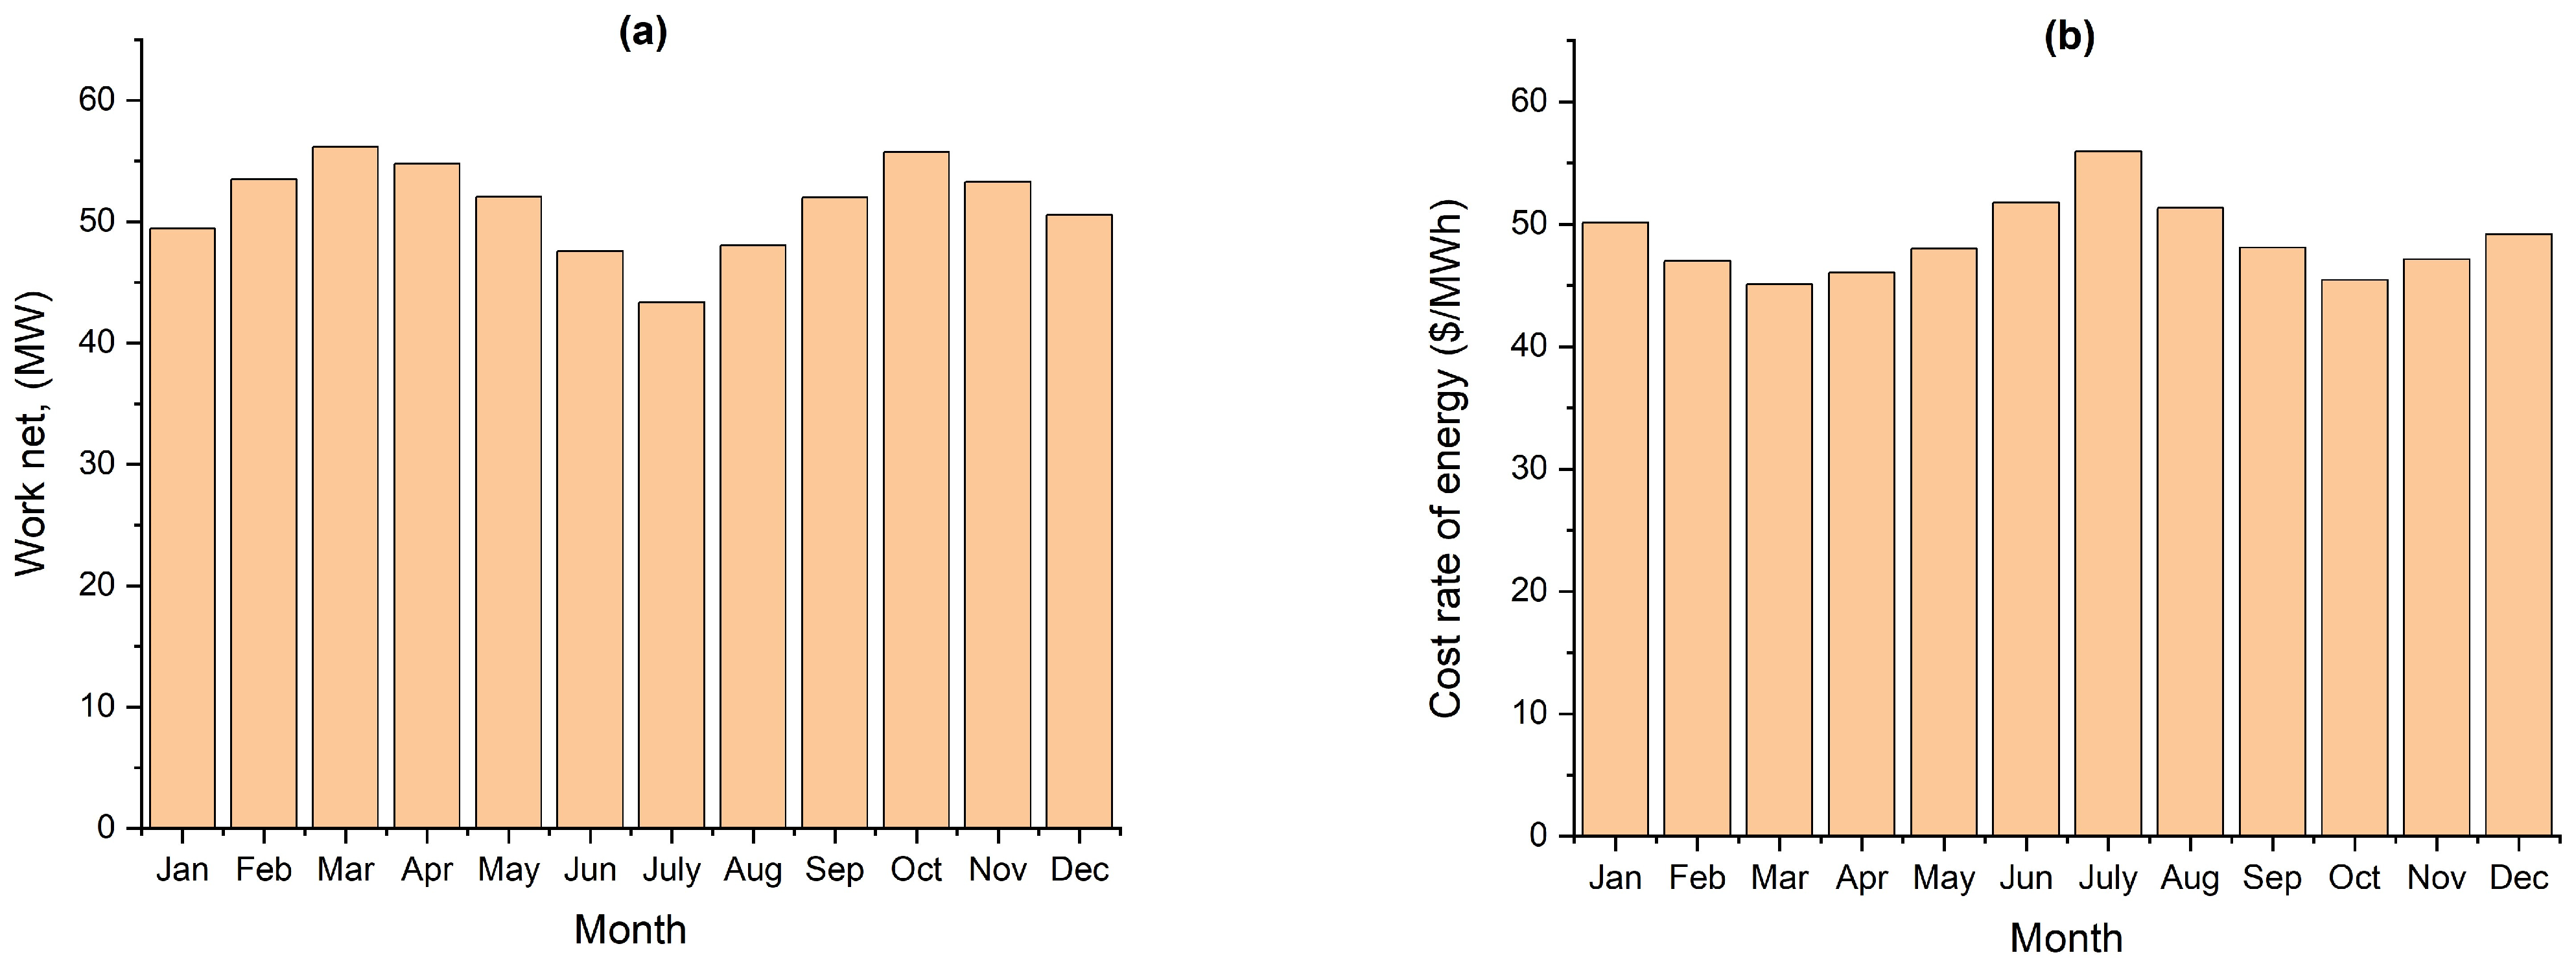
Figure 4 illustrates the significant impact of monthly solar radiation on the system’s net power output and electricity cost rate. Figure 4a shows that power generation varies with solar radiation levels, showing higher efficiency in spring and fall, with peak outputs of 56.18 MW in March and 55.72 MW in October, aligning with stronger solar radiation. Despite higher brightness in July, power output drops to its lowest at 43.35 MW, indicating a decrease in effective solar radiation. There is a notable decline in electricity production from February to August, particularly in June and July, before it begins to recover. Additionally, Figure 4b presents the evident cost fluctuations, with the highest rate in July at 55.95 USD/MWh, coinciding with the lowest net power output, and the lowest cost in March at 45.11 USD/MWh. Costs generally rise from March, peak in July, and then decrease, though they do not return to early spring levels. This pattern implies that the higher costs in July may be due to inefficiencies in power generation caused by reduced solar irradiation.
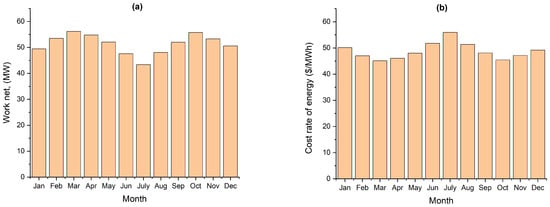
Figure 4.
Monthly variations in the system’s performance and cost: (a) net power output and (b) system’s electricity cost rate.
4.3. Parametric Analysis
This part assesses the effects of several factors, including boiler pinch point, extraction ratios for the high-pressure turbine (HPT) and intermediate-pressure turbine (IPT), condenser temperature, and the pressure at the inlet of the HPT on the performance, cost, and environmental impact of the developed system.
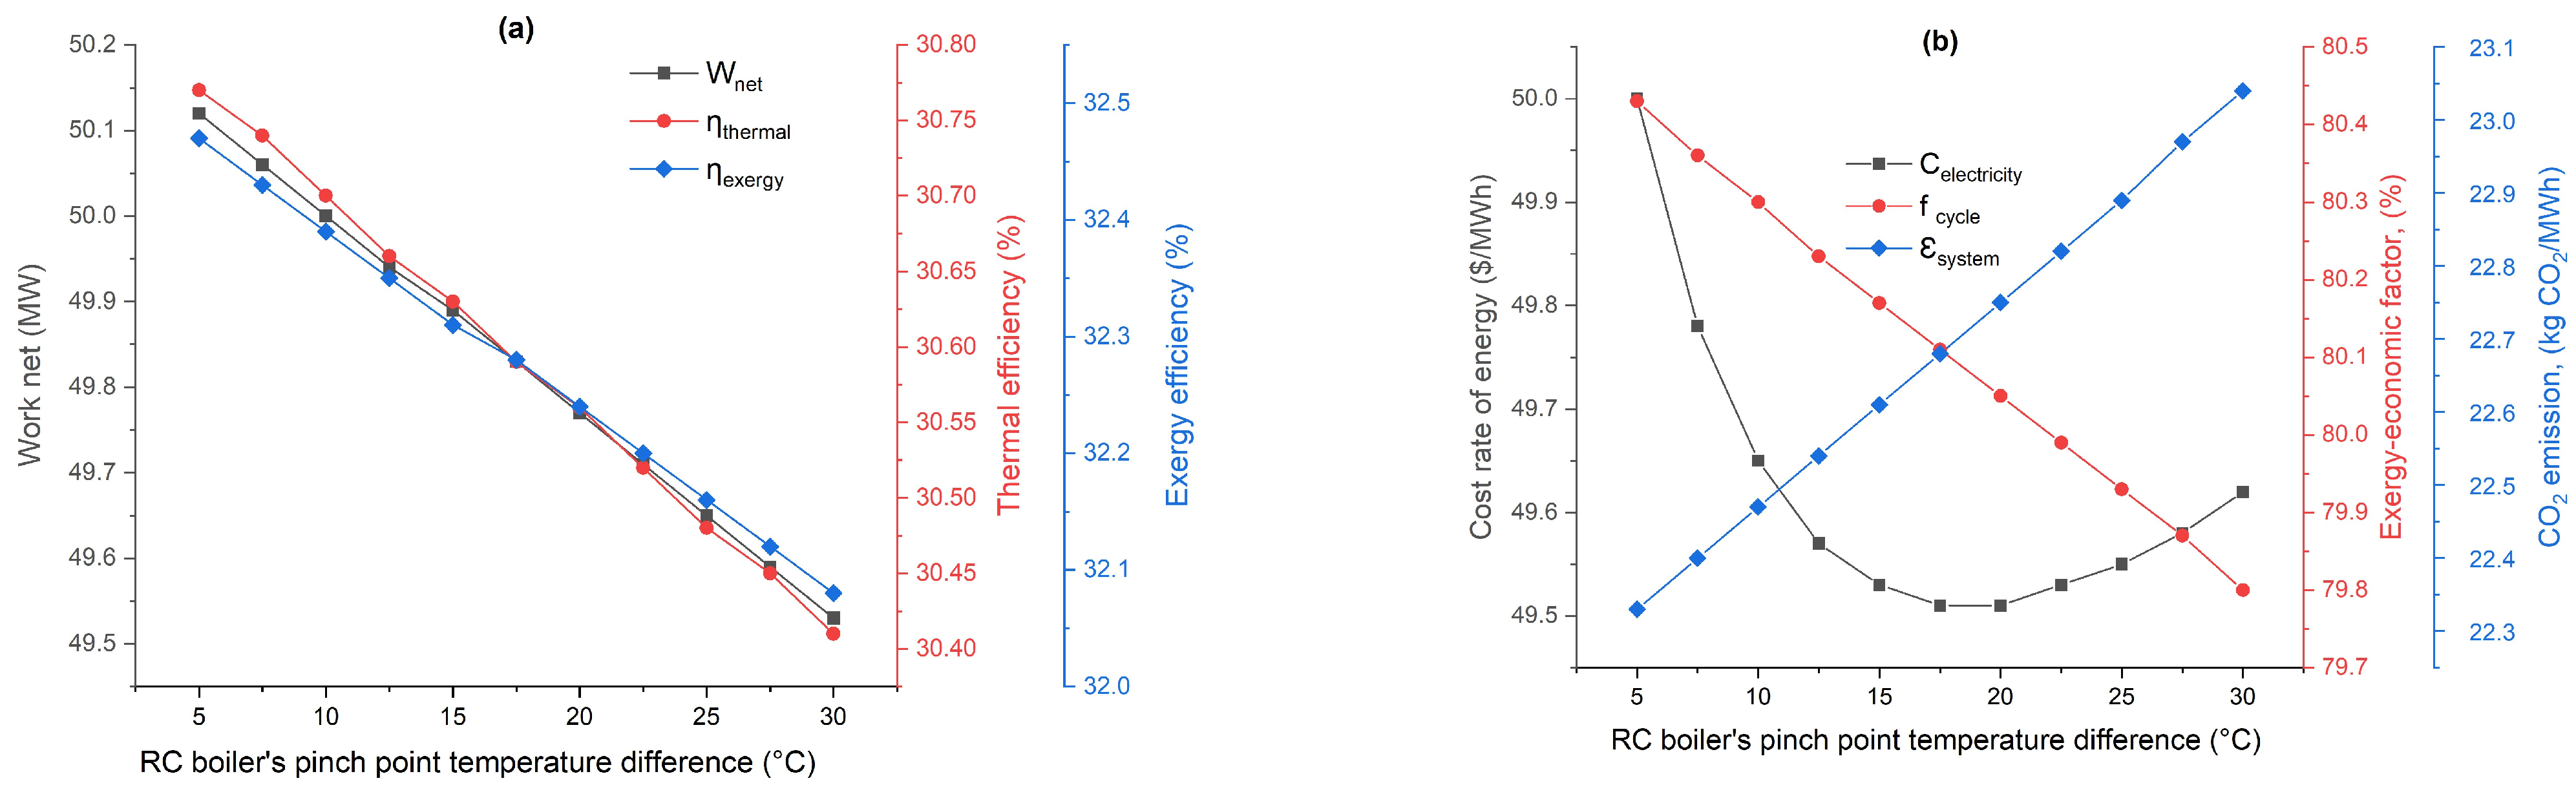
Figure 5 provides a detailed examination of how the pinch point temperature difference in the Rankine cycle (RC) boiler influences a proposed energy system’s performance, economic cost, and environmental impact. The findings illustrate that increasing the pinch point temperature difference in the RC boiler leads to reduced power output, decreased efficiencies, higher costs, and an increased carbon footprint, negatively impacting the proposed system’s performance and environmental sustainability. Figure 5a reveals that, as the pinch point temperature difference increases from 5 °C to 30 °C, there is a slight decrease in the network output from 50.12 MW to 49.53 MW. This trend suggests a diminishing power generation capability as the temperature difference increases. Both efficiencies decrease marginally as the pinch point temperature difference increases. Thermal efficiency drops from 30.77% to 30.41%, and exergy efficiency from 32.47% to 32.08%. Figure 5b shows that the cost of electricity slightly fluctuates, generally decreasing to a minimum point before beginning to increase with higher pinch point temperatures, indicative of reduced economic efficiency. Also, the exergoeconomic factor percentage slightly decreases, suggesting that the system becomes less economically viable as the pinch point temperature increases. The carbon footprint, measured in kg /MWh, also increases with the pinch point temperature difference, suggesting a negative environmental impact.
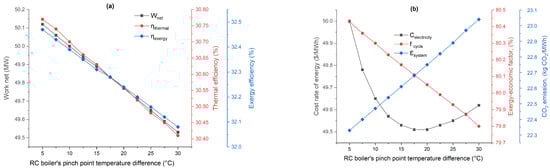
Figure 5.
Proposed system’s performance, economic cost, and environmental impact relative to the RC boiler’s pinch point temperature difference: (a) net power output and efficiencies and (b) economic cost and environmental impact.
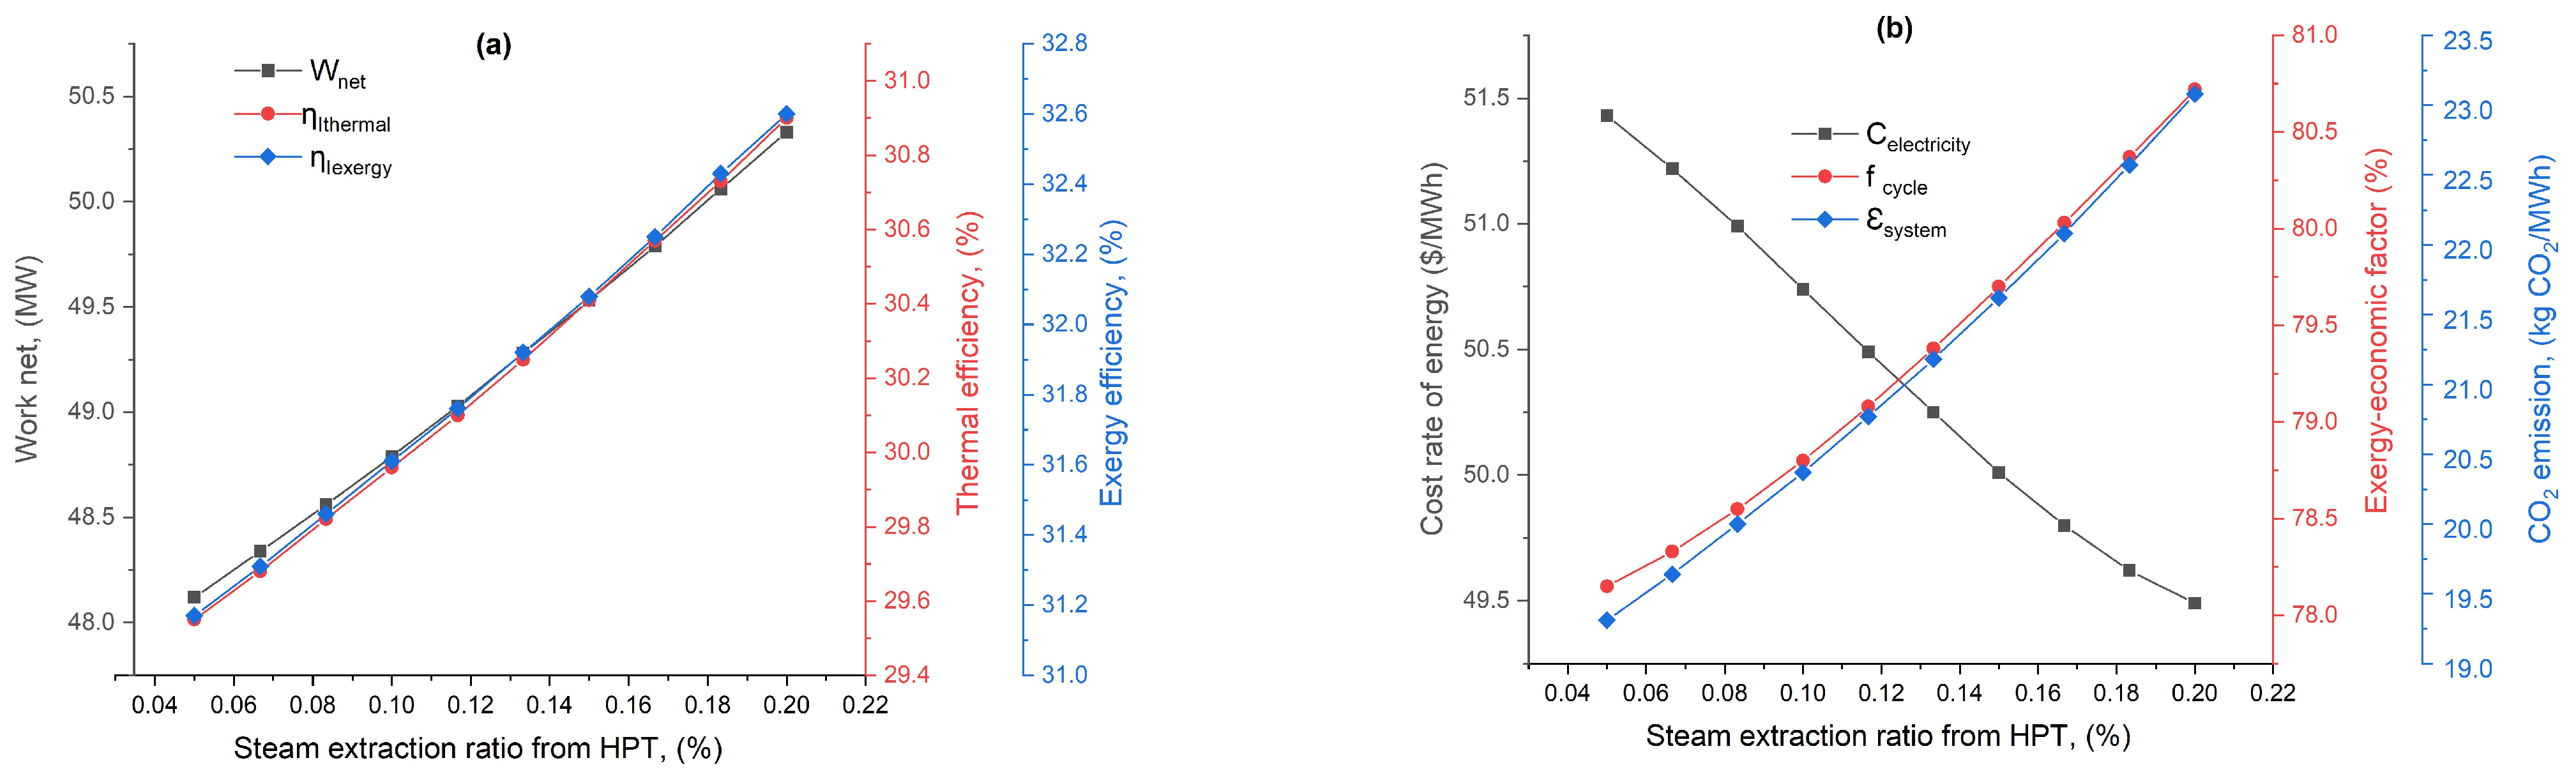
Figure 6 demonstrates a comprehensive analysis of the performance, cost, and environmental impact of a proposed solar triple combined cycle system with steam extraction from the high-pressure turbine (HPT). The variables studied include net power output, thermal efficiency, exergy efficiency, cost of electricity, exergoeconomic factor, and carbon footprint. Figure 6a demonstrates a clear trend. As the steam extraction ratio increases, there is a corresponding increase in net power output from 48.12 MW at a 0.05 steam extraction ratio to 50.33 MW at a 0.2 ratio. Both thermal and exergy efficiencies exhibit similar upward trends, suggesting enhanced system efficiency with increased steam extraction. This is presumably due to the higher mass flow rate and increased enthalpy at the boiler inlet, which effectively elevates the output power generated by the turbines. Economically, the cost of electricity decreases as the steam extraction ratio increases, which reflects improved system efficiency translating into cost savings, as seen in Figure 6b. The exergoeconomic factor also shows improvement. The carbon footprint increases with the steam extraction ratio, indicating a direct relationship between enhanced system performance and increased emissions.
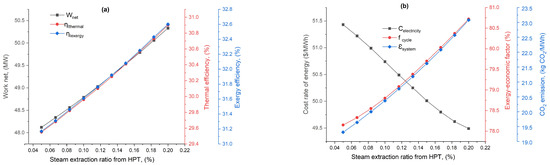
Figure 6.
Proposed system’s performance, economic cost, and environmental impact as a function of HPT extraction ratio: (a) net power output and efficiencies and (b) economic cost and environmental impact.
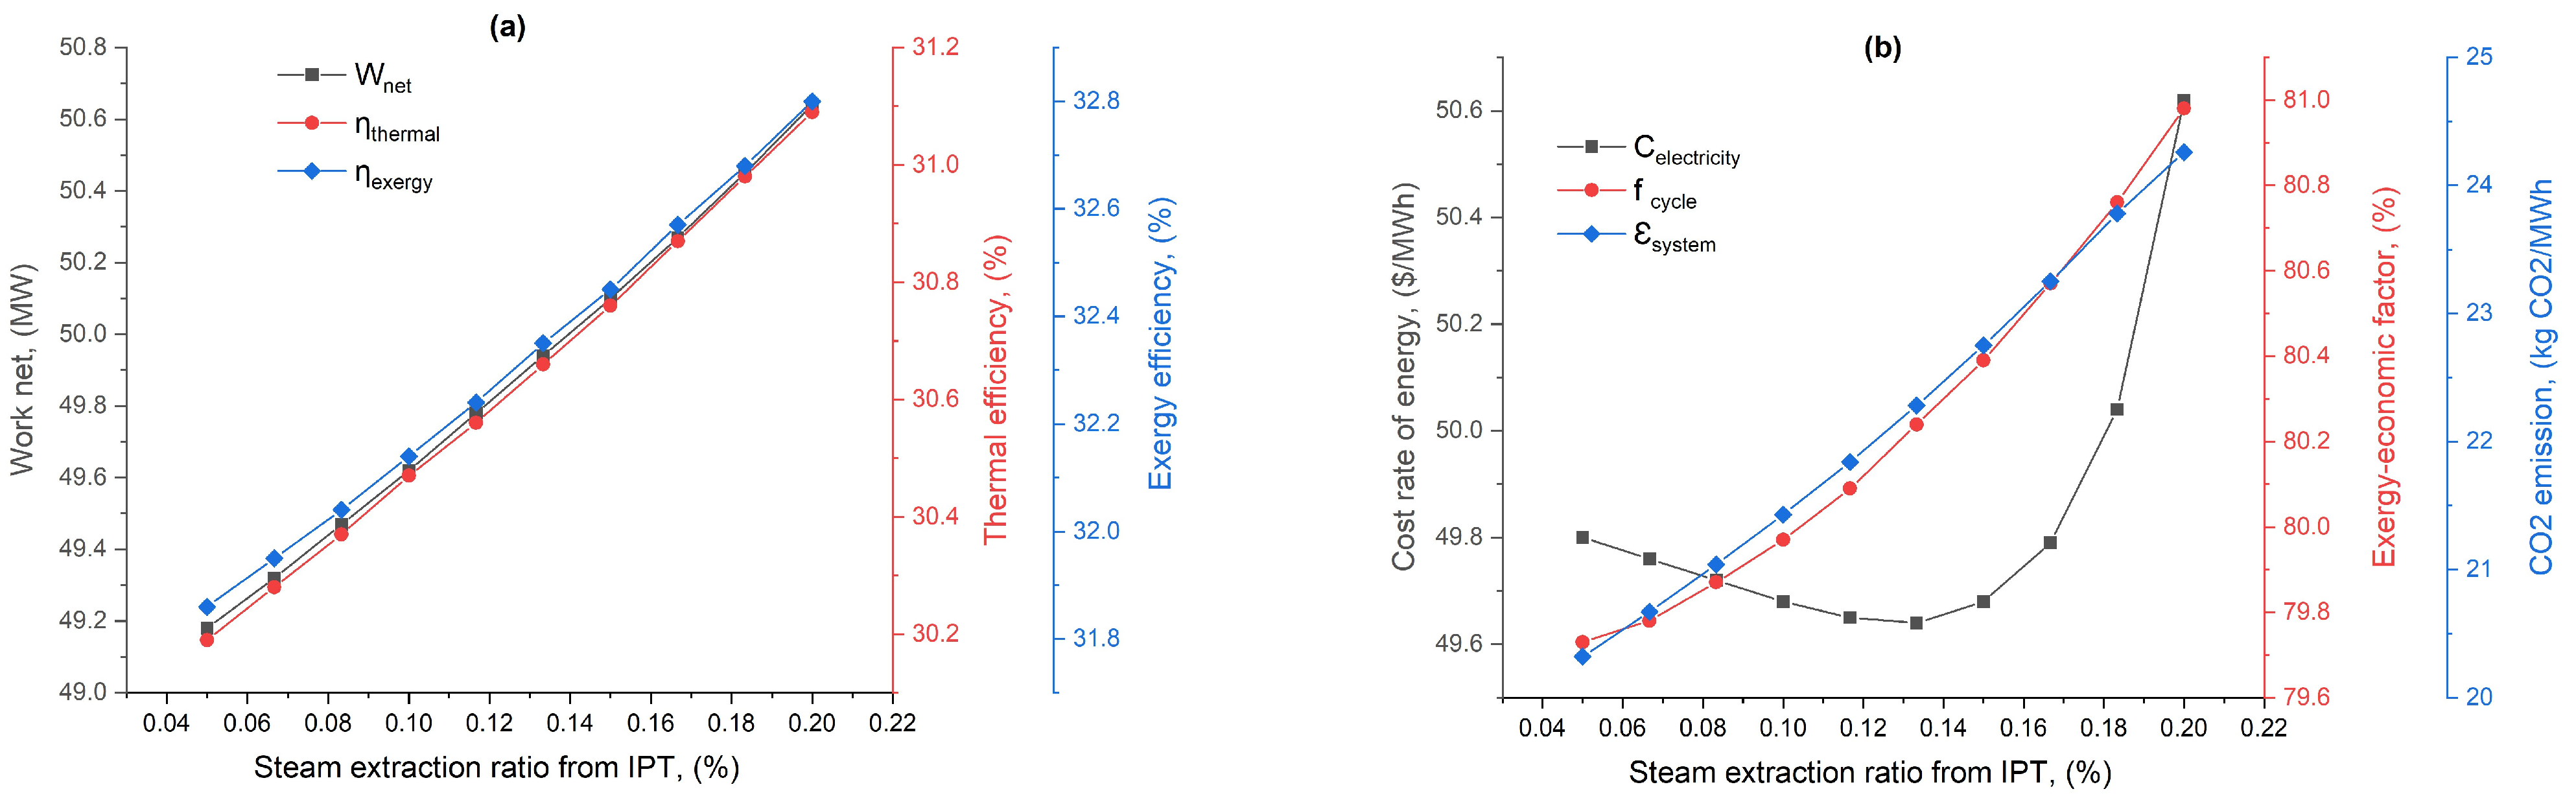
Figure 7 shows the impact of increasing steam extraction from the intermediate-pressure turbine () on various performance indicators, including net power output, thermal and exergy efficiencies, electricity cost, geoeconomic factor, and emission. Figure 7a presents that, as the steam extraction ratio escalates from 0.05 to 0.20, the system’s net power output increases from 49.18 MW to 50.64 MW, indicating improved conversion efficiencies. This enhancement in both thermal and exergy efficiencies suggests that the system becomes increasingly effective at utilizing thermal energy, directly impacting the overall energy output. According to the cost results depicted in Figure 7b, an anomalous pattern is observed. As the steam extraction ratio increases, the cost of electricity decreases initially and reaches its lowest point at a 0.20 extraction ratio, i.e., 168.3 USD/MWh. However, after that, the cost starts to rise again. The exergoeconomic factor shows improvement as the steam extraction ratio increases. This factor increases from 49.8% at a steam extraction ratio 0.05 to 50.62% at 0.20. The findings show a slight upward trend in emissions as steam extraction increases. The emissions rise from 79.73 kg /MWh at a steam extraction ratio 0.05 to 80.98 kg /MWh at 0.20.
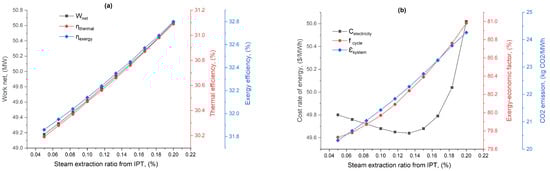
Figure 7.
Proposed system’s performance, economic cost, and environmental impact as a function of LPT extraction ratio: (a) net power output and efficiencies and (b) economic cost and environmental impact.
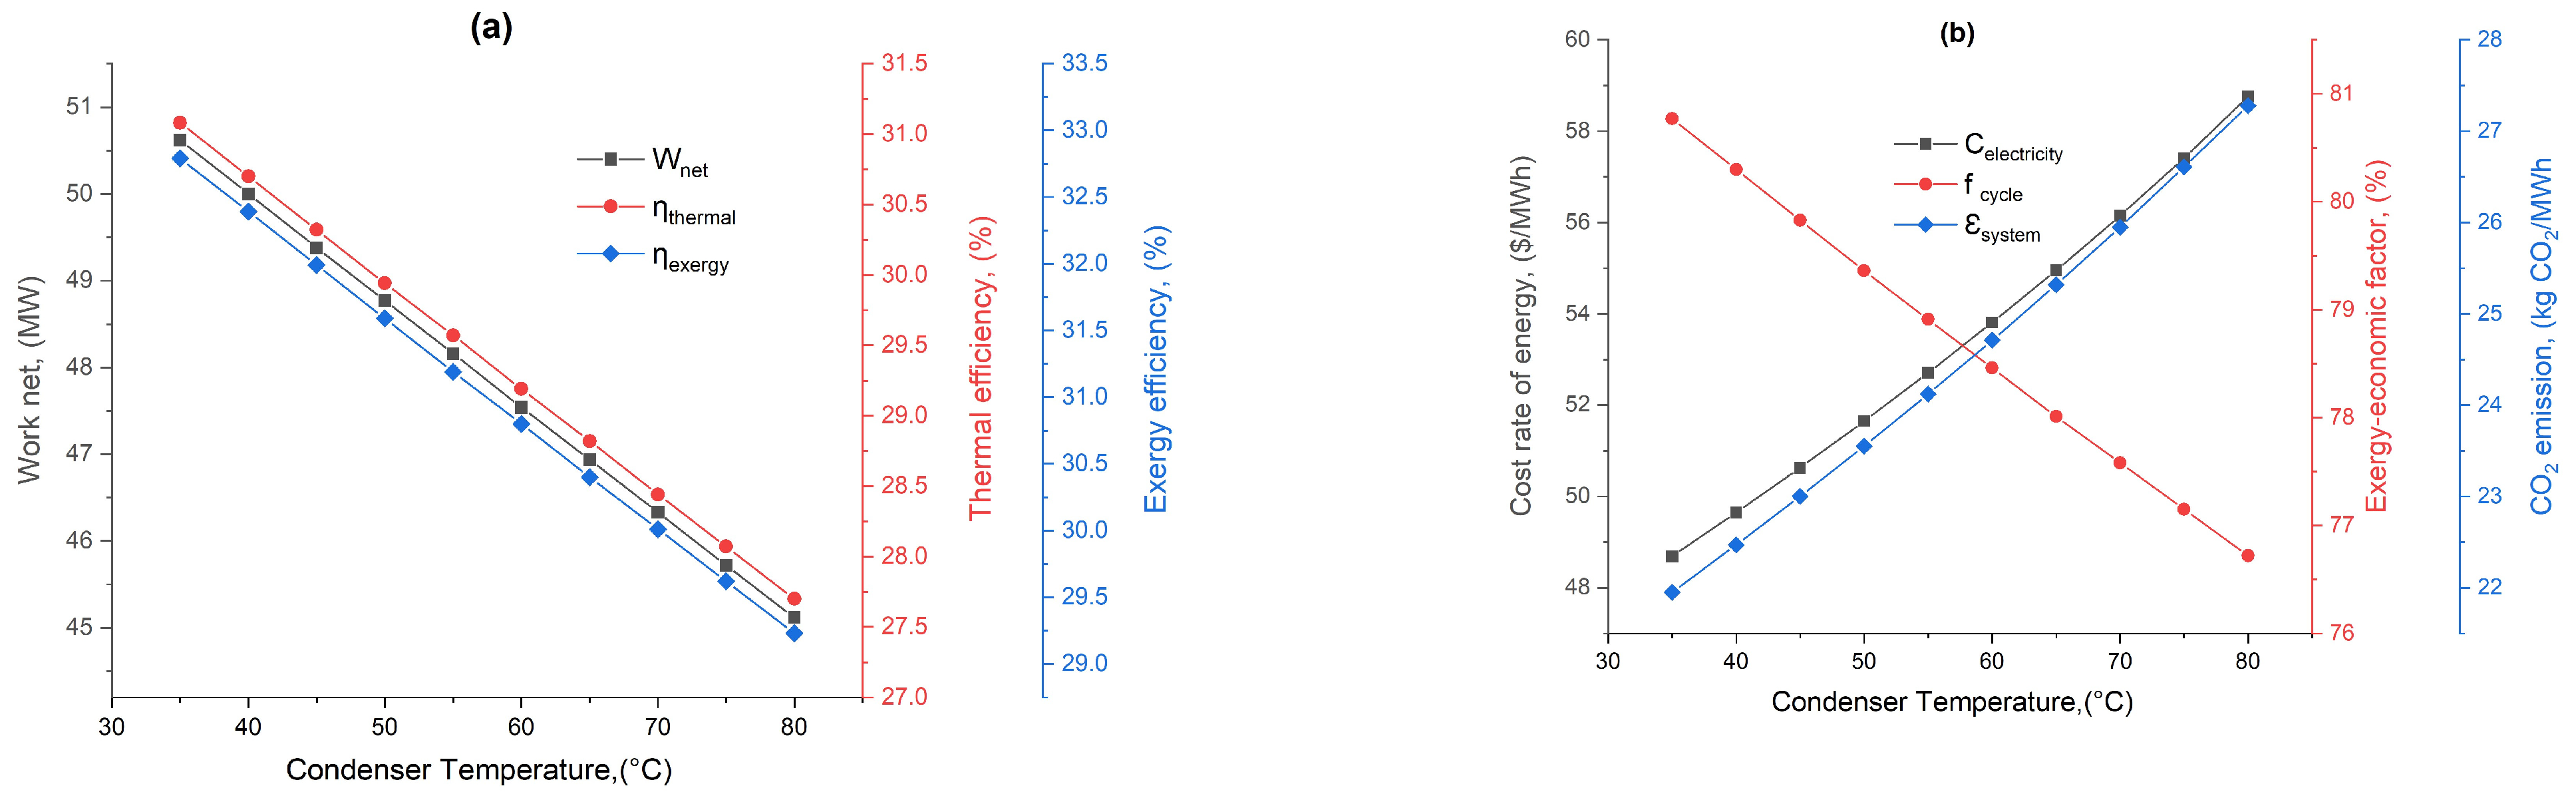
Figure 8 emphasizes the critical impact of condenser temperature on the power generation system’s efficiency, cost, and environmental footprint. Higher condenser temperatures lead to less efficient, more costly, and environmentally unfriendly power generation. Figure 8a illustrates that the network output consistently decreases as the condenser temperature rises, indicating a loss of power generation efficiency due to less effective steam expansion in the LPT. Both efficiencies decline as the condenser temperature increases, illustrating the thermodynamic principle that higher heat sink temperatures lead to lower cycle efficiencies. Figure 8b shows the cost increases with the condenser temperature, suggesting that less efficient operation leads to higher production costs. The exergoeconomic factor worsens (increases) with higher condenser temperatures, reflecting less optimal economic performance relative to the energy quality consumed. The carbon footprint increases as the system becomes less efficient, indicating a direct environmental impact of operational conditions.
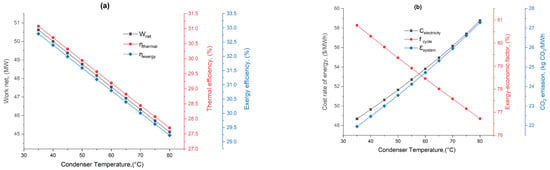
Figure 8.
Proposed system’s performance, economic cost, and environmental impact as a function of condenser temperature: (a) net power output and efficiencies and (b) economic cost and environmental impact.
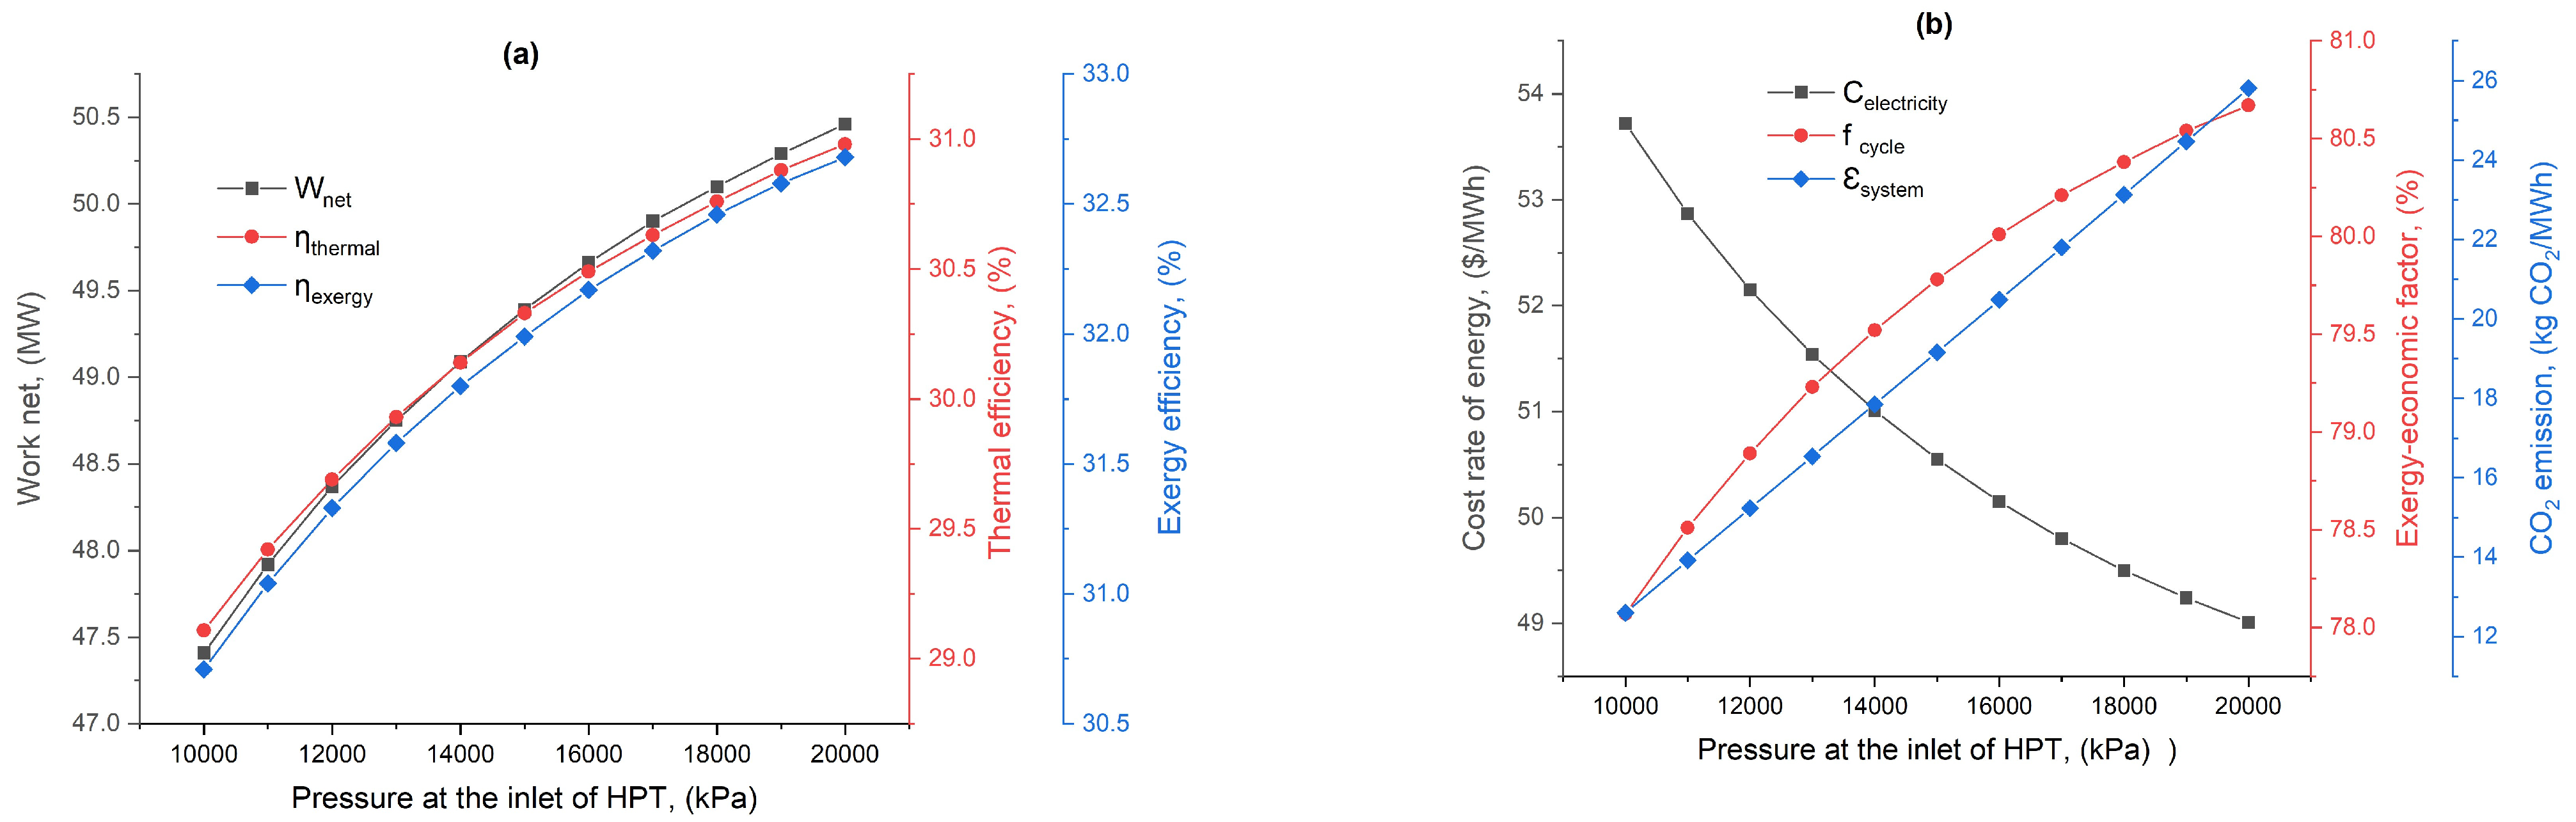
Figure 9 underscores the relationship between HPT inlet pressure and system performance metrics, cost, and environmental footprint. It shows the inverse relationship between power output and electricity cost, confirming that higher pressures enhance power generation and lower operational costs. This figure covers a range of pressures from 10,000 kPa to 20,000 kPa. Figure 9a presents a steady increase in Wnet from 47.41 MW at 10,000 kPa to 50.46 MW at 20,000 kPa, underscoring that higher inlet pressures enhance the turbine’s power output. Both efficiencies exhibit a progressive improvement as the pressure increases. Starting at 29.11% for thermal and 30.71% for exergy efficiency at 10,000 kPa, these metrics reach 30.98% and 32.68%, respectively, at 20,000 kPa. Figure 9b demonstrates the cost decreases from 53.72 USD/MWh to 49.24 USD/MWh as pressure rises. The exergoeconomic factor slightly increases, implying a trade-off where cost efficiency gains are somewhat offset by higher exergy utilization costs. The carbon footprint rises from 12.6 to 24.47 kg /MWh as pressure increases, a significant consideration for environmental impact assessments.
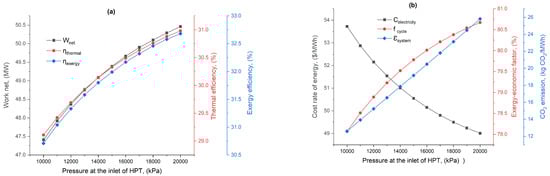
Figure 9.
Proposed system’s performance, economic cost, and environmental impact as a function of pressure at the beginning of HPT: (a) net power output and efficiencies and (b) economic cost and environmental impact.
5. Conclusions
Diminishing fossil fuel resources, concerns over greenhouse effects, the urgent need to boost power generation in Yemen, and policies aimed at enhancing thermal power plant efficiency all underscore the necessity for adopting solar power plants. Moreover, Aden’s geographical positioning makes it ideal for harnessing solar energy, emphasizing the need for further research and investment in this sector. This study employs thermodynamic, exergoeconomic, and environmental evaluations to assess the performance of the SPRC system. This system is designed to produce a 50 MW solar-powered Rankine cycle with thermal energy storage for Aden’s conditions in Yemen, which is experiencing frequent outages and supply shortages. Each component of the proposed system undergoes a rigorous thermoeconomic analysis. This research examines many factors, including the boiler’s pinch point temperature, steam extraction ratios, condenser temperature, and HPT inlet pressures, to identify essential possibilities and difficulties that might substantially impact the system’s performance, energy cost, and carbon footprint. The key findings of this research are summarized as follows:
- This study successfully combines a parabolic trough solar collector (PTC) with a Rankine cycle (RC) heat engine, resulting in a net power production of 50 MW. The energy efficiency and exergy efficiency of the system are 32.4% and 30.7%, respectively. In economic terms, the system has a competitive cost of 50.19 USD/MWh and a strong exergoeconomic factor of 79.43%. This indicates a well-balanced strategy that combines cost-effectiveness with system efficiency.
- Environmentally, the system stands out by producing a relatively low carbon footprint of 22.47 kg/MWh, demonstrating its potential to mitigate emissions compared with conventional power systems substantially.
- Increasing the pinch point temperature reduces power output and thermal and exergy efficiencies. This impairs performance, reduces the exergoeconomic factor, and increases the carbon footprint.
- Higher steam extraction ratios boost power generation and system efficiencies and lower power costs but slightly increase CO2 emissions, highlighting a trade-off between performance and environmental impact.
- Higher condenser temperatures decrease power production and efficiencies and increase energy costs and CO2 emissions, making lower temperatures preferable for economic and environmental efficiency.
- Higher HPT inlet pressures increase power output and efficiency while lowering electricity costs and rising CO2 emissions.
In summary, the findings of this study are vital for Aden, Yemen, as they investigate a solar-powered Rankine cycle to tackle the region’s acute electricity deficit. This approach offers a sustainable solution that lessens dependence on costly imported fuels, stimulates economic development, and bolsters the integration of renewable energy while promoting environmental sustainability in Aden.
Author Contributions
The authors confirm their contributions to the paper as follows: conceptualization, all authors; methodology, A.A.; software, all authors; validation, A.A.; formal analysis, all authors; resources, A.S.A.S.; data curation, all authors; writing—original draft, A.A.; writing—review and editing, all authors. All authors have read and agreed to the published version of the manuscript.
Funding
This work was supported by the Deanship of Scientific Research, Vice Presidency for Graduate Studies and Scientific Research, King Faisal University, Saudi Arabia (Grant No. A344).
Data Availability Statement
The data presented in this study are available on request from the corresponding author.
Acknowledgments
All the authors are grateful to King Faisal University and Karabuk University for providing the software and hardware infrastructure to realize the current study.
Conflicts of Interest
The authors declare no conflicts of interest.
Nomenclature
| Symbol | |
| Solar collector area () | |
| Cost rate (USD/h) | |
| Direct normal irradiation (kWh/m2·day) | |
| Energy (kW) | |
| Exergy (kW) | |
| Thermoeconomic factor (%) | |
| h | Specific enthalpy (kJ/kg) |
| Mass flow rate (kg/s) | |
| P | Pressure (bar) |
| Heat rate (kW) | |
| T | Temperature (°C) |
| Power (kW) | |
| Z | Initial investment cost ($) |
| Greek Symbols | |
| γ | Emission conversion factor (kg/kWh) |
| η | Efficiency (%) |
| Subscripts | |
| D | Destruction |
| in | Inlet |
| k | Component |
| O | Reference state |
| out | Exit |
| q | Related to heat |
| u | Useful |
| w | Related to work |
| Abbreviations | |
| HPT | High pressure turbine |
| HTF | Heat transfer fluid |
| In | Inlet |
| IPT | Intermediate pressure turbine |
| LPT | Lower pressure turbine |
| OFWH | Open feed water heater |
| out | Outlet |
| PTC | Parabolic trough collector |
| RC | Rankine cycle |
| TST | Thermal storage tank |
References
- Sims, R.E.H. Renewable energy: A response to climate change. Sol. Energy 2004, 76, 9–17. [Google Scholar] [CrossRef]
- Bilgen, S.; Kaygusuz, K.; Sari, A. Renewable energy for a clean and sustainable future. Energy Sources 2004, 26, 1119–1129. [Google Scholar] [CrossRef]
- Hassan, Q.; Viktor, P.; JAl-Musawi, T.; Mahmood Ali, B.; Algburi, S.; Alzoubi, H.M.; Al-Jiboory, A.K.; Sameen, A.Z.; Salman, H.M.; Jaszczur, M. The renewable energy role in the global energy Transformations. Renew. Energy Focus 2024, 48, 100545. [Google Scholar] [CrossRef]
- Olabi, A.G. 100% sustainable energy. Energy 2014, 77, 1–5. [Google Scholar] [CrossRef]
- Lund, H. Renewable energy strategies for sustainable development. Energy 2007, 32, 912–919. [Google Scholar] [CrossRef]
- Rosen, M.A.; Dincer, I. Exergoeconomic analysis of power plants operating on various fuels. Appl. Therm. Eng. 2003, 23, 643–658. [Google Scholar] [CrossRef]
- Rosen, M.A. Exergy Analysis of Energy Systems. In Encyclopedia of Energy; Cleveland, C.J., Ed.; Elsevier: New York, NY, USA, 2004; pp. 607–621. [Google Scholar] [CrossRef]
- Ozokwelu, D.; Porcelli, J.; Akinjiola, P. Exergy Analysis: A Powerful Tool for Identifying Process Inefficiencies in the US Chemical Industry; Chemical Bandwidth Study Summary Report; US Department of Energy: Washington, DC, USA, 2006.
- Schnatbaum, L. Solar thermal power plants. Eur. Phys. J. Spec. Top. 2009, 176, 127–140. [Google Scholar] [CrossRef]
- Al-Elanjawy, Y.A.H.; Yilmaz, M. Solar-Assisted Carbon Capture Process Integrated with a Natural Gas Combined Cycle (NGCC) Power Plant—A Simulation-Based Study. Processes 2024, 12, 613. [Google Scholar] [CrossRef]
- Desai, N.B.; Bandyopadhyay, S. Thermo-economic comparisons between solar steam Rankine and organic Rankine cycles. Appl. Therm. Eng. 2016, 105, 862–875. [Google Scholar] [CrossRef]
- Sachdeva, J.; Singh, O. Thermodynamic analysis of solar powered triple combined Brayton, Rankine and organic Rankine cycle for carbon free power. Renew. Energy 2019, 139, 765–780. [Google Scholar] [CrossRef]
- Mirjavadi, K.; Pourfayaz, F.; Pourmoghadam, P.; Kasaeian, A. A comparison of using organic Rankine and Kalina cycles as bottom cycles in a solar-powered steam Rankine cycle. Energy Sci. Eng. 2022, 10, 2714–2731. [Google Scholar] [CrossRef]
- Shi, X.; Song, J.; He, Q.; Liu, Y.; Fu, H.; Cui, S. A novel liquefied air energy storage system with solar energy and coupled Rankine cycle and seawater desalination. J. Energy Storage 2023, 61, 106759. [Google Scholar] [CrossRef]
- Porto-Hernandez, L.A.; Vargas, J.V.C.; Munoz, M.N.; Galeano-Cabral, J.; Ordonez, J.C.; Balmant, W.; Mariano, A. Fundamental optimization of steam Rankine cycle power plants. Energy Convers. Manag. 2023, 289, 117148. [Google Scholar] [CrossRef]
- Esfandiari, M.; Pourfayaz, F.; Kasaeian, A.; Gholami, A. Energy–exergy analysis for performance improvement of Brayton–Rankine combined cycle system by utilizing a solar absorption refrigeration cycle (case study: Kahnuj Combined Cycle Power Plant). Energy Sci. Eng. 2024, 12, 201–214. [Google Scholar] [CrossRef]
- Zhou, J.; Huang, D.; Zhou, L. Modeling and thermal economy analysis of the coupled system of compressed steam energy storage and Rankine cycle in thermal power plant. Energy 2024, 291, 130309. [Google Scholar] [CrossRef]
- Assareh, E.; Hoseinzadeh, S.; Ghersi, D.E.; Farhadi, E.; Keykhah, S.; Lee, M. Energy, exergy, exergoeconomic, exergoenvironmental, and transient analysis of a gas-fired power plant-driven proposed system with combined Rankine cycle: Thermoelectric for power production under different weather conditions. J. Therm. Anal. Calorim. 2023, 148, 8283–8307. [Google Scholar] [CrossRef]
- Matjanov, E.K.; Akhrorkhujaeva, Z.M. Solar repowering existing steam cycle power plants. Int. J. Thermofluids 2023, 17, 100285. [Google Scholar] [CrossRef]
- Ehtiwesh, A.; Kutlu, C.; Su, Y.; Riffat, S. Modelling and performance evaluation of a direct steam generation solar power system coupled with steam accumulator to meet electricity demands for a hospital under typical climate conditions in Libya. Renew. Energy 2023, 206, 795–807. [Google Scholar] [CrossRef]
- Sornek, K.; Jankowski, M.; Borsukiewicz, A.; Filipowicz, M. The Optimization of Steam Generation in a Biomass-Fired Micro-Cogeneration Prototype Operating on a Modified Rankine Cycle. Sustainability 2024, 16, 9. [Google Scholar] [CrossRef]
- Huang, W.; Marefati, M. Development, exergoeconomic assessment and optimization of a novel municipal solid waste-incineration and solar thermal energy based integrated power plant: An effort to improve the performance of the power plant. Process Saf. Environ. Prot. 2023, 172, 562–578. [Google Scholar] [CrossRef]
- Adibhatla, S.; Kaushik, S.C. Energy, exergy, economic and environmental (4E) analyses of a conceptual solar aided coal fired 500 MWe thermal power plant with thermal energy storage option. Sustain. Energy Technol. Assess. 2017, 21, 89–99. [Google Scholar] [CrossRef]
- Bolatturk, A.; Coskun, A.; Geredelioglu, C. Thermodynamic and exergoeconomic analysis of Çayirhan thermal power plant. Energy Convers. Manag. 2015, 101, 371–378. [Google Scholar] [CrossRef]
- Sadi, M.; Arabkoohsar, A. Exergoeconomic analysis of a combined solar-waste driven power plant. Renew. Energy 2019, 141, 883–893. [Google Scholar] [CrossRef]
- Elsafi, A.M. Exergy and exergoeconomic analysis of sustainable direct steam generation solar power plants. Energy Convers. Manag. 2015, 103, 338–347. [Google Scholar] [CrossRef]
- Moradi Nafchi, F.; Baniasadi, E.; Afshari, E.; Javani, N. Performance assessment of a direct steam solar power plant with hydrogen energy storage: An exergoeconomic study. Int. J. Hydrogen Energy 2022, 47, 26023–26037. [Google Scholar] [CrossRef]
- Elmorsy, L.; Morosuk, T.; Tsatsaronis, G. Comparative exergoeconomic evaluation of integrated solar combined-cycle (ISCC) configurations. Renew. Energy 2022, 185, 680–691. [Google Scholar] [CrossRef]
- Ahamad, T.; Parvez, M.; Lal, S.; Khan, O.; Idrisi, M.J. 4-E analysis and multiple objective optimizations of a novel solar-powered cogeneration energy system for the simultaneous production of electrical power and heating. Sci. Rep. 2023, 13, 22246. [Google Scholar] [CrossRef] [PubMed]
- Javadzadeh, E.; Baghernejad, A. Development of a hybrid solar thermal power plant with new collector field, and its thermal and exergy analyses. J. Braz. Soc. Mech. Sci. Eng. 2022, 44, 91. [Google Scholar] [CrossRef]
- Adibhatla, S.; Kaushik, S.C. Energy, exergy and economic (3E) analysis of integrated solar direct steam generation combined cycle power plant. Sustain. Energy Technol. Assess. 2017, 20, 88–97. [Google Scholar] [CrossRef]
- Talal, W.; Akroot, A. Exergoeconomic Analysis of an Integrated Solar Combined Cycle in the Al-Qayara Power Plant in Iraq. Processes 2023, 11, 656. [Google Scholar] [CrossRef]
- Talal, W.; Akroot, A. An Exergoeconomic Evaluation of an Innovative Polygeneration System Using a Solar-Driven Rankine Cycle Integrated with the Al-Qayyara Gas Turbine Power Plant and the Absorption Refrigeration Cycle. Machines 2024, 12, 133. [Google Scholar] [CrossRef]
- Dabwan, Y.N.; Pei, G. A novel integrated solar gas turbine trigeneration system for production of power, heat and cooling: Thermodynamic-economic-environmental analysis. Renew. Energy 2020, 152, 925–941. [Google Scholar] [CrossRef]
- Zahedi, R.; Ahmadi, A.; Dashti, R. Energy, exergy, exergoeconomic and exergoenvironmental analysis and optimization of quadruple combined solar, biogas, SRC and ORC cycles with methane system. Renew. Sustain. Energy Rev. 2021, 150, 111420. [Google Scholar] [CrossRef]
- Abdel Dayem, A.M.; Al-Ghamdi, A.S. Transient performance of direct steam generation solar power plants. Int. J. Energy Res. 2017, 41, 1070–1078. [Google Scholar] [CrossRef]
- AL-TAMIMI, A. Exergoeconomic Analysis of a Direct Steam Solar Power Plant in Yemen. Master Thesis, Karbuk University, Karabük, Turkey, 2023. [Google Scholar]
- Besevli, B.; Kayabasi, E.; Akroot, A.; Talal, W.; Alfaris, A.; Assaf, Y.H.; Nawaf, M.Y.; Bdaiwi, M.; Khudhur, J. Technoeconomic Analysis of Oxygen-Supported Combined Systems for Recovering Waste Heat in an Iron-Steel Facility. Appl. Sci. 2024, 14, 2563. [Google Scholar] [CrossRef]
- Alsunousi, M.; Kayabasi, E. Techno-economic assessment of a floating photovoltaic power plant assisted methanol production by hydrogenation of CO2 captured from Zawiya oil refinery. Int. J. Hydrogen Energy 2024, 57, 589–600. [Google Scholar] [CrossRef]
- Soltani, S.; Mahmoudi, S.M.S.; Yari, M.; Morosuk, T.; Rosen, M.A.; Zare, V. A comparative exergoeconomic analysis of two biomass and co-firing combined power plants. Energy Convers. Manag. 2013, 76, 83–91. [Google Scholar] [CrossRef]
- Yüksel, Y.E. Thermodynamic assessment of modified Organic Rankine Cycle integrated with parabolic trough collector for hydrogen production. Int. J. Hydrogen Energy 2018, 43, 5832–5841. [Google Scholar] [CrossRef]
- Toghyani, S.; Baniasadi, E.; Afshari, E. Thermodynamic analysis and optimization of an integrated Rankine power cycle and nano-fluid based parabolic trough solar collector. Energy Convers. Manag. 2016, 121, 93–104. [Google Scholar] [CrossRef]
- Aghaziarati, Z.; Aghdam, A.H. Thermoeconomic analysis of a novel combined cooling, heating and power system based on solar organic Rankine cycle and cascade refrigeration cycle. Renew. Energy 2021, 164, 1267–1283. [Google Scholar] [CrossRef]
- Bellos, E.; Tzivanidis, C. Investigation of a hybrid ORC driven by waste heat and solar energy. Energy Convers. Manag. 2018, 156, 427–439. [Google Scholar] [CrossRef]
- Akroot, A.; Namli, L.; Ozcan, H. Compared Thermal Modeling of Anode- and Electrolyte-Supported SOFC-Gas Turbine Hybrid Systems. J. Electrochem. Energy Convers. Storage 2021, 18, 011001. [Google Scholar] [CrossRef]
- Akroot, A.; Namli, L. Performance assessment of an electrolyte-supported and anode-supported planar solid oxide fuel cells hybrid system. J. Ther. Eng. 2021, 7, 1921–1935. [Google Scholar]
- Elmorsy, L.; Morosuk, T.; Tsatsaronis, G. Exergy-based analysis and optimization of an integrated solar combined-cycle power plant. Entropy 2020, 22, 655. [Google Scholar] [CrossRef] [PubMed]
- Sanaye, S.; Yazdani, M. Energy, exergy, economic and environmental analysis of a running integrated anaerobic digester-combined heat and power system in a municipal wastewater treatment plant. Energy Rep. 2022, 8, 9724–9741. [Google Scholar] [CrossRef]
- Aali, A.; Pourmahmoud, N.; Zare, V. Exergoeconomic analysis and multi-objective optimization of a novel combined flash-binary cycle for Sabalan geothermal power plant in Iran. Energy Convers. Manag. 2017, 143, 377–390. [Google Scholar] [CrossRef]
- Sahoo, P.K. Exergoeconomic analysis and optimization of a cogeneration system using evolutionary programming. Appl. Therm. Eng. 2008, 28, 1580–1588. [Google Scholar] [CrossRef]
- Kareem, A.F.; Akroot, A.; Abdul Wahhab, H.A.; Talal, W.; Ghazal, R.M.; Alfaris, A. Exergo–Economic and Parametric Analysis of Waste Heat Recovery from Taji Gas Turbines Power Plant Using Rankine Cycle and Organic Rankine Cycle. Sustainability 2023, 15, 9376. [Google Scholar] [CrossRef]
- Deymi-Dashtebayaz, M.; Baranov, I.V.; Nikitin, A.; Davoodi, V.; Sulin, A.; Norani, M.; Nikitina, V. An investigation of a hybrid wind-solar integrated energy system with heat and power energy storage system in a near-zero energy building-A dynamic study. Energy Convers. Manag. 2022, 269, 116085. [Google Scholar] [CrossRef]
- Assareh, E.; Kazemiani-Najafabadi, P.; Rad, E.A.; Arabkoohsar, A. Optimization of a trigeneration cooling, heating, and power system with low-temperature waste heat from 4E points of view. Energy 2023, 283, 128675. [Google Scholar] [CrossRef]
- Tehrani, S.S.M.; Taylor, R.A. Off-design simulation and performance of molten salt cavity receivers in solar tower plants under realistic operational modes and control strategies. Appl. Energy 2016, 179, 698–715. [Google Scholar] [CrossRef]

Disclaimer/Publisher’s Note: The statements, opinions and data contained in all publications are solely those of the individual author(s) and contributor(s) and not of MDPI and/or the editor(s). MDPI and/or the editor(s) disclaim responsibility for any injury to people or property resulting from any ideas, methods, instructions or products referred to in the content. |
© 2024 by the authors. Licensee MDPI, Basel, Switzerland. This article is an open access article distributed under the terms and conditions of the Creative Commons Attribution (CC BY) license (https://creativecommons.org/licenses/by/4.0/).