Article

Multi-Porous Medium Characterization Reveals Tight Oil Potential in the Shell Limestone Reservoir of the Sichuan Basin

1
Fire Command Department, China Fire and Rescue Institute, Beijing 102202, China
2
Yanchang Oilfield Seven-Mile Village Oil Extraction Plant, Ya’an 717200, China
3
Research Institute of Petroleum Exploration and Development, Beijing 100083, China
*
Author to whom correspondence should be addressed.
Processes 2024, 12(6), 1057; https://doi.org/10.3390/pr12061057
Submission received: 5 April 2024 / Revised: 6 May 2024 / Accepted: 8 May 2024 / Published: 22 May 2024
(This article belongs to the Section Energy Systems)

Abstract

:
With the continuous deepening of oil and gas exploration and development, unconventional oil and gas resources, represented by tight oil, have become research hotspots. However, few studies have investigated tight oil potential in any systematic way in the shell limestone reservoir of the Sichuan Basin. Herein, we used thin section analysis, X-ray diffraction (XRD), high-pressure mercury intrusion, low-pressure N2 and CO2 adsorption experiments, low-field nuclear magnetic resonance (NMR), focused ion beam–scanning electron microscopy (FIB-SEM), and nano-CT to characterize multi-porous media. The reservoir space controlled by nonfabric, shell, and matrix constitutes all the reservoir space for tight oil. The interconnected porosity was mainly distributed in the range of 1% to 5% (avg. 2.12%). The effective interconnected porosity mainly ranged from 0.5% to 2.0% (avg. 1.59%). The porosity of large fractures was 0.1% to 0.5% (avg. 0.21%). The porosity of isolated pores and bound oil–water pores was 0.2% to 0.8% (avg. 0.44%). The dissolved pores adjacent to fractures, the microfractures controlled by the shell, the microfractures controlled by the matrix, the isolated pores, and the intracrystalline pores constitute five independent pore-throat systems. The development of pores and fractures in shell limestone reservoirs are coupled on the centimeter–millimeter–micron–nanometer scale. Various reservoir-permeability models show continuous distribution characteristics. These findings make an important contribution to the exploration and exploitation of tight oil in shell limestone.

1. Introduction

Tight oil is an unconventional resource that is extracted from low-permeability reservoirs [1]. With the help of mature technologies and successful experience in shale gas, the United States has successively achieved large-scale commercial development of tight oil in the Bakken and Eagle Ford, the Niobrara in the Denver–Julesburg Basin, the Wolfcamp in the Permian Basin, and the Marcellus in the Appalachian Basin [2]. Mesozoic and Cenozoic shales that originated from lacustrine sedimentary environments in the Sichuan, Ordos, Songliao, Bohai Bay, Junggar, Tarim, and Qaidam Basins have broad prospects for continental tight oil exploration and exploitation [3]. However, compared to other countries, China’s tight oil production has been relatively limited due to geological challenges and constraints on technology and infrastructure [4].
In Chinese continental tight oil areas, there is a common phenomenon of “sweet spots” located adjacent to high-quality source rocks, which may contain little to no oil and even have significant water production. Tight oil reservoirs typically exhibit geological characteristics of large-scale continuous or quasi-continuous distribution. Therefore, within the distribution range adjacent to high-quality source rocks, the relatively better reservoir properties of these “sweet spots” are often targeted as favorable exploration areas for tight oil. However, exploration practices have shown that in areas where high-quality source rocks are developed, relatively good reservoirs may not necessarily contain oil at all. There are specific occurrences of “sand with no oil” or “porosity with no oil”, such as in the Yanchang Formation in the Huachi and Jiyuan areas of the Ordos Basin and the Lianggaoshan Formation in the central Sichuan Basin. In the Jurassic Sichuan Basin, the tight oil resources amount to 1.6 billion tons, with the Da’anzhai Formation accounting for 978 million tons. However, resource abundance ranges from 300 million to 1000 million t/km2, significantly differing from other tight oil basins, making it a low-abundance tight oil reservoir.
The continental sand–shale system deposited in the lacustrine–delta environment in the Sichuan Basin has attracted the attention of many geologists [5]. Since the late 1960s, oil and gas have been found in shallow lacustrine shell limestone and semi-deep lacustrine shale in the Da’anzhai Member of the central Sichuan Basin. Many shell limestone reservoirs have been found in the Penglai, Nanchong, Jinhua, Bajiao, Zhongtaishan, Lianchi, and Qiulin oilfields in the central Sichuan Basin [6]. The annual production of the Da’anzhai Member is nearly 8 × 10⁴ t, accounting for 75% of oil production in the Jurassic. While the annual oil production in the Da’anzhai Member is a main driver of production in the Jurassic, single-well production has continued to decrease, and large-scale commercial exploitation has remained depressed [7]. In 2012, Sinopec determined industrial oil and gas flow in the Da’anzhai Member by using horizontal exploration wells and then carried out a series of exploration potential evaluations. Although some wells have been tested to ascertain industrial oil and gas flow, the overall effect has not reached the expected level.
The migration distance of oil in the Da’anzhai Member is short due to its complex pore structure, low porosity, and permeability. Consequently, the shell limestone reservoir in the research area is a short-distance tight oil reservoir. Under such conditions, understanding the pore structure and reservoir-permeability mode, particularly the multi-porous medium characteristics, is crucial to improving tight oil production and implementing appropriate exploration schemes. Nevertheless, for the Da’anzhai Member, these traditional methods rely on a large amount of domain knowledge and focus on reservoir properties, fractures, diagenesis, and migration. Research on the accumulation of other areas in the same layer of the Sichuan Basin has mainly focused on source rock evaluation, reservoir characteristics, and oil and gas accumulation mechanisms. Previous studies have mainly shown that source-reservoir configuration, hydrocarbon generation and expulsion characteristics, and oil and gas filling characteristics are the key factors for hydrocarbon accumulation in tight reservoirs [8]. Su et al. explored the origin of natural gas in the Da’anzhai Member in the western part of the central Sichuan Basin [9]. The results show that the dryness coefficient of the natural gas ranges between 0.71∼0.93, and the δ13C values range between −45.3~−38.0‰ in methane, −32.0~−25.6‰ in ethane, and −30.0∼−25.3‰ in propane. However, this study mainly concentrates on the geochemical characteristics and quantitative calculation of natural gas in the study area. Xu et al. analyzed the controlling factors and dynamic formation models of organic matter accumulation for the Da’anzhai Member in the central Sichuan Basin [10]. These findings reveal that small pores (3–5 nm) make a dominant contribution to the nanoscale storage space. However, studies have characterized the control mechanism of nanoscale pores, not on combinations with production yield. Xu et al. quantitatively investigated the characteristics and control mechanism of nanoscale pores in the lacustrine tight carbonates of the Da’anzhai Member in the central Sichuan Basin [11]. The mechanisms of lacustrine shale paleoenvironment and mineral are discussed. However, the main focus of this article is on shale reservoirs, and there is no systematic discussion of the shell limestone reservoir carbonate. Xu et al. described the fractal characteristics of the lacustrine tight carbonate reservoirs in the Da’anzhai Member in the central Sichuan Basin [6]. An accumulation of lacustrine organic matter was studied using geochemical methods. However, studies have mainly focused on the controlling factors and dynamical formation models of lacustrine organic matter accumulation, not discussed the multi-porous characterization.
The lacustrine Jurassic shell limestone reservoir in the Sichuan Basin is a typical ultra-low-porosity tight reservoir, characterized by thick-bedded-to-blocky shell limestone, shell limestone and mudstone, mudstone intercalated with thin layers of shell limestone, and mudstone interbedded with sandstone, among other combinations of lithologies and facies. Earlier studies primarily focused on the sedimentary facies and reservoir characteristics of the shell limestone, elucidating the evolution and distribution patterns of high-energy shell shoals. It was noted that the distribution of oil and gas is not controlled by structural traps but exhibits a “large-area oil-bearing” characteristic, closely related to high productivity and fracture communication as well as natural gas driving. With the successive production of tens of thousands of tons of crude oil from thin-bedded shell limestone, the exploration focus of the Jurassic has gradually shifted towards tight oil and gas. Currently, reservoir evaluation of the shell limestone is in a qualitative-to-semi-quantitative stage, which fails to meet the requirements for refined exploration and development. Although the Da’anzhai Member shell limestone belongs to ultra-tight reservoirs, more than 130 wells have emerged with cumulative production exceeding 10,000 t, indicating a need for further research on porous medium characteristics. Both the domestic and international exploration and development practices for tight oil reveal that the scale of porous medium characteristics is essential for stable production. Therefore, for the ultra-tight shell limestone of the Da’anzhai Member in the Sichuan Basin, determining the existence of relatively high-quality porous media and identifying and predicting them are key aspects of conducting tight oil exploration and development.
Shell limestone reservoirs are characterized by a complex pore structure, while matrices have low petrophysical properties, making them difficult to use as reservoirs. The primary recovery rate of tight oil is low [12]. All these factors lead to pessimistic exploitation prospects, resulting in gradual declines in production. The causes of production continuing to decrease have been the subject of intense debate within the scientific community. Knowledge related to multi-porous media, such as reservoir permeability, and their contributions to tight oil production remains scarce for the Da’anzhai Member. Under this scenario, new insight into reservoir capacity and multi-porous media throughout the Da’anzhai Member helps to address a fundamental gap in understanding reservoir-permeability models and pore-throat systems—all of which have substantial implications for the tight oil production of shell limestone reservoirs. Recent progress in using FIB-SEM, nano-CT, and NMR makes it possible to characterize multi-porous media and explore how pore-throat systems influence tight oil production through an experimental approach. However, the majority of prior investigations have concentrated on marine shales, with limited utilization of such experimental methodologies for evaluating the tight oil within the Da’anzhai Member [13,14]. Second, and more intriguingly, shell limestone reservoirs are more easily affected by reservoir space and capacity and multi-porous media than marine shales and differ in terms of their reservoir-permeability models and pore-throat systems. Thus, understanding how multi-porous media regulate tight oil production in shell limestone reservoirs is of substantial interest for unconventional hydrocarbon sources.
Macro-CT can be used to comprehensively scan larger cores and obtain representative information. Typically, by using macro-CT, the statistical distributions and connectivity information of porosity can be obtained. Microfocus and nano-CT can identify micrometer- or nanometer-scale pores and obtain pore throat count and connectivity through pore network reconstruction. SEM can directly observe the surface of centimeter-scale cores and is the most intuitive method for the microscopic analysis of rocks. It can identify pores at three scales: millimeter, micrometer, and nanometer, which is of great significance for describing pore characteristics such as size, shape, and distribution patterns. It is generally acknowledged that a comprehensive set of results can help to improve the fundamental understanding of the development potential of tight oil. In the past, the related research on the medium-porosity characteristics of the shell limestone reservoirs in the Da’anzhai Member of the central Sichuan Basin was relatively weak. Focused on these problems and contradictions, tentative research was conducted to correlate the reservoir-permeability mode and features, pore-throat systems, permeability ability, and exploitation potential.
However, to achieve industrial oil flow in typical tight oil areas, horizontal wells combined with large-scale hydraulic fracturing techniques are required. Nevertheless, in conditions where the aforementioned technologies have not been employed, wells in the study area have been producing oil continuously for over 20 years. In order to analyze the reasons for the sustained production of tight reservoirs in this area without the support of key development technologies for tight oil, various techniques such as core analysis, thin section identification, SEM, mercury injection experiments, nano-CT, and isothermal adsorption were utilized. These techniques were employed to classify the rock types and reservoir space types of the Da’anzhai Member reservoir, and to study the characteristics of various reservoir spaces. Ultimately, the impact of different features on tight oil development was analyzed. Our present work illustrates the key challenges faced in developing an effective development process and paves the way for a more accurate evaluation of tight oil accumulation in geologic systems. Our approach highlights that the reservoir-permeability model in shell limestone bears promising prospects for tight oil resources, prompting an increase in oil production in the Sichuan Basin. These results promise new opportunities for the efficient evaluation of shell limestone reservoirs and are capable of broadening our understanding of production dynamics and uncertainties in tight oil resources. This paper is organized as follows: Section 2 describes the geological setting of the Sichuan Basin. In Section 3, experiments with material from the Sichuan Basin are described. The results of these experiments are presented in Section 4. Section 5 discusses the reservoir space and capacity and the multi-porous medium for shell limestone, followed by a reservoir-permeability model for shell limestone. Conclusions drawn from the study are presented in Section 6.

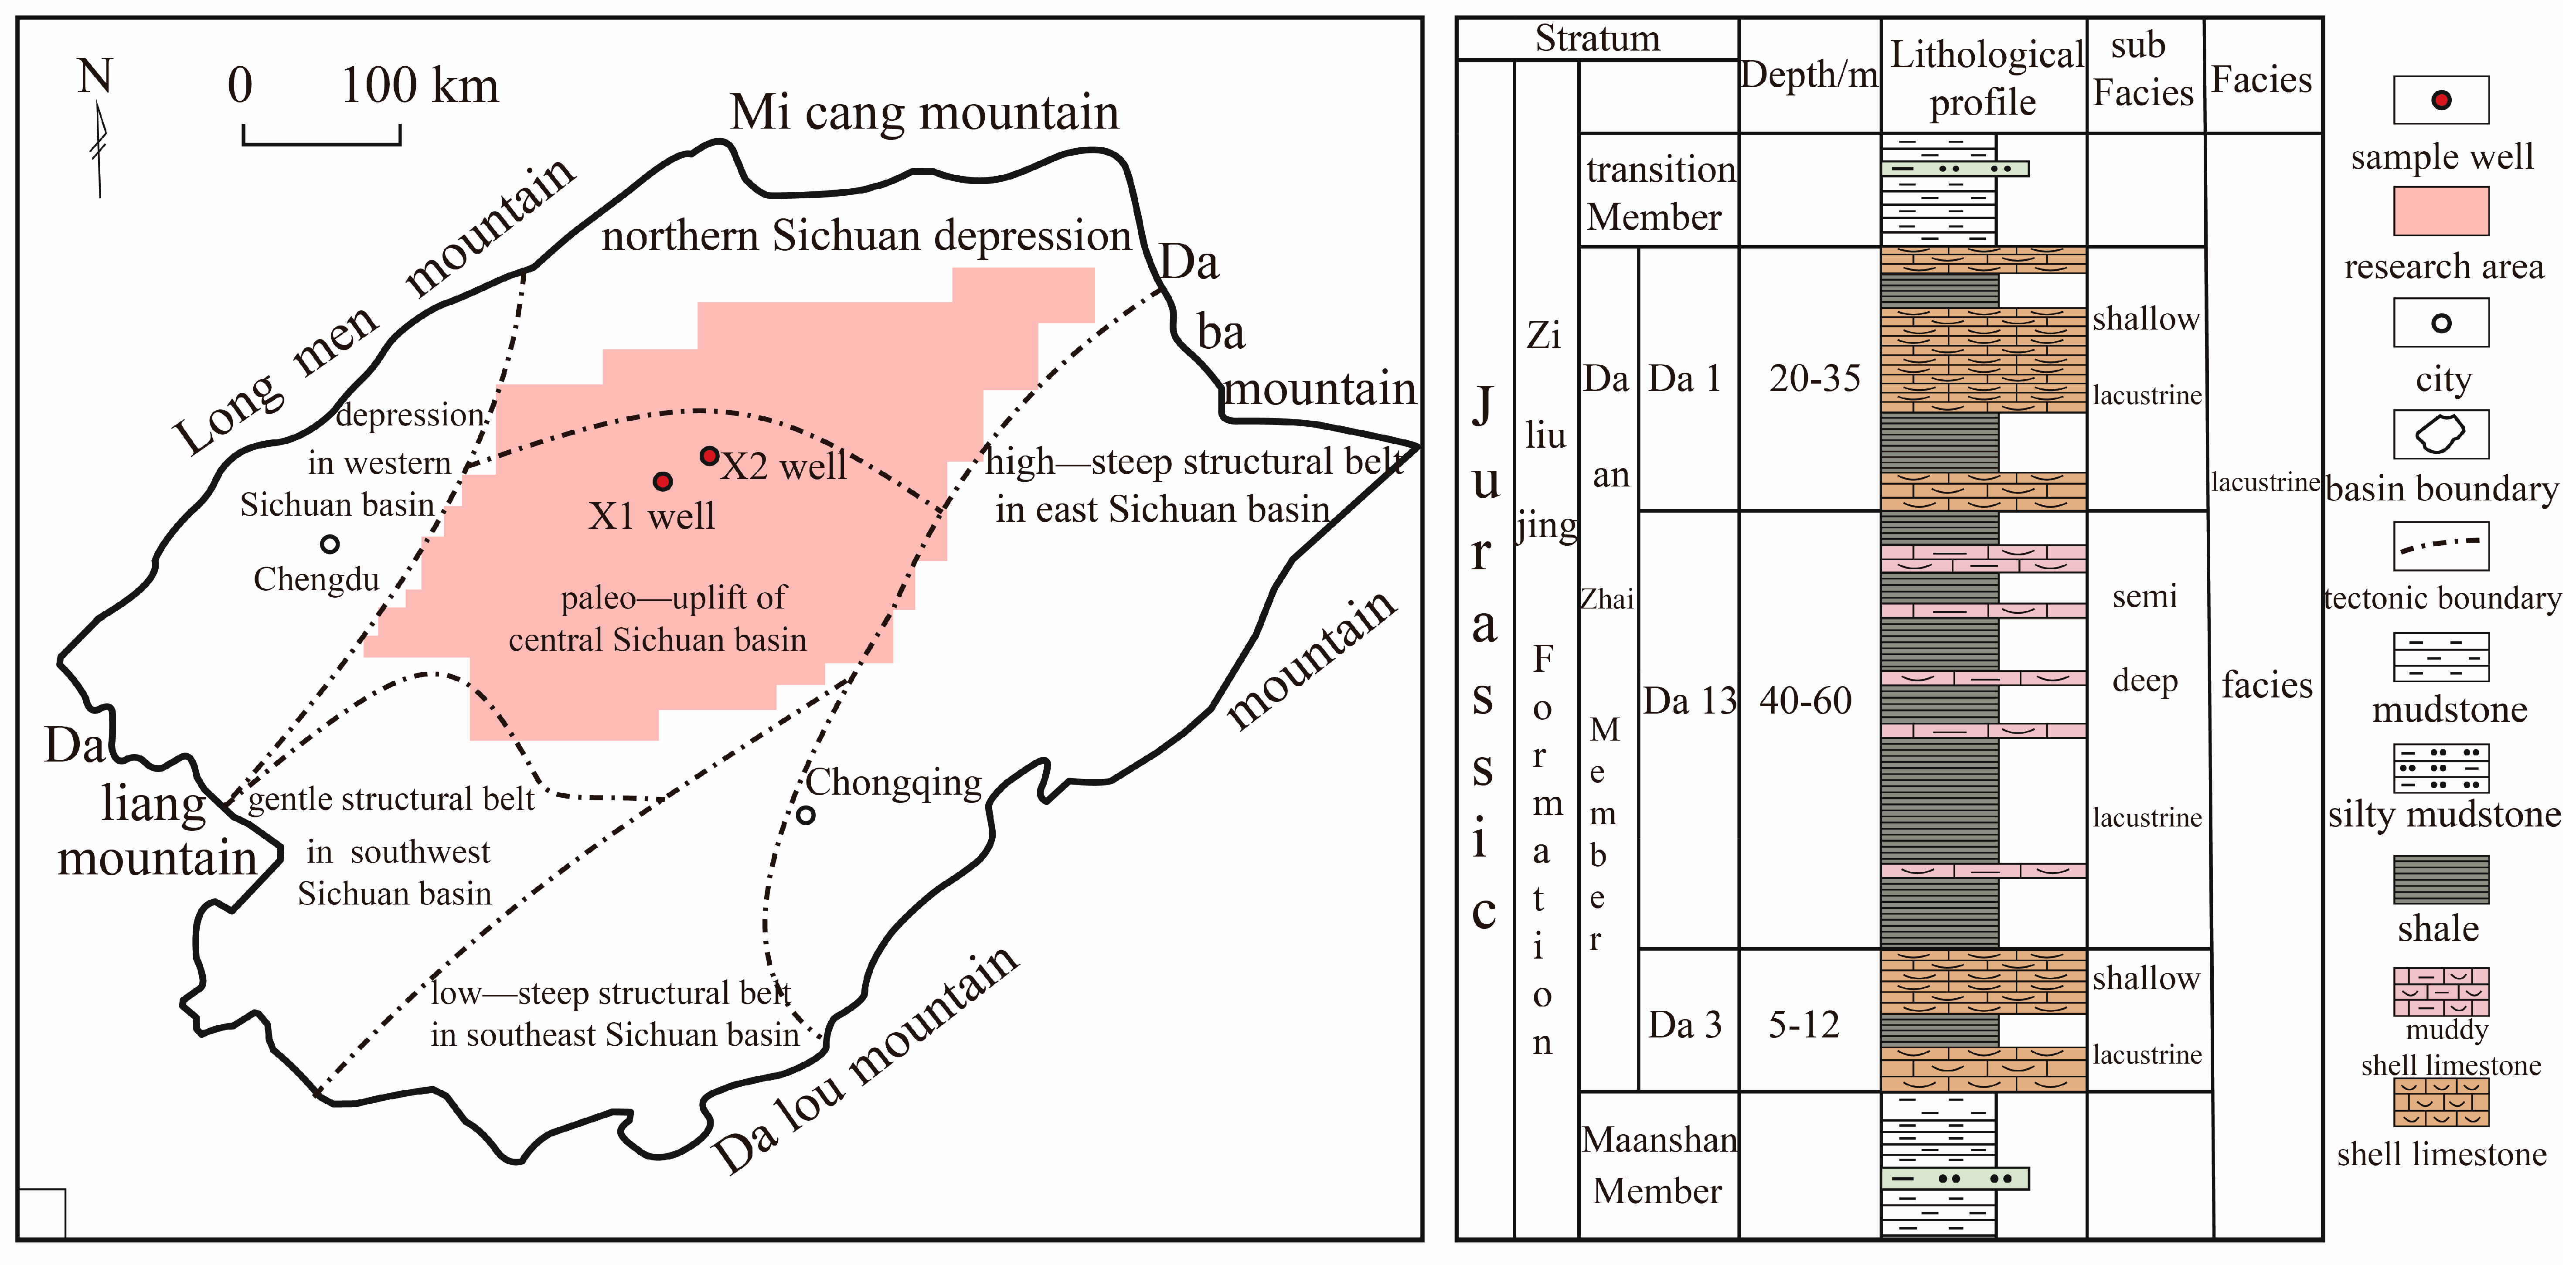
2. Geological Setting

The central Sichuan Basin area is located in the core region of the Upper Yangtze Craton Basin (Figure 1). The Jurassic strata in the Sichuan Basin are essential oil-bearing strata [9]. The study area is bounded by the Indo-China movement tectonic unconformity, which deposits Jurassic–Cretaceous continental strata. Jurassic strata are widely distributed in the study area, and the residual thickness is generally 2500–3500 m (Figure 1). This is a series of delta–lacustrine facies with clastic rock sediments. At the end of the Indo-China movement period, the paleoenvironment of the Sichuan Basin gradually transitioned from a relatively calm coastal lagoon bay to a relatively turbulent lacustrine environment in a large foreland depression. The lower Jurassic is characterized by lacustrine and delta facies with dark sandstone, mudstones, and carbonates. The middle part of the Jurassic is dominated by fluvial–delta–lacustrine facies sediments. The sedimentary facies in the upper part of the Jurassic are dominated by alluvial fan and river-delta facies. Shell limestone is widely distributed in various strata with uneven thicknesses. Vertically, the Da’anzhai Member can be divided into three Submembers, namely Da1, Da13, and Da3 (Figure 1) [14]. The lithology of the Da’anzhai Member includes shell carbonate, argillaceous carbonate, and shale. This member can be regarded as the most representative lacustrine carbonate formation that developed self-generating and self-storing tight oil in China. According to the rock core, thin sections, and XRD, the Da1 Submember is mainly composed of limestone and gastropod limestone, with a small amount of argillaceous limestone (Figure 1).
The study area is located in the central part of the Sichuan Basin, influenced by the Indosinian movement, where the marine deposits of the Leikoupo Formation evolved into the terrestrial deposits of the Xujiahe Formation. During the Yanshan tectonic cycle, the tectonic activity in the Longmenshan orogenic belt on the northwest margin of the basin weakened, entering a relatively stable period of uplift and erosion, while the thrust–overthrust structures of the Micangshan–Dabashan on the northeast margin of the basin continued to evolve, with occasional migration of the Early Jurassic lacustrine basin center. During this period, the tectonic extension intensity of the Sichuan Basin alternated, and the tectonic subsidence varied in rate, resulting in deposition and filling from bottom to top, forming the Zhenuichong, Dongyuemiao, Ma’anshan, and Da’anzhai Members of the Ziliujing Formation. In the early expansion stage of the basin, the Zhenuichong Member experienced a strong extensional period, with rapid basin subsidence resulting in the deposition of deltaic and marginal shallow lacustrine facies. During the sedimentation of the Dongyuemiao Member, the extensional activity weakened, and the basin subsided slowly with slow material supply, leading to the development of a large-scale lacustrine facies deposit and the first lacustrine transgression of the Ziliujing Formation. The Ma’anshan Member entered another strong extensional period, with rapid and stable basin subsidence. During this period, the thrust–overthrust activity in the Dabashan Mountains intensified, with the northeast margin of the basin dominated by deltas carrying sediment into the lacustrine, similar to the deposition characteristics of the Zhenuichong Member. The sedimentation period of the Da’anzhai Member corresponds to the weakest extensional activity in the basin and the most stable period of the surrounding orogenic belt. The overall subsidence rate of the basin exceeded the accumulation rate of terrestrial clastics, resulting in the second lacustrine transgression of the Ziliujing Member, with the basin center mainly located in the Yilong area. The Ziliujing Member as a whole is characterized by dark medium-thick layered fine-to-silt sandstone, muddy sandstone, and shale interbedded with shell limestone, representing delta–lacustrine facies deposition. In the study area, the Zhenzhuchong and Ma’anshan Members are dominated by delta front-marginal shallow lacustrine deposits, characterized by fine-to-silt sandstone interbedded with mudstone. The Dongyuemiao and Da’anzhai Members represent two lacustrine transgression periods, mainly featuring marginal shallow lacustrine to semi-deep lacustrine environments. Due to the scarcity of clastic sediment input into the lacustrine, abundant bivalve organisms flourished, resulting in the development of extensive low-energy and high-energy inter-shoals, with lithology consisting of shell limestone and blocky to banded dark mud shale.
During the Early to Middle Jurassic period, the main sedimentary environment of the Sichuan Basin consisted of marginal shallow lacustrine-to-semi-deep lacustrine facies, forming a sedimentary sequence of sandstone, limestone, and shale. Vertically, due to multiple lacustrine transgressions and variations in water body depth, four sets of semi-deep lacustrine facies dark mud shales developed from bottom to top: the Ziliujing Formation’s Zhenuichong Member, Dongyuemiao Member, and Da’anzhai Member of the Lower Jurassic, and the Liangshan Formation’s Liang’er Member of the Middle Jurassic. During the sedimentation of the Da’anzhai Member of the Ziliujing Formation, the water body was at the relatively deepest level, and the distribution of mud shale was the widest. At this time, the center of the basin was mainly located north of Xichong in central Sichuan, south of Yuanba and Pingchang, and west of Dazhou. From the center of the basin to the basin margin, semi-deep lacustrine, inter-shoal, shallow lacustrine, lacustrine front, and delta front subfacies developed successively. The Da’anzhai Member represents a complete regional lacustrine transgression–lacustrine regression sedimentary cycle. The Da1 and Da3 Submembers are characterized by fracture-type tight limestone reservoirs, while the Da’anzhai Member consists mainly of shell limestone and mud shale. The Da1 and Da3 Submembers contain the early developed tight oil reserves, with the Da’anzhai Member mainly consisting of shale and limestone in the central Sichuan region, and the Lianggaoshan Member mainly consisting of shale and sandstone in the Sichuan Basin, with other shale oils dominated by mudstone, shale, and siltstone.

3. Experimental and Material

The experimental samples were collected from wells X1 and X2 in the central Sichuan Basin (Figure 1). This study selected 28 samples of shell limestone from the Da’anzhai Member in wells X1 and X2. The depths of wells X1 and X2 are 2520 m and 2560 m, respectively. The core samples were horizontally sliced for porosity and permeability testing. XRD was analyzed using a Panalytical X P‘ertPRO MPD X-ray diffractometer (PANalytical, The Netherlands) with a scanning speed of 2 (°)/min and a test angle of 5°–90°. Samples X1 and X2 were observed using a NanoFab ORION microscope after grinding and argon ion polishing. The ASAP2020 automated analyzer was utilized to conduct adsorption experiments to measure N2 and CO2 adsorption at low pressure. The specific surface area of mesopores and micropores was determined through multilayer adsorption theory based on the multipoint Barrett–Emmett–Teller (BET) model, while the pore volume and pore size distribution were calculated using the density functional theory (DFT) model [15]. The high-pressure mercuryintrusion test for extracted samples was conducted using an AutoPore IV 9500 high-pressure mercury porosimeter (USA) [15]. The method used for measuring helium porosity was as follows: diamond wire cutting was used to prepare plug samples, reducing the probability of artificial cracks and increasing the success rate of sample preparation. Before saturating the shale with helium, the residual gas in the pores was removed using a vacuum pump to provide conditions for subsequent helium saturation. During helium saturation, strict pressure balance criteria were used to ensure that the pores were fully saturated with helium. Finally, the total volume of the shale sample was obtained using the caliper measurement method or the Archimedes immersion method. The pore volume was then obtained by subtracting the skeleton volume from the total volume and dividing by the total volume to obtain the shale porosity. The experimental results show that this method allows the sample to be fully saturated with helium during the experiment, resulting in more accurate measurements of porosity. Additionally, the reproducibility and repeatability of the method are better than those of experiments without vacuum extraction or with normal equilibrium criteria. Because the molecular size and diffusion characteristics are more similar to methane, the helium method is more accurate when measuring porosity at smaller pore sizes. Due to particle sample helium porosity measurements resulting in the total porosity while plug sample helium porosity measurements result in the effective porosity, the former measurement results are slightly larger than the latter.
Low-field NMR was employed to obtain the transverse relaxation time (T2) spectrum of the samples. NMR was carried out with MacroMR, manufactured by Suzhou Niumag Corporation. The primary factors recorded during laboratory measurements typically include the NMR signal intensity of the sample, T2, and the distribution of transverse relaxation times. The transverse T2 relaxation time of NMR mainly consists of three components: bulk relaxation time, surface relaxation time, and diffusion relaxation time. The details of the NMR procedure can be found in reference [16]. Samples X1 and X2 were selected for FIB-SEM and three-dimensional reconstruction to establish a three-dimensional network model [17,18]. The Carl Zeiss Crossbeam 540 SEM system was utilized to conduct the FIB-SEM. The preparation of samples for nano-CT analysis includes drilling cylindrical rock core samples with a diameter of 1 mm and a length of 0.5 cm along the direction of vertical bedding for laser sampling. The prepared rock samples were fixed and placed horizontally in the Oxford laser sampling system (Model A-532-DW), and the top of the rock sample was laser-sampled to produce a microcylinder with a diameter of 65 μm and a length of 300 μm for CT scanning [19]. Nano-CT testing was performed using Nanotom Xradia scanning equipment (Model UltraXRM-L200) from Zeiss (Germany), with a maximum resolution of 65 nm. During the scanning process, the sample was rotated from −90° to 90°, and X-ray information was continuously acquired. The nano-CT experiment set the scanning voltage to 8 kV, the experimental temperature to 20 °C, and the exposure time to 90 s. A total of 901 two-dimensional plane images were obtained along the Z-axis direction, which were stacked to form a three-dimensional data volume with a diameter of 65 μm and a height of 60 μm. The Non-Local Means mode of Avizo software 9.0 was used for filtering noise (conducted 2–3 times) and 3D reconstruction analysis to obtain information about the material composition, pore space distribution, and connectivity of samples [19].

4. Results

The shell limestone in the Da’anzhai Member is composed of particles (avg. 63.3%) and fillings (36.7%). The main component of the particles is bioclasts. The species of bioclasts include pelecypods (avg. 51.5%), ostracods (avg. 4.9%), gastropods (3.0%), and small amounts of algae (avg. 1.0%). The pre-eminent constituents of fillings are carbonate minerals and minor amounts of quartz, pyrite, clay, and organic matter. The contents of calcite, clay minerals, dolomite, and quartz are 20.4%, 7.5%, 3%, and 2.5%, respectively.
The main species of organisms are bivalves, brachiopods, and ostracods, with occasional sightings of gastropods and fish fossils. The mineral components are mainly calcite followed by clay minerals and quartz. The mass fraction of calcite in limestone and gastropod limestone is approximately 90.1% to 97.1% (avg. 94.6%), with quartz comprising 1.0% to 2.3% (avg. 1.72%) and clay minerals ranging from 1.2% to 5.5% (avg. 3.64%). In argillaceous limestone, the mass fraction of calcite ranges from 76.3% to 89.2% (avg. 85.68%), with quartz comprising 2.7% to 7.0% (avg. 4.04%) and clay minerals ranging from 7.5% to 16.7% (avg. 10.28%). The main particle components of gastropod limestone are brachiopods and foraminifera, with the volume fraction of brachiopods ranging from 3.0% to 99.4% and the volume fraction of foraminifera ranging from 3% to 80%. Occasionally, algal clusters are seen, with a volume fraction of approximately 2%. The degree of recrystallization of the matrix varies greatly. The volume fraction of mud crystals is generally 1% to 96%, the volume fraction of powder crystals is generally 0 to 70%, and the volume fraction of fine crystals is generally 0 to 44%. The casting slice and SEM observations determined that dissolution pores, intracrystalline dissolution pores, and structural fractures comprise a significant portion of the shell limestone reservoir space in the study area. Structural fractures are the primary reservoir space types, followed by dissolution pores along the structural fractures.
By observing the SEM of the samples, five types of pores were found in the samples, including intragrain pores, microfractures, dissolution pores, and intergranular pores. The intragrain pores between clay mineral interlayers are developed between the internal layers of clay mineral aggregates, with relatively small pore sizes. A large number of microfractures were observed in the SEM of the samples, most of which were located between the mineral skeleton of the sample or inside the minerals. Additionally, a certain amount of dissolution pores developed in the samples, exhibiting spherical, elliptical, and triangular shapes with small apertures. Some intergranular pores developed in the sample. Intergranular pores are mainly distributed between rigid minerals such as quartz, feldspar, and calcite with relatively large sizes, but are few in number with scattered distribution.
The mercury injection–decline curve of the sample is shown in Figure 2a. The shape of the capillary pressure curve can reflect the pore-throat structure characteristics of the reservoir. The average median throat radius for the pore structure is 0.144 μm, and the mean value of drainage pressure is 2.22 μm. Pore-throat selection is favorable, with narrow throats that are mostly ineffective, resulting in low permeability. The amount of mercury injection increases significantly only when the infiltration pressure is greater than 1000 psi or even 10,000 psi, and the infiltrated mercury cannot exit the pore space. The pore size of the samples shows a multipeak distribution, with the two main peak pore size ranges being 0.004~0.4 μm and 0.04~1 μm (Figure 2a). We conducted high-pressure mercury intrusion analysis on reservoir space size distribution, and the results indicate that the average mercury injection rate of the samples is only 43.25%. Among the pores effectively characterized, pores with a diameter greater than 1 µm account for only 8.73%, while pores with a diameter less than 1 µm constitute 91.27% of the total pore volume. This indicates that nanoscale reservoir spaces are prevalent in this reservoir.
The CO2 adsorption/desorption isotherm curves are shown in Figure 2. Based on the DFT model, a systematic characterization of the micropore structure in the area was conducted. From the CO2 adsorption isotherms, it can be seen that there are many micropores with pore volumes ranging from 0.003 to 0.05 cm3/g (avg. 0.0037 cm3/g). The microporous specific surface area ranges from 7.017 to 12.044 m2/g (avg. 10.0023 m2/g). The average micropore size is between 0.835 and 0.877 nm. The N2 adsorption/desorption isotherm curves are shown in Figure 2. Within the low relative pressure range (0–0.42), the adsorption content increases gradually with almost complete overlap of the adsorption and desorption branches, indicating that nitrogen molecules are adsorbed onto the internal surface of the pores in a monolayer to multilayer form. Within the high relative pressure range (0.42–1), the adsorption and desorption branches no longer overlap, and the isotherm curve exhibits a hysteresis loop after adsorption, indicating that the mesopores (2–50 nm) of the sample are well developed. After the relative pressure exceeds 0.8, the isotherm curve rapidly increases, indicating capillary condensation on the surface of the adsorbent. When the relative pressure is close to 1.0, the isotherm curve has no horizontal plateau, indicating that there are many macropores in the sample beyond the measurement range of nitrogen adsorption experiments.
Isothermal adsorption curves can quantitatively characterize pore morphology. Previous studies classified adsorption curves into five types, each corresponding to a specific pore morphology. The isothermal adsorption curves and hysteresis loop shapes of two Da’anzhai Member samples were analyzed. By comparing the adsorption curves (Figure 2), it was found that both samples rapidly increased near saturation vapor pressure (relative pressure of 1), indicating that only types B and D exhibit this characteristic. Further comparison of the desorption curve shapes and hysteresis loop positions (Figure 2) revealed that both desorption curves exhibited significant changes in slope in the moderate relative pressure range (relative pressure of 0.4 to 0.6), consistent with type B. This suggests that the predominant reservoir space is characterized by a “slit-like” morphology, aligning with the fractured reservoir space revealed by qualitative analysis.
The three-dimensional pore space under micro-CT and nano-CT for samples is shown in Figure 3. At the micro-CT scale, pore sizes are variously distributed throughout the space in a somewhat disordered manner, while at the nano-CT scale, some pores are partially connected and clustered, while many others are completely isolated, with the majority of these being small pores. Fractures are clearly developed. There are also many partially connected and completely isolated nanoscale pores. This indicates that the reservoir spaces in the shell limestone are well interconnected with each other.

5. Discussion

The oil and gas significance of the multiparous medium characterization mainly manifests in addressing the following three questions: ① Why is the productivity of the Da’anzhai Member in the central Sichuan region lower than that of other tight oil areas? ② How can such low porosity sustain production from numerous wells for over 20 years? ③ Why can the study area achieve large-scale development of tight oil even without employing “horizontal wells with segmented fracturing” technology? Below, analyses are conducted to address these three questions [20].

5.1. Reservoir Space of the Shell Limestone Reservoir

There are three types of reservoir space in the shell limestone reservoir of the Da’anzhai Member: the reservoir space controlled by nonfabric, the reservoir space controlled by the shell, and the reservoir space controlled by the matrix (Figure 4, Figure 5 and Figure 6). The reservoir space controlled by nonfabric is not restrained by rock fabric. This can simultaneously form in the shell and matrix. The pores in this type of reservoir space include dissolution pore cavities, dissolution pores, and dissolution micropores (Figure 4). This is a remarkable observation due to the dissolution process, which causes the pore radius to range from centimeters to micrometers. The fractures in this type of reservoir space include structural fractures, interlayer fractures, and dissolution fractures (Figure 4). The structural fractures are controlled by tectonism and local stress. The interlayer fractures are controlled by rock bedding (Figure 4, Table 1). The dissolved fractures are controlled by dissolution. The width of fractures in the reservoir space controlled by nonfabric is greater than 1 μm, with lengths ranging from centimeters to kilometers. The fracture scale is relatively large (Table 1).
The reservoir space controlled by the shell is formed inside shells (Figure 5). The pores in this type of reservoir space contain structural pores and intergranular pores within shells. The pores are regulated by the biological growth skeleton and late recrystallization (Figure 5). The pore diameter is less than 0.1 μm. The fractures typically include joints between the shell and fabric fractures in the shell interior (Figure 5). The fractures are clearly dominated by the type and size of the shell. The width of the fractures is in the range of 0.1–1 μm (Table 1). The lengths of the fractures range from millimeters to centimeters. Through the classification of reservoir rocks and reservoir space types in the Da’anzhai Member, it is revealed that the most favorable intercrystalline dissolution pores are most developed in shell limestone. Therefore, shell limestone with intercrystalline dissolution pores is the most developed and favorable reservoir rock type.
The reservoir space controlled by the matrix is developed in the matrix of the shell, which is controlled by the filling (Figure 6). The pores contain intergranular pores characterized by ellipses, small pores, and fine pore throats (Figure 6). The pore diameters are in the range of 0.1–5 μm. The fractures are available, including intergranular fractures and turtle-shaped fractures (Figure 6, Table 1). Intergranular fractures enlarge at the edge of calcite grains. Turtle-shaped factures are originally formed by clay minerals and organic matter dominated by local stress (Table 1). The widths of both the intergranular and turtle-shaped fractures are all less than 0.3 μm, with the lengths of the two types of fractures in the range of micrometers–millimeters (Table 1).
The pore throat size of the Da’anzhai Member is smaller than that of typical tight oil reservoirs in the Triassic Yanchang Member of the Ordos Basin. In the latter, pores with a radius smaller than 100 nm account for approximately 65.15% of the total pore volume, while in the Da’anzhai Member, this proportion is as high as 80.46%.

5.2. Reservoir Capacity of Shell Limestone

The reservoir capacity of the shell limestone in the Da’anzhai Member is the sum of pores and fractures: interconnected pores, dissolution pores, large fractures, isolated pores, and bound oil–water. The interconnected pores include intracrystalline pores, intergranular pores, and various microfractures. The reservoir capacity of interconnected pores was characterized using high-pressure mercury injection, low-pressure N2 and CO2 adsorption, and the helium porosity method. Dissolution pores were divided into large-scale and small-scale dissolution pores. Large-scale dissolution pores were characterized using core description methods. Small-scale dissolution pores were characterized using the helium porosity method. Large fractures include structural fractures, dissolution fractures, interlayer fractures, and pressure solution fractures. The reservoir capacity of large-scale fractures was mainly characterized by core description. The reservoir capacity of isolated pores and bound oil–water was characterized using plug-core samples in NMR.
The total interconnected porosity is characterized using the helium porosity method. The interconnected porosity is mainly distributed in the range of 1% to 5% (avg. 2.12%) (Table 2). The water saturation method was used to measure the effective interconnected porosity, but its measurement range was smaller than that of the helium porosity method due to the influence of capillary pressure in fine pores and throats. In this study, the water saturation porosity mainly ranged from 0.5% to 2.0% (avg. 1.59%) (Table 2). The high-pressure mercury intrusion method was used to characterize the effective interconnected porosity with pore diameters larger than 3.7 nm. In this study, the mercury intrusion porosity ranged from 0.5% to 1.5% (avg. 0.97%) (Table 2). However, due to the high intrusion rate of high-pressure mercury, there is a certain loss rate in the pore-throat system of tight reservoirs that are scattered in distribution and have poor permeability. Therefore, the experimental results obtained using high-pressure mercury intrusion are lower than the actual values. The N2 adsorption method was used to measure the interconnected porosity with a radius of less than 150 nm. The N2 adsorption porosity mainly ranged from 0.5% to 2.5% (avg. 1.44%) (Table 2). Theoretically, the measurement range of N2 adsorption and high-pressure mercury intrusion covers all interconnected pores. The sum porosity obtained with N2 adsorption and high-pressure mercury intrusion is the total interconnected porosity. The total porosity measurement from the two aforementioned methods yielded a value of 2.42%, slightly exceeding that of the helium porosity method.
With a porosity greater than 4%, dissolution pores play a crucial role in enhancing the reservoir capacity. The shell limestone contains an average of 2.73 dissolution pores per meter of core. The thin sections show a pore rate of 88% and a face pore rate of 0.2% on average. The helium porosity method is commonly used to measure the porosity of the dissolution pore development zone, usually greater than 4%, with a distribution ranging from 4% to 10% (Table 2). Therefore, dissolution pores constitute a crucial kind of reservoir space in shell limestone and highlight the importance of improving reservoir permeability capacity.
The porosity of large fractures is 0.1% to 0.5% (avg. 0.21%) (Table 2). Large fractures include structural fractures, interlayer fractures, and dissolution fractures, mainly serving as flow channels. The reservoir capacity of large-scale fractures cannot be characterized with conventional testing methods. Therefore, plug core analysis is commonly used. The average density of large fractures in the shell limestone is 1.5 per meter, with an average face pore rate of 0.8%.
The difference in pore throat size is also reflected in the disparity of porosity within the reservoir. The porosity of tight reservoirs in the Yanchang Member of the Ordos Basin ranges from 2% to 12%, while the porosity of the Da’anzhai Member samples primarily falls between 0.5% and 2.0%. Such tight reservoirs result in poor storage capacity and low resource abundance. With lower resource abundance, the reserves controlled by a single well are smaller. Consequently, wells have lower productivity. In summary, the Da’anzhai Member reservoir, dominated by nanoscale reservoir spaces, exhibits low resource abundance and small reserves controlled by individual wells, thus forming a low-production characteristic.
The porosity of isolated pores and bound oil–water pores ranges from 0.2% to 0.8% (avg. 0.44%) (Table 2). Field outcrops and fresh surfaces of long-term placed cores were used to verify the development of isolated pores and bound oil–water pores in the shell limestone, commonly characterized with NMR. As shown in Figure 7, the T2 relaxation time distribution of inter-shelled limestone dry rock samples ranges from 0.1 ms to 200 ms, reflecting a wide range of pore sizes. By calculation, the shell limestone exhibits a matrix porosity ranging from 2% to 7% (avg. 3.5%). Comprehensive analysis shows that the porosity of the shell limestone in the Da’anzhai Member ranges from 2% to 5%.

5.3. Multi-porous Medium Characteristics

The research area developed fractures and pores at different scales, displaying various seepage flow patterns and flow velocity characteristics (Figure 8). To better understand these multi-porous medium characteristics of shell limestone reservoirs, we used well testing to resolve changes in the variability of flow patterns. The double logarithmic curve from well testing is concave (Figure 8a). The production curve has two stages (Figure 8b). Instead of being a single-porous medium-fractured reservoir, it typifies a multi-porous medium reservoir [21]. The initial high production is formed by oil production from fractures of multiple scales, but the production rate is rapid while the reserve scale is limited, thus leading to a fast decline in production rate (Figure 8b). As oil is gradually expelled from the fractures, the pressure within the fractures also decreases rapidly. Oil in the pores within the reservoir matrix and in smaller-scale microfractures flows towards the fractures under relatively high pore pressure. The production rate of this process is significantly lower than that of oil production from the fractures, and the process of extraction from pores to fractures continues for a long time. This process is reflected as long-term low production and stable production (Figure 8b).
Various scales of pores and fractures have different permeability flow regimes and flow velocity characteristics. As shown in Figure 8c, centimeter-to-millimeter-scale dissolution pores and large fractures are mostly high-speed nonlinear flows. The conventional micrometer-scale pores and secondary structural fractures are mostly quasilinear flows (Figure 8c) [22]. The nanometer-scale intercrystallite pores and fabric fractures exhibit low-speed nonlinear flow characteristics (Figure 8c) [22]. These flow features indicate that the permeability flow characteristics of the shell limestone reservoir are complex and have multi-porous medium characteristics.
Production dynamics reveal that the shell limestone reservoir has multimedium characteristics (Figure 8b). The typical production curve shows a two-stage pattern (Figure 8b). In the initial stage, the production rate is high, the decline rate is fast (annual decline rate exceeds 50%), and the production time is short (ranging from months to 2–4 years), with fracture oil production being the main contributor (Figure 8b). In the later stage, there is a low and stable production period with a low production rate and a long production time, which can continue for 30–50 years, with oil production originating from the matrix being the main contributor. This pattern reflects the typical dual-medium reservoir characteristics of fractures and pores.
In the double logarithmic curve of X1 well testing, the pressure derivative curve shows a concave downward shape after radial flow in fractures (Figure 8a), indicating that the matrix rock system is flowing toward the fracture system, and its elastic reservoir coefficient is relatively small, approximately between 8.7 × 10⁻⁴ and 8.3 × 10⁻² [23]. This indicates the dual-medium nature of the shell limestone reservoir, revealing that the volume of fractures and pores is much smaller than that of the matrix pores [23].
The shell limestone develops fractures and pores on the centimeter–millimeter–micron–nanometer scale (Figure 4, Figure 5 and Figure 6). Centimeter-to-millimeter-scale dissolution pores and millimeter-to-micrometer-scale large fractures are visible on the rock and core, with an average dissolution pore density of 2.73/m and an average large fracture density of 1.5/m. In the casting thin section, there are visible micrometer-to-nanometer-scale pores and micrometer-scale fractures, with a thin section porosity of 88% and an average face porosity of 0.2%. The fracture rate is 72%, with an average fracture rate of 0.8%. FIB-SEM reveals micrometer-to-nanometer-scale pores and fractures, with the face porosity increasing with magnification, indicating that small-scale nanometer pores are more developed (Figure 9).
High-pressure mercury intrusion reveals that the shell limestone continuously enters mercury at approximately 0.01–200 MPa, with pore throat radii distributed from 0.004 to 1 µm (Figure 2). The N2 adsorption experiment reveals that the pore throat volume of the shell limestone with a radius less than 150 nm is 0.0054 cm3/g, with a corresponding porosity of approximately 1.44%. The porosities of pores with radii of 30–150 nm, 3.7–30 nm, and less than 3.7 nm are 0.73%, 0.61%, and 0.1%, respectively. This indicates that the shell limestone reservoir has a variety of pore-throat systems with different sizes and scales and a low concentration of reservoir space [23].

5.4. Reservoir-Permeability Model in Shell Limestone

5.4.1. Pore-Throat Systems of the Shell Limestone Reservoir

Core descriptions, thin sections, and FIB-SEM show that there are five independent pore-throat systems in shell limestone reservoirs: dissolved pores adjacent to the fracture, microfractures controlled by the shell, microfractures controlled by the matrix, isolated pores, and intracrystalline (intergranular) pores (Table 3). In dissolved pores adjacent to the fracture, the reservoir space is dominated by dissolving pores, with a pore diameter greater than 10 μm. Interestingly, the permeability channels are structural fractures and secondary microfractures. There exists a fundamental difference between pores and throats. In microfractures controlled by the shell, the reservoir space is predominated by fabric fractures in the shell, broken fractures inside the shell, and fractures between the shell (Table 3). The width of the fracture is less than 1 μm. The pore diameter is less than 0.1 μm. Clearly, in this case the permeabilities are fine microfractures. This observation is consistent with the fact that there is no difference in the pores and throats. In microfractures controlled by the matrix, the reservoir space includes intergranular fractures, turtle-shaped fractures, and a small quantity of intracrystalline pores (Table 3). The width of these fracture is less than 0.3 μm, with a pore diameter less than 1 μm. The permeability channels are mainly fine microfractures. Therefore, it is assumed that the difference between pores and throats is not evident. In the isolated pores, the reservoir space contains dissolved pores, dissolved micropores, shell-like pores, and intracrystalline pores (Table 3). Therefore, in these cases, the pore diameter was between 0.1 and 10 nm. The permeability channel is the shrinkage part of the pore. In this scenario, there is a finite difference between the pore and the throat. In intracrystalline (intergranular) pores, the reservoir space comprises intracrystalline pores and intergranular pores (Table 3). With this assertion, the pore diameter is in the range of 0.1–5 μm. The radius of the throat is the shrinking part of the pores. There is a slight difference between the pores and throats.
Of the five typical pore-throat systems discussed, microfractures controlled by shells and intracrystalline (intergranular) pores account for approximately 40% and 30%, respectively, while other types of pore throats are relatively uncommon, each accounting for approximately 10%. The distribution and reservoir-permeability model of the pore-throat system are constrained by rock fabric, tectogenesis, and late diagenesis. Table 3 provides the results obtained from the preliminary analysis of the reservoir-permeability model constrained by the shell. As seen from the table, the type, scale, quantity, shape, distribution, and combined relationship of pores, throats, and fractures in shell limestone inevitably vary. The reservoir-permeability mode and characteristics are unnecessarily complicated.
At the micrometer scale, the X1 sample is very tight with poor connectivity. It has obvious compaction effects, well-developed interparticle cementation, few interparticle pores, and underdeveloped micropores and microfractures. The pore space distribution is extremely scattered (Figure 4, Figure 5 and Figure 6). The X2 sample is comparatively tight with relatively well-developed micropores and microfractures (Figure 4, Figure 5 and Figure 6). The pore space is distributed relatively continuously with slightly better connectivity. It has well-developed interparticle cementation, fewer interparticle pores, and a more developed pore structure compared to the X1 sample, with pore diameters generally between 1–5 μm (Figure 4, Figure 5 and Figure 6).
To analyze the pore-throat systems of the shell limestone reservoir in full detail, it is advantageous to directly measure the pores and throats using CT and SEM [24]. The pore space distribution of sample X1 is extremely scattered, with poor connectivity (Figure 10a,b). The pore space distribution of sample X2 is relatively continuous, with better connectivity (Figure 10c,d). The two tight rock samples have smaller porosities, with sample X1 being denser than X2 (Figure 11a,b). The frequency of porosity below 0.5% in both rock samples is approximately 40% in the main distribution area (Figure 11). Based on the connectivity of different porosity distributions, the region below 3% porosity in X1 is the main permeability channel (Figure 11c), while the region below 7% porosity in X2 is the main permeability channel (Figure 11d). Both rock cores have good homogeneity, and representative areas were selected for micrometer and nanometer CT experiments.
In the images obtained from micro-CT, there are fewer micrometer-sized pore throats in the X1 and X2 samples, and the resolution is insufficient to clearly understand the pore structure of the tight rock samples at the micrometer level (Figure 3a–f). The results of the reconstructed micrometer pore network model show that there are fewer micrometer-level pores and pore throats in the rock samples, resulting in poor connectivity (Figure 3a–f). From the images obtained using nano-CT scanning, the radii of the pores and throats in the X2 sample were mainly in the range of 150 nm (Figure 3g–i). The reconstructed nanoscale pore network model indicates poor connectivity between these pores and throats (Figure 3g–i).
Using a microscale SEM, the sample was magnified 1000 times. Microscopic pores were not observed in the X1 sample. However, numerous pores ranging from 1 to 6 μm in size were visible in the X2 sample (Figure 12). At the micrometer scale, the X1 sample was observed under a scanning electron microscope at a magnification of 1000×, and no micrometer-scale pores were found (Figure 12a). There were more intergranular pores in the X1 sample (Figure 12a). However, in the X2 sample, many 1–6 micrometer pores were visible (Figure 12b). At the nanometer scale, the X1 sample has many developed nanomicropores with a diameter mainly distributed between 300 and 800 nanometers. The pore space distribution is extremely dispersed, resulting in poor connectivity. The main pore types are intergranular pores and intragranular pores, with developed intergranular cement and fewer intergranular pores. Microfractures are not developed. On the other hand, the X2 sample has more developed nanopores and microfractures (Figure 12b). The diameter of the nanopores is generally between 500 and 2000 nanometers and pore connectivity is good, mainly consisting of intergranular pores with well-developed intergranular cement (Figure 12b). Observation of nanoscale pores in rock cores under electron microscopy at 6000× magnification revealed sizes ranging from approximately 300 to 800 nm for the X1 sample (Figure 13a), while the X2 sample showed nanometer-to-submicron-scale pores with sizes of approximately 500–2000 nm (Figure 13b). The X2 sample had developed fractures, including intergranular microfractures and calcite crystal cleavage fractures, which may have significant implications for the effective permeability of tight reservoirs (Figure 14). Intergranular micro-cracks can reach lengths of 10–60 μm with opening widths of 1–3 μm, while calcite crystal cleavage fractures are 50–100 μm (Figure 14). From the nanoscale CT scan images of the 65 μm X1 sample, it can be observed that microfractures in the sample are well developed, with fracture lengths mainly ranging from 5 to 40 μm, with fracture widths mainly ranging from 300 to 800 nm (Figure 15).
The primary form of reservoir space in the Da’anzhai Member is “slit-like”, characterized by pores and throats with similar sizes. The significance of this small pore throat ratio in petroleum development in the study area mainly lies in its impact on capillary forces. Capillary force is the primary known resistance during petroleum migration and seepage, and its magnitude is proportional to the pore throat ratio. Therefore, although the porosity dominated by slit-like reservoir spaces is much lower than that of other tight reservoirs, the migration and seepage of crude oil are facilitated. This is a key reason why industrial oil flow can be achieved in the study area using conventional petroleum development methods.

5.4.2. Continuous Distribution of Reservoir Permeability Model

The reservoir and permeability space of shell limestone is controlled by rock fabric, diagenesis, and tectonics. Various types of reservoir-permeability modes coexist. Due to the independent genesis and limited development space of different reservoir-permeability modes, most reservoir-permeability modes are distributed independently [25]. The considerable diversity of reservoir space in shell limestone led to the use of the reservoir-permeability model showing continuous distribution characteristics. It is noted that various experimental methods can observe different scales of pores and fractures. The continuous distribution of the reservoir-permeability model is indicated in the following ways.
(1) This is obviously a case in which the outcrop and core possesses dissolution pore cavities in the millimeter–centimeter range (Figure 4, Figure 5 and Figure 6). According to the statistical data derived from wells X1 and X2, the density of dissolution pore cavities is 0.2–10.5 number/m (avg. 2.73 number/m).
(2) Another phenomenon occurred in the N2 adsorption experiments, which confirms that the nanoscale reservoir-permeability medium grows in the shell limestone (Figure 2). The adsorption diameter of N2 mainly ranged from 10 to 300 nm. Clearly, the relative volume of the mesoporous medium with a diameter of 1.7–1.9 nm reaches 8.49 × 10⁻⁶ cm3/g.
(3) Thin sections characterize the reservoir permeability mode (Figure 4, Figure 5 and Figure 6). The visible pores are predominantly dissolution pores with irregular shapes. The average pore diameter is 31 μm. Visible fractures include structural fractures, dissolved fractures, and microfractures constrained by shell particles. The throat refers to the shrinking part of the microfracture or pore, with an average diameter of 12 μm. Consequently, the reservoir permeability mode identified with thin sections includes dissolved pores along fractures, microfractures controlled by biological shells, and isolated pore patterns. Shown in Figure 16a are the reservoir-permeability modes with notably isolated and scattered distributions.
(4) Nano-CT characterizes the reservoir-permeability mode. Recent advances in nano-CT provide opportunities to examine the three-dimensional spatial distribution of a reservoir-permeability model [26]. Figure 16b shows that the dissolution pores along the fracture exhibit bead-shaped or long strip shapes. Moreover, the microfractures are linear or banded. Isolated pores and intergranular (intergranular) pores show maculosus or spots. The pore-throat system in the research area has the following characteristics: small quantity, small scale, and scattered distribution. The number of pores only ranges from 2000 to 12,000. The scale of pore throats is mostly less than 5 μm. In summary, nano-CT highlights the experimental result that different reservoir-permeability modes have independent distributions and poor connectivity [27].
(5) FIB-SEM can characterize five reservoir-permeability modes and combinations of different reservoir-permeability modes. Figure 17 shows the visible pores identified by FIB-SEM. Visible pores include dissolution pores, shell fabric pores, intracrystalline pores, and intergranular pores in the matrix. Pore radii range from 1 μm to 0.05 μm. Fractures include structural fractures, fabric fractures controlled by shell particles, and fabric fractures constrained by filling (Figure 17). In all reservoir permeability modes, the micropores and microfractures dominated by shell particles and filling predominate. Here, we note that the connectivity of the aforementioned two reservoir-permeability modes is relatively good (Figure 17).
The purpose of hydraulic fracturing in tight oil reservoirs is to create as many artificial fractures as possible to reduce flow resistance. Fractures in the Da’anzhai Member range from large-scale fractures in outcrops to micro- and nano-scale microfractures, all of which are highly developed. These extensively developed multi-scale natural fracture networks are exactly what other tight oil areas need to achieve through artificial fracturing [28]. Therefore, although a horizontal well with segmented fracturing technology is not employed in the study area, the more developed natural fracture network has also enabled the development of tight oil on a large scale.
The special reservoir space and permeability channel in the research area led to reservoir-permeability modes different from those used for tight oil in other basins [29]. The reservoir space is mainly composed of dissolution pores, intergranular pores, and a small number of intergranular pores in tight sandstone (Figure 18a). The main body of seepage channels is pore-shrinking throats (Figure 18a). This is consistent with the conclusion that reservoir-permeability modes are relatively simple and conventional (Figure 18a). In contrast, the reservoir-permeability model of shell limestone in the research area is more complex than that of tight sandstone (Figure 18b). This discrepancy can be characterized by the following features. There are many types of reservoir spaces, permeability channels, and reservoir-permeability modes. Rock fabric predominates in reservoir space and reservoir-permeability modes, and exhibits partition distribution and low connectivity. The interior connectivity of various reservoir-permeability models varies significantly. Solitary pores are comparatively the worst, followed by the intergranular, reticular microfracture, and fracture dissolution pores. The proportion of microfractures is as great as 40%, serving as both permeability channels and reservoir space, resulting in small differences between pores and throats.
According to the latest fourth oil and gas resource assessment, the cumulative oil generation from the Da’anzhai Member reaches 225 × 108 t, with laboratory analyses indicating a hydrocarbon expulsion efficiency of 40% to 77%, with a peak oil generation period of about 50%. The abundance of oil and gas resources in the lacustrine shell limestone of the Sichuan Basin is approximately (0.44 to 1.10) × 108 m3/km2. In summary, based on the conditions of oil and gas resources and the results of resource calculations, the potential of tight oil resources in the Da’anzhai Member is immense. Given the exploration and development status and geological characteristics of the Da’anzhai Member of the Sichuan Basin, along with the practical situation of exploration and development in the basin, an organic decomposition of the Da’anzhai Member is proposed under objective conditions such as insufficient drilling, limited financial support, small production tasks, and high research difficulty. Based on existing technological bottlenecks and comprehensive analysis of resource assessments, technological breakthroughs are focused on the tight oil of the Da’anzhai Member shell limestone, which has the largest resource volume, the best development results, unclear main technical aspects of exploration and development, and high investment costs. Through technological innovation and research, complementary technologies have been developed to gradually convert resources into reserves and promote the benefits of tight oil production from the Jurassic. The development of supporting technologies for the exploration and development of the Da’anzhai Member shell limestone is crucial for achieving the scale and benefits of tight oil development. Through comprehensive geological, developmental, and economic factors, combined with current understanding, the lacustrine shell limestone in Da’anzhai Member in the southern and central parts of Sichuan is identified as a key area for exploration and testing, providing a reliable target for pilot testing.

6. Conclusions

The reservoir space controlled by nonfabric, the reservoir space controlled by the shell, and the reservoir space controlled by the matrix constitute the reservoir space of shell limestone in the Da’anzhai Member. The shell limestone develops fractures and pores on the centimeter–millimeter–micron–nanometer scale.
The interconnected porosity in the inter-shell limestone reservoir is mainly distributed between 1% and 5% (avg. 2.12%). The effective interconnected porosity measured with water saturation porosity ranges from 0.5% to 2.0% (avg. 1.59%), while the mercury intrusion and N2 adsorption porosity range from 0.5% to 1.5% (avg. 0.97%) and 0.5% to 2.5% (avg. 1.44%), respectively. Large fractures have a porosity range of 0.1% to 0.5% (avg. 0.21%), while isolated and bound oil–water pores have a porosity range of 0.2% to 0.8% (avg. 0.44%). The concave double logarithmic curves for well testing and two-stage production suggest complex permeability flow characteristics with multiple medium features in the shell limestone reservoir.
The shell limestone reservoir in the Da’anzhai Member can be characterized by five distinct pore-throat systems, identified through core descriptions, thin section analysis and FIB-SEM: dissolved pores adjacent to fractures, microfractures controlled by shells, microfractures controlled by matrices, isolated pores, and intracrystalline (intergranular) pores.
The distribution and permeability of these systems are influenced by rock fabric, tectogenesis, and late diagenesis. Reservoir-permeability models have been identified using FIB-SEM and nano-CT. In all models, microporous and microfractured shells are the proportionately dominant reservoir permeability modes.

Author Contributions

Conceptualization, Q.J. and W.W.; methodology, G.Z.; software, Z.Z.; validation, Q.J.; formal analysis, W.W.; investigation, Z.Z.; resources, M.L.; data curation, D.W.; writing—original draft preparation, G.Z.; writing—review and editing, G.Z.; visualization, S.X.; supervision, Z.G.; project administration, M.L.; funding acquisition, M.L. All authors have read and agreed to the published version of the manuscript.

Funding

This study was supported by the Major Special Project of the Ministry of Science and Technology of PetroChina (Grant no. 2022DJ8004).

Data Availability Statement

Data are contained within the article.

Conflicts of Interest

Authors Dongjun Wu and Saihong Xue were employed by the company Yanchang Oilfield Seven-Mile Village Oil Extraction Plant. The remaining authors declare that the research was conducted in the absence of any commercial or financial relationships that could be construed as a potential conflict of interest. The Yanchang Oilfield Seven-Mile Village Oil Extraction Plant had no role in the design of the study; in the collection, analyses, or interpretation of data; in the writing of the manuscript, or in the decision to publish the results.

References

  1. Curtis, J.B. Fractured shale-gas systems. AAPG Bull. 2002, 86, 1921–1938. [Google Scholar] [CrossRef]
  2. Hong, P.; Huo, X.; Pang, X.; Liu, G.; Ma, Q.; Bai, H.; Wang, J.; Zhang, Y.; Huang, S.; Wu, S.; et al. Quantitative characterization of critical reservoir physical properties of tight oil charging in the third member of the Shahejie Formation in the Gaobei Slope of Nanpu Sag, Bohai Bay Basin. Geoenergy Sci. Eng. 2023, 230, 212212. [Google Scholar] [CrossRef]
  3. Jia, Z.; Cheng, L.; Zhou, J.; Cao, R.; Pu, B.; Jia, P.; Chen, M. Upscaling simulation method of fluid flow for fracturing-shut in-flowback-production process in tight oil reservoirs: Hysteresis effects of capillary pressure and relative permeability. Geoenergy Sci. Eng. 2023, 226, 211792. [Google Scholar] [CrossRef]
  4. Zhang, J.; Tao, S.; Wu, S.; Liu, G.; Zhao, W.; Li, G. Controlling effect of pore-throat structures on tight oil accumulation effectiveness in the upper Cretaceous Qingshankou formation, Songliao Basin. Geoenergy Sci. Eng. 2023, 225, 211689. [Google Scholar] [CrossRef]
  5. Cao, A.; Li, Z.; Zheng, L.; Bai, H.; Zhu, D.; Li, B. Nuclear magnetic resonance study of CO2 flooding in tight oil reservoirs: Effects of matrix permeability and fracture. Geoenergy Sci. Eng. 2023, 225, 211692. [Google Scholar] [CrossRef]
  6. Xu, Q.; Liu, B.; Ma, Y.; Song, X.; Wang, Y.; Xin, X.; Chen, Z. Controlling factors and dynamical formation models of lacustrine organic matter accumulation for the Jurassic Da’anzhai Member in the central Sichuan Basin, southwestern China. Mar. Pet. Geol. 2017, 86, 1391–1405. [Google Scholar] [CrossRef]
  7. He, Q.; Yang, T.; Cai, L.; Ren, Q.; Dai, J. Porosity and permeability correction of laumontite-rich reservoirs in the first member of the Shaximiao Formation in the Central Sichuan Basin. Mar. Pet. Geol. 2023, 150, 106115. [Google Scholar] [CrossRef]
  8. Yang, C.; Zhang, J.; Tang, X.; Ding, J.; Zhao, Q.; Dang, W.; Chen, H.; Su, Y.; Li, B.; Lu, D. Comparative study on micro-pore structure of marine, terrestrial, and transitional shales in key areas, China. Int. J. Coal Geol. 2017, 171, 76–92. [Google Scholar] [CrossRef]
  9. Su, K.; Lu, J.; Zhang, G.; Chen, S.; Li, Y.; Xiao, Z.; Wang, P.; Qiu, W. Origin of natural gas in Jurassic Da’anzhai Member in the western part of central Sichuan Basin, China. J. Pet. Sci. Eng. 2018, 167, 890–899. [Google Scholar] [CrossRef]
  10. Xu, Q.; Ma, Y.; Liu, B.; Song, X.; Su, J.; Chen, Z. Characteristics and control mechanism of nanoscale pores in lacustrine tight carbonates: Examples from the Jurassic Da’anzhai Member in the central Sichuan Basin, China. J. Asian Earth Sci. 2019, 178, 156–172. [Google Scholar] [CrossRef]
  11. Xu, Q.; Liu, B.; Ma, Y.; Song, X.; Wang, Y.; Chen, Z. Geological and geochemical characterization of lacustrine shale: A case study of the Jurassic Da’anzhai member shale in the central Sichuan Basin, southwest China. J. Nat. Gas Sci. Eng. 2017, 47, 124–139. [Google Scholar] [CrossRef]
  12. Zhang, C.; Zhu, D.; Luo, Q.; Liu, L.; Liu, D.; Yan, L.; Zhang, Y. Major factors controlling fracture development in the Middle Permian Lucaogou Formation tight oil reservoir, Junggar Basin, NW China. J. Asian Earth Sci. 2017, 146, 279–295. [Google Scholar] [CrossRef]
  13. Zhang, J.; Li, X.; Wei, Q.; Gao, W.; Liang, W.; Wang, Z.; Wang, F. Quantitative characterization of pore-fracture system of organic-rich marine-continental shale reservoirs: A case study of the Upper Permian Longtan Formation, Southern Sichuan Basin, China. Fuel 2017, 200, 272–281. [Google Scholar] [CrossRef]
  14. Yang, G.; Huang, D.; Huang, P.; Yan, W.; Yang, T.; Dai, H.; Lin, J. Control factors of high and stable production of Jurassic Da’anzhai Member tight oil in central Sichuan Basin, SW China. Pet. Explor. Dev. 2017, 44, 866–875. [Google Scholar] [CrossRef]
  15. Ross, D.J.K.; Bustin, R.M. Investigating the use of sedimentary geochemical proxies for paleoenvironment interpretation of thermally mature organic-rich strata: Examples from the Devoniane-Mississippian shales. West. Can. Sediment. Basin. Chem. Geol. 2009, 260, 1–19. [Google Scholar]
  16. Yao, Y.B.; Liu, D.M. Comparison of low-field NMR and mercury intrusion porosimetry in characterizing pore size distributions of coals. Fuel 2012, 95, 152–158. [Google Scholar] [CrossRef]
  17. Jarvie, D.M.; Hill, R.J.; Ruble, T.E.; Pollastro, R.M. Unconventional shale-gas systems: The Mississippian Barnett Shale of north-central Texas as one model for thermogenic shale-gas assessment. AAPG Bull. 2007, 91, 475–499. [Google Scholar] [CrossRef]
  18. Nie, B.; Liu, X.; Yang, L.; Meng, J.; Li, X. Pore structure characterization of different rank coals using gas adsorption and scanning electron microscopy. Fuel 2015, 158, 908–917. [Google Scholar] [CrossRef]
  19. Clarkson, C.; Solano, N.; Bustin, R.; Bustin, A.; Chalmers, G.; He, L.; Melnichenko, Y.; Radliński, A.; Blach, T. Pore structure characterization of North American shale gas reservoirs using USANS/SANS, gas adsorption, and mercury intrusion. Fuel 2013, 103, 606–616. [Google Scholar] [CrossRef]
  20. Zou, C.; Lin, M.; Ma, F.; Liu, H.; Yang, Z.; Zhang, G.; Yang, Y.; Guan, C.; Liang, Y.; Wang, Y.; et al. Development, challenges and strategies of natural gas industry under carbon neutral target in China. Pet. Explor. Dev. 2024, 51, 476–497. [Google Scholar] [CrossRef]
  21. Liu, H.L.; Zhang, J.H.; Ji, Y.B.; Li, X.B. The controlling effect of kerogen type of shale on asphaltene nanopore and its exploration significance. Unconv. Oil Gas 2022, 9, 1–10. [Google Scholar]
  22. Yang, Y.; Yang, J.; Yang, G.; Tao, S.; NI, C.; Zhang, B.; He, X.; Lin, J.; Huang, D.; Liu, M.; et al. New research progress of Jurassic tight oil in central Sichuan Basin, SW China. Pet. Explor. Dev. 2016, 43, 954–964. [Google Scholar] [CrossRef]
  23. Tan, D.; Luo, L.; Song, L.; Liu, F.; Wang, J.; Gluyas, J.; Zhou, H.; Wang, J.; Zhu, C.; Mo, S.; et al. Differential precipitation mechanism of cement and its impact on reservoir quality in tight sandstone: A case study from the Jurassic Shaximiao formation in the central Sichuan Basin, SW China. Geoenergy Sci. Eng. 2023, 221, 111263. [Google Scholar] [CrossRef]
  24. Yuan, G.; Cao, Y.; Qiu, L.; Chen, Z. Genetic mechanism of high-quality reservoirs in permian tight fan delta conglomerates at the northwestern margin of the junggar basin, northwestern China. AAPG Bull. 2017, 101, 1995–2019. [Google Scholar] [CrossRef]
  25. Jiang, D.; Chen, H.; Xing, J.; Wang, Y.; Wang, Z.; Tuo, H. A new method for dynamic predicting porosity and permeability of low permeability and tight reservoir under effective overburden pressure based on BP neural network. Geoenergy Sci. Eng. 2023, 226, 211721. [Google Scholar] [CrossRef]
  26. Li, C.; Kong, L.; Ostadhassan, M.; Gentzis, T. Nanoscale pore structure characterization of tight oil formation: A case study of the Bakken Formation. Energy Fuels 2019, 33, 6008–6019. [Google Scholar] [CrossRef]
  27. Achour, S.H.; Okuno, R. Advanced modeling of diffusion and convection in multiphase compositional simulation for tight porous media. Geoenergy Sci. Eng. 2023, 230, 212183. [Google Scholar] [CrossRef]
  28. Massarweh, O.; Abushaikha, A.S. Application of surfactants in enhancing oil recovery from tight carbonates: Physicochemical properties and core flooding experiments. Geoenergy Sci. Eng. 2023, 221, 211400. [Google Scholar] [CrossRef]
  29. Yu, Z.; Wang, Z.; Adenutsi, C.D. Integration of rock physics, geostatistics, and Bayesian algorithm to estimate porosity in tight oil reservoirs. Geoenergy Sci. Eng. 2023, 230, 212224. [Google Scholar] [CrossRef]
Figure 1. Geological outline of Da’anzhai Member of the Jurassic in the Sichuan Basin and its stratigraphic information [14].
Processes 12 01057 g001
Figure 2. The results of pore structure analysis of the X1 and X2 samples. (a). High-pressure mercury intrusion of X1 and X2 samples; (b). CO2 adsorption of X1 and X2 samples; (c). N2 adsorption of X1 and X2 samples; (d). Pore size of X1 sample obtained by high-pressure mercury intrusion; (e). Pore structure of X1 sample obtained by CO2 adsorption; (f). Pore structure of X1 sample obtained by N2 adsorption; (g). Pore size of X2 sample obtained by high-pressure mercury intrusion; (h). Pore structure of X2 sample obtained by CO2 adsorption; (i). Pore structure of X1 sample obtained by N2 adsorption.
Processes 12 01057 g002aProcesses 12 01057 g002bProcesses 12 01057 g002cProcesses 12 01057 g002dProcesses 12 01057 g002e
Figure 3. Micro-scale and nano-scale CT results of X1 and X2 samples. (a). Micro-scale CT scan slice image of X1 sample; (b). Phase segmentation map of X1 sample; (c). Reconstruction of pore network model of X1 sample; (d). Micro-scale CT scan slice image of X2 sample; (e). Phase segmentation map of X2 sample; (f). Reconstruction of pore network model of X2 sample; (g). Nano-scale CT scan slice image of X2 sample; (h). Phase segmentation map of X2 sample; (i). Reconstruction of pore network model of X2 sample.
Processes 12 01057 g003
Figure 4. The reservoir space controlled by nonfabric in the shell limestone reservoir of the Da’anzhai Member in the Sichuan Basin. (a). X1 well, 2517 m, dissolution fractures, cross-polarized light; (b). X1 well, 2519 m, dissolution pore cavity, cross-polarized light; (c). X1 well, 2522 m, foraminifera, mud crystal, interlayer fracture, cross-polarized light; (d). X1 well, 2518 m, biogenic debris mainly composed of brachiopods, with less foraminifera and gastropoda content and biological erosion within the shell, cross-polarized light; (e). X2 well, 2355 m, flint-filled structural fracture, cross-polarized light; (f). X2 well, 2357 m, interlayer fracture, cross-polarized light; (g). X2 well, 2559 m, structural fracture; (h). X2 well, 2560 m, unfilled tensile crack of mudstone–limestone interbeds developed along the original compression fracture; (i), X2 well, 2565 m, coarse crystalline limestone developed dissolution pore cavity, cross-polarized light.
Processes 12 01057 g004
Figure 5. The reservoir space controlled by the shell in the shell limestone reservoir of the Da’anzhai Member in the Sichuan Basin. (a). X1 well, 2527 m, oriented arrangement of shells, cross-polarized light; (b). X1 well, 2530 m, shell limestone with developed dissolution fractures between the shells; (c). X2 well, 2566 m, limestone containing biogenic mud crystals, cross-polarized light; (d). X2 well, 2564 m, tabular laumontite crystals filled in intergranular dissolved pores, with intergranular pores developed, SEM; (e). X1 well, 2535 m, interparticle pores between dolomite particles and clay minerals; dolomite particles with good crystalline form; (f). X2 well, 2523.95 m, developed intraparticle pores and interparticle pores in terrestrial minerals; (g). X2 well, angular-shaped intergranular pores in pyrite framboids, 2201.47 m, SEM; (h). X2 well, 2258.85 m, interparticle pores between quartz and calcite; well-developed intraparticle pores within quartz particles, SEM; (i). X1 well, 2548.12 m, intraparticle pores located along cleavage planes of clay particles and interparticle pores between clay and carbonate minerals, SEM.
Processes 12 01057 g005
Figure 6. The reservoir space controlled by the matrix in the shell limestone reservoir of the Da’anzhai Member in the Sichuan Basin. (a). X2 well, 2566 m, fossiliferous mudstone, intergranular fracture, biogenic debris composed of bivalves, heavily fragmented and recrystallized, with a predominantly muddy matrix, no obvious effect from compaction, cross-polarized light; (b). X2 well, 2569 m, fossiliferous mudstone, biogenic debris composed of large bivalves, affected by wind and waves or water flow, with a gray mud matrix and recrystallization, and small amounts of terrigenous clay, cross-polarized light; (c). X2 well, 2575 m, biogenic debris mainly composed of bivalves, with a small amount of gastropods and foraminifera, matrix is gray mudstone, heavily recrystallized, and contains terrigenous clay, cross-polarized light; (d). X2 well, 2560.6 m, interparticle pores between dolomite particles and clay minerals; dolomite particles with good crystalline form; (e). Well-developed micro-cracks and pores with weak fillings and cements, SEM; (f). Well-developed micro-cracks within matrix minerals with weak filling, SEM; (g). Shell limestone has sutures and is filled with organic matter; (h). Fine-grained biogenic limestone, structural fractures cut the shells vertically, and calcite completely fills the fractures; (i). Fine-grained biogenic limestone. Structural fractures cut through the shells vertically, and calcite completely fills the fractures.
Processes 12 01057 g006
Figure 7. The T2 relaxation time of X1 sample.
Processes 12 01057 g007
Figure 8. Multi-analysis method to identify the multi-porous medium of shell limestone. (a). Double logarithmic pressure recovery curve of typical well test in X1 sample; (b). Typical production curve of the X1 well; (c). The schematic diagram of the seepage characteristics of different pores in the shell limestone of the Da‘anzhai Member.
Processes 12 01057 g008aProcesses 12 01057 g008b
Figure 9. SEM of rock samples from the Da’anzhai Member in the central Sichuan Basin. (a). Surface pore rate is 7.6%; (b). Surface pore rate is 8.6%; (c). Surface pore rate is 8.9%; (d). Surface pore rate is 9.9%. The yellow frames in the diagram represent small-scale nanometer pores observed in the SEM.
Processes 12 01057 g009
Figure 10. Macro-CT scan results of X1 and X2 samples. Light color: high-density area, reflecting the matrix portion; dark color: low-density area, reflecting the pore portion; (a). Macro-CT result of X1 sample; (b). CT slice image of X1 sample; (c). Macro-CT result of X2 sample; (d). CT slice image of X2 sample. The red line represents the x-axis, the blue line represents the y-axis, and the yellow line represents the z-axis.
Processes 12 01057 g010
Figure 11. Three-dimensional reconstruction and frequency distribution of porosity of X1 and X2 samples. (a). Three-dimensional reconstruction of X1 sample with porosity larger than 5.0%; (b), Three-dimensional reconstruction of X2 sample with porosity larger than 5.0%; (c). Porosity distribution frequency plot of X1 sample obtained by CT; (d). Porosity distribution frequency plot of X2 sample obtained by CT.
Processes 12 01057 g011
Figure 12. SEM results of X1 and X2 samples. (a). SEM of X1 sample; (b). SEM of X2 sample.
Processes 12 01057 g012
Figure 13. Nano-scale SEM of X1 and X2 samples. (a). SEM of X1 sample; (b). SEM of X2 sample.
Processes 12 01057 g013
Figure 14. Nano-scale SEM with development characteristics of fractures of X2 sample. (a). Intergranular microfractures; (b). Calcite grain cleavage fractures.
Processes 12 01057 g014
Figure 15. Three-dimensional reconstruction of fractures of X1 sample.
Processes 12 01057 g015
Figure 16. Reservoir-permeability model distribution schematic of shell limestone reservoir in Da’anzhai Member obtained by thin section and CT. (a). Distribution of pore-throat systems in thin sections; (b). Distribution of pore-throat systems in nano-CT. ① Along-fracture dissolution pore type; ② Microfracture type; ③ Isolated pore type; ④ Intergranular pore type.
Processes 12 01057 g016
Figure 17. SEM of reservoir space in the shell limestone of X1 and X2 samples. (a). X1 well, 2056.3 m, disso-lution holes and dissolution micro-holes; (b). X2 well, 2057 m, shell biofabric pore; (c). X1 well, 2580.9 m, intergranular pores of pyrite; (d). X1 well, 2379.7 m, fragmental grain edge fracture; (e). X1 well, 2672.6 m, inter-shell edge fracture and inter-shell cleavage fracture; (f). X1 well, 2022.2 m, pressure solution fracture line, inter-shell bright calcite.
Processes 12 01057 g017
Figure 18. Comparison of reservoir-permeability models between shell limestone and tight sandstone. (a). Reservoir-permeability model diagram of tight sandstone; (b). Reservoir-permeability model dia-gram of shell limestone in the Dașanzhai Member.
Processes 12 01057 g018
Table 1. Types and characteristics of reservoir spaces in the Da’an Zhai Member shell limestone reservoir.
Fabric ControlReservoir SpaceType of Pore or FractureCauseCharacteristicsScale of Pore or Fracture
The reservoir space controlled by nonfabricporedissolution pore dissolution pore cavityformed by calcite dissolutionIrregular patch-like or bay-likePore size larger than 0.1 μm
fracturestructural fractureformed by tectonic stressLinear, developed in groupsFracture width larger than 1 μmFracture length: several cm to tens of kilometers
interlayer fracturefractures between rock beddingsSaw-toothed, developed in parallel beddingFracture width in the range of 1~3 μmFracture length: several centimeters to several kilometers
dissolution fractureformed by dissolutional modification of pre-existing fracturesMaintaining the original shape of the fracturesFracture width larger than 0.5 μmFracture length: several micrometers to several tens of kilometers
The reservoir space controlled by fabricThe reservoir space controlled by the shell poreShell fabric porethe interstitial space of skeleton in the growing shell, visible upon complete preservationSimilar to intergranular pores, but isolated and with poor connectivitypore diameters in the range of 0.05~0.1 μm
The intercrystalline pores in the shellformed by recrystallization of the inter-shellBlocky, with small pores and narrow throatspore diameters less than 0.5 μm
fractureFracture in inter-shell outer margin fracture of the shellDeveloped along the edge of bivalve shellsFracture width less than 0.5 μmFracture length: several mm to several cm
Fracture in inter-shellformed by local stress-induced cracking of the shellMostly in a mesh-like pattern, with relatively intact bivalve shellsFracture width in the range of 0.1~1 μmFracture length: several mm to several tens of cm
Shell fabric fractureformed by the preservation of growth lines on the shellFractures are short in length, developed in a parallel group pattern, and have poor connectivityFracture width less than 0.1 μmFracture length: several mm to several tens of cm
The reservoir space controlled by the matrixporeIntercrystalline porePore between carbonate crystalsDispersed, with small pores and narrow throats pore diameters in the range of 0.1~1 μm
Intergranular poreIntergranular pore in minerals such as quartz and pyriteElliptical dispersed, larger than intergranular porespore diameters in the range of 0.1~5 μm
fractureIntergranular fractureMicrofractures at the contact edges of calcite crystal grainsShort in length, controlled by the size of the grainsFracture width less than 0.1 μmFracture length: several μm to several mm
Turtle-shaped factureFormed by local stress-induced fracturing of the matrixTurtle shell-like pattern, with relatively good connectivityFracture width in the range of 0.1~0.3 μmFracture length: several μm to several mm
Table 2. Statistics and comparison table of connected porosity of shell limestone.
Measurement ContentTotal Porosity of Connected Pores Effective Porosity of Connected PoresComparative Sample
Experimental methodHelium porosity methodWater saturation methodHigh-pressure mercury intrusion methodConstant velocity pressure mercury porosimetryN2 adsorption methodKerosene method, alcohol method
Measurement rangeAll connected poresLess than helium methodPore diameter larger than 3.7 nmPore diameter larger than 120 nmPore diameter less than 150 nmLess than helium method
Porosity/%1~5/(avg. 2.12)0.5~2/(avg. 1.59)0.5~1.5/(avg. 0.97)0.1~2.2/(avg. 1.02)0.5~2.5/(avg. 1.44)0.3~3.9/(avg. 0.99)
Table 3. Characteristics of typical pore-throat system of shell limestone in the Da’anzhai Member.
Type of Pore-Throat SystemModel CharacteristicsPattern FigureTypical Figure
Pore (Storage Space)Throat (Flow Pathway)Pore-Throat Difference
TypeSizeTypeSize and Shape
Dissolved pores adjacent to the fractureDissolution pore
Dissolution pore cavity
Pore diameter larger 10 μmStructural fracture, secondary microfractureLong–slender typeMediumProcesses 12 01057 i001Processes 12 01057 i002
Microfractures controlled by the shellFabric fracture in internal shell
Fracture in intra-shell
Minor vuggy structure
Fracture width less than 1 μmMicrofractureLong–slender typeNoneProcesses 12 01057 i003Processes 12 01057 i004
Microfractures controlled by the fillingIntercrystalline fracture
Crazing fracture
Minor intercrystalline pore
Fracture width less than 0.3 μmMicrofractureLong–slender typeNoneProcesses 12 01057 i005Processes 12 01057 i006
Intracrystalline (intergranular) poresIntergranular pore
Intercrystalline pore
0.1~5 μmPore contraction sectionShort–slender type SmallProcesses 12 01057 i007Processes 12 01057 i008
Isolated poresDissolution pore
Dissolution micro-pore
Fabric fracture in internal shell
Intercrystalline pore
0.1~10 μmPore contraction sectionShort–thick typeSmallProcesses 12 01057 i009Processes 12 01057 i010
Disclaimer/Publisher’s Note: The statements, opinions and data contained in all publications are solely those of the individual author(s) and contributor(s) and not of MDPI and/or the editor(s). MDPI and/or the editor(s) disclaim responsibility for any injury to people or property resulting from any ideas, methods, instructions or products referred to in the content.

