Abstract
This study aimed to investigate the effect of exogenous nanoparticles on the rheological properties of artificial saliva. There are four reasons for undertaking this type of research: Firstly, the number of solid particles of various origins present in the air is still high. Secondly, nanoparticles (including silver and gold nanoparticles) are increasingly used in food packaging and can migrate into food. Thirdly, saliva is the first biological fluid that comes into contact with exogenous particles. Finally, the function of saliva is also closely related to its rheological properties. Due to the remarkable properties of nano-objects, nanoparticles of various origins in the body may cause effects that have not been realised until now. Therefore, each type of nanoparticle must be tested in terms of its impact on the body/body fluid. We used silver and gold nanoparticles because they are used in the food industry, and diesel exhaust particles because they are standard components of air pollution. The effect of various nanoparticles (e.g., their size and shape) on the rheology of saliva at two temperatures was investigated. The constants of the power law constitutive equation were also estimated. Studies showing the impact of nanoparticles on the rheology of body fluids are rare because it is one of the less obvious ways of their affecting the human body. However, the results show that nanoparticles are not neutral to the biological fluid, which may translate into a change in its properties and thus disturb its functions.
1. Introduction
The respiratory tract is the main route for air pollutants entering the body. Deposition of solid particles, depending on their size, occurs in different areas of the respiratory tract. The nasal cavity and the mouth are equally exposed to pollution, as we often breathe through the mouth. If we breathe through the mouth, we first deprive ourselves of the protective function of the nasal lining, puncturing many of the large particles/pathogens flowing through the nasal cavity. This can lead to rapid irritation of the throat and lower parts of the respiratory system. In addition, tissues and liquids in the oral cavity are exposed to external particles such as nanoparticles and particulate matter.
Particulate matter in the atmosphere has a solid core consisting of elemental carbon, with organic and inorganic substances adsorbed thereon. The particles’ size, the type of compounds on their surface, and the amount and number of particles depend on the emission source. The second major emitter of particulate dust is the automotive industry. The diesel exhaust particles (DEPs—soot aggregates) emitted from diesel engines without diesel particulate filter (DPF) constitute nearly 70% of solid particles present in the atmosphere that have an aerodynamic diameter of fewer than 10 μm [1]. The soot aggregates are composed of primary particles with an elemental carbon core. Primary particles bind together and form fractal-like aggregates. An extensive surface area and a complex shape characterise the DEPs. There are various organic (mostly polycyclic aromatic hydrocarbons) and inorganic (sulfate and metallic ash) compounds adsorbed on DEPs’ surfaces [2]. The chemical components on DEPs’ surfaces constitute nearly 80% of the DEPs’ mass [3,4]. The size of DEPs varies from 10 nm even to 10,000 nm, and, like their shape and chemical composition, it strongly depends on fuel composition, engine condition and age, etc.
It is estimated that almost 50% of urban particulate matter comes from vehicle emissions [5]. Soot particles cause many diseases. Cancer is one of them. Cancers caused by soot are both systemic and localised in character [6]. Respiratory disorders are the second main health concern associated with soot, and they can occasionally become very severe. Cardiovascular dysfunctions come in third. In addition to these illnesses, exposure to soot has also been linked to a few unusual pathological observations [7].
The wide applications (e.g., textiles and fabrics, food containers, kitchen appliances, cosmetics, deodorants, water filters, toys, and alternative health supplements) of silver nanoparticles (AgNPs)-containing products lead to the exposure of both the environment and individuals to their impact on the different phases of their life cycle [8]. This includes synthesis and manufacturing, distribution, end-product use, and waste disposal. AgNPs may be released into the environment via wastewater streams and effluent. In wastewater disposal plants, AgNPs are retained in sewage sludge [9]. AgNPs delivered by inhalation or ingestion are subsequently identified in blood and induce toxicity in various organs, including the lungs, liver, kidney, intestine, and brain, according to in vivo biodistribution and toxicity studies conducted on rats and mice [10].
Products containing gold nanoparticles (AuNPs) rank sixth among nanotechnology consumer products [11]. The applications of AuNPs include, but are not limited to, electronics, sensors, solar cells, catalysis, cosmetics, and dietary supplements. The AuNPs’ biomedical applications are particularly interesting, including photothermal cancer therapy [12], diagnosis, drug delivery, and tissue engineering. Recently, to reduce the risk associated with systemic exposure, the use of inhaled AuNPs as drug carriers and radiosensitisers [13] has been investigated. The increasing use of AuNPs in industrial processes and biomedical research involves the exposure of a higher number of workers.
AuNPs are generally believed to be nontoxic. However, some studies have reported damage to the liver and kidneys [14], delays in the development of eyes and pigmentation [15], lung and kidney haemorrhage, lymphocytic infiltration, and inflammatory response [16].
Both AgNPs and AuNPs, due to their bactericidal properties, are used in food packaging, from where they can migrate to food and thus enter the body through the digestive tract [17]. The time and intensity of migration depend on many factors, so qualitative research is still needed to show the phenomenon’s scale. The effect of specific nanostructures on the human body must be determined separately, since the physical and biological properties of materials are strictly connected to their size. Various effects are observed for micro and nanoparticles formed from the same or similar material. Animal studies prove that gold, silver, iridium, titanium dioxide, polystyrene, and carbon nanoparticles ranging from 5 nm to 100 nm translocate across the air–blood barrier. Nanoparticles have been found in bones and organs [18,19,20,21,22]. External particles were transported to organs using body fluids such as saliva, nasal and bronchial mucus, lymph, and blood. There are fundamental questions related to the above. Do nanoparticles present in biological fluids affect the rheological properties of these fluids? And hence, do they lead to changes in, for example, liquid viscosity? Can they disrupt their original functions?
Saliva plays a vital role in the breakdown of food and taste perception [23]. However, one of the most crucial functions of saliva is to provide lubrication between hard and soft tissues and protection against the mouth’s mechanical, chemical, and thermal irritations. The functions of saliva are strictly connected to its composition, which also determines saliva’s rheological properties. Salivary composition depends on age, activity, gender, stimulating factors, etc. [24]. In terms of amount, the main component of saliva is water (about 99% w/w). Still, more critical components include proteins (especially glycoproteins such as mucins, enzymes, and antibodies), electrolytes, lipids, and sugars [25]. Their presence gives the saliva the necessary chemical and rheological properties to perform the described functions. Like other body fluids (mucus or blood), saliva is a non-Newtonian, pseudo-plastic fluid. The presence of mucins (large glycoproteins) and electrolytes also determines the rheological properties of saliva. The viscosity of saliva decreases while the shear rate increases. At a shear rate of 0.02 1/s, the apparent viscosity is 100 mPas, but at 95 1/s, it is 2.5 mPas [26].
The viscosity of saliva depends on many factors (age, gender, health condition, physical activity, etc.) [27,28], and changes in viscosity, as shown by Yas and Radhi [29], may influence the severity of caries. Moreover, Sajewicz [30] found that at low saliva viscosity, some instability of the tribological characteristics can be observed, and the probability of severe wear of enamel substantially increases. However, according to the best knowledge of the authors of this paper, research on the effect of exogenous particles of different origins and sizes on salivary rheology has been minimal.
Penconek et al. [31] have studied the influence of Arizona Test Dust (ATD) on saliva model rheology. ATD is commonly used in many applications, such as water and air filter performance testing. It is obtained from raw Salt River Valley (Arizona) dust in a four-step process. Therefore, it might be assumed that it is a good equivalent of natural dust. The presence of ATD in the saliva model increased its apparent viscosity.
Penconek et al. [32] have used diesel exhaust particles (DEP) as an example of exogenous anthropogenic particles. The results showed an unexpected decrease in the saliva model’s apparent viscosity. The nature of particle–mucin interactions probably causes this effect.
Przekop et al. [33] have studied the influence of microplastic, namely polyethylene (PE) and polystyrene (PS), on the rheology of model saliva. At low shear rates, the viscosity of artificial saliva increased due to the presence of microplastics. As the shear rate increased, the effect became progressively weaker, as is usual for solid particle suspensions in fluids [34]. Additionally, the presence of microparticles led to non-Newtonian behaviour of the saliva, resulting in a significant decrease of the flow index value in the power law model.
These results may indicate another way air pollution impacts the human body—a rarely considered path. Moreover, recent research shows that nanoparticles may have a nontrivial influence on body fluids [35].
Therefore, our research aimed to determine the impact of environmental pollutants such as DEPs, AgNPs, and AuNPs on the rheology of model saliva. Based on the results obtained, it will be possible to determine potential changes in the functioning of saliva, which may translate into health disorders. The results also constitute an essential input into public discussion on new health risk areas resulting from technological development.
2. Materials and Methods
2.1. Exogenous Particles
2.1.1. Soot Aggregates—Diesel Exhaust Particles (DEPs)
Diesel exhaust particles (DEPs) were used as an example of exogenous anthropogenic particles. The DEPs were obtained directly from the combustion of two sulphur-free diesel oils for a diesel engine (Mercedes-Benz 240D, engine power 53 kW at 4200 rpm, torque 137 Nm at 2400 rpm, engine displacement 2399 cm3) in the way described in previous studies [36]. Two types of diesel oil were used to generate the DEPs (Ecodiesel [cetane number 51] and Verva [cetane number 55]). The DEPs were collected in a 50 mm diameter glass Petri dish, similar to those described elsewhere [37], and stored in the dark at 4 °C.
The size distribution of the DEPs in the air was determined using a spectrometer (FAPES Grimm, Ainring, Germany). The size distribution in water was obtained using the Zetasizer (Malvern, UK). The morphology of DEPs was described based on SEM images (Zeiss Ultra Plus, Jena, Germany) (Figure 1). The characteristics of DEPs are shown in Table 1.
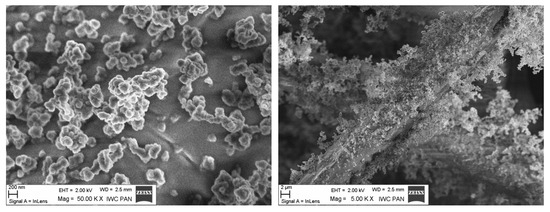
Figure 1.
The aggregates of DEPs.

Table 1.
The characteristics of DEPs (DEPs 1 from Ecodiesel, DEPs 2 from Verva).
2.1.2. Gold Nanoparticles (AuNPs) and Silver Nanoparticles (AgNPs)
Two types of AuNPs (5 nm particle size—5.5 × 10¹³ #/mL and 50 nm particle size 3.5 × 10¹⁰ #/mL) and two kinds of AgNPs (40 nm particle size and 10 nm particle size, both 0.02 mg/mL) purchased from Sigma-Adrich (Poznań, Poland) were used in the study.
2.2. Saliva
Several factors, including age, gender, health status, and even the saliva donor’s emotional stress, can significantly impact natural saliva content, rheology, and flow [38]. To guarantee the reliability of the findings, we consequently decided to employ artificial saliva in our investigation.
Artificial saliva was obtained based on the model described by Christersson et al. [39]. The following components were dissolved in deionised water: benzalkonium chlorides ((Sigma-Aldrich, Poznań, Poland) [0.02 g/L], EDTA (Sigma-Aldrich, Poznań, Poland) [0.5 g/L], NaF (Chempur, Piekary Ślaskie, Poland) [0.0042 g/L], xylitol (Sigma-Aldrich, Poznań, Poland) [20 g/L], methylparaben (Sigma-Aldrich, Poznań, Poland) [1 g/L], and mucins (type II) (Sigma-Aldrich, Poznań, Poland) [35 g/L]. They were then placed on a magnetic stirrer (500 rpm) for 2 h. The pH of the solution (7.00) was determined using NaOH or HCl. The sample was stored and sealed at 4 °C.
3. Methodology
The rheological properties of saliva with DEPs, AgNPs, and AuNPs were investigated. Two base suspensions of DEPs in ultrapure water were prepared at 0.2 mg/mL and 0.6 mg/mL. They were sonicated in an ultrasonic cleaner (Sonic 14, Polsonic Palczyński, Warsaw, Poland) for 30 min at 22 °C and then diluted to obtain test concentrations 0.01 mg/mL and 0.06 mg/mL, referenced in figures as c1 and c2, respectively.
The influence of AuNPs and AgNPs on saliva rheology was carried out at the following concentrations:
| c1 | c2 | |
| 10 nm AgNPs | 0.01 mg/mL | 0.002 mg/mL |
| 40 nm AgNPs | ||
| 5 nm AuNPs | 2.75 × 10¹² #/mL | 5.5 × 10¹¹ #/mL |
| 50 nm AuNPs | 1.75 × 10⁹ #/mL | 3.5 × 10⁸ #/mL |
The rheological properties (flow curve and viscosity dependence as a shear rate function) were determined using an oscillation rheometer (MCR102, Anton Paar, Graz, Austria) equipped with a Peltier system in a plate–plate system for a 1 mm wide gap. The shear rate range was 0–100 s−1, corresponding to typical activities such as the movement of particles across the tongue, swallowing, speaking, and eating [40].
The test temperatures of 36.6 °C and 40 °C represented healthy and sick human instances. The second temperature was selected to be much lower than the temperature of protein denaturation and high enough to allow for the observation of a discernible variation in viscosity. The Anton Paar RheoCompass 1.25 software was used to run the rheometer. In the space between rotating parts (such as two plates or a cone and a plate), the oscillating rheometer sheared a fluid sample. Shear stress in the studied sample is caused by a certain shear rate forced by a measuring device’s established rotational frequency. The torque applied on the measuring element’s axis was used to compute shear stresses. Finally, the relationship between shear stress and shear rate, known as the flow curve, was achieved.
The appropriate sample of the investigated liquid was applied to the bottom plate of the rheometer using an automatic pipette. The measurement was preceded by the preparation procedure involving mixing for 1 h at a stirrer speed of 100 rpm at room temperature (22 °C). The rheological measurement included two consecutive intervals. The sample was subjected to a steady shear rate for two minutes during the first interval, and the actual measurement was performed during the second one. The method of measuring sample rheology was selected, considering the chain structure of the main component of saliva—mucins. Mucins are long glycoprotein chains whose degree of order affects the rheological properties of the solution. Long chains can be knotted and organised depending on the degree of mixing, which immediately translates into perceived viscosity. Reduced apparent viscosity is the result of improved chain alignment and less tangling. Our sample preparation method and the two-interval measurement technique removed any possibility that the uneven mixing of the examined samples would have affected the rheological measurement outcome. The findings are the arithmetic mean of the measurements, each of which was performed at least three times.
The Ostwald–de Waele power-law rheological model’s constants were found using the least squares method:
where n is the flow behaviour index, k is the flow consistency index, τ is the shear stress, and μ is the apparent viscosity. The flow curve is described by Equation (1), and the relation describing apparent viscosity is used to derive Equation (2) from Equation (1):
While the dimensions of the flow consistency index, k, depend on n, the flow behaviour index, n, is dimensionless. For fluids that are pseudoplastic (shear thinning), n < 1. The fluid is dilatant instead of pseudoplastic when n > 1. The fluid is Newtonian if n = 1. k equals μ in this instance.
The Matlab R2022b Curve Fitting Toolbox was used for the analysis. In our case, nonlinear least squares were the most suitable method for calculating model coefficients. The following matrix form is included in a nonlinear model:
where X is an n-by-m matrix of explanatory variables, ε indicates an n-by-1 vector of unknown specification errors, y is an n-by-1 vector of response data, β is an m-by-1 vector of coefficients, and f is a provided nonlinear function.
y = f(X,β) + ε
Next, the fitted curve is computed using the current set of coefficients. Then, ŷ = f(X,β) yields the fitted response value ŷ, which is calculated using the Jacobian of f(X,β). A matrix of partial derivatives calculated concerning the coefficients in b is the definition of the Jacobian of f(X,β). Lastly, the trust-region approach is used to update the coefficient values [41]. Equation (1) was the subject of the regression analysis. Nonetheless, the flow consistency and flow behaviour indices yielded precisely the same values in the regression for Equation (2).
4. Results and Discussion
The saliva model is a non-Newtonian shear-thinning fluid. Its viscosity decreases as the shear rate increases. The results presented in the figure are the ensemble average values. Figure 2 shows the relation between shear stress, τ, and shear rate, γ, while Figure 3 presents the relation between apparent viscosity, μ, and shear rate. Figure 2 and Figure 3 show the same relations in two different ways. However, a graph of shear stress vs. shear rate looks like the relations for Newtonian fluid, while the one presenting apparent viscosity vs. shear rate proves the non-Newtonian behaviour for low shear rates.
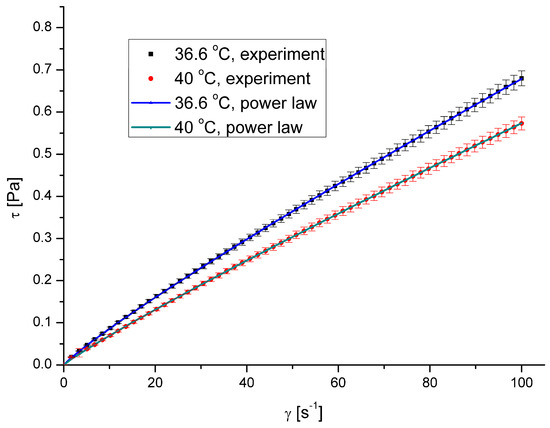
Figure 2.
Shear stress vs. shear rate for pure saliva.
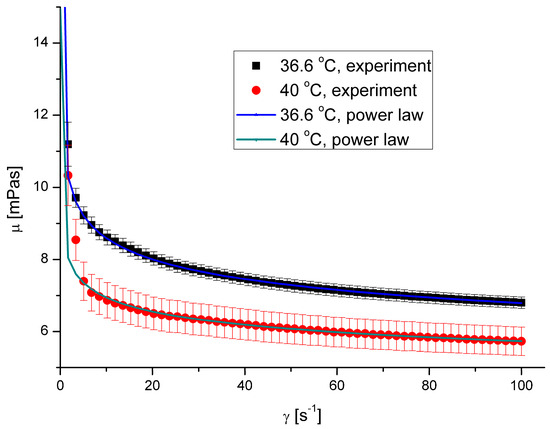
Figure 3.
Apparent viscosity vs. shear rate for pure saliva.
The calculated values of the flow behaviour index were 0.8978 and 0.9168 for the temperatures 36.6 °C and 40 °C, respectively, with a coefficient of determination R2 exceeding 0.97 in both cases.
4.1. The Effect of DEPs on Saliva Rheology
The presence of both types of DEPs in saliva causes a decrease in saliva’s apparent viscosity (Figure 4, Figure 5, Figure 6 and Figure 7). However, DEP concentration does not significantly affect saliva rheology in both cases. In addition, although the suspension was formed, it did not affect the fluid’s nature; the calculated flow behaviour index was in the range of 0.85–0.92 for all the cases. The k, n, and R2 values are shown in Table 2 and Table 3.
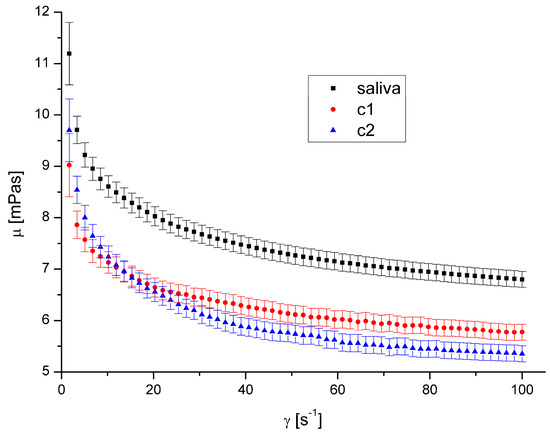
Figure 4.
Apparent viscosity vs. shear rate for DEP 1 at 36.6 °C.
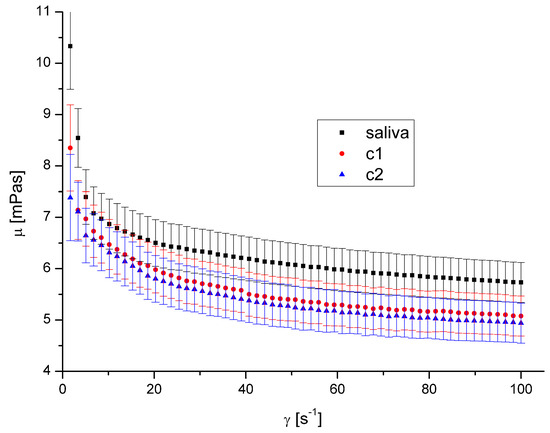
Figure 5.
Apparent viscosity vs. shear rate for DEP 1 at 40 °C.
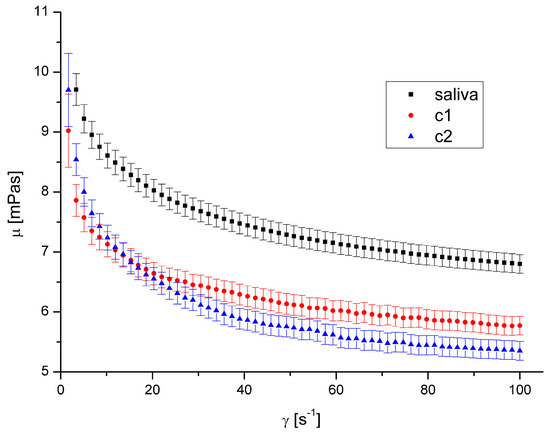
Figure 6.
Apparent viscosity vs. shear rate for DEP 2 at 36.6 °C.
Figure 7.
Apparent viscosity vs. shear rate for DEP 2 at 40 °C.
Table 2.
Power law constants at 36.6 °C.
Table 3.
Power law constants at 40 °C.
The shape and size of DEPs 1 and DEPs 2 in water are quite similar. Their main difference is the chemical composition and the aggregates’ size in the air. Our previous study [32] showed that the amount of PAH on the DEPs 1 surface is 153.3 μg/g, while it is 104.5 μg/g for DEPs 2. The difference in aggregates’ mean diameter in the air is irrelevant in this case because the aggregates were suspended in water, and the diameter in the water was very similar.
Since the observed effect on salivary rheology is identical for both types of DEPs, we assume that the chemical composition of aggregates in the considered range has little or negligible significance for the viscosity of saliva. Because we also did not observe any effect of aggregates’ concentration, we assumed that only the presence of particles of a specific size influenced the viscosity in this case.
A decreased fluid viscosity by adding suspended particles is not typical behaviour, but it has been observed in rare cases for complex fluids [35,42,43]. Recently, Przekop et al. [33] have shown that plastic microparticles decrease the apparent viscosity of model human mucus. Mucus contains mucins in even higher concentration than saliva. Recent research by Ben-David et al. [44] demonstrated that the mucin network of jellyfish mucus captures the microplastic particles rather than allowing them to form a suspension. This could be the cause of any changes to its mechanical characteristics, which could have an impact on those characteristics and reduce saliva’s apparent viscosity. DEPs had a diminishing influence on mucus viscosity over the complete range of shear speeds that were examined.
4.2. The Effect of AgNPs and AuNPs on Saliva Rheology
The presence of AgNPs and AuNPs in artificial saliva, regardless of their size, type, concentration, and temperature, has not significantly influenced saliva’s rheological properties (Figure 8, Figure 9, Figure 10 and Figure 11). The obtained flow behaviour indexes were in the range of 0.84–0.94. Considering the mean values and standard deviation, the apparent viscosity is equal for saliva and saliva with gold and silver nanoparticles. The k, n, and R2 values are shown in Table 2 and Table 3.
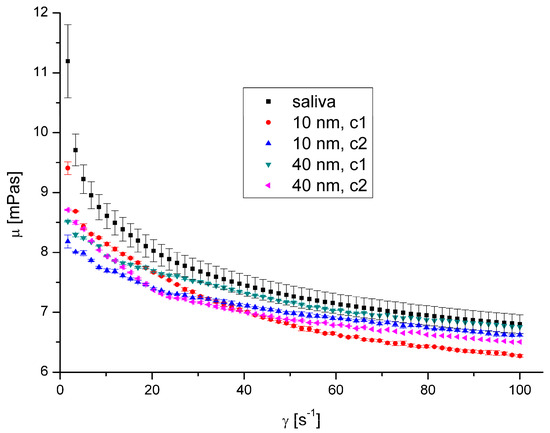
Figure 8.
Apparent viscosity vs. shear rate for AgNPs at 36.6 °C.
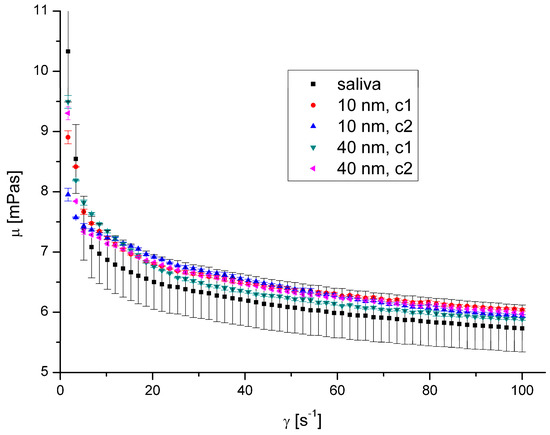
Figure 9.
Apparent viscosity vs. shear rate for AgNPs at 40 °C.
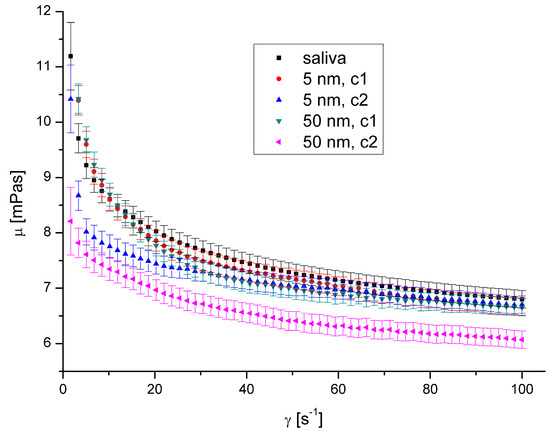
Figure 10.
Apparent viscosity vs. shear rate for AuNPs at 36.6 °C.
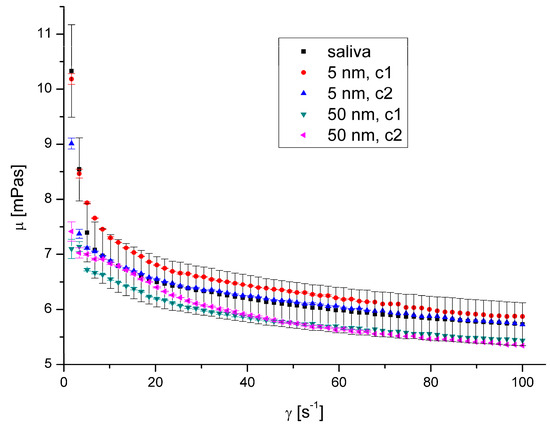
Figure 11.
Apparent viscosity vs. shear rate for AuNPs at 40 °C.
The observed lack of influence of silver and gold nanoparticles on salivary rheology is surprising, especially considering the results obtained by other researchers.
Barbero et al. [45] found that gold nanoparticles interact with mucins and form a complex. They showed the effect of AuNPs concentration and no size effect on the formation of complexes. Belgorodsky et al. [46] showed that such materials as carbon nanotubes, fullerene-like WS2, or nanocolloidal suspensions of C60 fullerene create a complex with mucin glycoprotein. They demonstrated that mucins have capabilities for binding nanomaterials. Moreover, Hendler et al. [47] used mucins for synthesising stable chiral AgNPs connected with mucin. They combined AgNO3 with bovine submaxillary mucin at room temperature in an appropriate environment, which led to the production of silver nanoparticles complexed with mucins.
In each of these cases, the researchers received stable complexes. However, they did not determine the effect of such a complex on mucins’ behaviour, which can be indirectly observed due to the change of rheological properties.
In 2013, McGill and Smith [48] hypothesised that the nanoparticles entering the mucus reorganise the mucins by crosslinking them, affecting mucus permeability as a protective barrier. Mucus permeability is strictly connected with its viscosity, which depends on the mucin structure.
The conformation of mucin depends on various factors, such as pH [49] and ionic strength [50]. When pH decreases, the crosslinking of mucins increases, just like their viscoelasticity. Therefore, we assumed that binding the nanoparticles by mucins (present in saliva) caused mucin crosslinking changes, leading to changes in rheological properties.
However, obtained results suggest that the rheological properties are immutable regardless of whether silver and gold nanoparticles in sizes 5–10 nm and 40–50 nm are present in saliva. The lack of influence of nanoparticles in the size range of up to 50 nm compared to the observed influence of nanoparticles with a length of approximately 300 nm may also result from the different probability of combining nanoparticles with mucin chains depending on the size of the nanoparticles. Nanoparticles with a diameter of up to 50 nm do not attach to mucin chains or connect to a limited extent and can move freely between mucin chains. There is, therefore, a risk that such particles will not be retained by the saliva or mucus layer in the respiratory tract (which also contains mucin chains) and will, therefore, be able to affect epithelial cells. Geiser and Kreyling [22] indicated that the ability of inhaled 80 nm iridium nanoparticles to translocate to bones and soft tissues is about one order of magnitude less than 20 nm. This shows that small-sized particles that do not bind to mucin chains can freely penetrate and move inside the body. The smaller the particle’s diameter, the easier the translocation and the more significant the potential impact on the body.
5. Conclusions
We investigated two groups of nanoparticles: small (5–50 nm), spherical, single-component gold and silver nanoparticles; and large (~300 nm), dendritic in shape, multi-component soot aggregates. We demonstrated that the second group of nanoparticles influenced the saliva’s rheology: the presence of DEPs caused a decrease in saliva viscosity. Thus, we may conclude that DEPs are likely captured by mucin networks, which influence their mechanical properties. The reduction in saliva viscosity due to the presence of DEPs could also result from the release of ions from the DEP surface, which leads to an increase in the ionic strength of the solution caused by the shrinkage of mucins. Considering the influence of low saliva viscosity on the occurrence of instability in the tribological characteristics, and the increase in the probability of severe wear of enamel observed by other researchers, our results may be clinically relevant.
Author Contributions
Conceptualisation, A.P., A.M. and U.M.; methodology, A.P. and U.M.; formal analysis, R.P.; investigation, A.P. and U.M.; writing—original draft preparation, R.P. and A.P.; writing—review and editing, R.P., A.P., U.M. and A.M.; visualisation, R.P.; supervision, A.M. All authors have read and agreed to the published version of the manuscript.
Funding
The work was financially supported by the Warsaw University of Technology under grant I-Chem.5 of the Scientific Council of Chemical Engineering.
Data Availability Statement
The data presented in this study are available on request from the corresponding author.
Acknowledgments
The authors thank Michał Sirodzki for carrying out part of the experimental research.
Conflicts of Interest
The authors declare no conflicts of interest.
References
- Weinhold, B. Fuel for the long haul: Diesel in America. Environ. Health Perspect. 2002, 110, A458–A464. [Google Scholar] [CrossRef] [PubMed]
- Fasino, C.R.; Carino, M.; Bombelli, F. Oxidant profile of soy standardized extract. In Joint Meeting 2001—Book Abstracts ‘2001 Year of Natural Products Research, 1st ed.; Rubin, R., Stryger, C.S., Eds.; Harper and Row: New York, NY, USA, 2001. [Google Scholar]
- Wosiński, S. Effect of Composition and Processing Conditions of Ceramic and Polymer Composites on the Electric Field Shielding Ability. Ph.D. Thesis, Poznań University of Technology, Poznań, Poland, 2010. [Google Scholar]
- Trapido, M.; Kulik, N.; Veressinina, Y.; Munter, R. Fenton treatmen efficacy for the purification of different kinds of wastewater. Water Sci. Technol. 2009, 60, 1795–1801. [Google Scholar] [CrossRef]
- Cassee, F.R.; Heroux, M.E.; Gerlofs-Nijland, M.E.; Kelly, F.J. Particulate matter beyond mass: Recent health evidence on the role of fractions, chemical constituents and sources of emission. Inhal. Toxicol. 2013, 25, 802–812. [Google Scholar] [CrossRef] [PubMed]
- Subramanian, M. Global health: Deadly dinners. Nature 2014, 509, 548–551. [Google Scholar] [CrossRef] [PubMed]
- Niranjan, R.; Thakur, A.K. The toxicological mechanisms on environmental soot (black carbon) and carbon black: Focus on oxidative stress and inflammatory pathways. Front. Immunol. 2017, 8, 763. [Google Scholar] [CrossRef] [PubMed]
- McGillicuddy, E.; Murray, I.; Kavanagh, S.; Morrison, L.; Fogarty, A.; Cormican, M.; Dockery, P.; Prendergast, M.; Rowan, N.; Morris, D. Silver nanoparticles in the environment: Sources, detection and ecotoxicology. Sci. Total Environ. 2017, 575, 231–246. [Google Scholar] [CrossRef]
- Doolette, C.L.; McLaughlin, M.J.; Kirby, J.K.; Navarro, D.A. Bioavailability of silver and silver sulfide nanoparticles to lettuce (Lactuca sativa): Effect of agricultural amendments on plant uptake. J. Hazard. Mater. 2015, 300, 788–795. [Google Scholar] [CrossRef] [PubMed]
- Ferdous, Z.; Nemmar, A. Health Impact of Silver Nanoparticles: A Review of the Biodistribution and Toxicity Following Various Routes of Exposure. Int. J. Mol. Sci. 2020, 21, 2375. [Google Scholar] [CrossRef] [PubMed]
- Vance, M.E.; Kuiken, T.; Vejerano, E.P.; McGinnis, S.P.; Hochella, M.F., Jr.; Rejeski, D.; Hull, M.S. Nanotechnology in the real world: Redeveloping the nanomaterial consumer products inventory. Beilstein J. Nanotechnol. 2015, 6, 1769–1780. [Google Scholar] [CrossRef]
- Vines, J.B.; Yoon, J.H.; Ryu, N.E.; Lim, D.J.; Park, H. Gold nanoparticles for photothermal cancer therapy. Front. Chem. 2019, 7, 167. [Google Scholar] [CrossRef]
- Hamzawy, M.A.; Abo-Youssef, A.M.; Salem, H.F.; Mohammed, S.A. Antitumor activity of intratracheal inhalation of temozolomide (Tmz) loaded into gold nanoparticles and/or liposomes against urethane-induced lung cancer in Balb/C mice. Drug Deliv. 2017, 24, 599–607. [Google Scholar] [CrossRef] [PubMed]
- Chen, J.; Wang, H.; Long, W.; Shen, X.; Wu, D.; Song, S.S.; Sun, Y.M.; Liu, P.X.; Fan, S.; Fan, F. Sex differences in the toxicity of polyethylene glycol-coated gold nanoparticles in mice. Int. J. Nanomed. 2012, 8, 2409–2420. [Google Scholar]
- Kim, K.T.; Zaikova, T.; Hutchison, J.E.; Tanguay, R.L. Gold nanoparticles disrupt zebrafish eye development and pigmentation. Toxicol. Sci. 2013, 133, 275–288. [Google Scholar] [CrossRef] [PubMed]
- Bachand, D.; Allen, A.; Bachand, M.; Achyuthan, K.E.; Seagrave, J.C.; Brozik, S.M. Cytotoxicity and inflammation in human alveolar epithelial cells following exposure to occupational levels of gold and silver nanoparticles. J. Nano Res. 2012, 14, 1212–1222. [Google Scholar] [CrossRef]
- de Oliveira Mallia, J.; Galea, R.; Nag, R.; Cummins, E.; Gatt, R.; Valdramidis, V. Nanoparticle Food Applications and Their Toxicity: Current Trends and Needs in Risk Assessment Strategies. J. Food Prot. 2022, 85, 355–372. [Google Scholar] [CrossRef] [PubMed]
- Kreyling, W.G.; Touch, T.; Peters, A.; Pitz, M.; Heinrich, J.; Stölzel, M.; Cyrys, J.; Heyder, J.; Wichmann, H.E. Diverging long-term trends in ambient urban particle mass and number concentrations associated with emission chages caused by the German unification. Atmos. Environ. 2003, 37, 3841–3848. [Google Scholar] [CrossRef]
- Semmler, M.; Seitz, J.; Erde, F.; Mayer, P.; Heyder, J.; Oderdörster, G.; Kreyling, W.G. Long-term clearance kinetics of inhaled ultrafine insoluble iridium particles from rat lung, including transient translocation into secondary organs. Inhal. Toxicol. 2004, 16, 453–459. [Google Scholar] [CrossRef] [PubMed]
- Geiser, M.; Rothen-Rutishauser, D.; Kapp, N.; Schürch, S.; Kreyling, W.; Schulz, H.; Semmler, M.; Im Hof, V.; Heyder, J.; Gehr, P. Ultrafine particles cross cellular membranes by nonphagotic mechanisms in lungs and in cultured cells. Environ. Health Perspect. 2005, 113, 1555–1560. [Google Scholar] [CrossRef]
- Semmler-Dehnke, M.; Takenaka, S.; Fertsch, S.; Wenk, A.; Seitz, J.; Mayer, P.; Oderdörster, G.; Kreyling, W.G. Efficient elimination of inhaled nanoparticles from the alveolar region: Evidence for interstitial uptake and subsequent reentrainment onto airways epithelium. Environ. Health Perspect. 2007, 115, 728–733. [Google Scholar] [CrossRef]
- Geiser, M.; Kreyling, W.G. Deposition and biokinetics of inhaled nanoparticles. Part. Fibre Toxicol. 2010, 7, 2. [Google Scholar] [CrossRef]
- Davis, G.A.; Wantling, E.; Stokes, J.R. The influence of beverages on the stimulation and viscoelasticity of saliva: Relationship to mouthfeel? Food Hydrocoll. 2009, 23, 2261–2269. [Google Scholar] [CrossRef]
- Chojnowska, S.; Baran, T.; Wilińska, I.; Sienicka, P.; Cabaj-Wiater, I.; Knaś, M. Human saliva as a diagnostic material. Adv. Med. Sci. 2018, 63, 185–191. [Google Scholar] [CrossRef]
- de Almeida, P.D.V.; Grégio, A.M.; Machado, M.A.; de Lima, A.A.; Azevedo, L.R. Saliva composition and functions: A comprehensive review. J. Contemp. Dent. Pract. 2008, 9, 72–80. [Google Scholar] [PubMed]
- Brujan, E.A. Non-Newtonian Fluids. In Cavitation in Non-Newtonian Fluids with Biomedical and Bioengineering Application, 1st ed.; Brujan, E.A., Ed.; Springer: Berlin/Heidelberg, Germany, 2011; pp. 1–47. [Google Scholar]
- Briedis, D.; Moutrie, M.F.; Balmer, R.T. Study of shear viscosity of human whole saliva. Rheol. Acta 1980, 19, 365–374. [Google Scholar] [CrossRef]
- Zussman, E.; Yarin, A.L.; Nagler, R.M. Age- and flow-dependency of salivary viscoelasticity. J. Dent. Res. 2007, 86, 281–285. [Google Scholar] [CrossRef]
- Yas, B.A.; Radhi, N.J. Salivary viscosity in relation to oral health status among a group of 20–22 years old dental students. Iraqi J. Comm. Med. 2013, 3, 219–224. [Google Scholar]
- Sajewicz, E. Effect of saliva viscosity on tribological behaviour of tooth enamel. Tribol. Int. 2009, 42, 327–332. [Google Scholar] [CrossRef]
- Penconek, A.; Michalczuk, U.; Moskal, A. The effect of desert dust particles on rheological properties of saliva and mucus. Environ. Sci. 2019, 26, 12150–12157. [Google Scholar] [CrossRef]
- Penconek, A.; Michalczuk, U.; Moskal, A. The Effect of Airborne Particles on Human Body Fluids. In Practical Aspects of Chemical Engineering, 1st ed.; Ochowiak, M., Woziwodzki, S., Mitkowski, P.T., Doligalski, M., Eds.; Springer: Cham, Switzerland, 2020; pp. 305–313. [Google Scholar]
- Przekop, R.; Michalczuk, U.; Penconek, A.; Moskal, A. Effect of Microplastics Particles on the Rheological Properties of Human Saliva and Mucus. Int. J. Environ. Res. Public Health 2023, 20, 7037. [Google Scholar] [CrossRef]
- Liu, Y.; Zhang, Q.; Liu, R. Effect of particle size distribution and shear rate on relative viscosity of concentrated suspensions. Rheol. Acta 2021, 60, 763–774. [Google Scholar] [CrossRef]
- Michalczuk, U.; Przekop, R.; Moskal, A. The effect of selected nanoparticles on rheological properties of human blood. Bull. Pol. Acad. Sci. Tech. Sci. 2022, 70, e140437. [Google Scholar] [CrossRef]
- Penconek, A.; Moskal, A. Deposition of diesel exhaust particles from various fuels in a cast of human respiratory system under two breathing patterns. J. Aerosol Sci. 2013, 63, 48–59. [Google Scholar] [CrossRef]
- Penconek, A.; Moskal, A. The influence of pH and concentration of mucins on diesel exhaust particles (DEPs) transport through artificial mucus. J. Aerosol Sci. 2016, 102, 83–95. [Google Scholar] [CrossRef]
- Mosca, A.C.; Chen, J. Food-saliva interactions: Mechanisms and implications. Trends Food Sci. Technol. 2017, 66, 125–134. [Google Scholar] [CrossRef]
- Christersson, C.E.; Lindh, L.; Arnebrant, T. Film-forming properties and viscosities of saliva substitutes and human whole saliva. Eur. J. Oral. Sci. 2000, 108, 418–425. [Google Scholar] [CrossRef]
- Gittings, S.; Turnbull, N.; Henry, B.; Roberts, C.J.; Gershkovich, P. Characterisation of human saliva as a platform for oral dissolution medium development. Eur. J. Pharm. Biopharm. 2015, 91, 16–24. [Google Scholar] [CrossRef] [PubMed]
- Xu, C. Nonlinear Least Squares: Trust Region Methods. In Encyclopedia of Optimization, 2nd ed.; Floudas, C.A., Pardalos, P.M., Eds.; Springer: New York, NY, USA, 2008; pp. 2630–2637. [Google Scholar]
- Xu, M.; Liu, H.; Zhao, H.; Li, W. How to decrease the viscosity of suspension with the second fluid and nanoparticles? Sci. Rep. 2013, 3, 3137. [Google Scholar] [CrossRef]
- Gvaramia, M.; Mangiapia, G.; Pipich, V.; Appavou, M.-S.; Jaksch, S.; Holderer, O.; Rukhadze, M.D.; Frielinghaus, H. Tunable viscosity modification with diluted particles: When particles decrease the viscosity of complex fluids. Colloid Polym. Sci. 2019, 297, 1507–1517. [Google Scholar] [CrossRef]
- Ben-David, E.A.; Habibi, M.; Haddad, E.; Sammar, M.; Angel, D.L.; Dror, H.; Lahovitski, H.; Booth, A.M.; Sabbah, I. Mechanism of nanoplastics capture by jellyfish mucin and its potential as a sustainable water treatment technology. Sci. Total Environ. 2023, 869, 161824. [Google Scholar] [CrossRef]
- Barbero, N.; Coletti, M.; Catalano, F.; Visentin, S. Exploring gold nanoparticles interaction with mucins: A spectroscopy-based study. Int. J. Pharm. 2018, 535, 438–443. [Google Scholar] [CrossRef]
- Belgorodsky, B.; Drug, E.; Fadeev, L.; Hendler, N.; Mentovich, E.; Gozin, M. Mucin complexes of nanomaterials: First biochemical encounter. Small 2010, 6, 262–269. [Google Scholar] [CrossRef] [PubMed]
- Hendler, N.; Fadeev, L.; Mentovich, E.D.; Belgorodsky, B.; Gozin, M.; Richter, S. Bio-inspired synthesis of chiral silver nanoparticles in mucin glycoprotein—The natural choice. Chem. Commun. 2011, 47, 7419–7421. [Google Scholar] [CrossRef] [PubMed]
- McGill, S.L.; Smith, H.D.C. Disruption of the mucus barrier by topically applied exogenous particles. Mol. Pharm. 2010, 7, 2280–2288. [Google Scholar] [CrossRef] [PubMed]
- Bansil, R.; Turner, B.S. Mucin structure, aggregation, physiological functions and biomedical applications. Curr. Opin. Colloid Interface Sci. 2006, 11, 164–170. [Google Scholar] [CrossRef]
- Lai, S.K.; Wang, Y.Y.; Wirtz, D.; Hanes, J. Micro- and macrorheology of mucus. Adv. Drug Deliv. Rev. 2009, 61, 86–100. [Google Scholar] [CrossRef]
Disclaimer/Publisher’s Note: The statements, opinions and data contained in all publications are solely those of the individual author(s) and contributor(s) and not of MDPI and/or the editor(s). MDPI and/or the editor(s) disclaim responsibility for any injury to people or property resulting from any ideas, methods, instructions or products referred to in the content. |
© 2024 by the authors. Licensee MDPI, Basel, Switzerland. This article is an open access article distributed under the terms and conditions of the Creative Commons Attribution (CC BY) license (https://creativecommons.org/licenses/by/4.0/).