Article

Optimization of the Assessment Method for Photovoltaic Module Enhancers: A Cost-Efficient Economic Approach Developed through Modified Area and Cost Factor

1
Solar Energy Research Institute, Universiti Kebangsaan Malaysia, Bangi 43600, Malaysia
2
Faculty of Engineering and Technology, Multimedia University, Jalan Ayer Keroh Lama, Melaka 75450, Malaysia
3
School of Mechanical Engineering, Universiti Sains Malaysia, Nibong Tebal 14300, Malaysia
4
Department of Mechanical Engineering, Universiti Teknologi Petronas, Seri Iskandar 32610, Malaysia
*
Author to whom correspondence should be addressed.
Processes 2024, 12(5), 988; https://doi.org/10.3390/pr12050988
Submission received: 22 February 2024 / Revised: 7 April 2024 / Accepted: 8 April 2024 / Published: 13 May 2024

Abstract

:
The advancement of photovoltaic module (PV) enhancer technology shows significant promise due to its rapid growth. Nevertheless, there remains a requirement for ongoing research to refine the evaluation techniques for this technology. In a prior investigation, the concept of the area and cost-effectiveness factor, denoted as F C A E , was introduced to analyze the economic impact of enhancing the PV through techniques such as reflectors or coolers. This metric relates the surface area and manufacturing expenses of a PV enhancer to its capacity for improving the PV output power, aiding in the comparison of different enhancer types. However, this assessment approach is costly, requiring a set of PVs without enhancers to be compared with an equal number of modules fitted with enhancers. This paper introduces a modified version of this metric, termed the modified area and cost-effectiveness factor ( F M C A E ), along with its minimum value ( F M C A E , min ), with the aim of reducing the assessment expenses associated with PV enhancers. This modification hinges on knowing the output power from a single solar cell without an enhancer, as well as from a PV with an enhancer containing a known number of solar cells. Additionally, it relies on data regarding the manufacturing cost of the PV enhancer, the cost of one watt of PV power, and the combined surface area of the PV and its enhancer. The equations for computing the total number of solar cells and the associated costs in addition to the expenses cost are also proposed for F CAE and F MCAE . The results of the present study using F MCAE show that there is a proportional relationship between the percentage of solar cell saving and the number of solar cells. As the solar cells increase, the percentage of solar sell saving increases. The findings reveal that utilizing F MCAE leads to a 48.33% increase in the proportion of solar cells saved compared to the existing method. It can be concluded that the proposed method is cost-efficient and holds promise for adoption by PV enhancer designers and manufacturers.

1. Introduction

Solar energy can be classified into two main categories: the photovoltaic system and solar thermal system. According to Paul [1], a photovoltaic system utilizes a photovoltaic module (PV) to convert solar radiation into electricity through the photovoltaic effect, characterized by the generation of an electromagnetic field and current capable of powering a load. Conversely, a solar thermal system harnesses solar energy directly for applications such as air or water heating. Typically, these systems operate independently of each other.
According to Animasaun et al. [2], excessive heat can reduce the efficiency of a PV by increasing its operating temperature. A PV operates more efficiently at lower temperatures. When a PV becomes too hot, its electrical output decreases, leading to a drop in overall energy production. Despite the decrease in photovoltaic efficiency with rising temperatures, the production of photovoltaic technology continues to grow annually (Anonymous [3]). One approach to mitigating high PV temperatures is implementing a cooling system with a heat removal material, thereby improving PV performance. Various methods have been proposed to enhance the performance of a PV, including changes to the device structure (Adnan et al. [4]; Zhouyu et al. [5]), or forced or natural convection cooling using air, liquid, or phase change material (PCM). Figure 1 shows a PV without and with an enhancer.
When a fluid moves beneath the surface of the PV, it triggers thermally driven convection due to temperature differences between the PV surface and the fluid. Convection, as described by Shah et al. [6], is a complex heat transfer process involving heat conduction and fluid motion concurrently, which facilitates heat transfer from the surface of a PV, leading to reduced temperatures and improved PV performance. This integrated system is known as a photovoltaic solar thermal system (PVT). Several previous investigations explored PVTs.

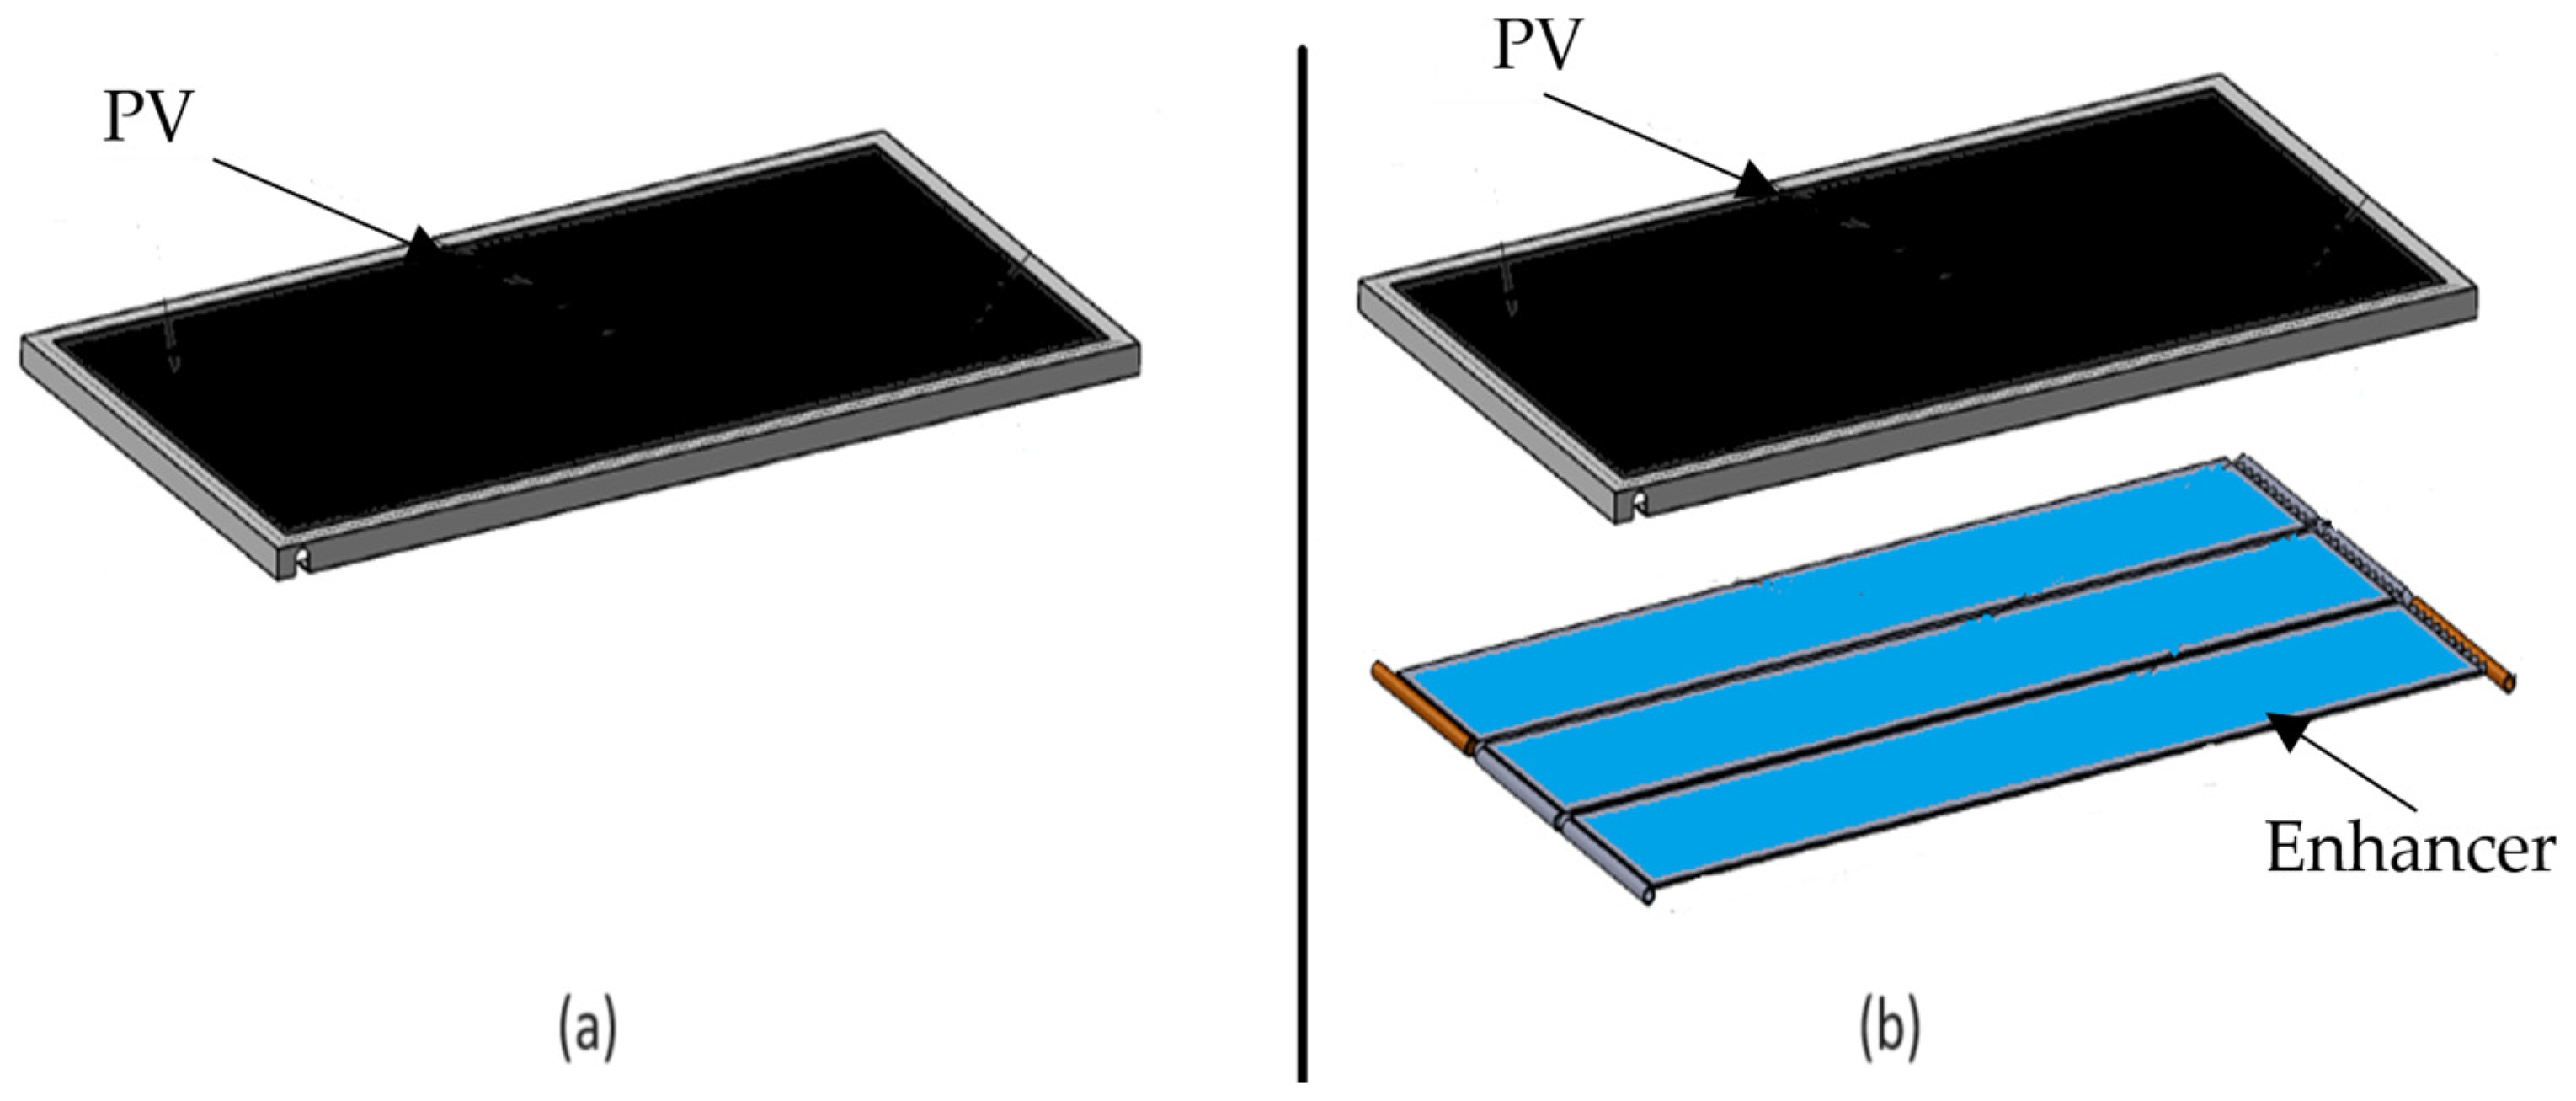
1.1. Existing Studies on Photovoltaic Module Enhancers

A new approach to enhancing both the temperature output and electrical production was proposed, running through PVTs in a series connection (Arash et al. [7]). Various nanofluids, including combinations such as multiwalled carbon nanotube–silicon carbide, multiwalled carbon nanotube–aluminum oxide, graphene–silicon carbide, and graphene–aluminum oxide, were evaluated. The results indicated that the multiwalled carbon–silicon carbide hybrid nanofluid exhibited a superior performance compared to the others, achieving 56.55% and 13.85% as its average thermal and electrical efficiencies, respectively. Additionally, 150 W PVTs with different configurations were explored for their potential to enhance the thermal performance (Anurag et al. [8]). Specifically, a comparison was made between longitudinal fins with inclined baffles and a free duct without fins for PVT cooling. The experiment utilized CFD analysis to assess the temperature of the surface and cooling effectiveness. The results indicated that utilizing longitudinal fins and inclined baffles increased the thermal energy performance by 12 to 18% compared to using a free duct without fins. A heat pump PVT model was created and verified through experimental validation (Franz et al. [9]). Analysis of wasted heat was conducted to enhance the efficiency of the heat pump PVT. The concept of a dual-source heat pump PVT was introduced (Marco and Renato [10]). This innovative configuration facilitates ground regeneration by cooling the PVT during summer while keeping the electrical performance close to its peak. Additionally, strategically positioning storage tanks enables the separation of heat sources from the heat pump, enhancing system flexibility. A heat pump PVT configuration was studied, comprising a PV and evaporator coils (Vaishak et al. [11]). The heat pump PVT was constructed using a glass-covered PV. Experimental testing was conducted under typical clear sky conditions, and a validated numerical model was employed to predict the system’s performance throughout the year. The findings revealed a potential improvement in electrical performance by 15.20% compared to a heat pump PVT lacking a glass cover. In a separate investigation, both the effectiveness and economic feasibility of a heat pump integrated with a PVT were studied (Marco and Renato [10]). The findings showed energy savings ranging from 35% to 65%, with an estimated payback period of around 10 years in regions with mild climates.
Alternatively, reflectors can be employed to augment the power output of a PV (Prashant and Shyam [12]). The utilization of reflectors to expand the solar energy capture area was pioneered by Tabor in 1958 [13]. Several research works have shown that, contingent upon the reflector type and prevailing weather conditions, the PV efficiency can be improved by 20 to 30% (Anand et al. [14]; Palaskar and Deshmukh [15]). Models have been developed to forecast the power outputs of V-trough concentrators integrated with PVs, with experimental validation confirming a significant improvement of 31.2% in PV power (Bahaidarah et al. [16]). Additionally, investigations into the impact of reflector parameters on output power revealed enhancements of up to 60% (Anand et al. [14]). Studies on specific configurations, such as PV with aluminum sheet reflectors, have shown power output increases of 15% (Palaskar and Deshmukh [15]). Outdoor experiments conducted on PVs equipped with V-trough concentrators demonstrated a remarkable 48% increase in output power (Naseer et al. [17]). Furthermore, analyses integrating experimental and economic aspects of PVs with reflectors and coolers achieved 10.68% efficiency and 4.2 years as the payback period (Elbreki et al. [18]). Simulation studies exploring different tilt angles for PVs with aluminum sheet reflectors indicated performance improvements of up to 19% at a tilt angle of 75° (Moon et al. [19]). Novel curved reflector designs have been proposed and compared with non-reflector PVs, demonstrating a substantial 61% increase in spatial solar power (Jin et al. [20]). Theoretical and experimental investigations into PVs equipped with flat reflectors and coolers have achieved 36% electrical performance enhancements (Amanlou et al. [21]).

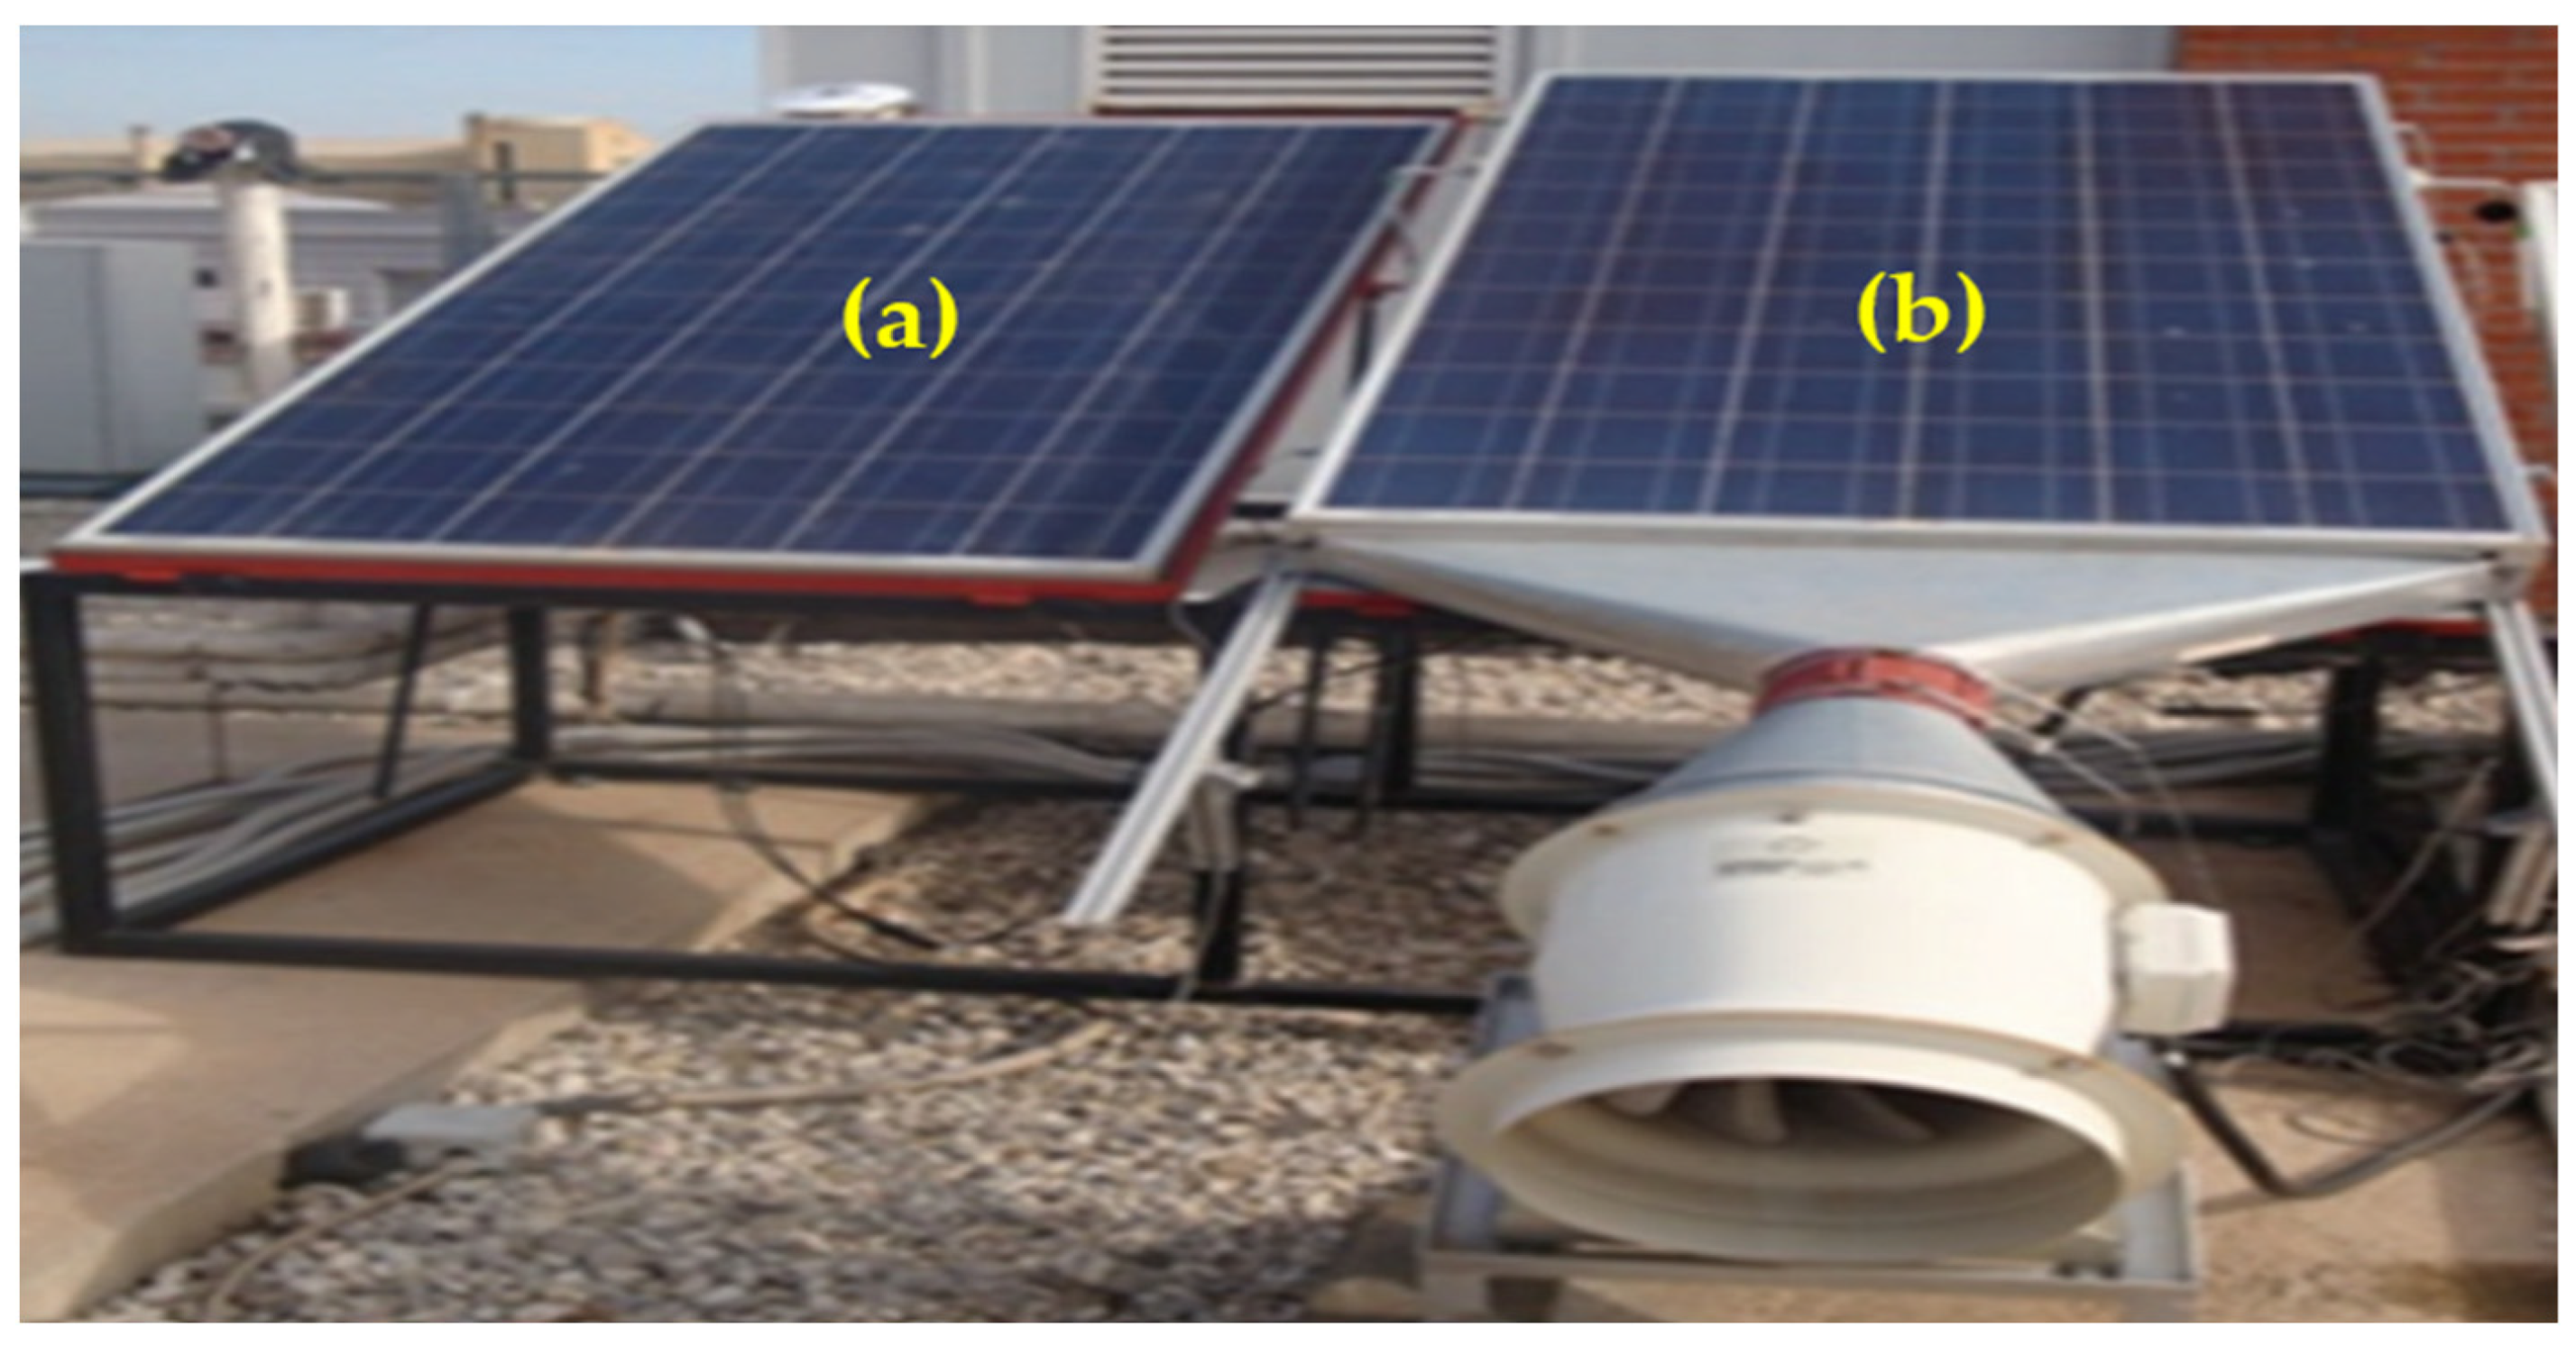
1.2. Assessing Techniques for Improving Solar Panels

The area and cost-effectiveness factor acts as a valuable tool for researchers, designers, or manufacturers to use to assess the financial implications of a photovoltaic (PV) enhancer. This involves evaluating the relationship between the cost of the PV enhancer and its effectiveness in enhancing PV performance (Sultan et al. [22]).
Two temperature-dependent analysis methods, namely the PV efficiency difference factor and the modified PV efficiency difference factor, offer information on the efficiency changes following the implementation of a cooling system. The modified method is more adaptable to varying solar irradiation levels and requires only a single solar cell, which improves affordability. The PV power ratio, a temperature-dependent ratio comparing the power output of a PV system with an enhancer to a reference PV power, allows for quick and straightforward performance analysis, suitable for instant assessments. These analytical methods offer simplicity, affordability, and rapidity, making them promising tools for conducting comparative and analytical assessments of cooling systems. Designers and manufacturers of PV cooling systems can benefit from these methodologies, providing valuable insights for optimizing structural configurations to enhance PV systems effectively.

1.3. The Current Study’s Rationale

The correlation between the price of a PV and the quantity of solar cells it contains is directly. As the number of solar cells increases, so does the cost of the PV. The assessment method introduced by Sultan et al. [22] is costly because it assumes that both PV systems with and without an enhancer necessitate the same number of solar cells. For example, if a PV system with an enhancer utilizes 100 solar cells, then a PV system without an enhancer would also require 100 solar cells, resulting in a combined requirement of 200 solar cells. This assumption remains valid when both types of PV systems, with and without enhancers, operate concurrently to ensure consistent environmental conditions, as commonly observed in the evaluation of PV enhancer performance, shown in Figure 2 and Figure 3 (Maatallah et al. [23]; Mazón-Hernández et al. [24]).

1.4. The Current Study’s Research Questions

This study addressed the following research questions:
  • Is the existing performance evaluation method for PV enhancers economically viable?
  • How does the proposed modified assessment technique contrast with the existing one regarding the quantity of solar cells employed for PV systems, both with and without enhancements, the total cost of solar cells, and associated expenses?
  • What is the effect of the number of solar cells on the solar cell saving when using the proposed modified method compared to the existing one?
This paper suggests a modified approach developed from the current economic method, aimed at lowering the cost of assessing PV enhancer performance. The modification incorporates factors such as the cost-effectiveness and area factor and its minimum value. The significant factors affecting the modified approach are discussed. Equations for determining both the total quantity of solar cells required and the corresponding costs, along with the expenses cost, are introduced for both the existing and modified methods. This study illustrates that the modified economic methodology substantially decreases the cost associated with assessing PV enhancers compared to the conventional approach.

2. Methodology

2.1. Methodological Approach

The research methodology is illustrated in a block diagram, presented in Figure 4. Initially, an investigation into the existing economic approaches concerning PV enhancers was carried out. This initial phase enabled the identification of research gaps and facilitated the acquisition of comprehensive knowledge, which served as the basis for subsequent modifications. The second phase involved the modification of the area and cost-effectiveness factor. The third step involved contrasting the outcomes of the new approach with those of the current economic method. The third step entailed examining the influential parameters affecting the modified economic method.

2.2. Evaluating Economic Feasibility Using the Area

Sultan et al. [22] introduced a metric termed the “area and cost-effectiveness factor ( F C A E )”, for use to evaluate the economic feasibility of PV enhancers. F C A E was expressed as
F C A E = A P V E A P V + A P V , c o n v e r t e d × Y P P V + Z Y P P V E ,
where
A P V , c o n v e r t e d = P P V , e n h a n c e d × A P V P P V , o u t ,
where
P P V , e n h a n c e d = P P V E P P V
P P V , e n h a n c e d represents the additional power generated by a PV system when enhanced by a specific device. Z denotes the manufacturing cost of this enhancer. P P V signifies the power output of a standard PV system without any enhancements. P P V E indicates the power output of a PV system with the enhancer. A P V and A P V E refer to the surface areas of the standard PV system and the enhanced PV system, respectively. A P V , c o n v e r t e d is the area converted from the power enhancement when using an enhancer. Y represents the cost per watt of PV power and can be determined using the following expression
O n e   w a t t   o f   P V   p o w e r = P V   m o d u l e   c o s t P V   m o d u l e   p o w e r .
The minimum value for the area and the cost-effectiveness factor, denoted as F C A E , m i n , is established as the quotient of the output power from a PV system without enhancements ( P P V ) divided by the maximum power output achieved by a PV with the enhancer installed ( P P V E , m a x ), which is equivalent to the output power of a PV ( P P V , m a x ) under standard test conditions (STCs). F C A E , m i n can be expressed as
F C A E , m i n = P P V P P V E , m a x ,
The value of F C A E , m i n signifies the point at which the PV enhancer has reached its peak performance level. This serves as a benchmark for assessing the optimal area and cost-effectiveness efficiency.
In general, a PV system comprises multiple solar cells (Joel et al. [25]), and thus the total output power of the PV system can be represented as (Trever and Vasilis [26])
P P V = n × P c e l l ,
where ‘n’ represents the quantity of solar cells, and ‘ P c e l l ’ denotes the output power of an individual solar cell. Consequently, the maximum output power of the PV system, denoted as ‘ P P V , m a x ’, can be formulated as
P P V , m a x = n × P c e l l , m a x ,
where ‘ P c e l l , m a x ’ represents the maximum output power of a single solar cell under STCs.

2.3. The Modified Economic Method for PV Enhancers

The existing method can be modified by inserting Equation (6) into Equation (1). This yields the expression for the modified area and cost-effectiveness factor, which can be expressed as
F M C A E = A P V E A P V + A P V , c o n v e r t e d × Y n × P c e l l + Z Y P P V E ,
Based on Equation (8), F M C A E relies on the following factors: The output power of a single solar cell without enhancement, denoted as P c e l l . The output power of the PV system with an enhancer, labeled as P P V E . The quantity of solar cells within the enhanced PV system, represented by ‘n’. The manufacturing cost of the PV enhancer, denoted as Z. The cost per watt of PV power, expressed as Y. The surface area of the standard PV system, denoted as A P V . The surface area of the enhanced PV system, indicated by A P V E . The area converted by the PV enhancer, labeled as A P V , c o n v e r t e d . It is worth mentioning that the solar cell type and cost should be identical for a PV with and without an enhancer. The modified method suggests the use of one solar cell without an enhancer, to be compared with a PV with an enhancer that has a known number of solar cells. Now, Equation (8) can be used by PV enhancers’ designers and/or manufacturers to greatly reduce the assessment cost of PV enhancers.

2.3.1. The Modified Minimum Value of the Cost and Area Effectiveness Factor ( F M C A E , m i n )

By incorporating Equation (6) into Equation (5), the equation is transformed into
F M C A E , m i n = n × P c e l l P P V E , m a x ,
Equation (9) can be restated as
F M C A E , m i n = n × P c e l l P P V , m a x .
By incorporating Equation (7) into Equation (10), the expression can be denoted as follows:
F M C A E , m i n = P c e l l P c e l l , m a x .
When observing Equation (11), it is evident that F M C A E , m i n is contingent upon the output power and the maximum output power from an individual solar cell without enhancement.

2.3.2. The Range Significance of F M C A E Values

Based on Equation (8), there are three categories of FMCAE, outlined as follows:
  • If F M C A E is greater than 1, this indicates that the PV enhancer is not efficient in terms of both area utilization and cost.
  • If F M C A E equals 1, this signifies that the PV enhancer is neutral and meets the threshold value.
  • If F M C A E is greater than or equal to F M C A E , m i n but less than 1, this indicates that the PV enhancer is efficient in terms of both area utilization and cost.
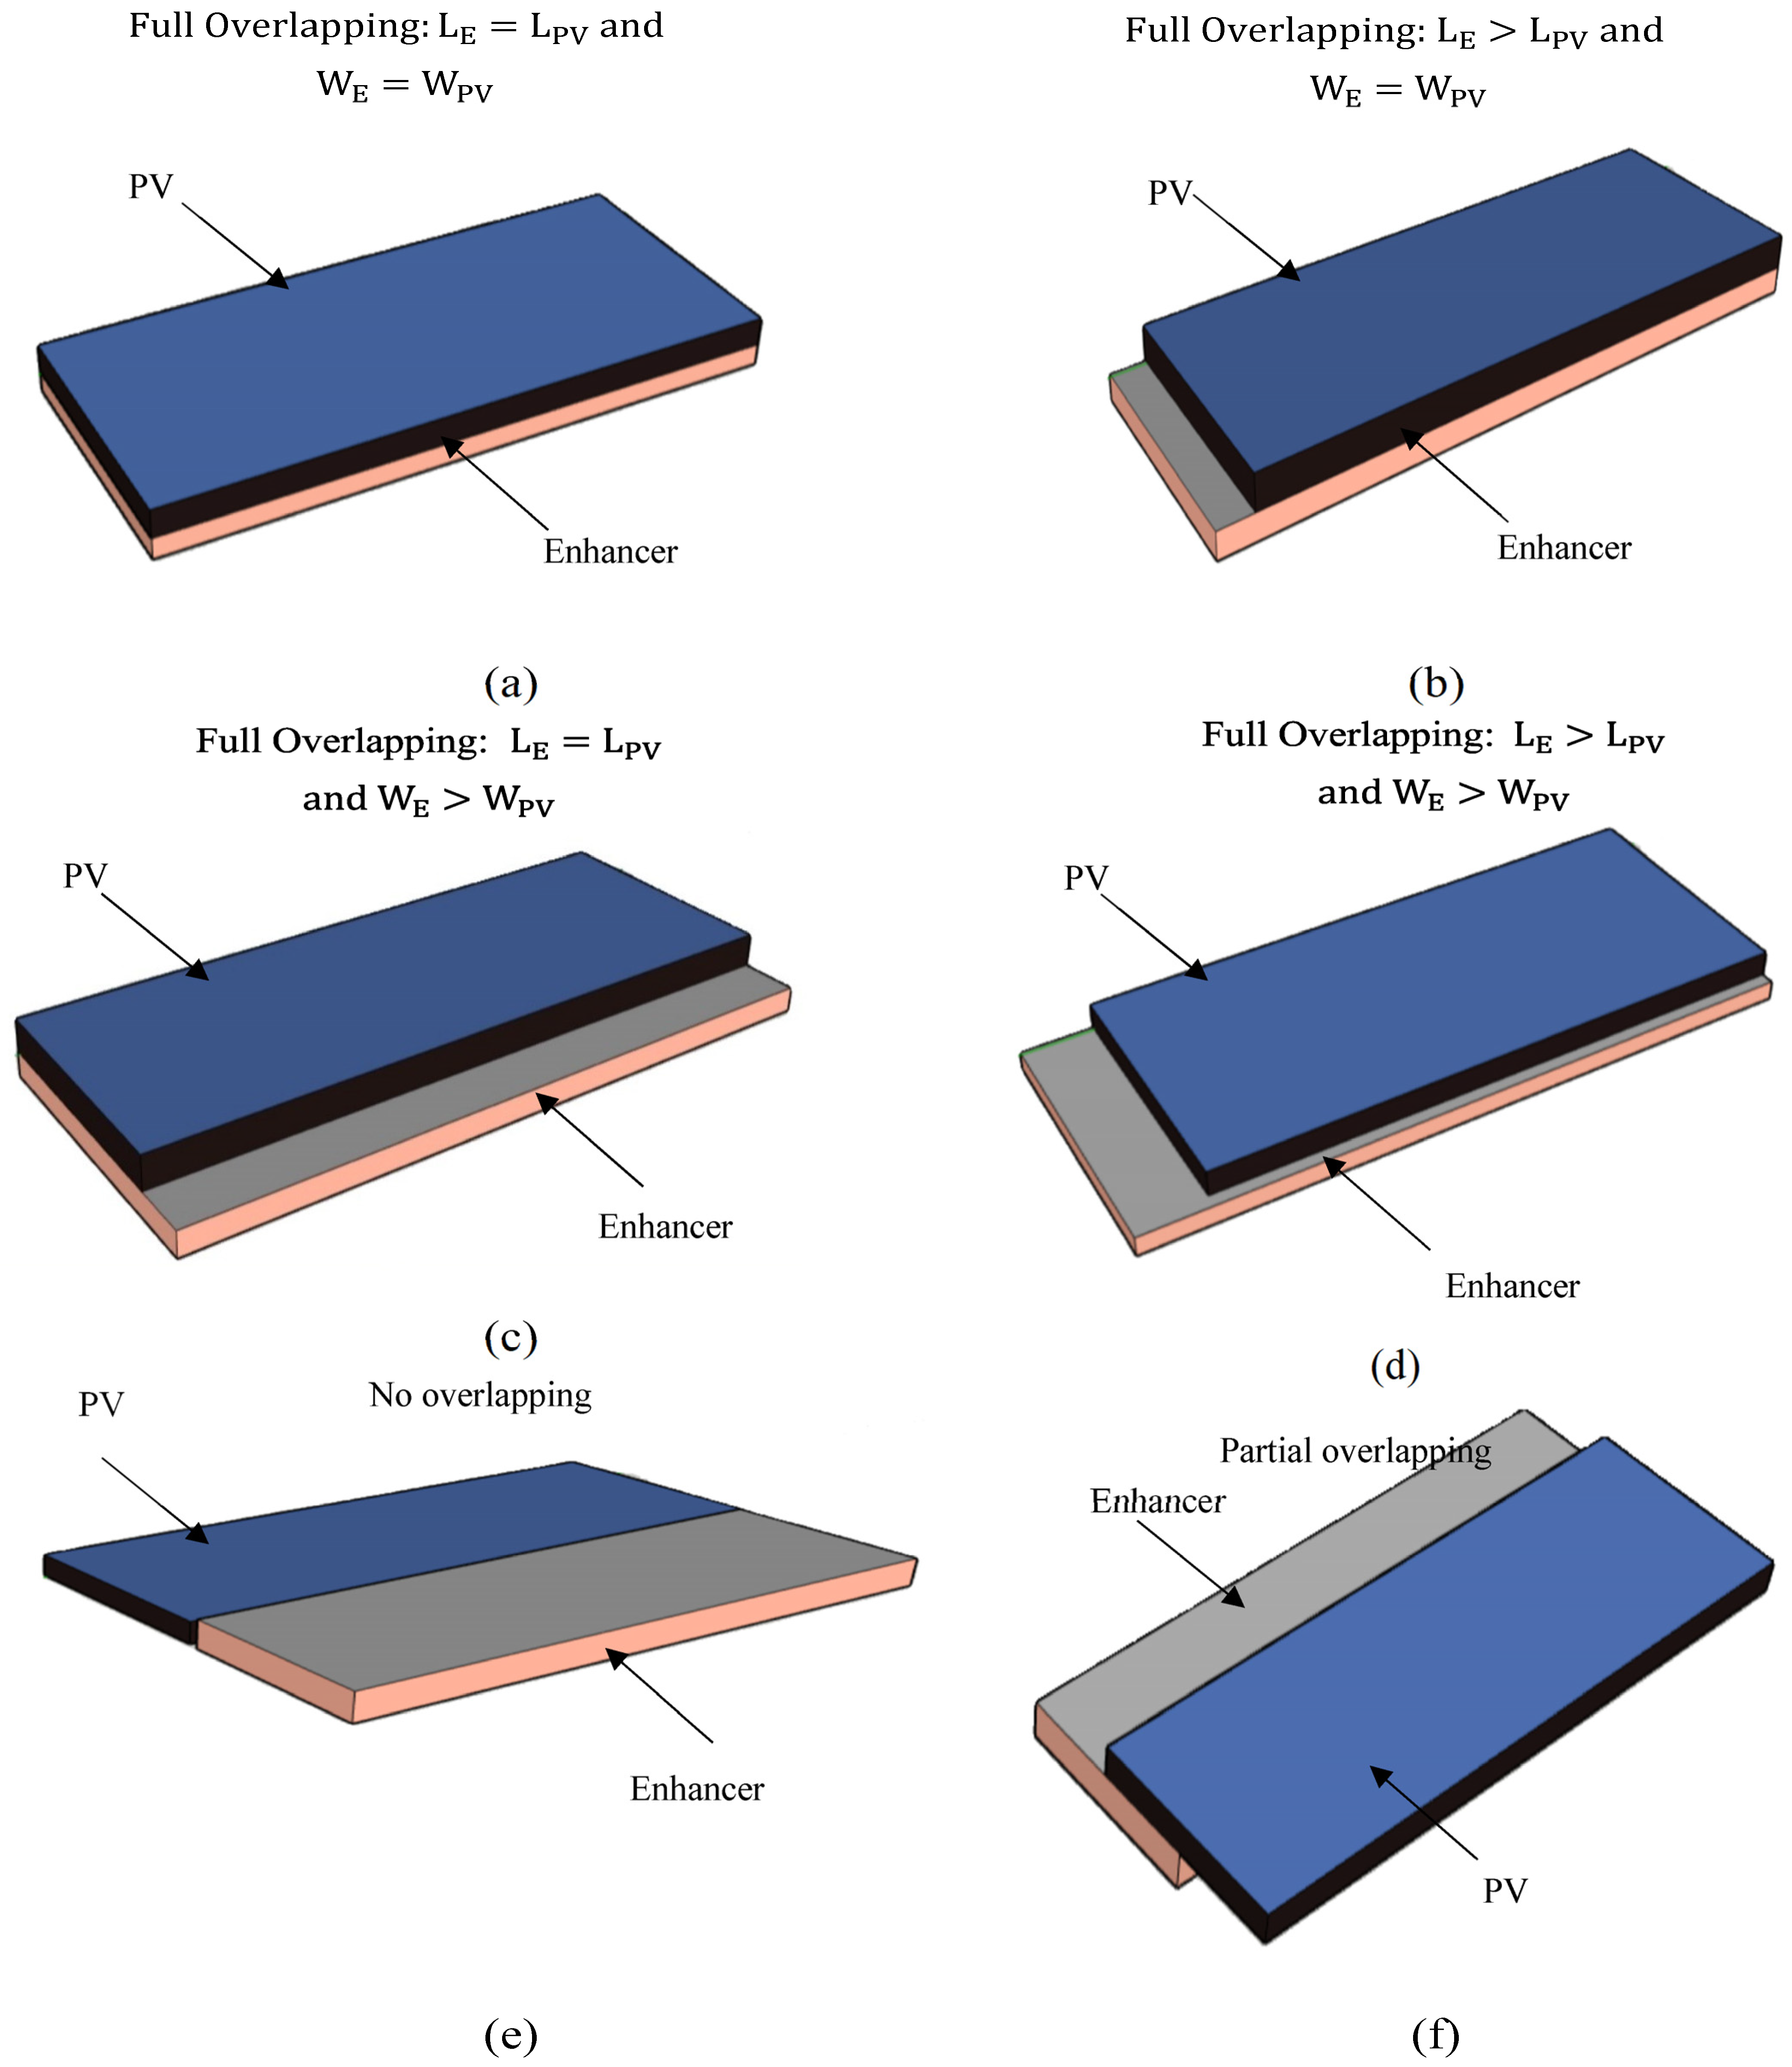
The F M C A E conditions of applicability are similar to those for F C A E , as follows (Sultan et al. [22]):
  • If the length of the enhancer ( L E ) is less than or equal to the length of the PV ( L P V ), and the width of the enhancer ( W E ) is less than or equal to the width of the PV ( W P V ), then the area of the PV with the enhancer ( A P V E ) equals the area of the PV ( A P V ) ( A P V E = A P V ). This situation occurs when the enhancer fully overlaps with the PV in both length and width, depicted in Figure 5a.
  • If the length of the enhancer is greater than the length of the PV but the width of the enhancer is less than or equal to the width of the PV, then the area of the PV with the enhancer ( A P V E ) equals the area of the PV ( A P V ) plus the difference in lengths between the enhancer and the PV, multiplied by the width of the enhancer. This scenario occurs when the width of the enhancer fully overlaps with the width of the PV, and the length of the PV is fully encompassed by the enhancer, illustrated in Figure 5b.
  • If the width of the enhancer is greater than the width of the PV but the length of the enhancer is less than or equal to the length of the PV, then the area of the PV with the enhancer equals the area of the PV plus the difference in widths between the enhancer and the PV, multiplied by the length of the enhancer. This case arises when the length of the enhancer fully overlaps with the length of the PV, and the width of the PV is fully encompassed by the enhancer, as shown in Figure 5c.
  • If both the width and length of the enhancer are greater than the width and length of the PV, respectively, then the area of the PV with the enhancer ( A P V E ) equals the area of the enhancer ( A E ). This scenario occurs when both the length and width of the PV fully overlap with the length and width of the enhancer, depicted in Figure 5d.
  • If there is no overlap between the length and width of the PV and the enhancer, then the area of the PV with the enhancer equals the sum of the areas of the PV and the enhancer ( A P V + A E ), as shown in Figure 5e.
    A P V E = A P V + A P V .
  • In the case of partial overlapping between the PV and the enhancer (as shown in Figure 5f), one needs to calculate the area of the PV with an enhancer that occupies.
The optimal performance of a PV enhancer will result in an F M C A E value equivalent to F M C A E , m i n . In equation form:
F M C A E = F M C A E , m i n .

2.3.3. The Calculation of the Total Number of Solar Cells and the Percentage of Saving

The quantity of solar cells needed ( N t o t , C A E ) to perform the economic analysis using the existing F C A E can be calculated using the following formula:
N t o t , C A E = 2 n .
Equation (14) represents a scenario where two units of PV are needed (PVs with and without an enhancer), with same quantity of solar cells for each, using F C A E .
For the modified method ( F M C A E ), the expression becomes
N t o t , M C A E = 1 + n .
Conversely, a PV system enhanced with a known quantity of solar cells (n) alongside a single solar cell without enhancement is needed, using F M C A E .
The percentage of the saving from solar cells when using F M C A E can be denoted as
S o l a r   c e l l s   s a v i n g   ( % ) = 1 1 + n 2 n × 100 .

2.3.4. The Calculation of the Cost of the Total Number of Solar Cells Using the Existing and Modified Methods

The cost of the total number of solar cells when using the existing method ( C C A E ) can be calculated using the following formula:
C C A E = V N t o t , C A E ,
where V is the cost of a single solar cell.
Substituting Equation (14) into Equation (17), the expression becomes
C C A E = 2 V n .
On the other hand, the cost of the total number of solar cells when using the modified method ( C M C A E ) can be obtained using the following expression
C M C A E = V N t o t , M C A E .
Substituting Equation (15) into Equation (19), the equation becomes
C M C A E = V 1 + n .

2.3.5. The Calculation of the Expenses Cost Using the Existing and Modified Methods

The expenses cost (U) is defined as the cost of the total number of solar cells for PVs with and without an enhancer (C) in addition to the PV enhancer’s manufacturing cost (Z).
The expenses cost using the existing method ( U C A E ) can be calculated using the following formula:
U C A E = C C A E + Z .
Substituting Equation (18) into Equation (21), the expression becomes
U C A E = 2 V n + Z .
On the other hand, the expenses cost using the modified method ( U M C A E ) can be calculated using the following expression:
U M C A E = C M C A E + Z .
Substituting Equation (20) into Equation (23), the equation becomes
U M C A E = V 1 + n + Z .

3. Results and Discussion

3.1. Evaluating the Cost Advantage of Utilizing F M C A E and F M C A E , m i n

Table 1 outlines the equations for the existing and modified methods, items needed, and the equations for the total number of solar cells for PVs with and without an enhancer and the associated cost. Also, it presents the equations for the expenses cost using the existing and modified methods. As discussed in the introduction, we examine the area and cost-effectiveness between the conventional and modified approaches. For instance, let us consider a scenario with a PV that contains an enhancer, comprising 100 solar cells. Using the F C A E , a total of 200 solar cells are required for both PV configurations (with and without an enhancer operating concurrently). If each solar cell costs USD 1, then the total expense amounts to USD 200. Conversely, when employing F M C A E , only 101 solar cells are needed (100 for the PV with an enhancer and 1 solar cell without an enhancer, operating side by side), resulting in a total testing cost of USD 101. Clearly, the F M C A E method proves to be more cost-efficient, significantly reducing the assessment expenses compared to F C A E .

3.2. The Effect of Increasing the Number of Solar Cells on F C A E and F M C A E

The discussion of this section will reflect the findings of the present study on reducing the number of solar cells. Figure 6 shows the impact of increasing the solar cell number of the PV with an enhancer (n) on the total solar cell number needed (Ntot) for the performance evaluation using F C A E and F M C A E . It can be seen that there is a proportional relationship between n and Ntot. As n increases, Ntot increases as well. From Figure 6, it can be seen that when using F C A E , and when n is 6 solar cells, Ntot is 12 solar cells. It can be seen that Ntot is double ‘n’ (2n). On the other hand, when using F M C A E , and when n is 6, Ntot is only 7 solar cells (1 + n). If the cost of one solar cell is USD 1, then the costs will be 12 and 7 when using F C A E and F M C A E , respectively. It can be asserted that the total number of solar cells required for the modified approach is lower in comparison to the existing method.

3.3. The Solar Cell Saving Percentage When Using F M C A E

The section will discuss the outcomes of the current research, focusing on the effort to lower the expense associated with the assessment method. Figure 7 shows the solar cell saving percentage when using the modified method ( F M C A E ). The data indicate that the percentage of savings in solar cells rises as the number of solar cells increases. Except for when the solar cell number (n) is 1, the percentage of savings is zero. The total quantity of solar cells needed for both F C A E and F M C A E is only two solar cells, as determined using Equation (16). When n is 2, the percentage of savings is 25%. If n is increased to 5, the percentage of savings is 40%. Now, if n is 30, the percentage of savings is 48.33%. It can be seen that a saving may be achieved in regard to the evaluation cost of PV enhancers when using F M C A E as compared to F C A E .

3.4. The Effect of the Number of Solar Cells on the Cost of the Total Number of Solar Cells When Using F C A E  and  F M C A E

Figure 8 shows the effect of increasing the number solar cells on the cost of the total number of solar cells when using the existing and modified methods. If we assume that the cost of a single solar cell is USD 2, then the cost of the total number of solar cells will increase with the increase in the number of solar cells for F C A E and F M C A E . From Figure 8, it can be seen that the number of solar cells has a proportional relationship with the cost of the total number of solar cells. It is shown that when the number of solar cells is one, the costs of the total number of solar cells using the existing and the modified methods are the same, that is, USD 4. When the number of solar cells is increased to five, the costs of the total number of solar cells are USD 24 and USD 14 for the existing and modified methods, respectively. When the number of solar cells increases to 30, the costs of the total number of solar cells are USD 120 and USD 62 for the existing and modified methods, respectively. It can be seen that the modified method is a more cost-effective method when compared to the existing method.

3.5. The Effect of the Number of Solar Cells on the Expenses Cost When Using F C A E  and  F M C A E

Figure 9 illustrates how the expenses cost varies with an increase in the quantity of solar cells, comparing both the existing and modified methods. When assuming a unit cost of USD 2 per solar cell and a manufacturing cost of the PV enhancer of USD 10, it is evident that the expenses cost rises as more solar cells are utilized in both methods, F C A E and F M C A E . The graph demonstrates a direct correlation between the number of solar cells and the expenses cost. Notably, when one solar cell is used, the total cost remains equal for both methods at USD 14. However, as the quantity increases, differences emerge. For instance, with seven solar cells, the expenses costs are USD 26 and USD 38 for the existing and modified methods, respectively. Similarly, with thirty solar cells, the expenses costs amount to USD 130 and USD 72 for the existing and modified methods, respectively. Clearly, the modified method proves to be more cost-effective compared to the existing approach.

4. Conclusions

The PV enhancer represents a promising technology aimed at boosting the PV output power. Recent research efforts have focused on enhancing the performance of PV enhancers. However, the current economic evaluation method for PV enhancers is associated with a high cost. This paper presents the following key findings:
  • A modification to the existing approach is proposed to decrease the assessment expenses. The findings suggest that economic evaluations can be performed using just one solar cell (without an enhancer) and subsequently compared with a PV system incorporating an enhancer with a predetermined quantity of solar cells.
  • The modification involves the area and cost-effectiveness factor and its minimum value. Achieving the peak performance for a PV enhancer corresponds to attaining a modified area and cost-effectiveness factor equivalent to this minimum value.
  • Equations (14) and (15) have been formulated to estimate the total quantity of solar cells required for both the conventional and modified approaches.
  • Equations (18) and (20) have been devised to compute the associated costs for the total number of solar cells using the conventional and modified methodologies, respectively.
  • Equations (22) and (24) are also proposed to compute the expenses cost using the existing and modified methods.
  • The findings indicate that utilizing F M C A E leads to a rise in the proportion of solar cell savings to 48.33%, surpassing the current approach. Consequently, the evaluation expenses for PV enhancers may be significantly decreased. Additionally, it was observed that the percentage of savings increases as the number of solar cells increases.
  • The proposed method holds potential for adoption by PV enhancer manufacturers and designers, aiding in the classification and decision-making process regarding various PV enhancer types based on their economic aspects.
  • Due to the lack of standardized testing protocols for PV enhancers on an international scale, it is advisable to pursue further research aimed at devising supplementary evaluation techniques.

Author Contributions

Conceptualization, S.M.S.; Methodology, S.M.S.; Software, S.M.S., T.C.P., K.S. (Khan Sobayel), M.Z.A. and K.S. (Kamaruzzaman Sopian); Validation, S.M.S.; Formal analysis, S.M.S.; Investigation, S.M.S.; Resources, S.M.S.; Data curation, S.M.S.; Writing—original draft, S.M.S.; Writing—review & editing, S.M.S., T.C.P., K.S. (Khan Sobayel), M.Z.A. and K.S. (Kamaruzzaman Sopian); Visualization, S.M.S.; Supervision, S.M.S.; Project administration, S.M.S.; Funding acquisition, S.M.S. and T.C.P. All authors have read and agreed to the published version of the manuscript.

Funding

The APC for this article is supported by Multimedia University.

Data Availability Statement

All data generated or analyzed during this study are included in this published article.

Conflicts of Interest

The authors declare no conflicts of interest.

Nomenclature

Aarea, (m2)
βefficiency decrease per unit of increase in temperature, (°C−1)
Ccost of total number of solar cells, USD
CFDcomputational fluid dynamics
Ffactor, dimensionless
Isolar irradiance, (W/m2)
Llength, (m)
Ntotal number of solar cells
nnumber of solar cells in a PV with an enhancer
Ppower, (W)
Rratio
Ttemperature, (°C)
Uexpenses cost, USD
PCMphase change material
PVphotovoltaic module
PVEphotovoltaic module with an enhancer
PVTphotovoltaic thermal collector
Vcost of a single solar cell
Wwidth, (m)
Ycost of one watt of PV power
Zmanufacturing cost of PV enhancer
Subscripts
cellphotovoltaic cell
Ephotovoltaic module enhancer
EDPV power difference
fcforced convection
maxmaximum
minminimum
PVCTPV with a cooling technique
refreference
STCPV’s standard test conditions
TDEDPV efficiency difference factor
TDPDmodified PV temperature difference factor
tottotal

References

  1. Paul, R. The photovoltaic effect and its utilization. Sol. Energy 1959, 3, 8–18. [Google Scholar]
  2. Animasaun, I.L.; Nehad, A.S.; Abderrahim, W.; Basavarajappa, M.; Ramachandran, S.; Olubode, K.K. Ratio of Momentum Diffusivity to Thermal Diffusivity: Introduction, Meta-Analysis, and Scrutinization; Chapman and Hall/CRC: New York, NY, USA, 2022; ISBN 13 978-1032108520/10 1032108525/9781003217374. [Google Scholar] [CrossRef]
  3. Anonymous. Available from World Wide Web. 2022. Available online: https://www.iea.org/reports/solar-pv (accessed on 29 July 2022).
  4. Adnan, S.; Feda, M. Emitter layer optimization in heterojunction bifacial silicon solar cells. J. Semicond 2022, 43, 122701. [Google Scholar]
  5. Zhouyu, T.; Mingxuan, B.; Yiqian, Z.; Deren, Y.; Xiaodong, P. Hyperdoped silicon: Processing, properties, and devices. J. Semicond 2022, 43, 093101. [Google Scholar]
  6. Shah, N.A.; Animasaun, I.L.; Ibraheem, R.O.; Babatunde, H.A.; Sandeep, N.; Pop, I. Scrutinization of the effects of Grashof number on the flow of different fluids driven by convection over various surfaces. J. Mol. Liq. 2018, 249, 980–990. [Google Scholar] [CrossRef]
  7. Arash, K.; Ali, S.; Tao, M.; Hao, L. Application of hybrid nanofluids in a novel combined photovoltaic/thermal and solar collector system. Sol. Energy 2022, 239, 102–116. [Google Scholar]
  8. Anurag, S.; Prakash, A.J.; Yogini, D.B.; Saravanakumar, R.; Mohsen, S.; Hossein, H.; Abdul, R.; Asif, A. A study on the effects of forced air-cooling enhancements on a 150 W solar photovoltaic thermal collector for green cities. Sustain. Energy Technol. Assess. 2022, 49, 101782. [Google Scholar]
  9. Franz, H.; Christian, H.; Franz, I.; Peter, K. System efficiency of PVT collector driven heat pumps. Int. J. Thermofluids 2020, 5–6, 100034. [Google Scholar]
  10. Marco, N.; Renato, M.L. Hybrid Photovoltaic–thermal heat pump systems: Energy and economic performance evaluations in different climates. Int. J. Low-Carbon Technol. 2018, 13, 76–83. [Google Scholar]
  11. Vaishak, S.; Purnanand, V.B. Performance analysis of a heat pump-based photovoltaic/thermal (PV/T) system. Clean Technol. Environ. Policy 2020, 23, 1121–1133. [Google Scholar] [CrossRef]
  12. Prashant, M.; Shyam, S. Performance enhancement of multi-crystalline silicon photovoltaic modules using mirror reflectors under Western Himalayan climatic conditions. Renew. Energy 2021, 154, 966–975. [Google Scholar]
  13. Tabor, H. Stationary mirror systems for solar collectors. Sol. Energy 1958, 2, 27–33. [Google Scholar] [CrossRef]
  14. Anand, V.P.; Khan, M.M.; Ameen, E.; Amuthan, V.; Pesala, B. Performance improvement of solar module system using flat plate reflectors. Int. Conf. Adv. Electr. Eng. ICAEE 2014, 2014, 1–4. [Google Scholar]
  15. Palaskar, V.N.; Deshmukh, S.P. Design and performance analysis of reflectors attached to commercial PV module. Int. J. Renew. Energy Resour 2014, 4, 240–245. [Google Scholar]
  16. Bahaidarah, H.M.; Tanweer, B.; Gandhidasan, P.; Rehman, S. A combined optical, thermal and electrical performance study of a V-trough PV system experimental and analytical investigations. Energies 2015, 8, 2803–2827. [Google Scholar] [CrossRef]
  17. Naseer, K.K.; Ahmed, F.A.; Fadhil, M.E. Improve the performance of solar modules by reflectors. In Proceedings of the Sixth Scientific Conference “Renewable Energy and its Applications”, Karbala, Iraq, 21–22 February 2018; Volume 1032, p. 012031. [Google Scholar]
  18. Elbreki, A.M.; Muftah, A.F.; Sopian, K.; Jarimi, H.; Fazlizan, A.; Ibrahim, A. Experimental and economic analysis of passive cooling PV module using fins and planar reflector. Case Stud. Therm. Eng. 2021, 23, 100801. [Google Scholar] [CrossRef]
  19. Moon, K.K.; Khalid, O.A.; Jiying, L.; Joon-Ho, C.; Huiqing, W. Optimal design strategy of a solar reflector combining photovoltaic panels to improve electricity output: A case study in Calgary, Canada. Sustainability 2021, 13, 6115. [Google Scholar] [CrossRef]
  20. Jin, S.; Choi, B.G.; Choi, J.; Kim, H.; Seung-Tak, R.; Chun, T.R.; Yun-Su, K. New curved reflectors for significantly enhanced solar power generation in four seasons. Energies 2018, 12, 4602. [Google Scholar]
  21. Amanlou, Y.; Hashjin, T.T.; Ghobadian, B.; Najafi, G. Air cooling low concentrated photovoltaic/thermal (LCPV/T) solar collector to approach uniform temperature distribution on the PV plate. Appl. Therm. Eng. 2018, 141, 413–421. [Google Scholar] [CrossRef]
  22. Sultan, M.S.; Tso, C.P.; Raheem, K.A.; Sobayel, K.; Abdullah, M.Z.; Sopian, K.; Ahmed, S.A. Revolutionizing photovoltaic excellence: Unveiling a cutting-edge approach to assessing module enhancers for optimal area and cost efficiency. Case Stud. Therm. Eng. 2024, 55, 104139, Erratum in Case Stud. Therm. Eng. 2024, 55, 104310. [Google Scholar] [CrossRef]
  23. Maatallah, T.; Zachariah, R.; Al-Amri, F.G. Exergo-economic analysis of serpentine flow type water based photovoltaic thermal system with phase change material (PVT-PCM/water). Sol. Energy 2019, 193, 195–204. [Google Scholar] [CrossRef]
  24. Mazón-Hernández, R.; García-Cascales, J.R.; Vera-García, F.; Káiser, A.S.; Zamora, B. Improving the electrical parameters of a photovoltaic panel by means of an induced or forced air stream. Int. J. Photoenergy 2013, 2013, 830968. [Google Scholar] [CrossRef]
  25. Joel, J.; Patrick, R.B.; Robert, L.J.; Tonio, B.; Vladimir, B. Pathways for solar photovoltaics. Energy Environ. Sci. 2015, 8, 1200. [Google Scholar]
  26. Trever, M.; Vasilis, M. A Comprehensive Guide to Solar Energy Systems: With Special Focus on Photovoltaic Systems; Academic Press: Cambridge, MA, USA, 2018. [Google Scholar]
Figure 1. (a) A PV without an enhancer; (b) a PV with an enhancer.
Processes 12 00988 g001
Figure 2. (a) A PV without a cooler; (b) a PV with a cooler (Maatallah et al. [23]).
Processes 12 00988 g002
Figure 3. (a) A PV without a cooler; (b) a PV with a cooler (Mazón-Hernández et al. [24]).
Processes 12 00988 g003
Figure 4. Block diagram outlining the research methodology.
Processes 12 00988 g004
Figure 5. Illustrations of PVs with enhancers in different configurations: (a) when L E = L P V and W E = W P V ; (b) when L E > L P V and W E = W P V ; (c) when L E = L P V and W E > W P V ; (d) when L E > L P V and W E > W P V ; (e) when the PV area does not overlap with the enhancer’s area; (f) when the PV area partially overlaps with the enhancer’s area (Sultan et al. [22]).
Processes 12 00988 g005
Figure 6. The effect of increasing the solar cell number of the PV with the enhancer on the total solar cell number needed for the performance evaluation using F C A E and F M C A E .
Processes 12 00988 g006
Figure 7. The solar cell saving percentage when using F M C A E .
Processes 12 00988 g007
Figure 8. The effect of increasing the solar cell number on the cost of the total solar cells when using F C A E and F M C A E .
Processes 12 00988 g008
Figure 9. The effect of increasing the solar cell number on the expenses cost when using F C A E and F M C A E .
Processes 12 00988 g009
Table 1. A comparison of F C A E and F M C A E .
MethodItems NeededTotal Number of Solar Cells (Ntot)Cost of Ntot (C), USD Expenses Cost (U), USDDoes the Method Represent a Financially Viable Approach?
The existing method:
F C A E = A P V E A P V   +   A P V , c o n v e r t e d × Y P P V , o u t   +   Z Y P P V E , o u t
and
F C A E , m i n = P P V , o u t P P V E , m a x .
F C A E   p a r a m e t e r s : P P V , o u t , P P V E , o u t , Z   and   Y .
F C A E , m i n   p a r a m e t e r s :   P P V E , m a x   a n d   P P V , o u t
Two PVs that are exactly the same, with one having an enhancer while the other does not. N t o t , C A E = 2 n C C A E = 2 V n U C A E = 2 V n + Z No
The modified method:
F M C A E = A P V E A P V   +   A P V , c o n v e r t e d × Y n   ×   P c e l l , o u t   +   Z Y P P V E , o u t ,
and
F M C A E , m i n = P c e l l , o u t P c e l l , o u t m a x .
F M C A E   p a r a m e t e r s : P c e l l , o u t , P P V E , o u t , n , Y   and   Z .
F M C A E , m i n   p a r a m e t e r s :   P c e l l , o u t m a x   and   P c e l l , o u t
A solitary solar cell without enhancement.
A PV system with an enhancer.
N t o t , M C A E = 1 + n C M C A E = V 1 + n U M C A E = V 1 + n + Z Yes
Disclaimer/Publisher’s Note: The statements, opinions and data contained in all publications are solely those of the individual author(s) and contributor(s) and not of MDPI and/or the editor(s). MDPI and/or the editor(s) disclaim responsibility for any injury to people or property resulting from any ideas, methods, instructions or products referred to in the content.

