Article

Research on Multi-Physical Field Characteristics of Deep Coal Seam Mining Based on the Rock-Coal-Rock Model

1
Beijing Key Laboratory for Precise Mining of Intergrown Energy and Resources, China University of Mining and Technology (Beijing), Beijing 100083, China
2
State Key Laboratory of Gas Disaster Detecting, Preventing, and Emergency Controlling, Chongqing 400037, China
3
China Coal Technology and Engineering Group, Chongqing Research Institute, Chongqing 400037, China
4
State Key Laboratory of Coal Mine Disaster Prevention and Control, Chongqing 400037, China
*
Author to whom correspondence should be addressed.
Processes 2024, 12(4), 726; https://doi.org/10.3390/pr12040726
Submission received: 1 March 2024 / Revised: 30 March 2024 / Accepted: 1 April 2024 / Published: 3 April 2024
(This article belongs to the Section Chemical Processes and Systems)

Abstract

:
In order to disclose the multi-physical field characteristics of the deep coal seam mining process and their dynamic evolution legislation, based on the “rock-coal-rock” model, during the mining process, the stress field, displacement field, energy field, and plastic zone evolution process are all simulated using FLAC3D6.0. The findings show that stress in the original rock is redistributed as a result of coal seam mining, creating a pressure relief zone in the middle of the goaf and advanced support pressure in the front part of the working face. The roof falls following the termination of coal seam mining. The collapsed blocks fill the middle of the goaf, playing a supporting role. The floor bulges as a new supporting pressure zone forms and builds up high elasticity. The stress reduction zone shifts from a rectangular to an inner circular distribution and an outer square as the working face’s mining distance increases and the range of the fracture field expands accordingly. In addition, a complete model was constructed to verify the correctness of the “rock-coal-rock” model. The stress, displacement, and energy curves of the overlying strata at a distance of 12 m from the bottom of the coal seam in the middle of the goaf obtained by the two methods were basically consistent. Ultimately, the findings of the numerical simulation were compared with the advanced support pressure data that were acquired on-site and they were good. This work can provide a reference for the safe mining of deep coal seams.

1. Introduction

At present, China’s mineral resource development is constantly moving deeper and deep resource extraction is gradually becoming a new normal [1,2]. Deep mining confronts many difficulties because of the traits of “strong disturbance” and “strong timeliness” in resource extraction, in addition to the effect of the complicated circumstances of “three highs and one low” in deep mines [3,4,5]. Meanwhile, deeper coal seam mining often accompanies more severe engineering disturbances, seriously affecting the safety and efficiency of mine production [6,7,8,9]. Dynamic evolution rules of several physical fields, including stress, fracture, displacement, energy, and seepage fields, are involved in deep coal seam mining. The disruption of the coal seam redistributes the initial rock stress, which affects the distribution of seepage fields and breeds and evolves fracture fields [10]. This results in the high-stress states of surrounding rock on both sides of the advanced working face and major deformation issues like floor bulging and cracking [11,12]. Thus, it is extremely important from an engineering perspective to understand how various physical fields couple together, understand how coal mine dynamic disasters occur, and make sure deep coal seam mining is conducted safely.
Previous researchers have conducted in-depth research on the physical field changes during deep coal seam mining processes [13]. In the study of a single physical field, Zhang et al. [14] analyzed the stress changes in the entrance and exit merging areas of the working face. When the leading support pressure entered the merging area, they discovered that it first stabilized, then decreased, then slightly increased, and finally maintained stability. The area where the merging exited displayed a pattern of first stabilizing, then slightly declining, then growing, and finally remaining stable. Bu et al. [15] constructed a mechanical model to analyze the energy accumulation and evolution law of thick and hard roofs in deep coal seams and studied the relationship between energy release and strong dynamic pressure manifestation caused by broken and unstable thick and hard roofs during coal seam mining. Zhao et al. [16], Suchowerska et al. [17], and Xie et al. [18] investigated the distribution law of stress caused by mining when deep coal seam working faces were being mined and found that the overall lateral support pressure was higher than the advanced support pressure. The degree and range of stress field influence caused by mining increased with the increase of mining distance. Yin et al. [19] employed numerical modeling to investigate the impact of joints on the strength and failure properties of coal rock combinations. In the study of two physical fields, Li et al. [20] modeled three common underground coal mining layouts using numerical simulation software and examined the features of the stress field and fracture field while the various coal mining layouts were mined. Das et al. [21] studied the stress state of overlying strata during the mining of continuous coal seams through theoretical analysis and numerical simulation methods, designed a safe method for mining continuous coal seams, and predicted surface subsidence. Chen et al. [22] examined the effects of energy accumulation and release on coal damage and lateral deformation using theoretical computations and data from on-site observation. Ning et al. [23] used advanced measurement techniques to study surface subsidence and overlying strata damage caused by coal seam mining. They put up a statistical method based on data collected on the site to forecast the maximum height of mining-related damage to the overlying strata. Xiao [24] examined the mechanism underlying the deep mining-induced fault coal burst and used numerical simulation tools to examine the evolution law of the elastic strain energy and coal rock stress during mining. In the study of multiple physical fields, Jia et al. [25] and Lu et al. [26] constructed an indoor large-scale similarity model and examined the properties of the stress field, displacement field, and fracture field during coal seam mining using numerical simulation. Zhao et al. [27] created a coupled model of the seepage, fracture, and stress fields of coal rock and used numerical simulation to study the process behind the multifield coupling-induced outburst during coal seam mining. The above research on deep coal seam mining does not exceed three physical fields. However, in actual engineering, coal seam disturbance involves multiple physical field changes and the existing research rarely involves research on the stress field, displacement field, energy field, and fracture field. Therefore, the research on multiple physical fields during deep coal seam mining is particularly important and needs further research.
With the gradual maturity and improvement of engineering geological numerical simulation technology, more and more researchers are comparing and verifying numerical simulation results with on-site measurement results to better solve engineering geological problems. Tuncay et al. [28], Unver et al. [29], and Shang et al. [30] constructed a numerical model to analyze the roof settlement, surrounding rock damage, and stress evolution laws caused by the coal mining process and compared it with the measured results, which showed good results. In the above numerical simulation studies, multiple rock layers are usually constructed in the model; however, there is relatively little research on treating the top and bottom plates as one layer each. By macroscopically magnifying the roof and floor rock layers and constructing a “rock-coal-rock” model, not only can work efficiency be improved but, also, the development degree of cracks and the movement law of overlying strata during coal seam mining can be accurately displayed. Therefore, in this work, using FLAC3D, we build a “rock-coal-rock” model to investigate the dynamic evolution that occurs in the stress field, displacement field, energy field, and plastic zone of the coal seam and overlaying strata during deep coal seam mining. In the event of gas-containing coal body failure and instability, a more precise and understandable representation of the dynamic distribution and transfer process of the mining area space has been achieved. In the meantime, the energy field, displacement field, and stress field’s spatiotemporal dynamic evolution rules were discovered. The research findings can serve as a guide for both the simplification of engineering models and the safe mining of deep coal seams.

2. Methods

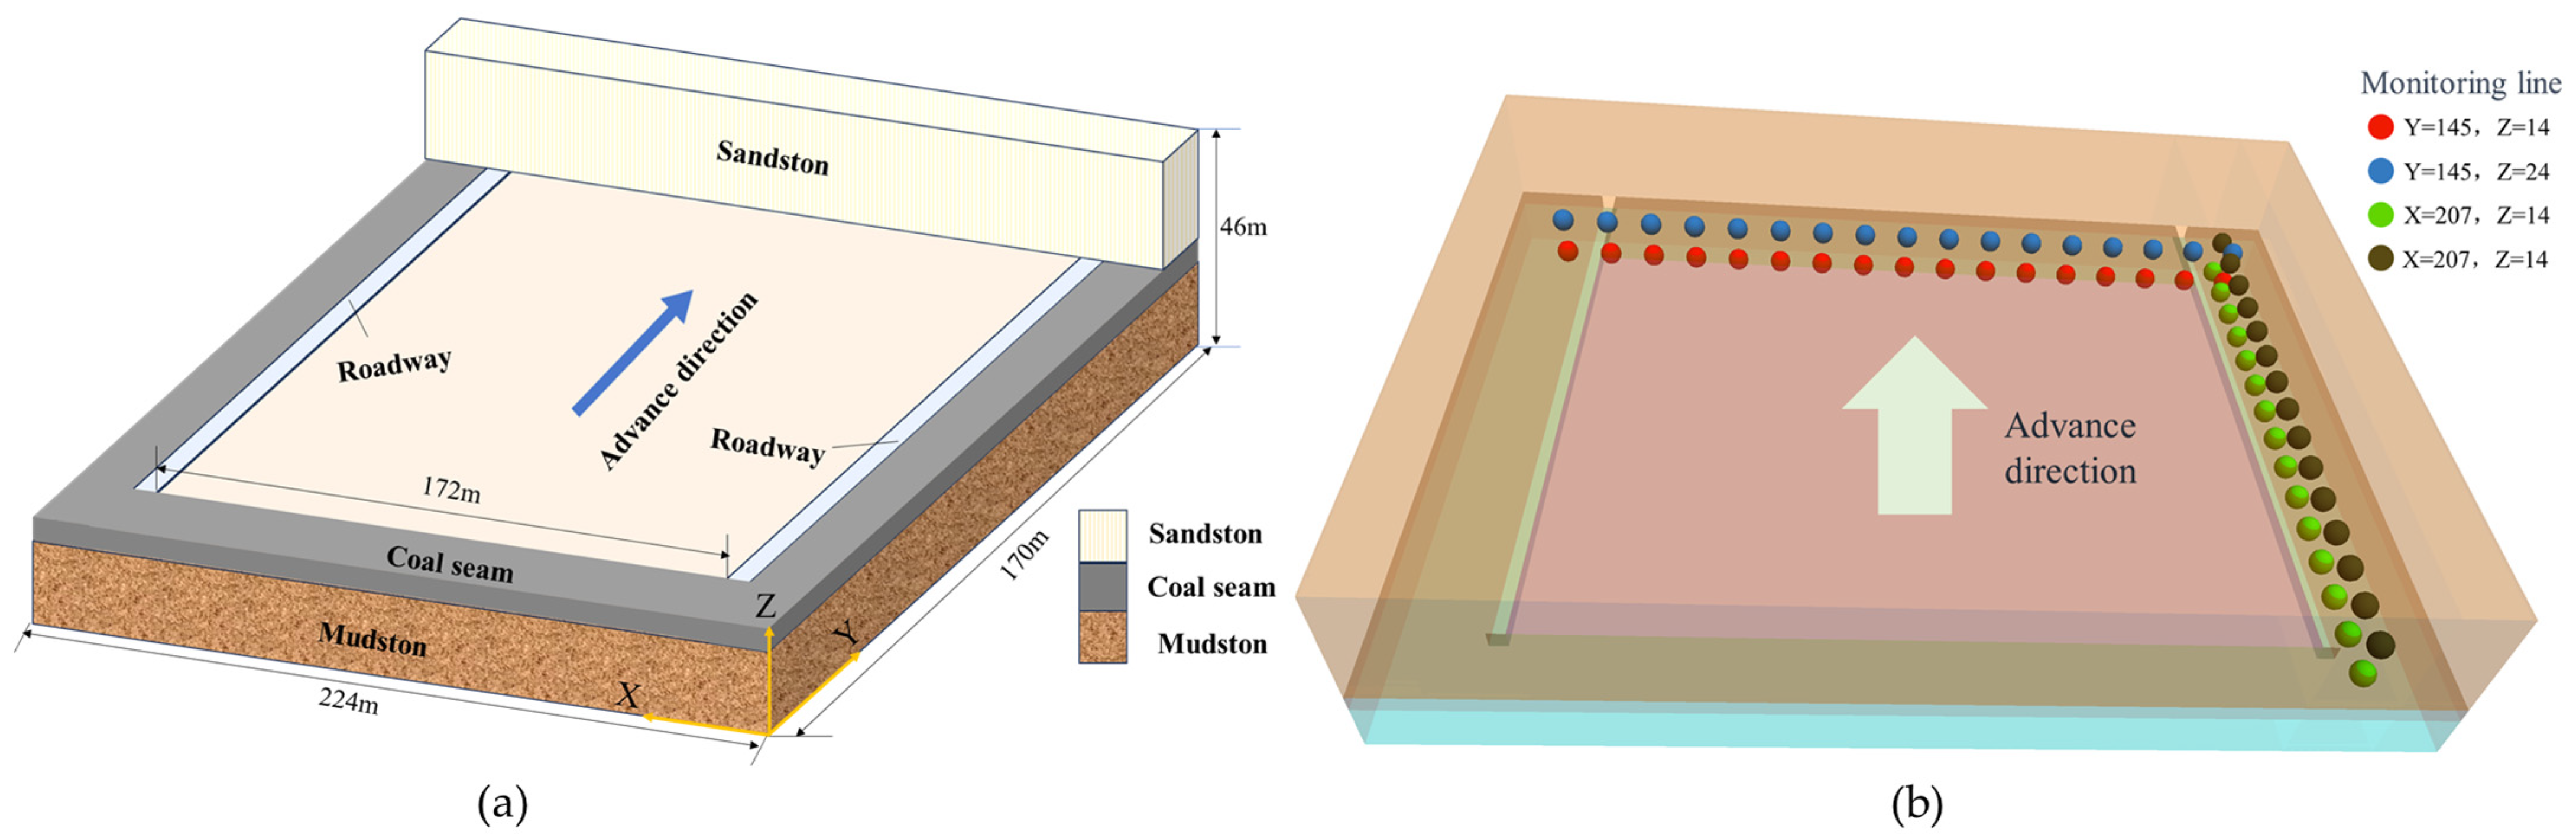
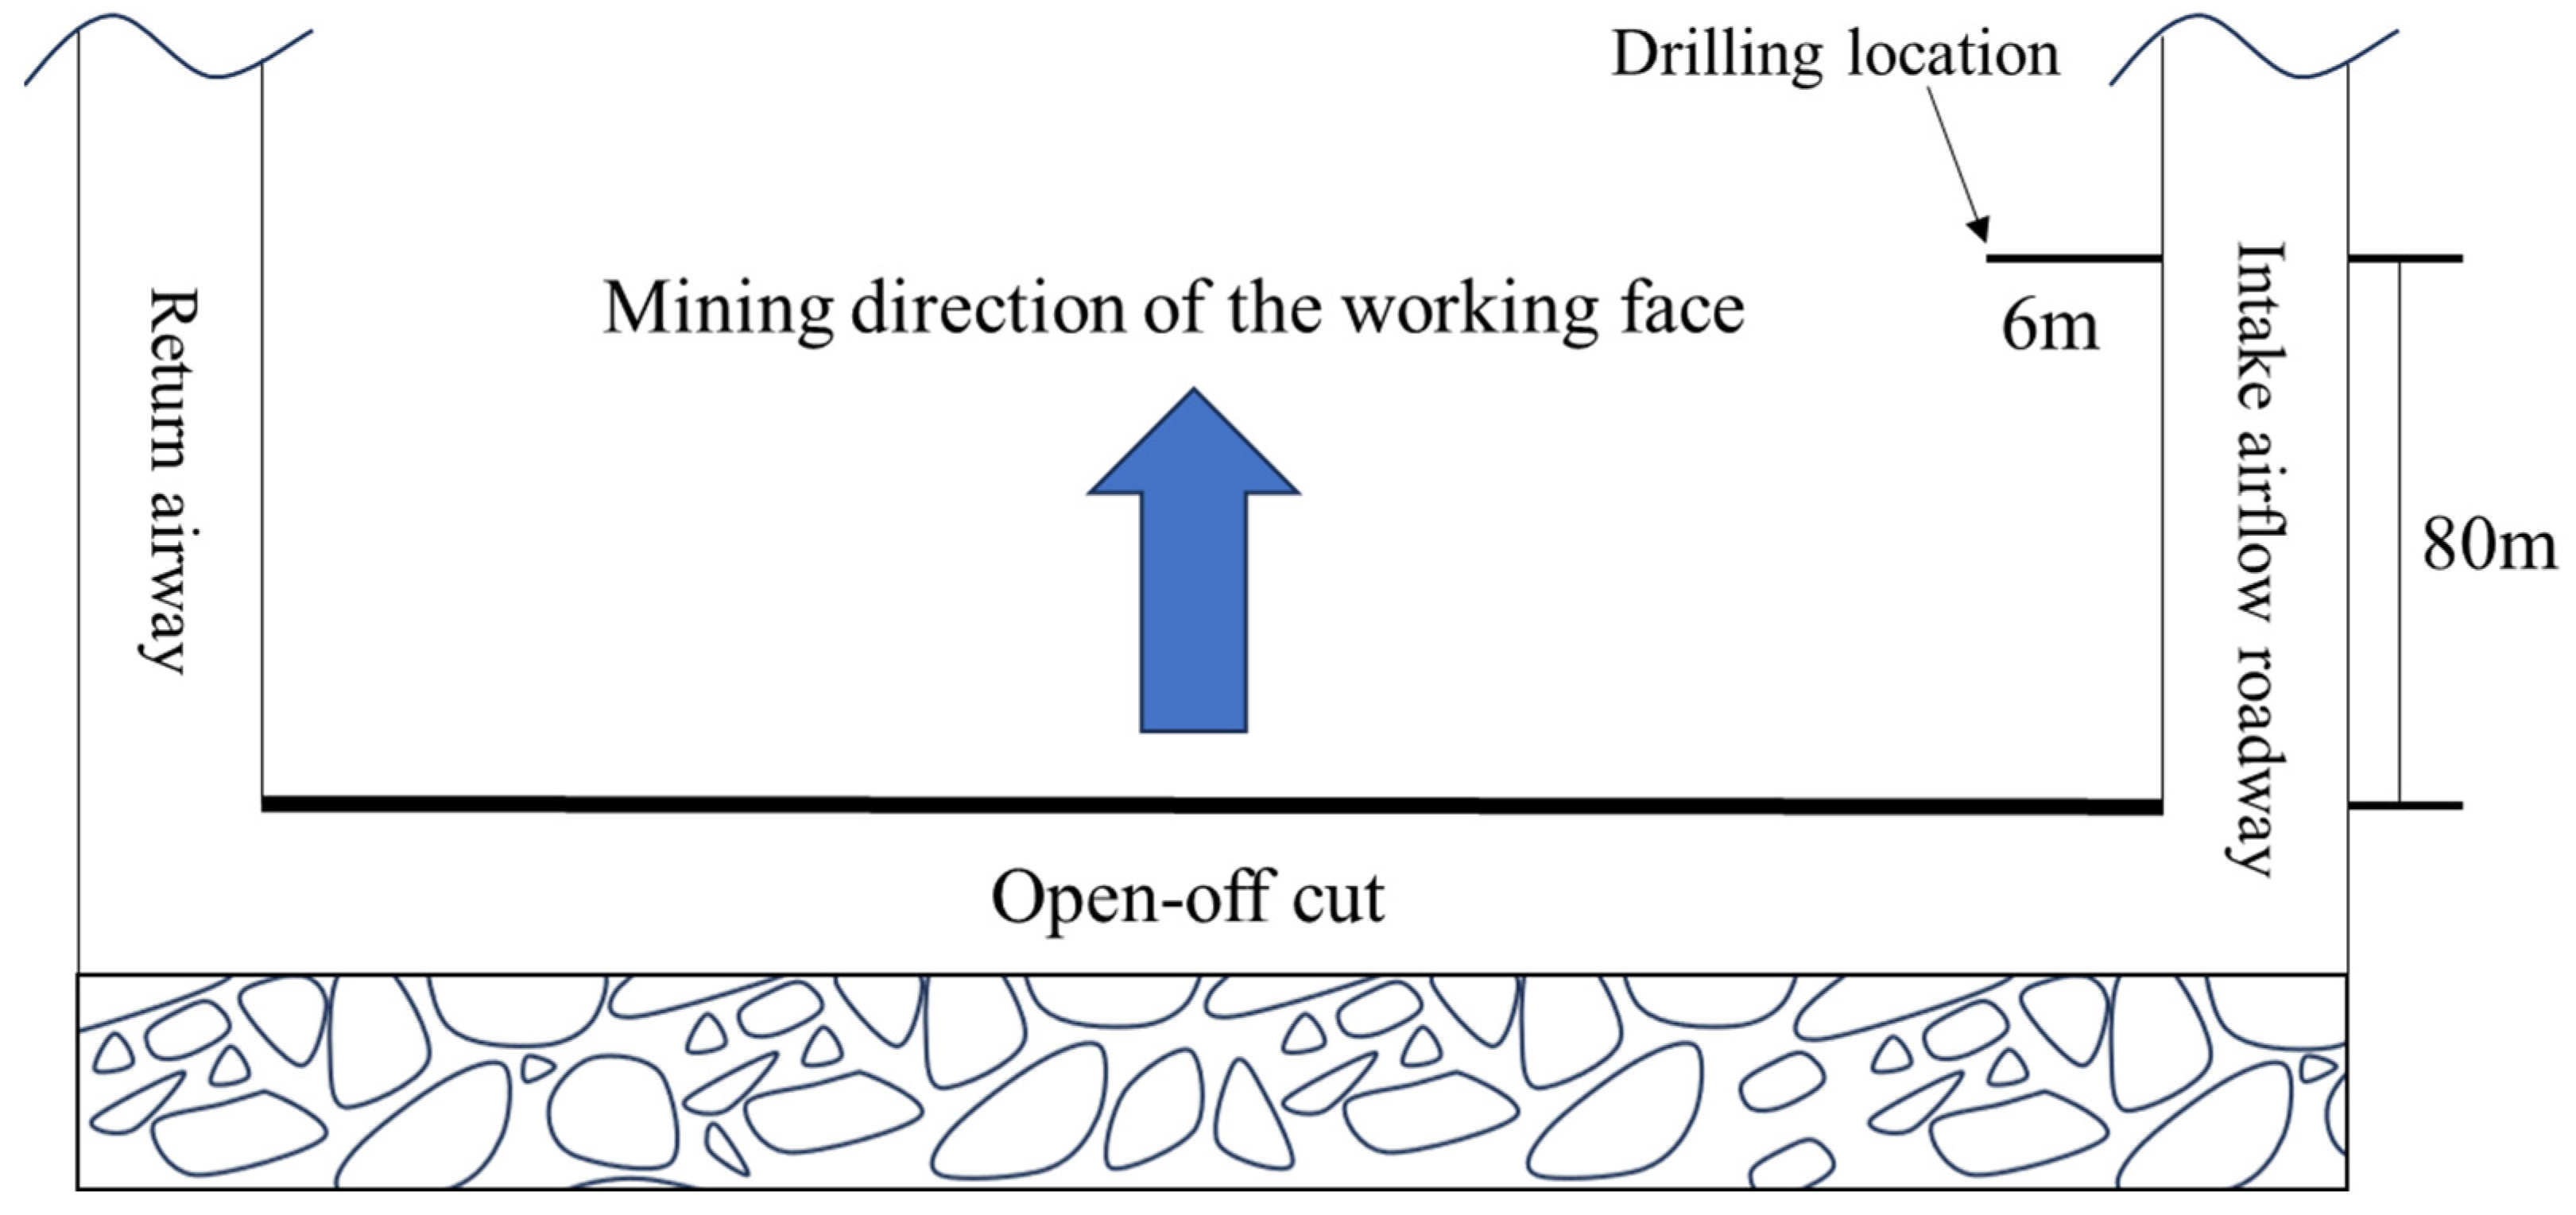
2.1. Overview of the Working Face

The No. 3 coal seam has a stable stratigraphic location and is situated in the bottom Permian, in the bottom portion of the Shanxi Formation. The average coal seam thickness is 4.0 m, with a range of 3.43–5.52 m, indicating stable occurrence. The coal seam has a dip angle ranging from 1 to 5°, with an average dip angle of 2°, indicating that it is almost horizontal. The average burial depth of the mining face is 510 m, the bottom plate is mostly made up of mudstone, and the working face is 172 m long. The drilling bar chart of the working face is shown in Figure 1.

2.2. Establishment of the Constitutive Model

The Mohr–Coulomb yield criteria are used in numerical simulation simulations to characterize the failure behavior of coal and rock masses [31]:
f s = σ 1 σ 3 1 + sin φ 1 sin φ + 2 c 1 + sin φ 1 sin φ
In Formula (1), f s is the yield function, σ 1 and σ 3 are the maximum and minimum principal stresses, respectively, and c and φ are the cohesion and friction angle, respectively.
When f s > 0 , the material would cause shear failure. Usually, the tensile strength of a rock mass is relatively weak so it can be determined whether the rock mass has undergone tensile failure based on the tensile strength criterion ( σ 3 σ t ), where σ t is the tensile strength. The Coulomb criterion is often used to describe the relationship between the stress state of a fractured rock mass under its ultimate stress state and the rock strength parameters, namely:
| τ | = c + σ tan φ
In Formula (2), τ is the shear stress on the shear plane and σ is the normal stress on the shear plane.

2.3. Model Establishment

This numerical simulation is required to reasonably simplify the true scenario in order to better demonstrate the stress, energy, and fracture evolution happening to the top and bottom plates. The following assumptions form the basis of this numerical model’s creation:
(1)
This overall model is separated into three parts: the top plate, coal seam, and bottom plate. It is known as the “rock-coal-rock” model. The top and bottom plates are regarded as a single, cohesive whole;
(2)
Apply vertical stress at the top of the model instead of simulating the rock layers.
Based on the occurrence of rock layers in the coal mine working face and the above assumptions, using the numerical simulation program FLAC3D, a calculation model was created, as seen in Figure 2. The dip angle of the No. 3 coal seam is set at 0° because it is part of a virtually level coal seam. The Z-axis of the model indicates the direction of the rock occurrence, the positive Y-axis is the working face’s mining direction, and the positive X-axis is the working face’s length direction. The model size in this simulation is set to X × Y × Z = 226 m × 170 m × 46 m and the self-weight stress field represents the natural stress field. Previous studies have shown that the Mohr–Coulomb model is effective in coal seam recovery [32]. Therefore, the Mohr–Coulomb model is used for this calculation. During the simulation process, a vertical stress of 12 MPa is supplied to the top section of the model to replace the unmodeled rock layer. The coal seam pressure is set at 0.5 MPa, and the lateral pressure coefficient is set at 1.2, based on the geological data of the mining zone. The model’s lower portion is fixed and there are restrictions around the model’s horizontal motion [33].
A methodical approach to simulating the coal seam mining process was used in order to accurately represent the mining conditions on the ground. The specific actions in the simulation included (1) building models based on assumptions, setting mechanical parameters and boundary conditions for coal and rock mass, and computing initial stress equilibrium; (2) eliminating the influence of displacement and velocity in the model and excavating roadway; and (3) completing five mining operations totaling 125 m throughout the mining of the working face, including one 25 m mining distance. The working face was 172 m long. To eliminate boundary effects and make simulation calculations more reasonable, the model working face was surrounded by a 15 m long coal pillar. The coal rock mechanics parameters used in this simulation were obtained based on the literature [34], as shown in Table 1.

3. Simulation Results Analysis

The “rock-coal-rock” model serves as the foundation for this work, which uses FLAC3D to examine the dynamic evolution laws of the stress field, displacement field, energy field, and plastic zone of the coal seam and overlying rock at a mining distance of 125 m (Y = 15 m to Y = 140 m). In the process of deep “rock coal rock” mining mode, in order to more clearly illustrate the dynamic development process of the three physical fields and plastic zones of coal seams and overlying strata, a horizontal profile is made for the parallel coal seam direction Z = 24 m and, for the direction of parallel advancement, a vertical profile is created, X = 113 m. Meanwhile, the configuration of the monitoring line, which tracks real-time variations in the physical field of the coal seam and surrounding strata every 25 m of advancement, is depicted in Figure 2b. In this simulation, at Y = 145 m and X = 207 m, respectively, two monitoring lines are set up, separated from the bottom of the coal seam by 2 m and 12 m. The inclination monitoring line is 192 m long overall, with 17 monitoring points per layer and a spacing of 12 m between the monitoring points. The monitoring line for the working face’s forward direction is 140 m long in total. There are 15 monitoring points installed on each floor, spaced 10 m apart from one another.

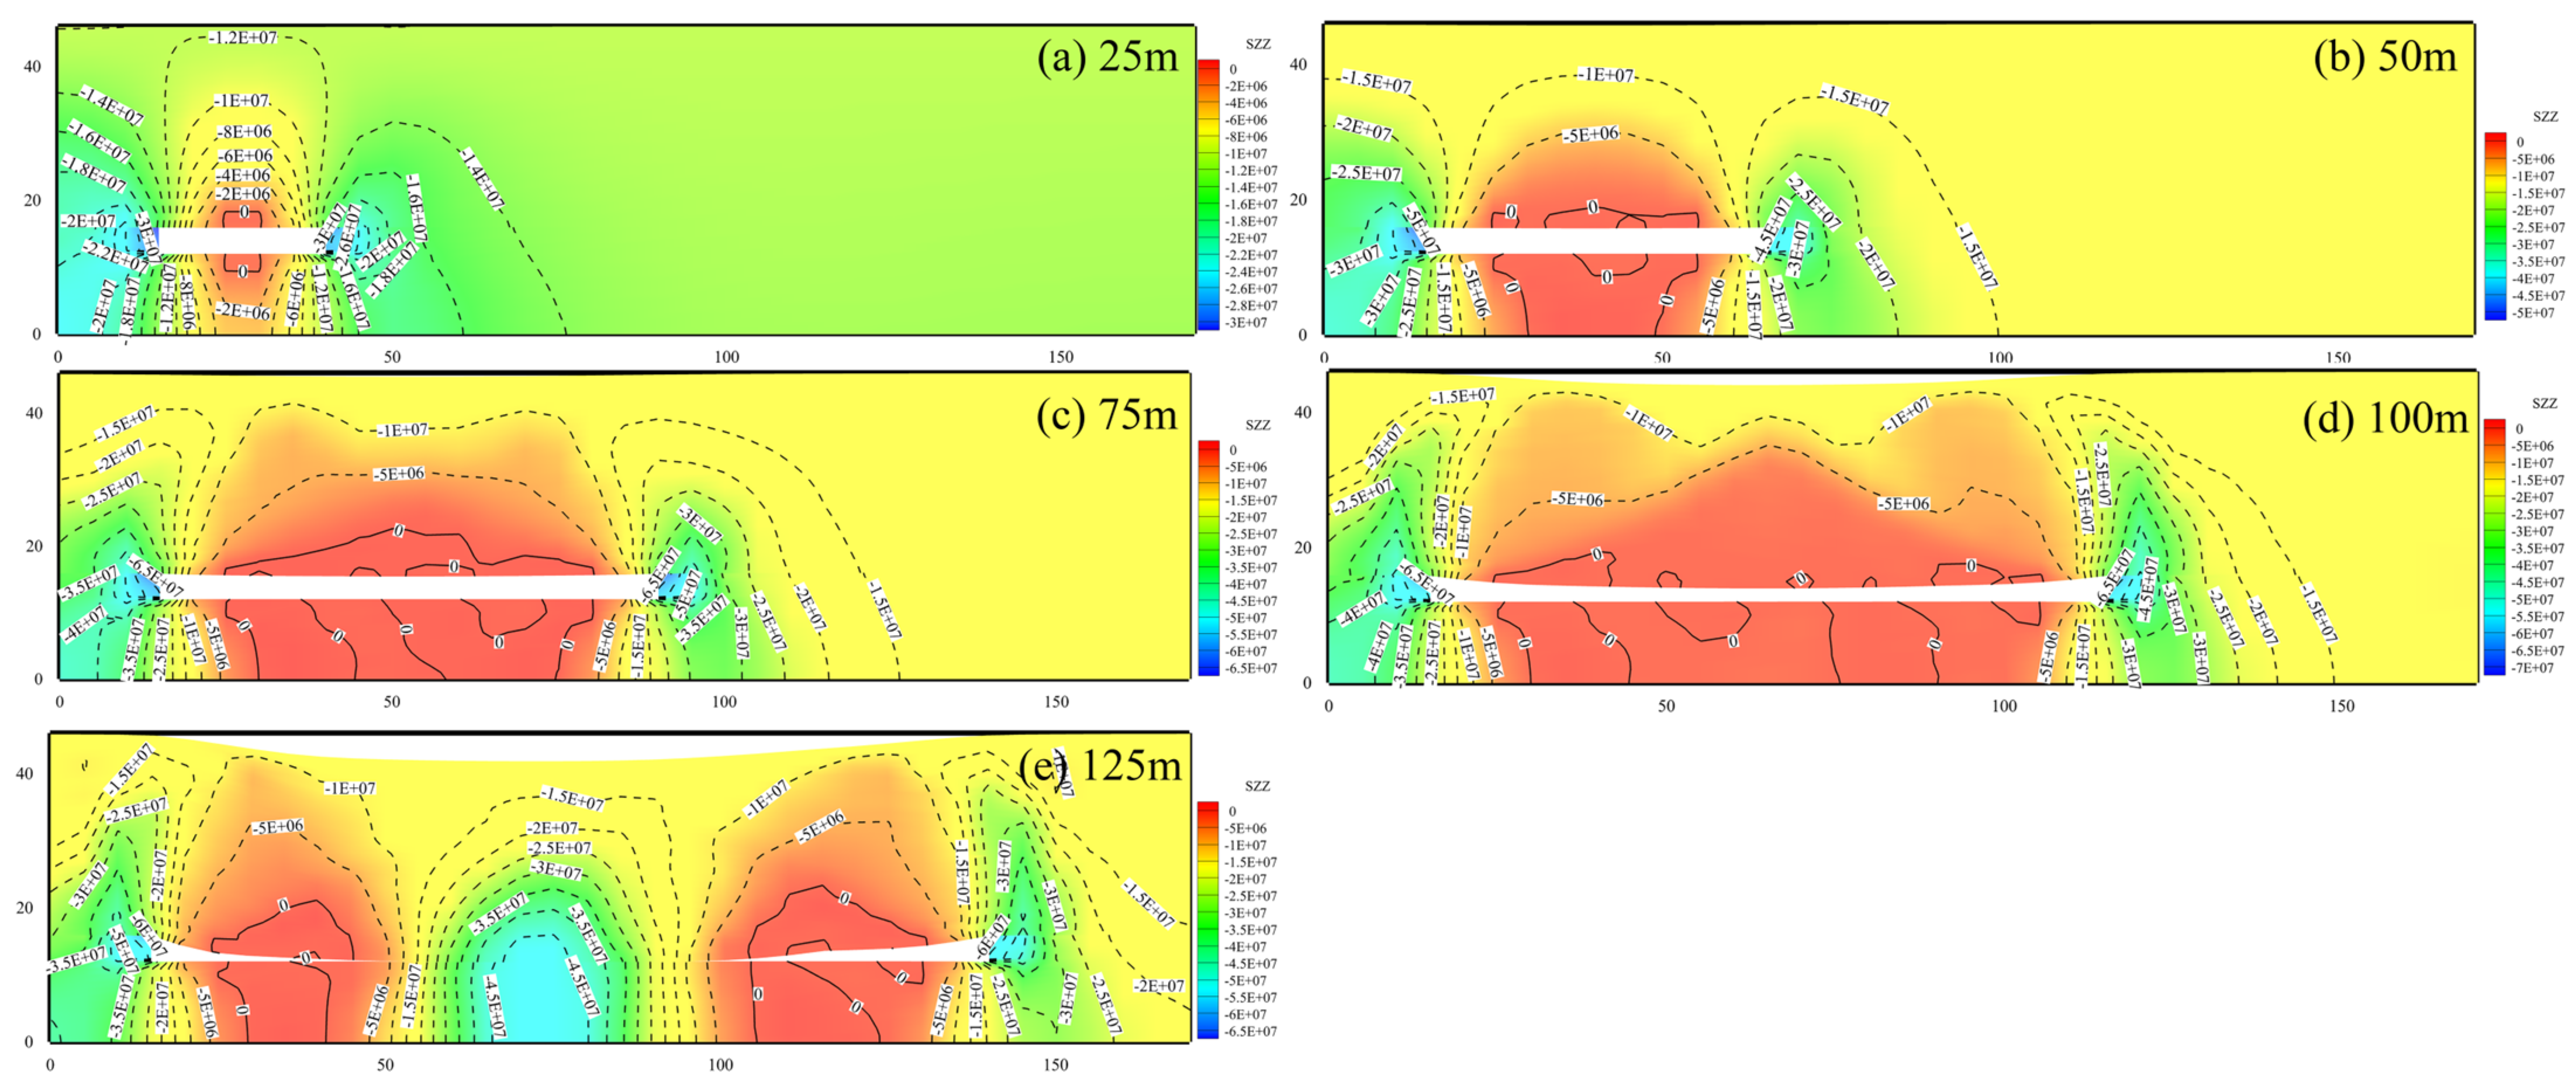
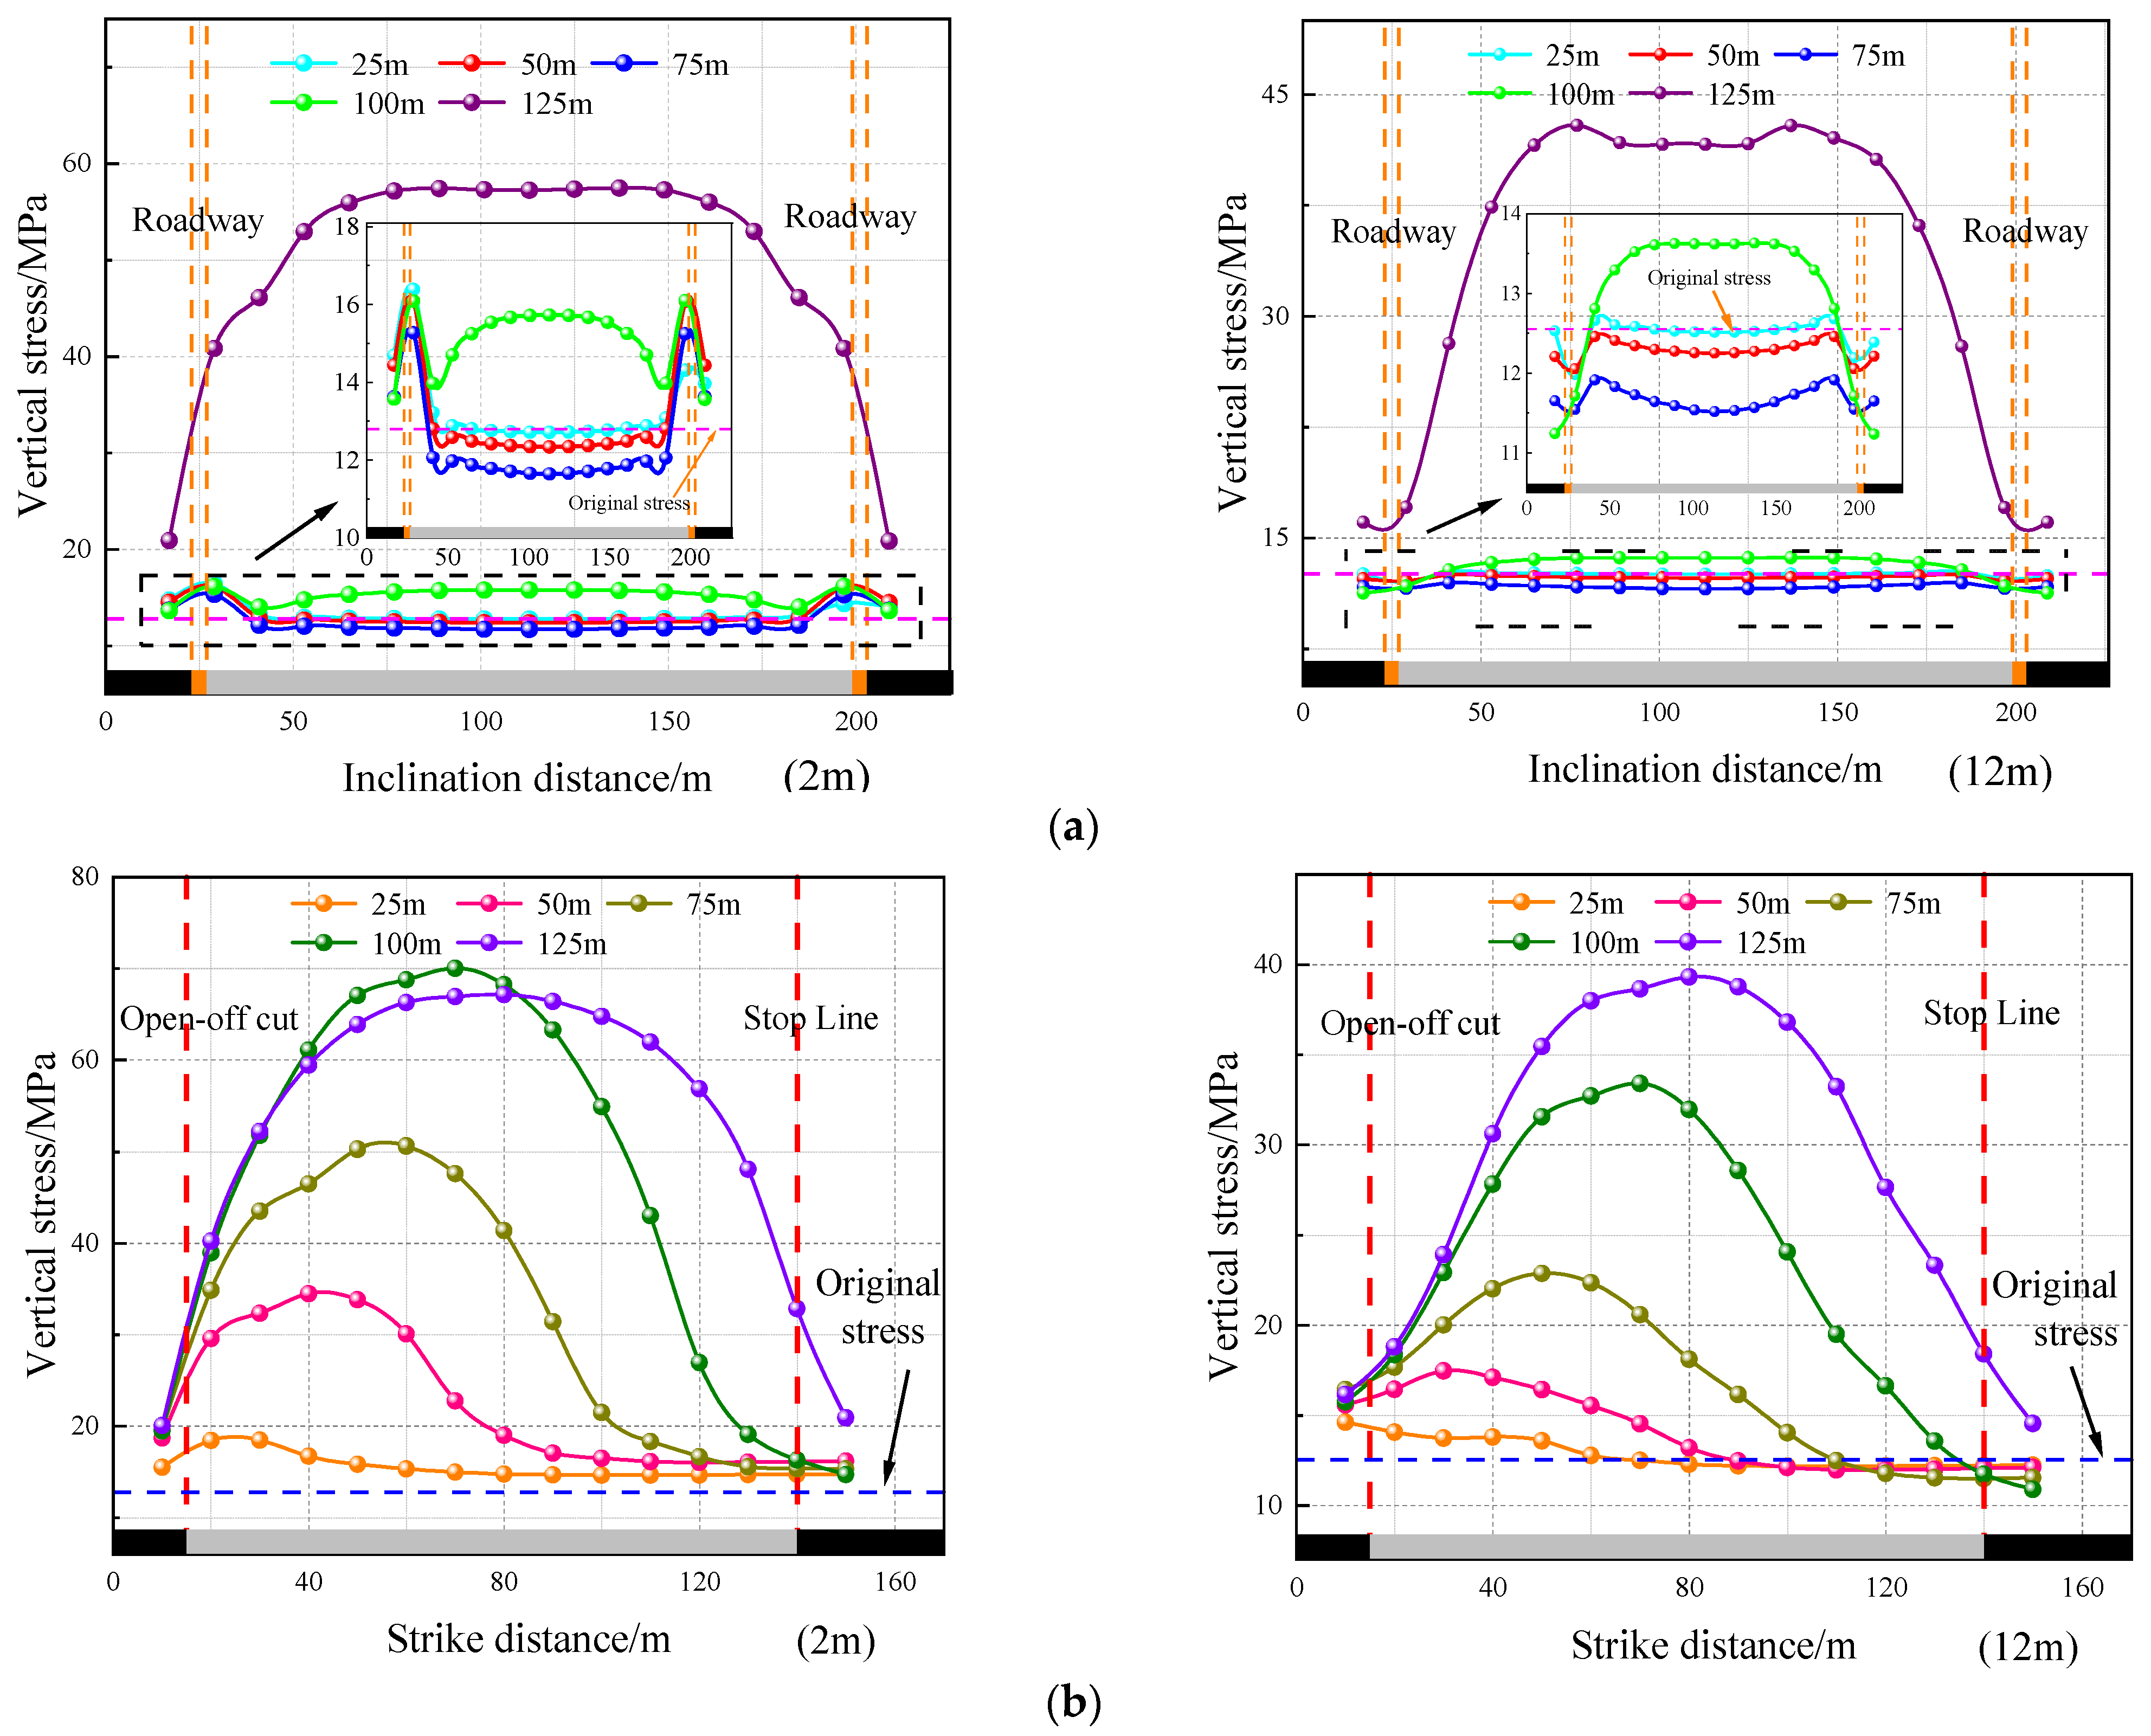
3.1. Dynamic Evolution Law of Stress Fields in Coal Seams and Overlying Strata

Figure 3 illustrates the stress field distribution of the overlaying strata parallel to the coal seam direction during the working face mining procedure and Figure 4 illustrates the distribution of the stress field across the coal seam and adjacent strata parallel to the working face’s advancing direction.
From Figure 3 and Figure 4, the range of overlaying strata damage and the height of the pressure relief arch in the top portion of the goaf are both increasing as the working face is mined and the support pressure in front of the working face is also rising. The further away from the coal seam, the smaller the change in overlying rock stress. From Figure 3, evidently, early on in the mining industry, the stress state of the overlying strata in the upper portion of the goaf is destroyed and there is a noticeable release of stress in the midst of the goaf. Around the goaf, the stress concentration region develops and, around 38 m in front of the working face, it returns to the original rock stress level. When the working face’s mining distance grows, the unloading influence area of the overlying strata continues to expand, and the unloading degree continues to become higher. The stress concentration degree around the unloading area also increases (from 18.2 MPa to 43.6 MPa) and there is a 1.45 to 3.47 rise in the stress accumulation coefficient. The degree of unloading reduces and a stress recovery zone forms in the center of the goaf when the coal seam is mined to 125 m. Overall, in situations where the mining distance is under 100 m, the stress reduction zone takes on a rectangular shape. Once mining has reached 125 m, the compaction zone takes on an elliptical shape and the stress reduction zone evolves from a circular distribution of rectangular outward squares and inner circles. As demonstrated in Figure 4, after mining the working face to a depth of 25 m, the stress of the surrounding rock in the mining area is redistributed and a stress reduction area appears above the goaf, forming an “arched” distribution. As the working face is continually mined, the area of pressure relief in the upper portion of the goaf keeps growing and stress concentration occurs at both the open-off cut and the operating face’s coal wall, forming a front support pressure zone and a rear support pressure zone, with the concentrated stress showing an increasing trend. As soon as the working face hits 100 m, the roof rock layer undergoes significant bending and sinking. The roof falls after progressing 125 m in the working face and the roof and floor come into contact. The interior of the goaf at the center of the collapse is filled, approximately symmetrically distributed, and the concentrated stress is slightly reduced.
Figure 5 shows the distribution of the stress curve at different distances from the coal seam bottom during the mining period of the working face. As demonstrated in Figure 5a, after mining the working face to a depth of 100 m, the stress in the overlying strata remains almost unchanged. However, at 14 and 24 m from the model’s bottom, the stress dramatically increases as the working face is mined to 125 m. It is evident from Figure 5b that as the working face continues to mine, the peak support pressure in front of the two sides of the working face continuously shifts forward and the peak size also increases. Additionally, 2 m away from the bottom of the coal seam, as the advancing distance increases, the mining impact near the working face due to disturbance gradually increases. The maximum support pressure is located behind the working face and reaches its maximum during the fourth mining operation. This is due to the collapse and partial stress release during the fifth mining operation. During the same excavation process, its influence is lessened the further it is from the working face. The mining-induced overburden disturbance is less than the disturbance of the coal seam at a distance of 12 m and, as the mining distance grows, the support pressure in front of the two lanes in the working face rises steadily.
Figure 6 displays the variation curve of the working face’s front support pressure at a distance of 12 m from the coal seam’s bottom in the middle of the goaf with respect to the mining distance. The leading support pressure in the front exhibits a tendency of, first, continuous growth and, then, a minor drop with the increase in the mining distance of the working face, as seen in Figure 6, and the growth rate, first, increases and, then, decreases. Coal seam mining disrupts the initial rock stress state, as demonstrated in Figure 6a, which results in a redistribution of stress. Following the completion of the coal seam mining, the weight of the overlying strata in the goaf is transferred to new support points around it, forming a front and rear support pressure zone. With the advancement of the working face, the advanced support pressure’s peak value keeps advancing. Following 125 m of mining on the working face, collapse occurs, forming three support pressure bands. A stress rise zone and a stress decrease zone are shown to emerge following the mining of the working face in Figure 6b. If a mining distance is of no more than 100 m, the highest point of the support pressure in front of the working face progressively increases with increasing mining distance and the further away from the working face, the lower the stress. Following 125 m of coal seam mining, the roof falls and the stress concentration coefficient in front of the working face drops. Overall, the leading influence range of the stress concentration zone in front of the work area is approximately 5 m and the stress concentration coefficient increases from 1.28 to 3.13 before falling to 2.97.

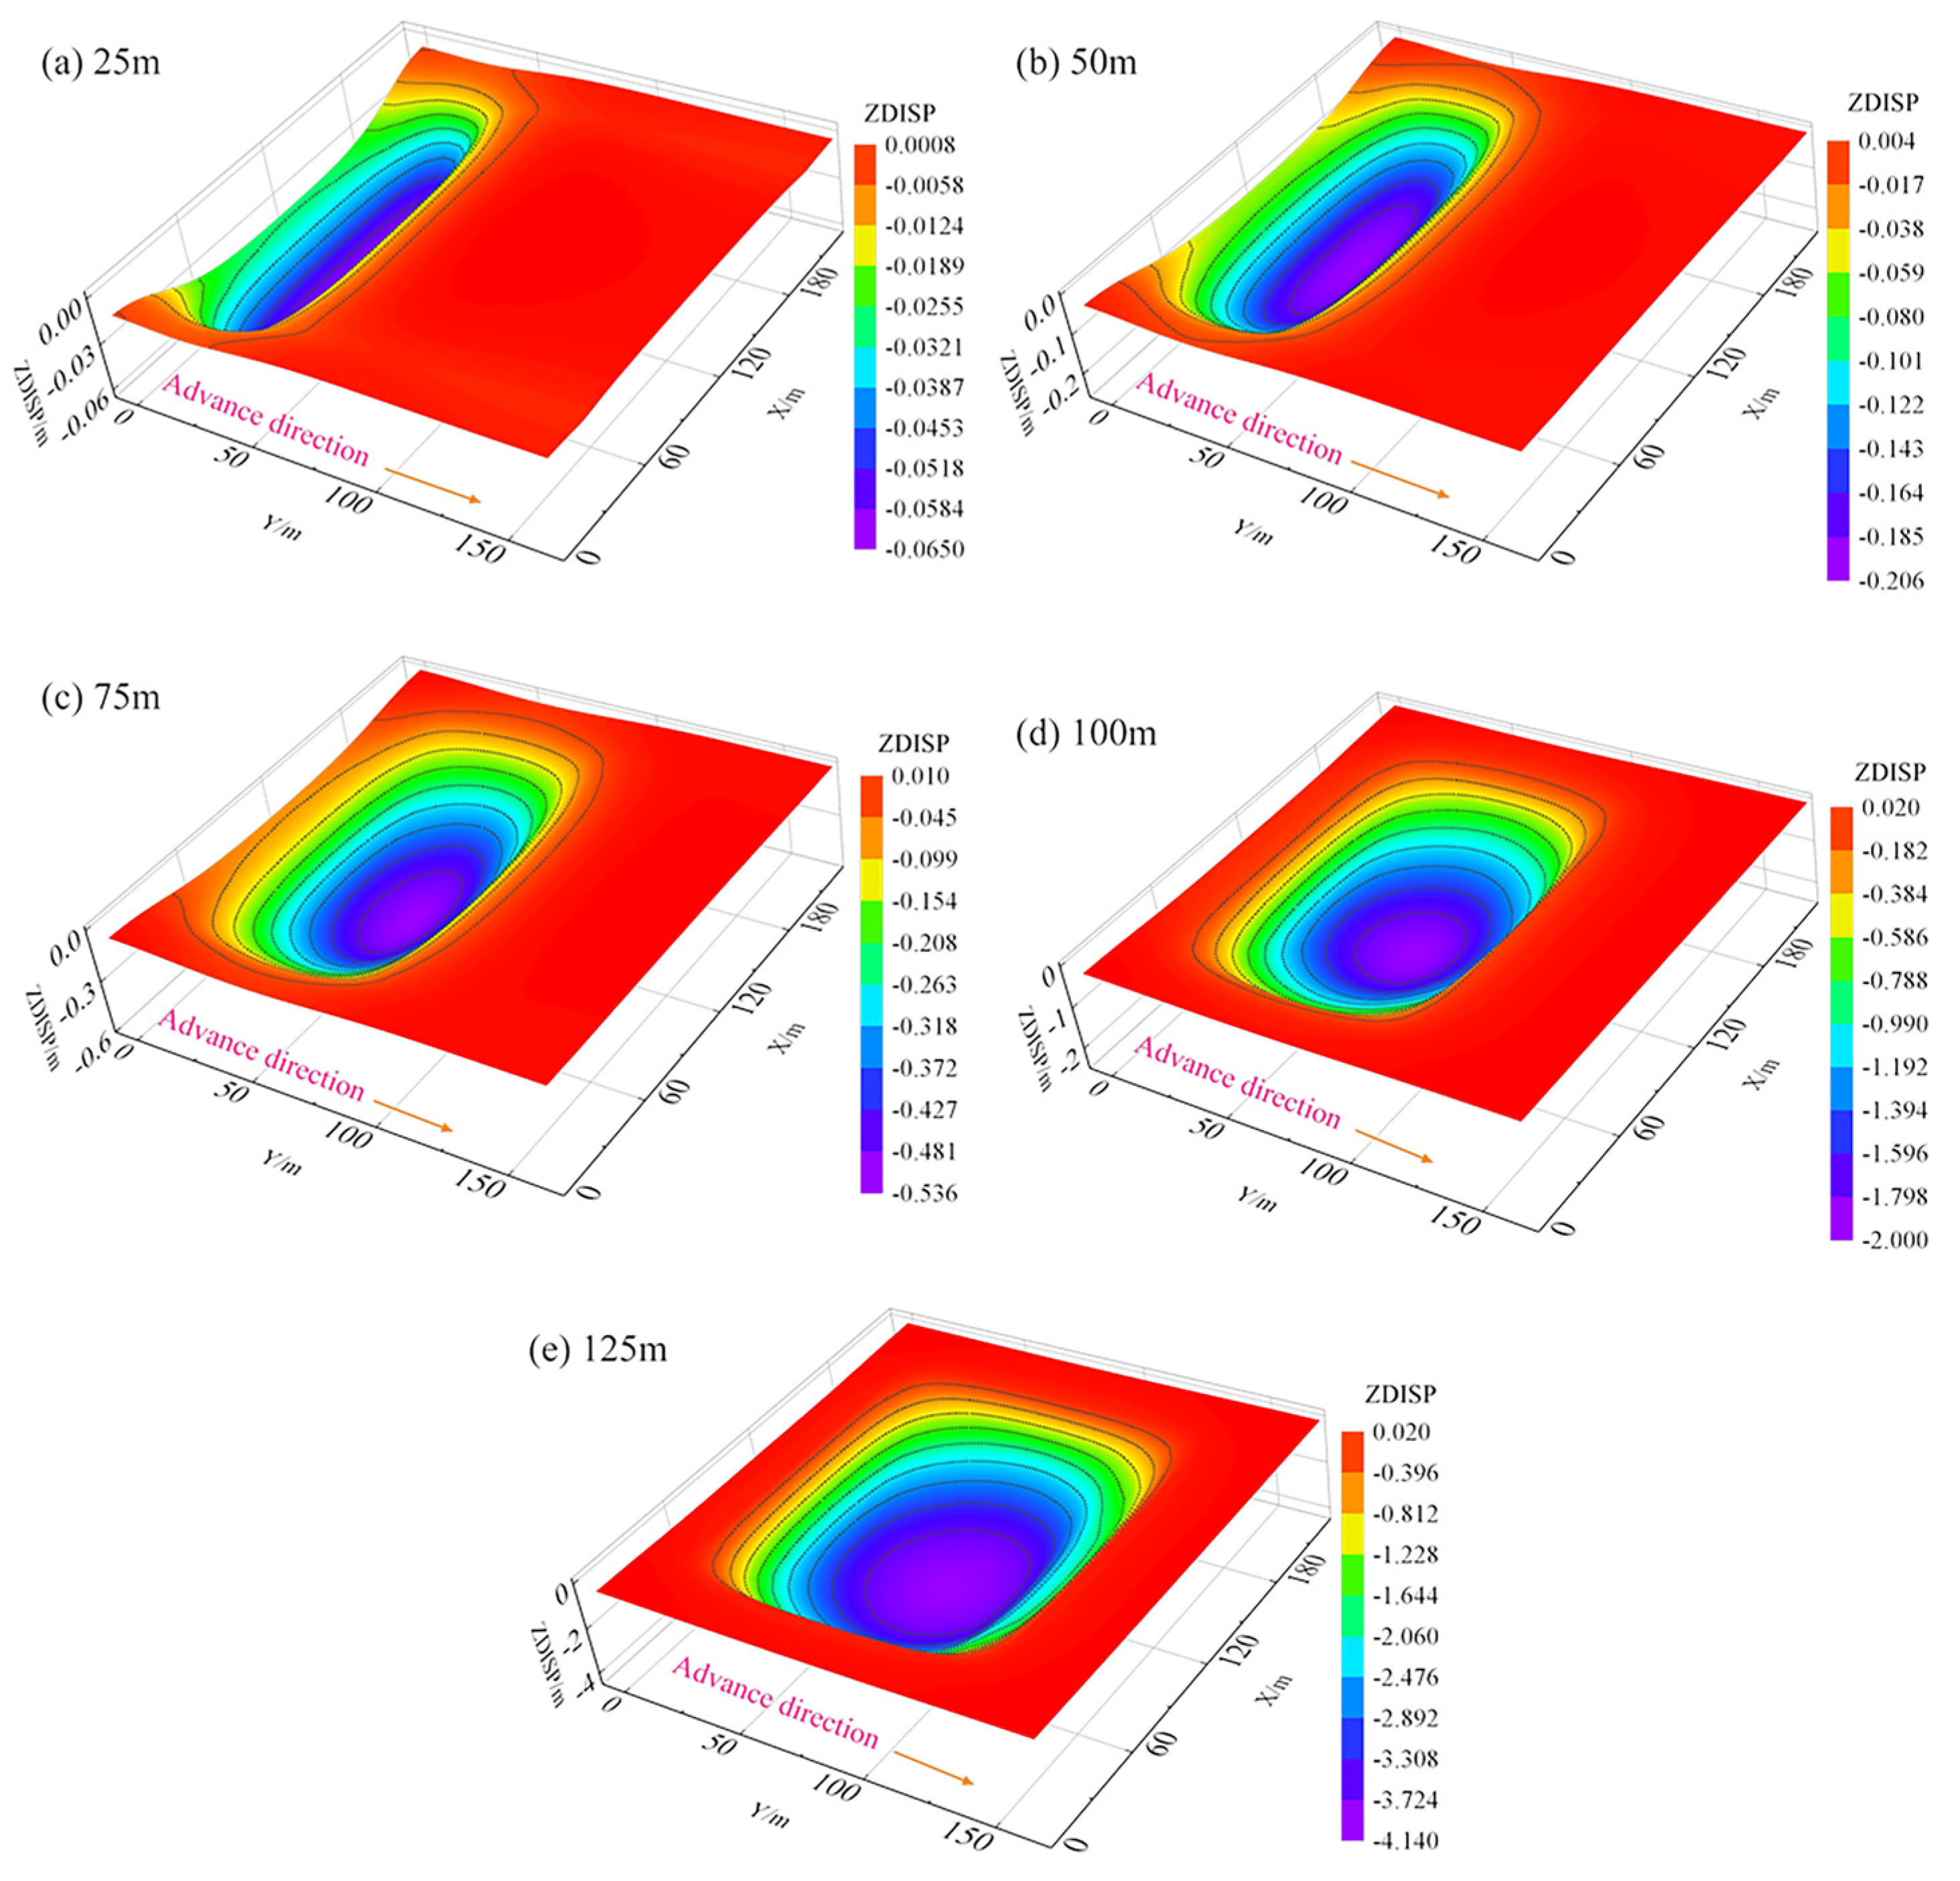
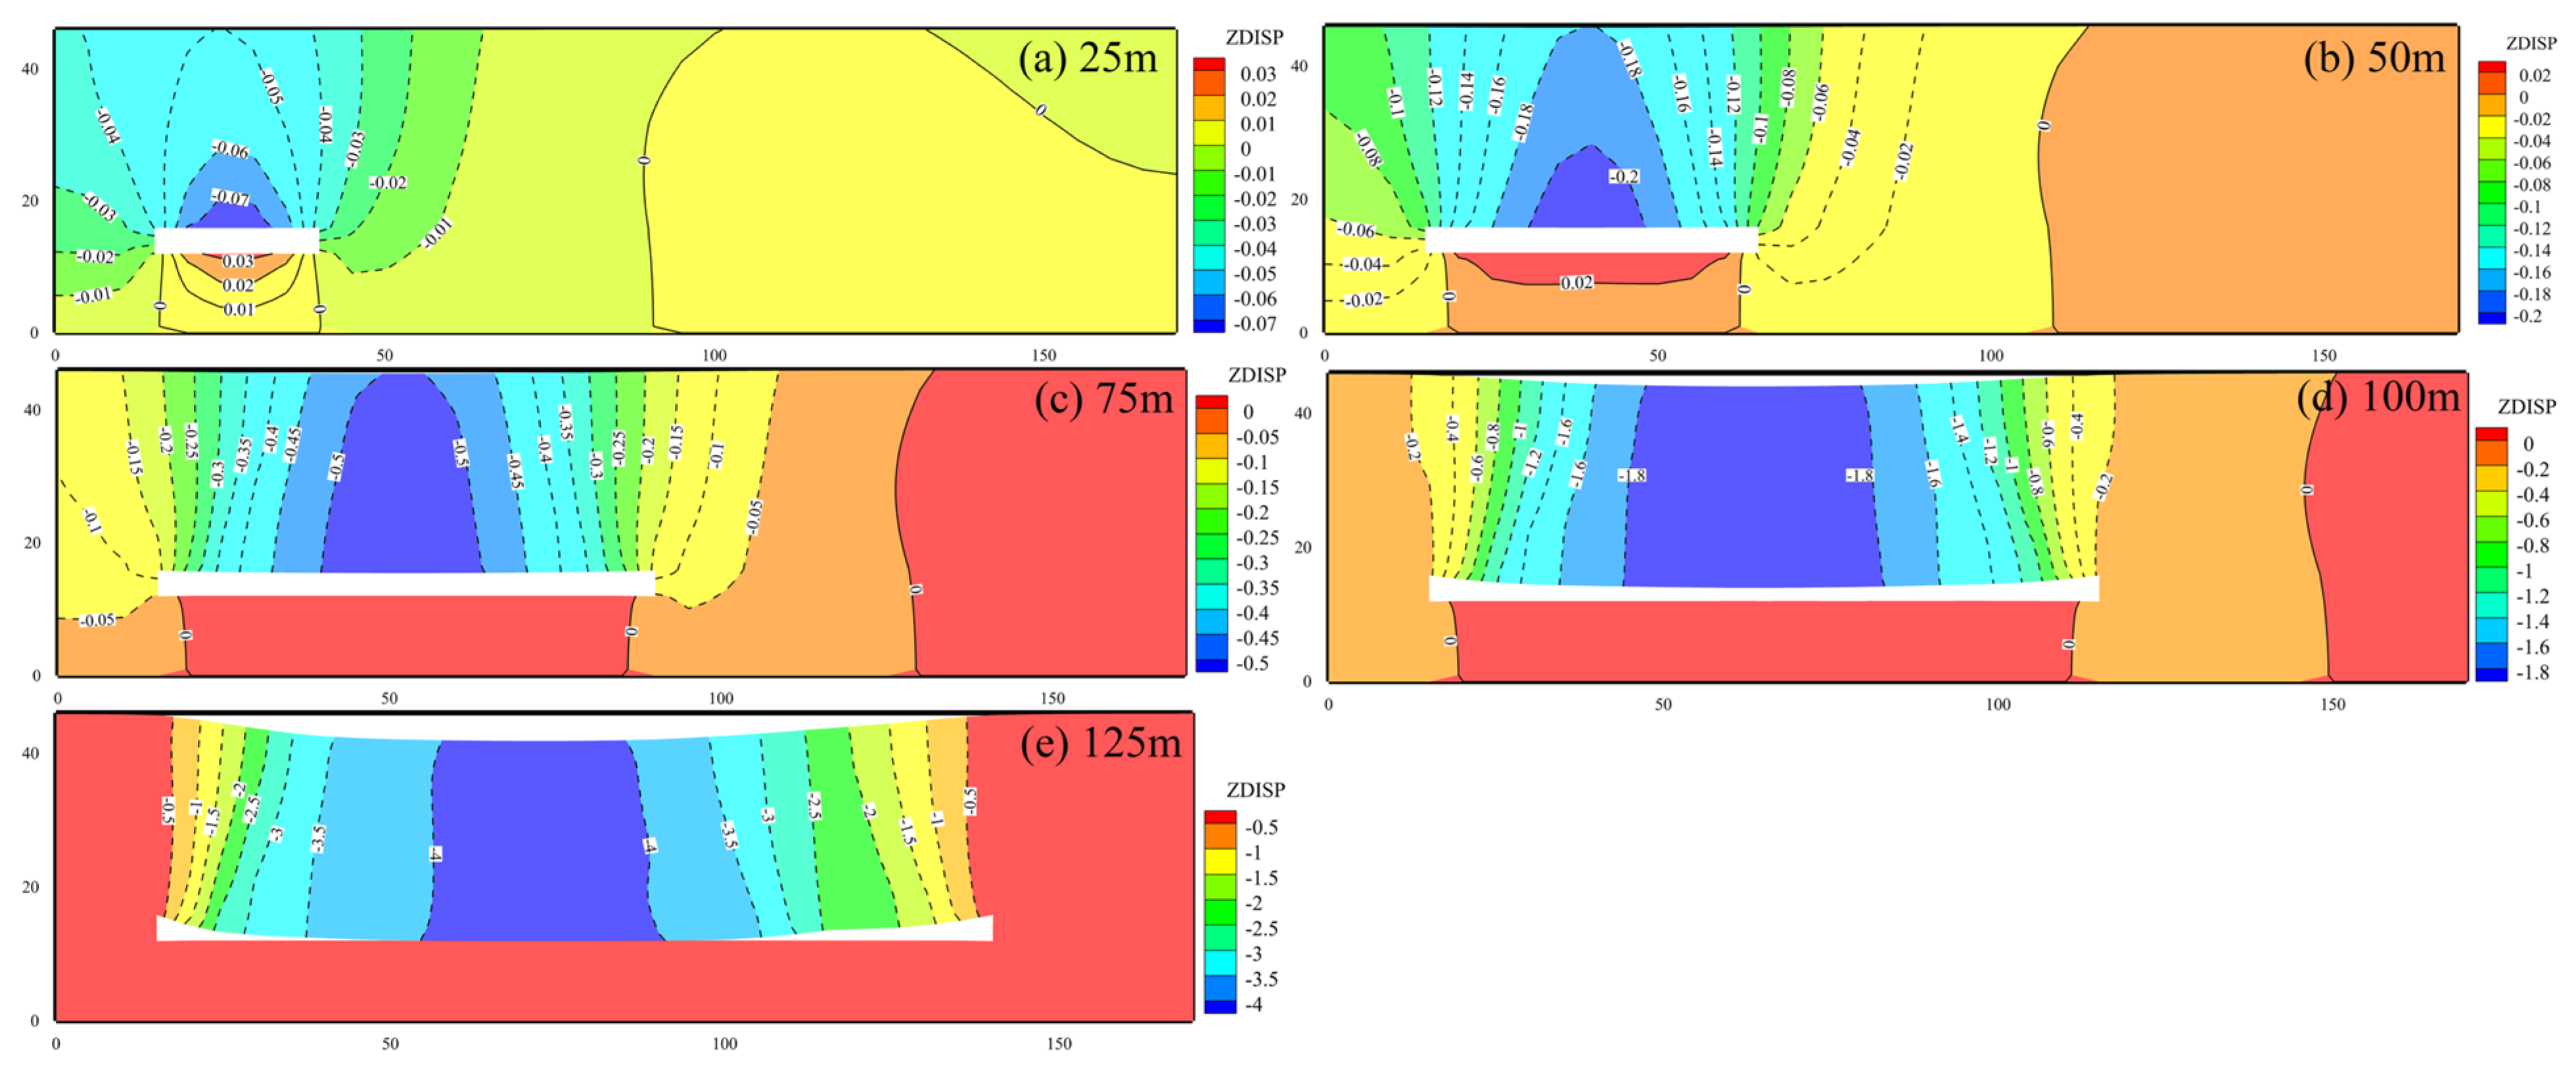
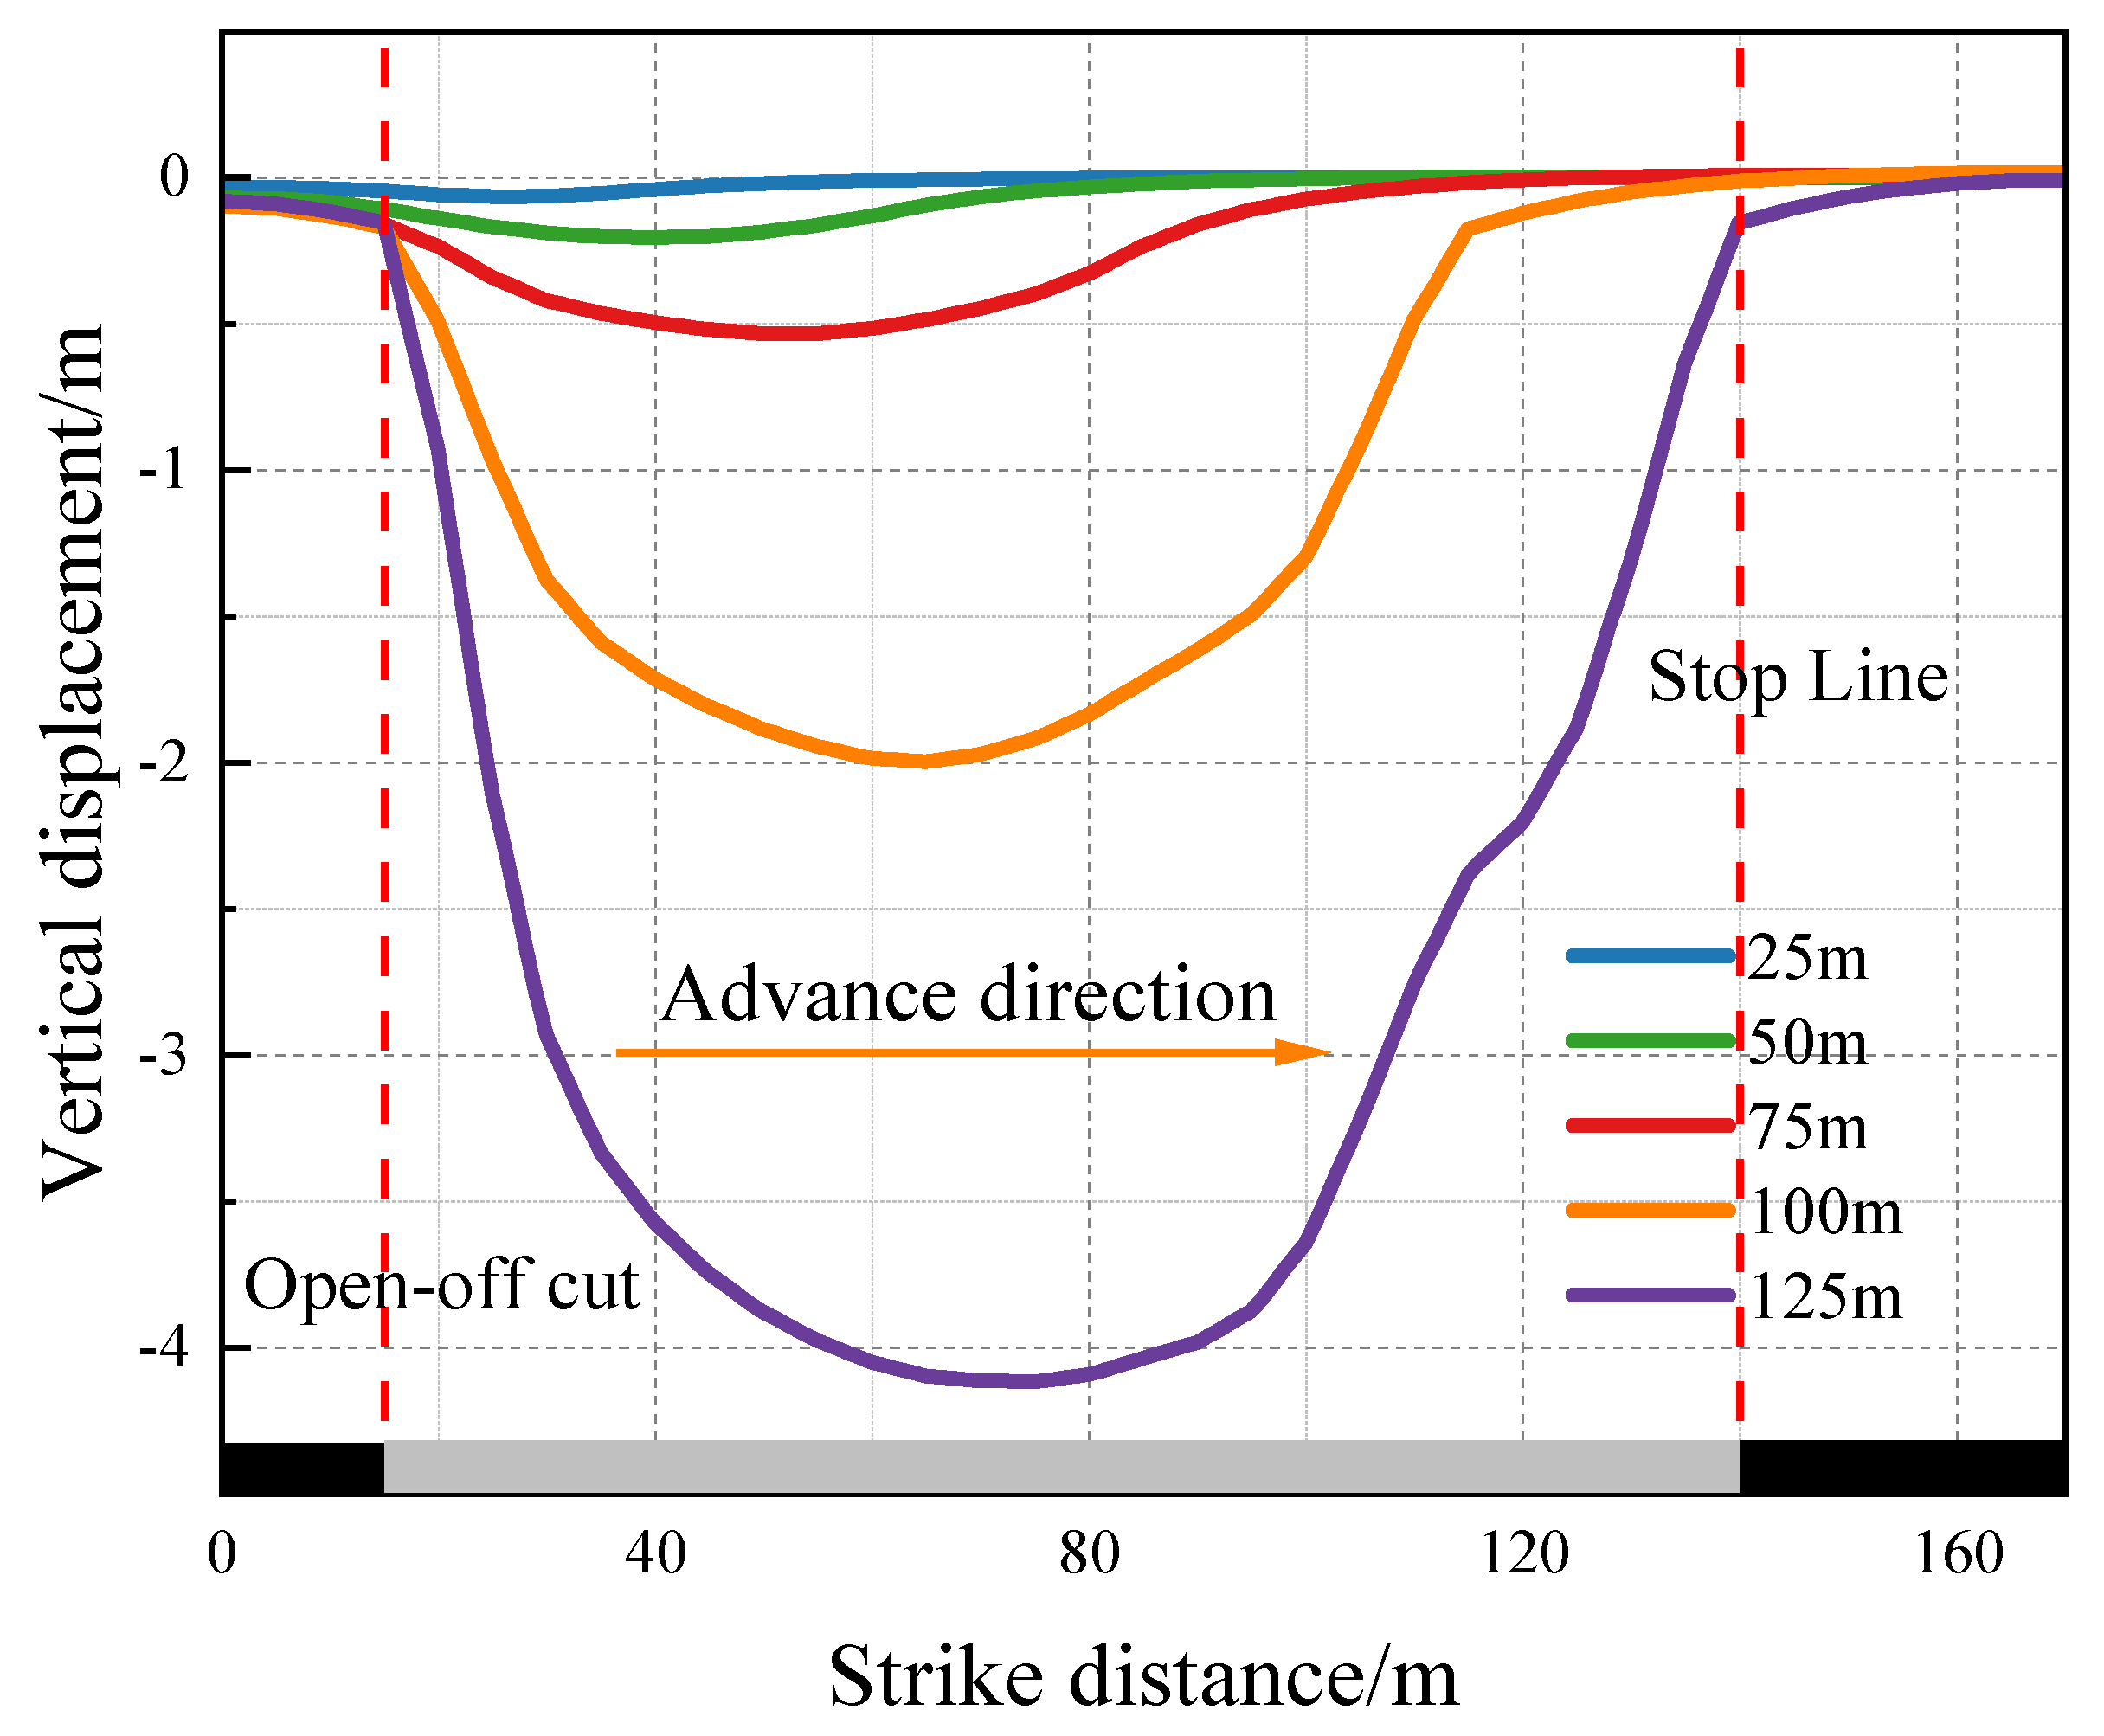
3.2. Dynamic Evolution Law of Displacement Fields in Coal Seams and Overlying Strata

When the working face is being mined, the displacement field distribution of the overlying strata parallel to the coal seam direction is demonstrated in Figure 7. The displacement fields, their distribution of the coal seam, and overlying strata parallel to the progressing direction of the working face can be observed in Figure 8.
As shown in Figure 7, the working face’s constant progress causes the roof’s displacement to increase, with the maximum vertical displacement located in the center of the goaf and the minimum displacement on each flank of the working face, distributed in a bowl shape. This is because the coal body in the middle of the goaf is mined out and the upper rock layer is not supported, resulting in a greater amount of subsidence in the middle rock layer of the goaf than in the boundary rock layer. Following 125 m of mining on the working face, the subsidence value of the middle roof of the goaf reaches its maximum, which is 4 m. It is evident from Figure 8 that the roof’s displacement is spread upward in a parabolic form. The coal seam disturbance has less of an impact the farther one is from the working face and the smaller the displacement. The displacement cloud map of the goaf is approximately symmetrically distributed in the central position. In addition, the top and bottom plates’ displacement and sphere of influence both increase with the working face’s mining distance. There is a noticeable rise in roof displacement when the mining face gets to 100 m. Following 125 m of mining on the working face, there is a significant collapse of the roof, with a maximum subsidence value of 4 m. As the working face is continuously mined, there are obvious displacement characteristics in the rock mass of the coal seam roof and floor. The rock layer in the flooring mostly exhibits upward displacement, creating a bulge, while the overlying strata in the roof primarily show downward displacement.
As the working face is being mined, Figure 9 displays a graph of displacement curves at various distances from the coal seam floor. According to Figure 9a, the sinking of the roof is evidently greater than that of the coal seam, indicating that there will be no separation phenomenon. Early on in the mining process, as the mining distance in the working face gets longer, the displacement of the rock layer away from the working face decreases and changes towards an upward vertical displacement direction. When coming into coal seam mining’s sphere of influence, it shifts to a downward vertical displacement and the displacement increases with the increase in the mining distance of the working face. And when the working face’s mining distance increases, the displacement also rises. From Figure 9b, as the working face advances, it is evident that the displacement of the two coal pillars and roof grows and the range of influence grows gradually wider. Once the coal seam has been extracted to a certain depth, the displacement changes approximately in a concave distribution and the maximum subsidence point appears behind the goaf. Upon completion of the fifth mining cycle in the operational face, the movement of the overlying rock of the two coal pillars approaches full mining. The greatest roof sinking is 0.129 m; whereas, the maximum coal seam subsidence is 0.074 m. During the same mining period, the rock layers far away from the working face are weakened by the impact of mining, resulting in a decrease in displacement.
Figure 10 displays the displacement graph of the overlaying rock layer during the mining operation at a distance of 12 m from the bottom of the coal seam in the center of the goaf. As shown in Figure 10, when the mining of the working face goes on, the roof sinking steadily grows in amount. The displacement of the roof suddenly accelerates and surpasses the amount of the preceding three mining operations when the working face is mined down to a depth of 100 m. This indicates that under the current geological conditions, the crucial value influencing the displacement of the floor and roof during coal seam mining is 100 m. This is because after 100 m of coal seam mining, within the control of the self-weight stress field, the rock on the working face floor breaks through its own elastic energy limit, forming a new stress equilibrium state. The coal seam roof begins to sink significantly, aggravating the floor and roof displacement variations even further. The roof area, which is situated behind the goaf, peaks at 4 m after the coal seam is mined to 125 m.

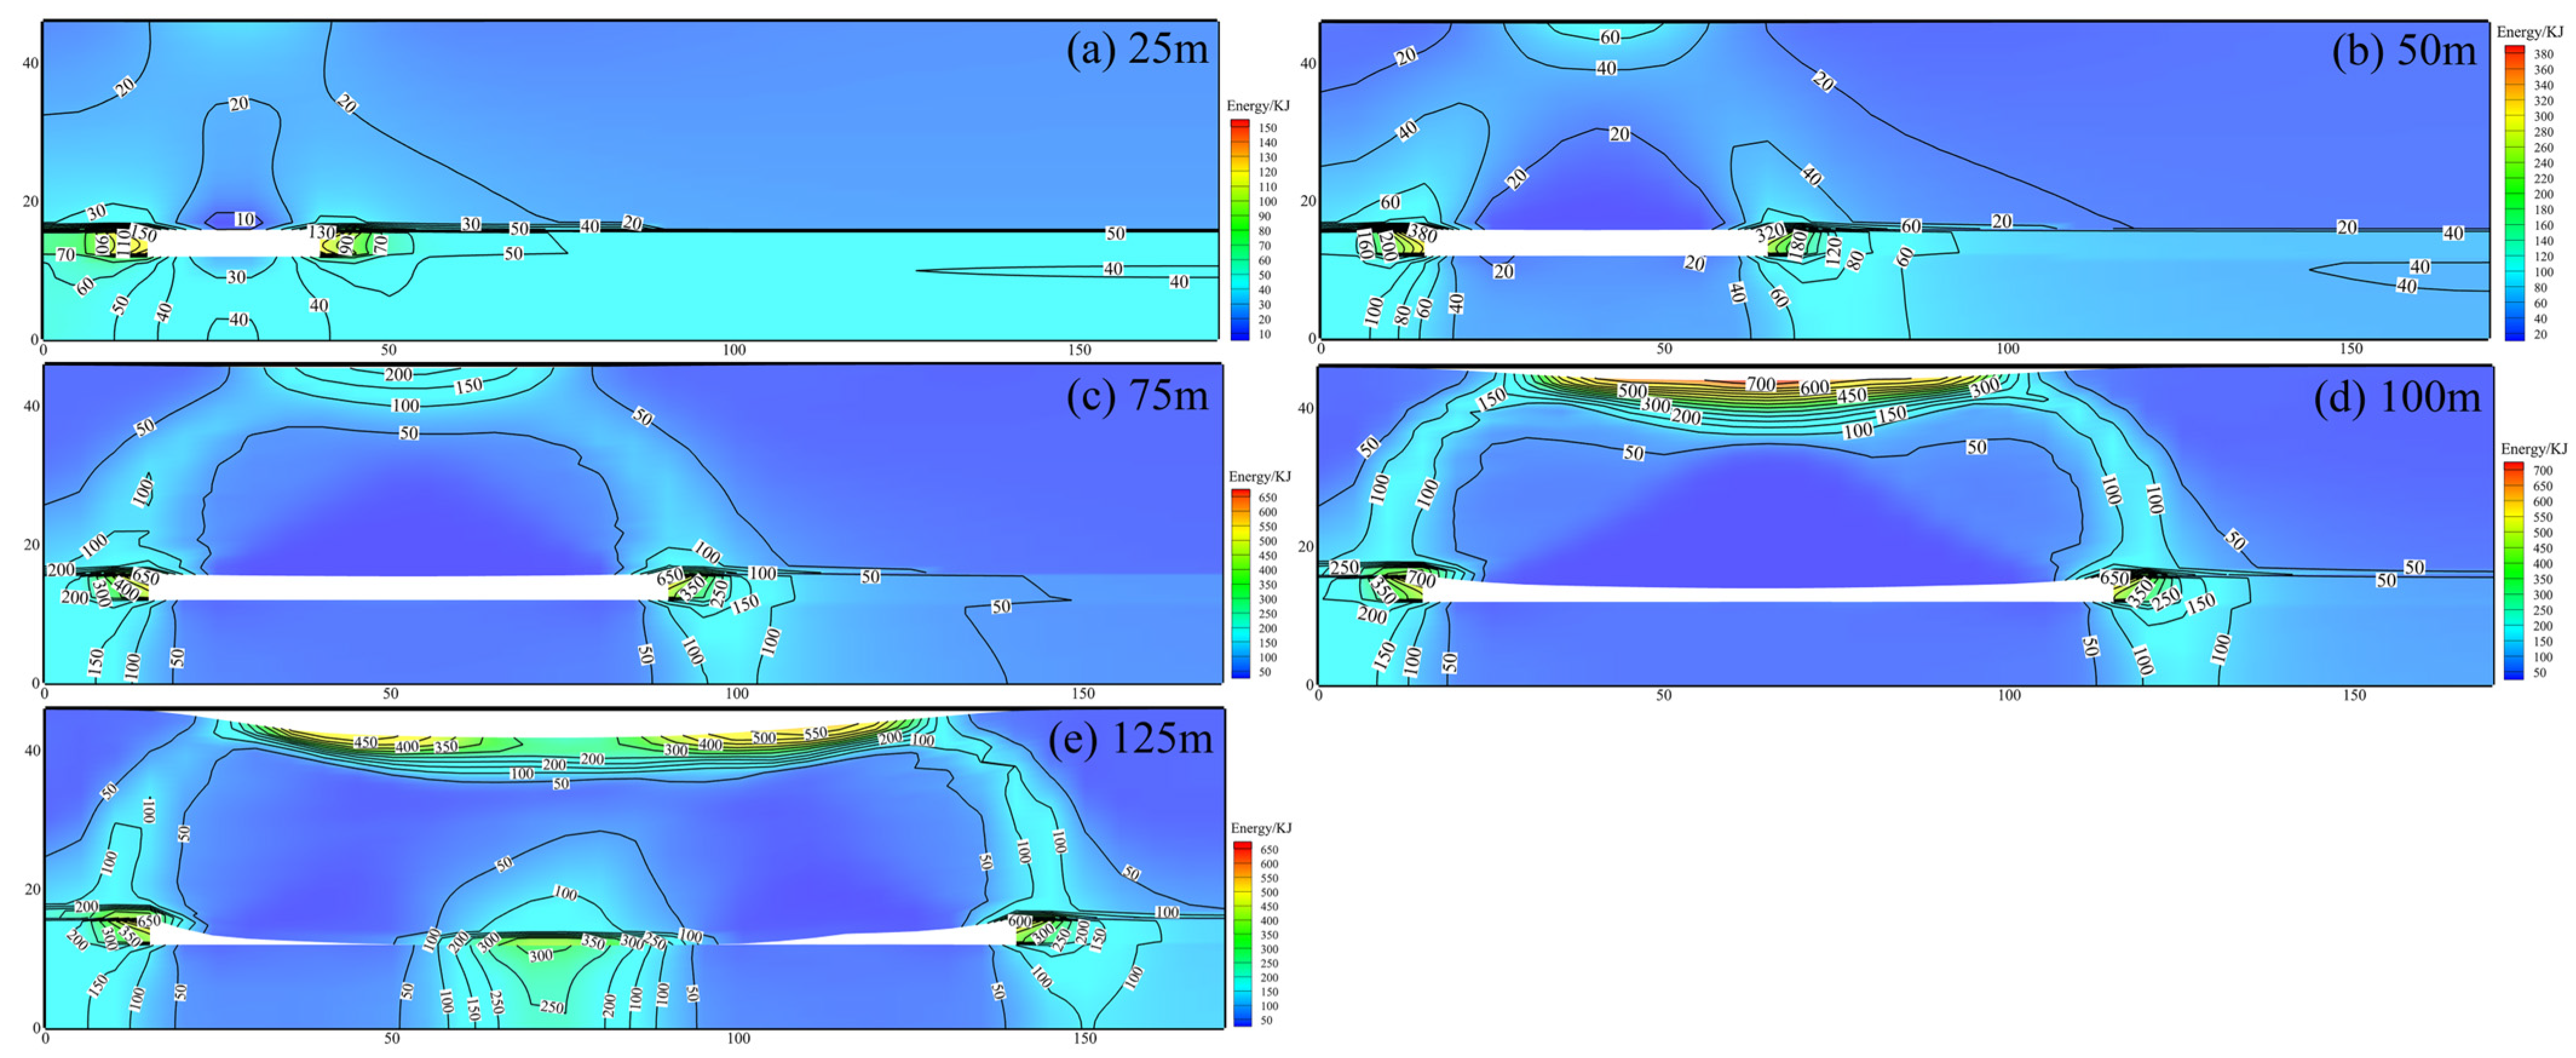
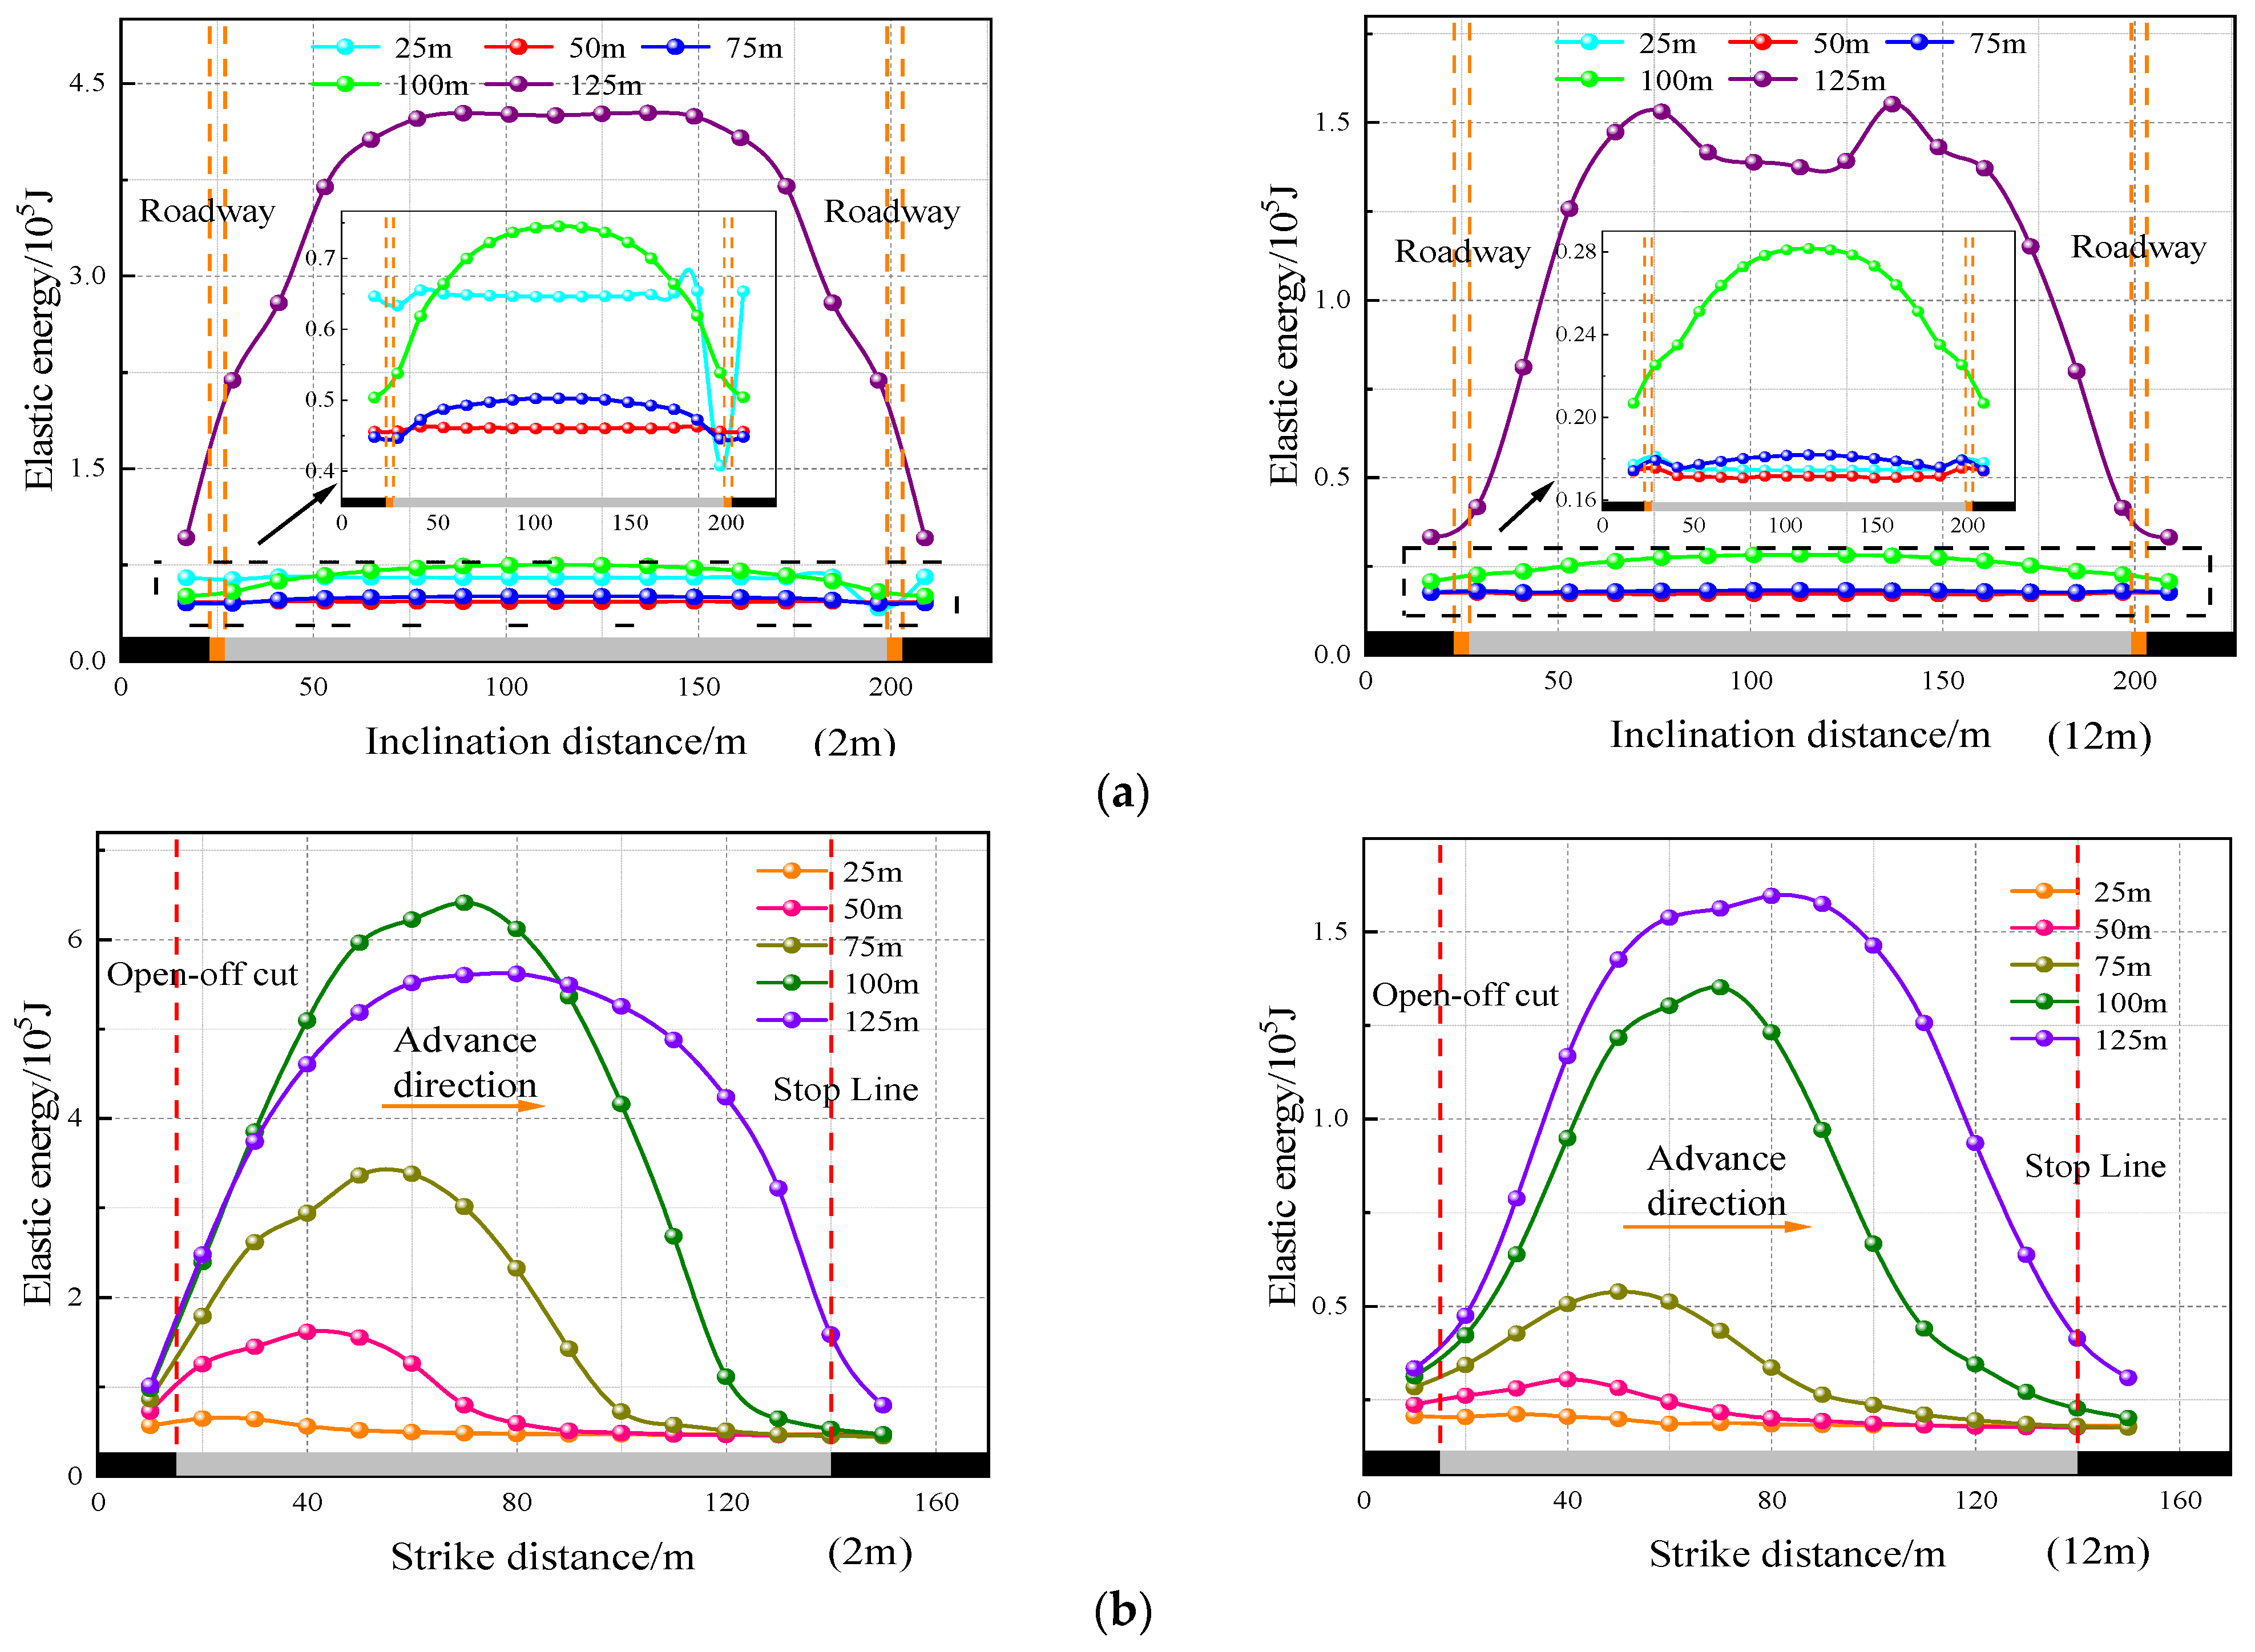
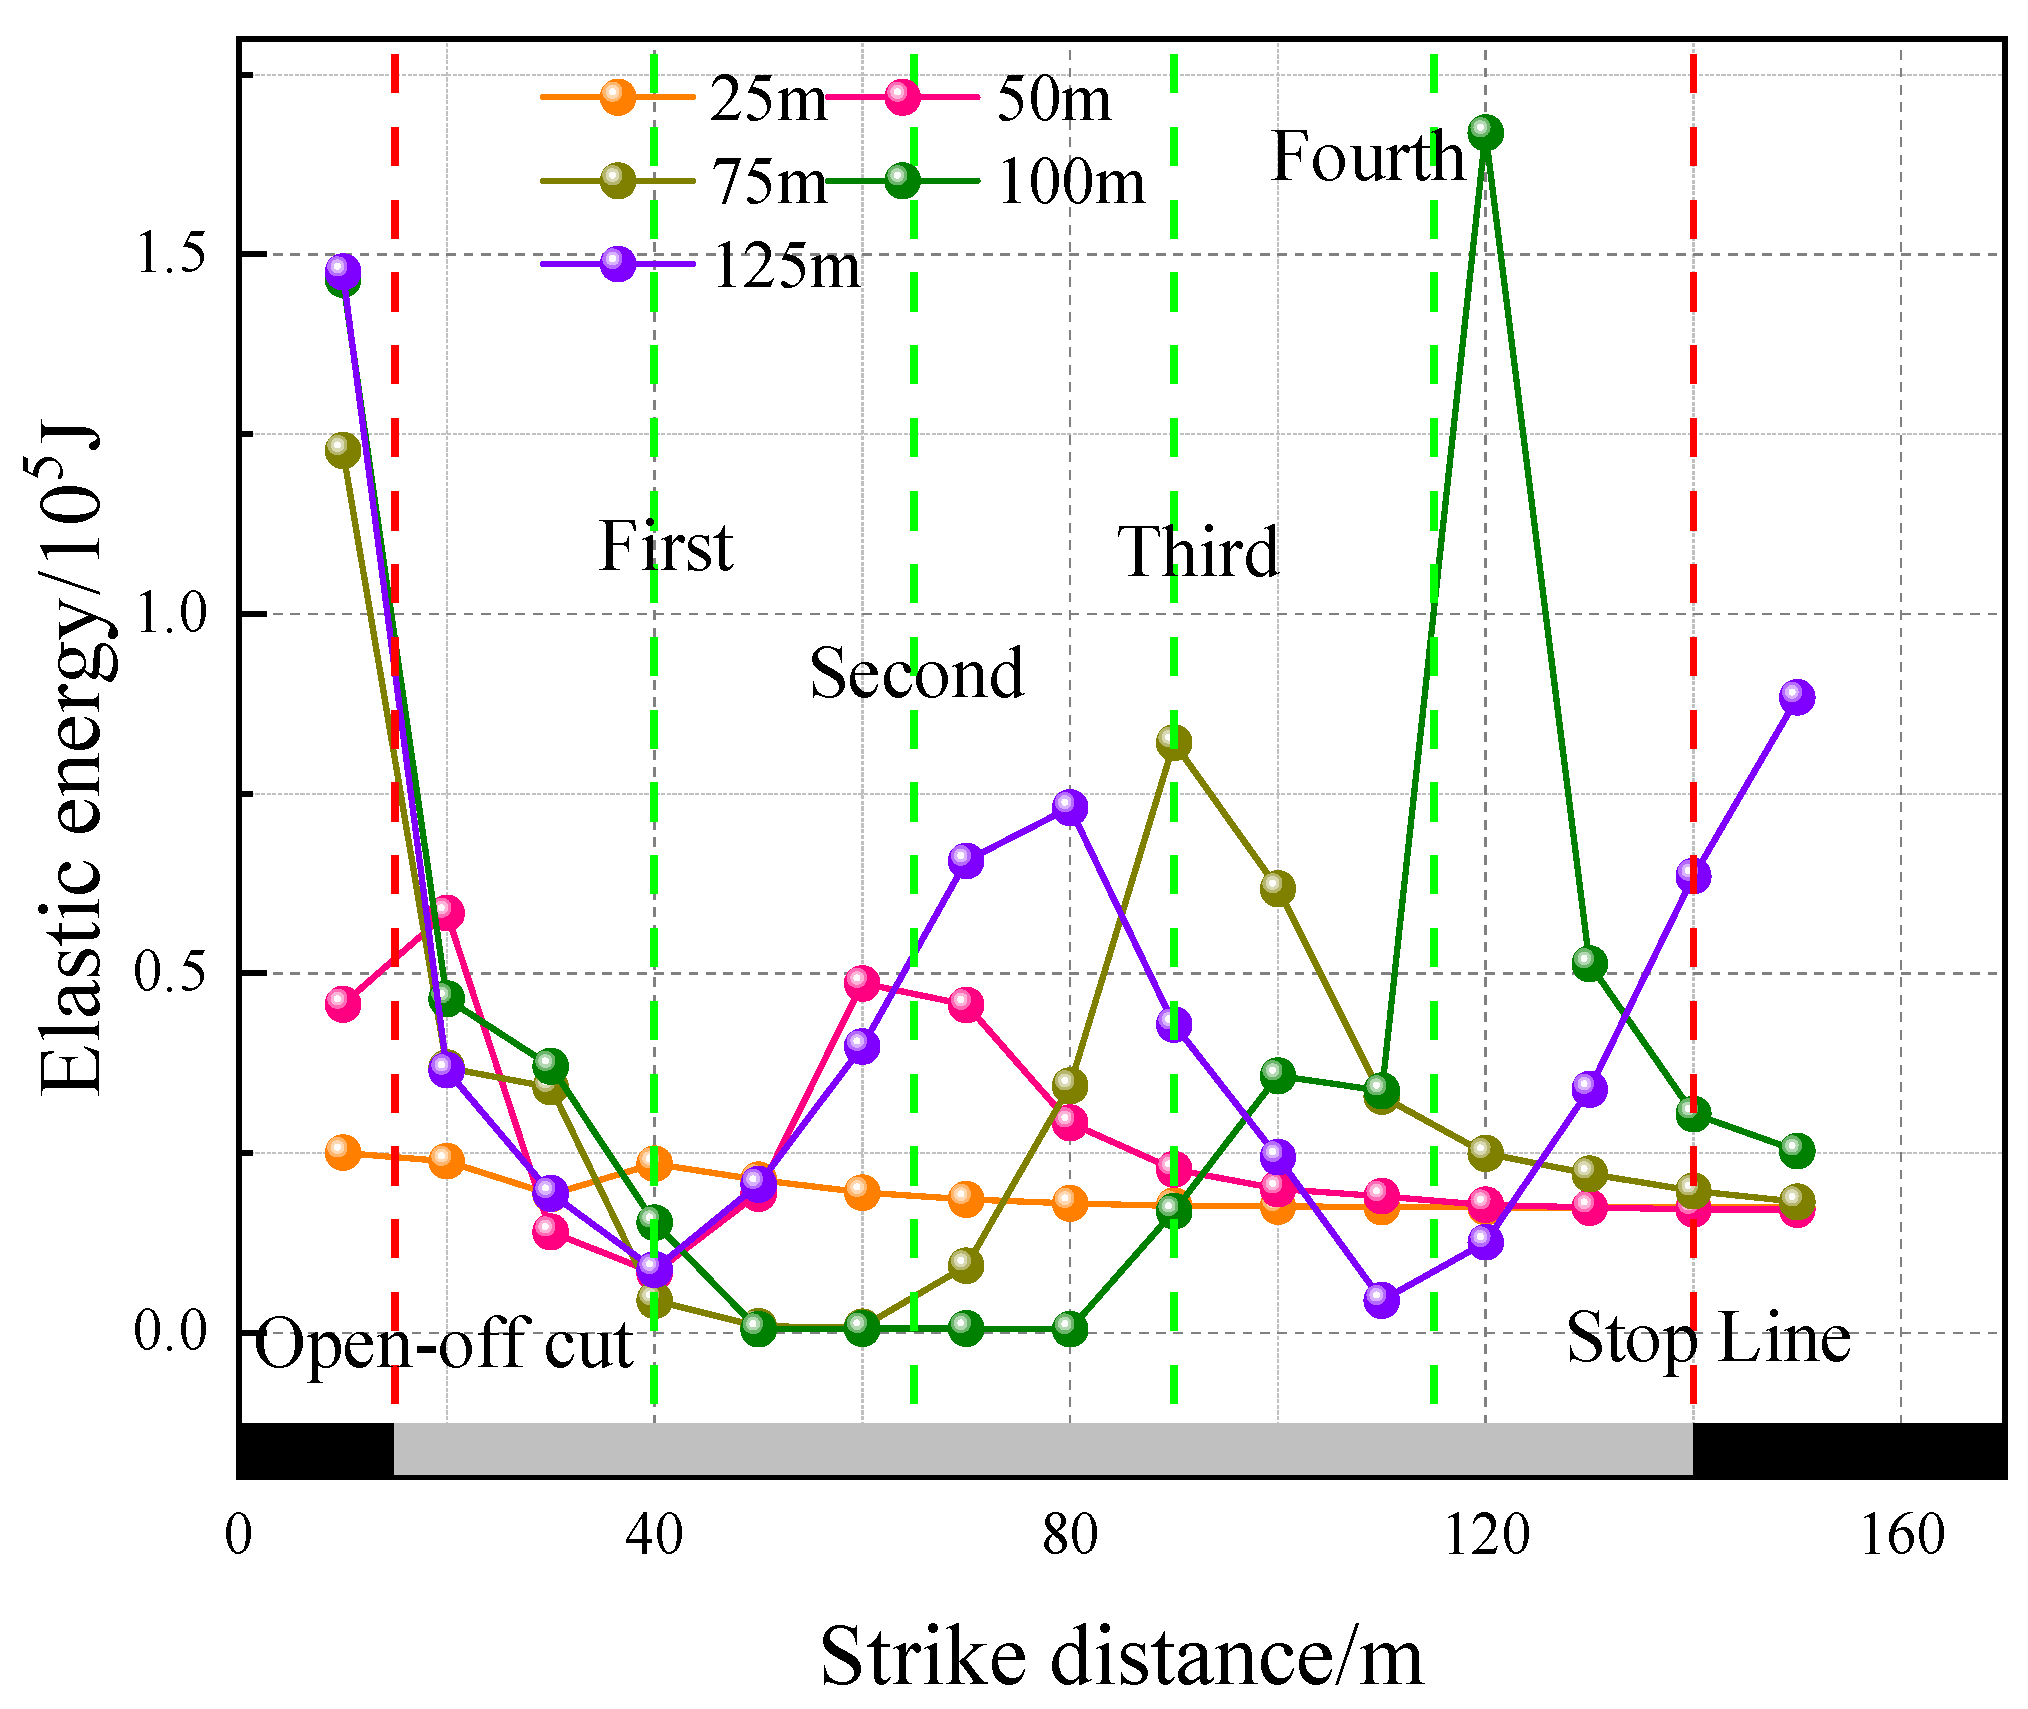
3.3. Dynamic Evolution Law of Energy Fields in Coal Seams and Overlying Strata

The primary energy source for the rock burst is the elastic strain energy that accumulates in the surrounding rock; the roof layer has a tendency to form a suspended roof structure when disturbed by coal seams, accumulating a large amount of energy. When the disturbance of the coal seam exceeds the bearing capacity of the roof, the suspended roof structure may be damaged, releasing accumulated elastic energy and causing safety production accidents [35]. Thus, during deep coal seam mining, it is essential to investigate the distribution features of elastic strain energy in coal seams and roofs. According to the generalized Hooke’s law, under spatial stress conditions, stress and strain satisfy the following relationship:
ε 1 = σ 1 ν ( σ 2 + σ 3 ) / E ε 2 = σ 2 ν ( σ 1 + σ 3 ) / E ε 3 = σ 3 ν ( σ 1 + σ 2 ) / E
In Formula (3), σ 1 , σ 2 , and σ 3 are the principal stresses in three directions; ε 1 , ε 2 , and ε 3 correspond to the principal strains in three directions; E is the elastic modulus of the coal rock mass; and ν is the Poisson’s ratio of the coal rock mass.
The elastic strain energy formula of coal rock mass under spatial stress conditions is derived from the following formula:
U 0 = 1 2 ( σ 1 ε 1 + σ 2 ε 2 + σ 3 ε 3 )
By substituting Formula (3) into Formula (4), the elastic strain energy for each unit volume of coal rock material under triaxial stress can be obtained [36]:
U 0 = 1 2 E σ 1 2 + σ 2 2 + σ 3 2 2 v σ 1 σ 2 + σ 2 σ 3 + σ 1 σ 3
According to Formula (5), there is a significant correlation between the stress environment around the coal rock mass and the accumulated elastic strain energy. Based on the Mohr–Coulomb criterion, the “stress-energy” characteristics of the coal rock mass are obtained; the FLAC3D simulation program’s fish language coding yields the elastic energy distribution cloud map. During the mining operation, the coal seam and overlying strata energy field distribution characteristics parallel to the coal seam direction and the coal seam and overlaying strata energy field parallel to the working face’s advancing direction are acquired.
The energy field spread among the overlying strata parallel to the advancing direction of the coal seam is presented in Figure 11 and the energy field distribution of the coal seam and overlying strata parallel to the advancing direction of the face of operation is displayed in Figure 12.
Figure 11 shows that following coal seam mining, the overlying stratum’s elastic performance is mostly concentrated in the overlying strata behind the working face and on either side of a roadway. As the distance of coal seam mining increases, the energy peak shifts from both sides of the roadway in both frontal and backward directions of the mining face and the maximum energy increases from 25.3 KJ to 191 KJ. This is due to the fact that the roof’s suspended area keeps growing as the working face is mined. Due to the difficulty of damaging the roof, energy dissipation and transfer are difficult, leading to the roof’s ongoing accumulation of elastic energy. Ultimately, this leads to the higher elastic energy of the coal pillars on both edges of the roadway behind the mining face than behind it. As shown in Figure 12, the top and bottom rock strata have less elastic energy than the coal seam. This is due to the fact that self-weight, which causes deformation and accumulates a significant amount of elastic energy, is one of the key variables influencing the elastic deformation inside the coal rock mass. In addition, due to the relatively soft nature of coal, it undergoes significant elastic deformation under external forces, leading to a comparatively large amount of elastic energy being stored. Stress concentration happens in the range of the support pressure in front of the working face during the coal seam mining procedure, leading to energy reaching its peak. The degree of energy and stress concentration decreases with increasing distance from the coal wall of the working face. After mining the coal seam for 75 m, the elastic energy is connected to the upper part and distributed in an arch shape. When 100 m of the coal seam has been mined, the elastic energy in the stress concentration area reaches its maximum value of 700 KJ. Once 125 m of the coal seam has been mined, due to the collapse of the roof, the degree of stress concentration decreases and the elastic energy decreases to 650 KJ. In the pressed region in the center of the goaf, some of the elastic performance accumulates, with a maximum value of 350 KJ.
Figure 13 displays the distribution of elastic energy curves during the working face’s mining duration at various distances from the coal seam bottom. Figure 13a shows that the working face is comparatively minimally affected by the first four mining rounds, with little difference. During the fifth round of mining, mining disrupts the working face and accumulates a significant quantity of energy. The rate of energy growth for the two coal pillars grows steadily throughout the first four rounds of energy recovery, as Figure 13b illustrates. The elastic energy during the fifth round of recovery is slightly lower than that during the fourth round. This is due to the collapse phenomenon that occurs when the recovery reaches 125 m; the accumulated elastic energy is released as a result. It is evident that there is a tendency of, first, growing and, then, reducing in the elastic energy growth rate of the two roof areas. The maximum value of elastic energy in the mining face continuously moves forward. Additionally, the center of the goaf is where the largest value is found. Overall, the rock layer’s gathered elastic energy is enhanced with proximity to the coal seam bottom.
Figure 14 depicts the elastic performance curve of the overlaying strata that are situated in the center of the goaf and 12 m from the coal seam’s bottom. As seen in Figure 14, as long as the working face is continuously mined, the elastic energy stored in the goaf’s overlying strata progressively rises. The stress reduction zone is where the center of the goaf is situated so the energy accumulated in the strata is the lowest. With the increasing mining distance of the working face, the impact range of rock elastic energy caused by mining gradually expands. During the entire mining process, two peak points can be observed. One is situated behind the goaf in the rock layers of the protective coal pillar and its peak value rises as the working face’s mining distance increases. The second one is situated in the strata above the coal wall of the working face and when the working face’s mining distance increases, its peak point continually advances. Upon mining the working face to an extent of 25 m, the elastic performance of the overlying strata in the goaf decreases slightly and there is a modest increase in the elastic performance of the overlying strata on the working face’s coal wall while keeping the original elastic energy away from the working face rock layer. Once the 50 m working face has been mined, the elastic energy of the goaf rock layer continues to decrease and the peak elastic energy continues to increase. Once the 75 m working face has been mined, the elastic energy of the goaf rock layer further decreases, with a minimum value close to 0 and a significant increase in peak elastic energy. The peak elastic energy of the rock layer at the coal wall moves towards the front of the working face as soon as the working face is mined for 100 m and the range of the elastic energy drop in the goaf is further expanded. At this point, the accumulated elastic energy of the rock layer is the highest, reaching 166.95 KJ. The roof collapses and a significant quantity of elastic energy is released from the rock layer above when the working face is mined down to 125 m. The bottom plate is in touch with the upper strata at the center of the goaf, forming support and accumulating elastic energy. The overlying strata’s elastic energy at the mining line’s protective coal pillar has not risen in comparison to the fourth mining period.

3.4. Evolution Law of Plastic Zones in Overlying Strata

Figure 15 illustrates the distribution of plastic zones in the coal seam and overlying strata parallel to the working face’s advancement direction throughout the mining process.
The plastic zone of the top plate is always greater than that of the bottom plate, as seen in Figure 15, and its range constantly increases as the working face’s mining distance increases. In the early stage of mining, tensile failure is the primary cause of failure in the plastic zone. Once the 50 m working face has been mined, the overlying strata are within the strength range so only a small portion of the damaged area appears. The plastic zone displays features of being high on both sides and low in the middle when the working face is mined down to a length of 75 m. The top plate’s plastic zone takes on the appearance of a “saddle” after the working face is mined down to 100 m. At this point, mainly, tensile failure affects the bottom plate while the roof rock layer exhibits a large-scale tensile failure area. This is a result of the goaf having a sizable portion of the suspended roof structure. The upper layer of rock and the roof rock layer are too heavy for the roof to support, leading to collapse and significant settlement. Following 125 m of mining on the working face, shear failure still dominates directly above the goaf and there is tensile failure in the rock layers that are in touch with the bottom plate. Overall, the bottom plate is mainly subjected to tensile failure while the top plate is mainly subjected to shear failure.

4. Discussion

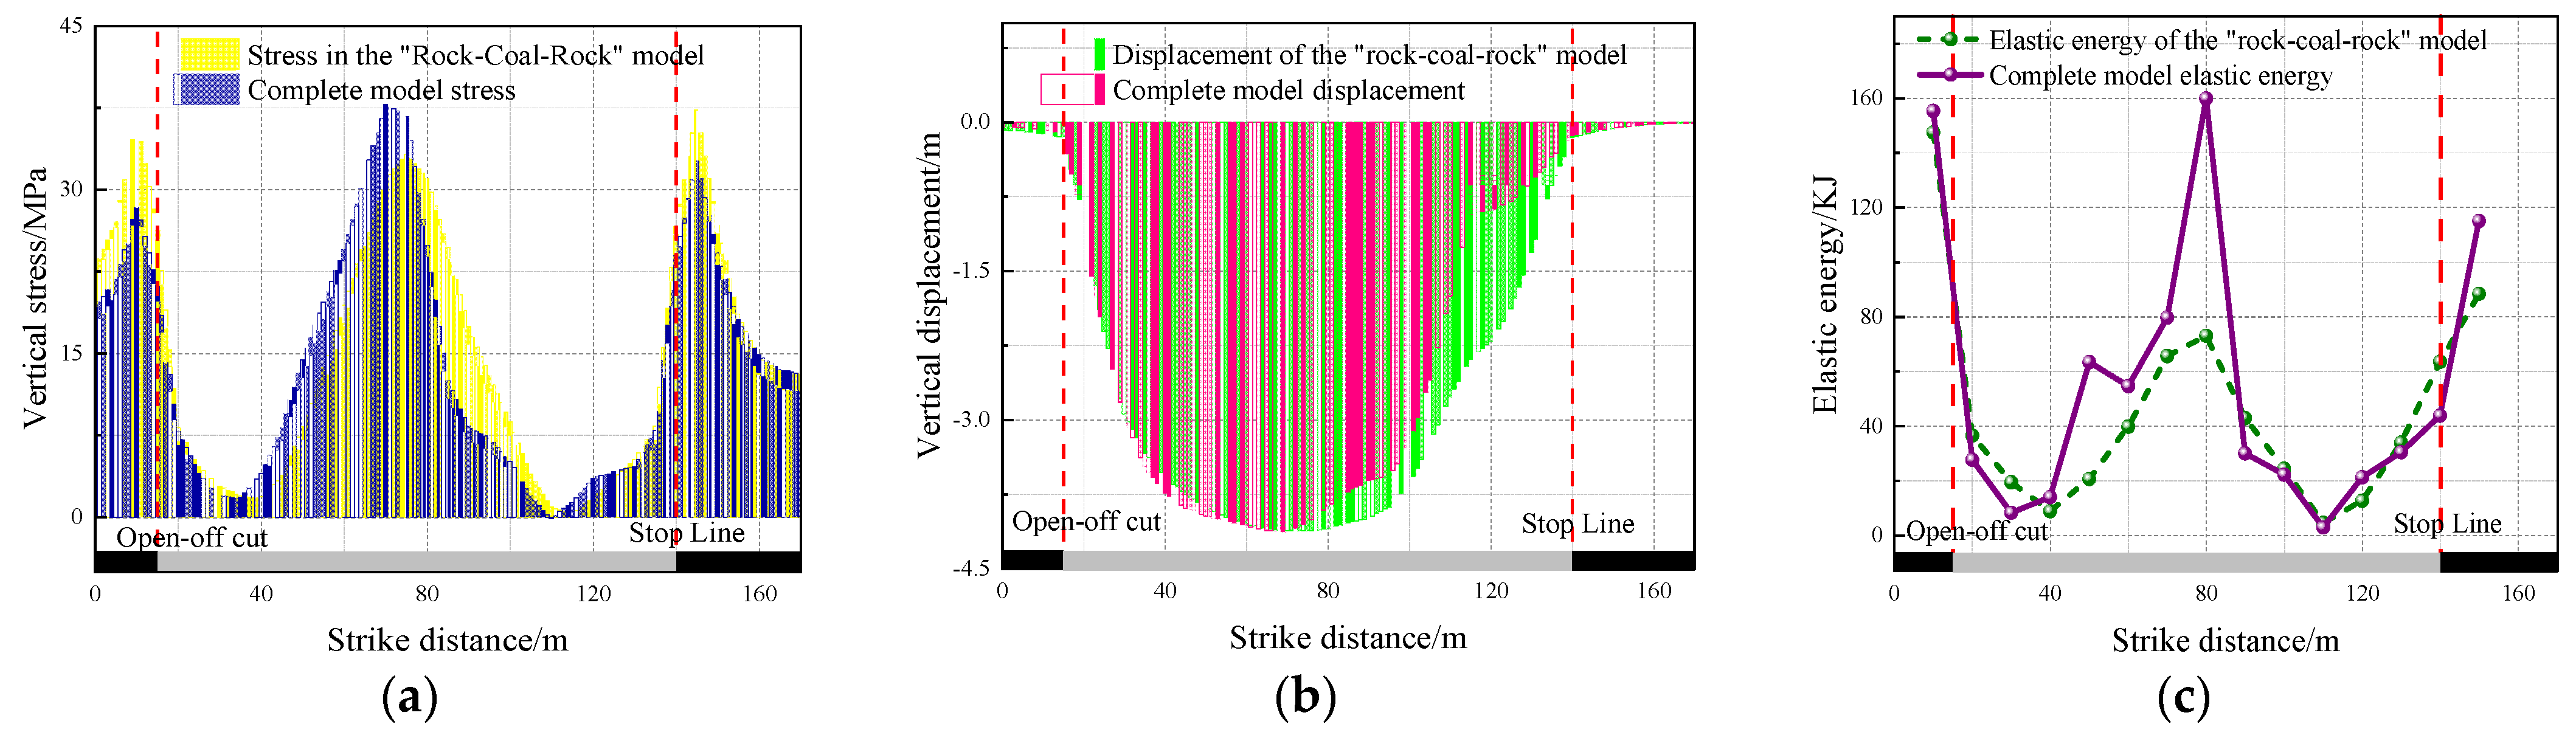
4.1. Comparative Analysis between the “Rock-Coal-Rock” Model and the Complete Model

The use of the “rock-coal-rock” model can improve work efficiency, and more accurately and intuitively reflect moving rules of the overlying strata while mining; however, there are still certain differences from the actual geological situation. Therefore, a complete numerical model was established to compare with the “rock-coal-rock” model. Table 2 displays the mechanical parameters utilized in the model based on the geological data of mining. Figure 16 compares the stress, displacement, and elastic energy of the overlaying strata between the “rock-coal-rock” model and the complete model at a position of 12 m from the bottom of the coal seam in the center of the goaf.
Figure 16 shows that the trend of the stress, displacement, and elastic energy curves is similar; however, there are also some differences. From Figure 16a, support pressure before and after the “rock-coal-rock” model is evidently higher than that before and after the complete model; however, the stress at the collapse point in the middle of the goaf is lower than that of the complete model. From Figure 16b, it is capable of being noticed that the maximum displacement of the “rock-coal-rock” model is basically the same as that of the complete model. The form of the curve is essentially the same in front of the coal wall of the working face and in the center rear of the goaf; however, there are certain differences in the curve at other positions. From Figure 16c, it has been discovered that the elastic energy of the complete model is almost entirely greater than that of the “rock-coal-rock” model, especially at the collapse center, with significant differences. Due to the simplification of the model, these results are inevitable. The simplification of the overlying strata into one stratum leads to an increase in its hardness. Due to the larger suspended roof area during coal seam mining, the front and rear support pressures are greater than those of the complete model; whereas, at the center of the goaf, the stress of the rock layer above is lower. At the same time, resulting from the circumstance that the overlying strata of the complete model have softer coal seams compared to the “rock-coal-rock” model, they undergo significant elastic deformation under force, store higher elastic energy, and have a higher energy density than the “rock-coal-rock” model. However, some of the overlying strata on the complete model are relatively soft and may have collapsed during the fourth mining period. The interior of the goaf at the center of the collapse is filled, accumulating a certain amount of elastic performance energy. During the fifth mining period, the compressed region keeps its elastic energy stored. Consequently, compared to the elastic energy of the “rock-coal-rock” model, the elastic energy of the complete model at the collapse center is significantly higher.
The gradual maturity and improvement of numerical simulation software have greatly improved the efficiency of solving engineering geological problems. The use of the “rock-coal-rock” model can further improve efficiency; however, more in-depth research should be conducted on the selection criteria of rock parameters to further reduce errors with the complete model. Meanwhile, due to insufficient computer performance and insufficient height of overlying strata, further improvements are needed in the future for this simulation.
The variation features of the advanced support pressure, depicted in Figure 6 in Section 3.1, demonstrate that the pressure carried by the rock layer increases quickly within 30 m in front of the coal wall, particularly approximately 5 m in front of the coal wall. The support pressure reaches a peak level of 39.28 MPa, shaping a stress concentration zone. Thus, the pressure increase zone is the 0–30 m region in front of the work face and the original rock stress zone is the 30 m area outside of the front of the work face. The pressure supported by the coal seam behind the working face rapidly decreases due to the mining of coal resources, which causes the pressure carried by the roof to lose its point of support. In some places, it even falls to 0 MPa, creating a distinct zone of pressure relief. The advance support pressure law of the overlying rock is consistent with the trend of the overlying rock support pressure curve in the literature [37,38]. At the same time, the stress, displacement, and energy curves of the overlaying rock layer at a distance of 12 m from the bottom of the coal seam in the center of the goaf generated by the two ways are essentially identical when comparing the simulation outcomes of the “rock-coal-rock” model with the complete model. Based on this, it can be considered that the simulation results of the “rock coal rock” model are reliable.
Therefore, the train of thought of the “rock-coal-rock” model proposed in this study is valid and its findings may serve as information for the secure mining of deep coal seams and the simplification of engineering models.

4.2. Multi-Physical Field Characteristics under Deep Coal Seam Mining

As the mining of the working face goes on, the stress and elastic energy of the overlying strata have the same trend. Once mining has reached an extent of 25 m on the working face, because of the impact of mining, the stress distribution of the overlying strata is reorganized, creating a front and rear support pressure zone. The center of the goaf forms a relief from the pressure zone, where the displacement is the largest. After 50 m of mining on the working face, the stress concentration around the goaf increases over time, accumulating an enormous quantity of elastic energy. The subsidence of the top plate increases and the bottom plate produces a bulge. Tensile failure is the primary characteristic of the plastic zone. After mining the working face to an overall length of 75 m, the concentration of the overlying strata stress and the area affected by unloading further expand, the displacement of the roof continues to increase, and the roof’s elastic energy spreads above, creating a distribution that resembles the “arch”. The plastic zone shows a characteristic of being high, medium, and low on both sides. As soon as the working face is 100 m mined, the roof undergoes significant subsidence and the working face’s stress concentration reaches its maximum, accumulating a large amount of elastic energy. The roof’s plastic zone has a “saddle”-shaped appearance. Following 125 m of mining on the working face, the roof rock layer collapses and the subsidence reaches its maximum value. In the center of the goaf, there is a stress recovery zone that lessens the degree of unloading. The interior of the goaf at the center of the collapse is filled to support the weight of the overlying strata and store a certain amount of elastic energy. The bottom plate is mainly damaged by tension and the top plate is mainly damaged by shear stress.

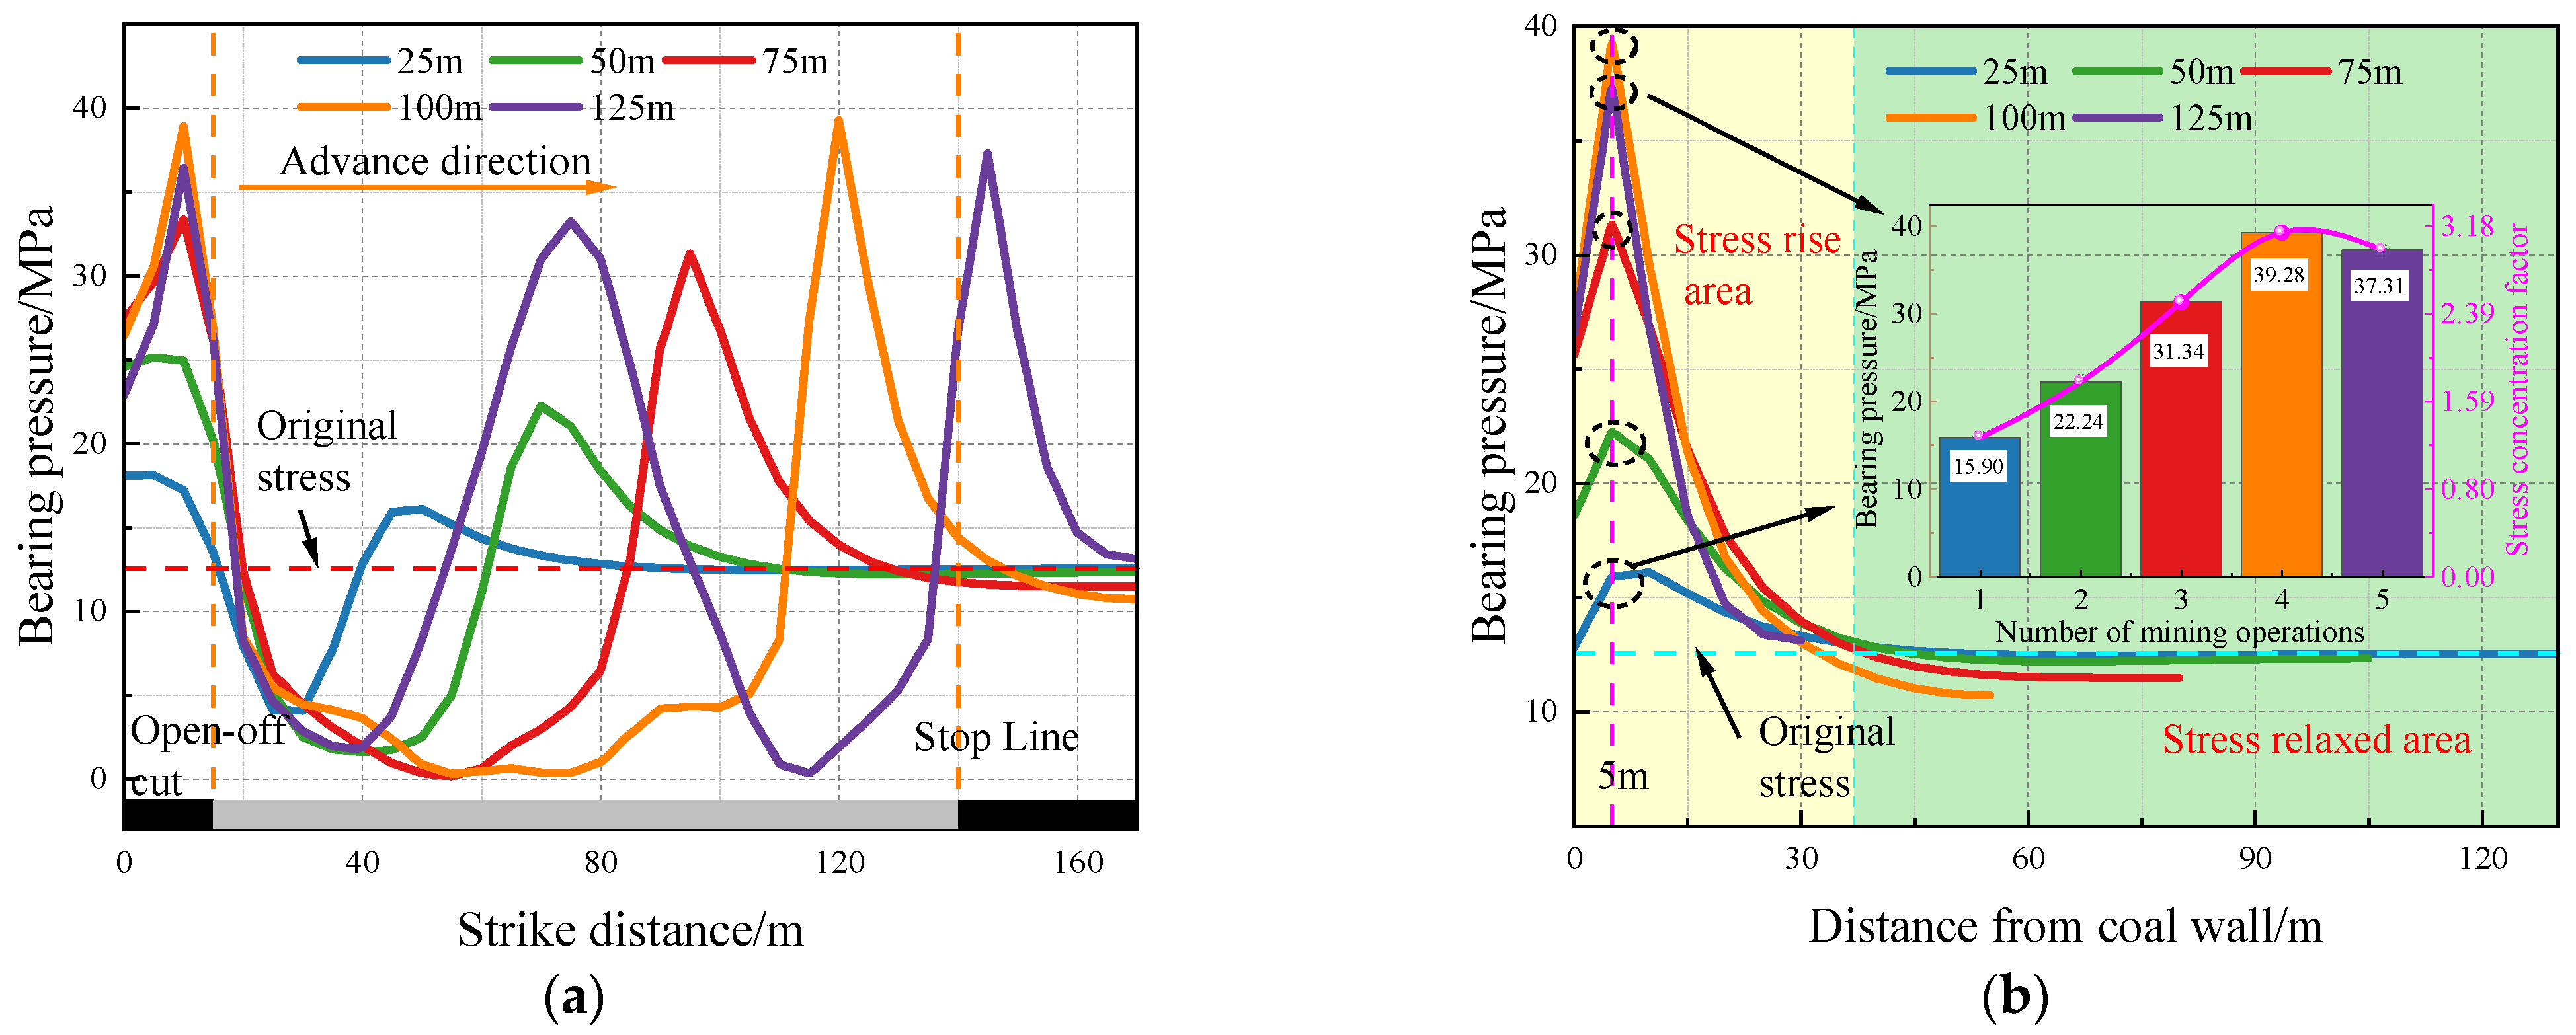
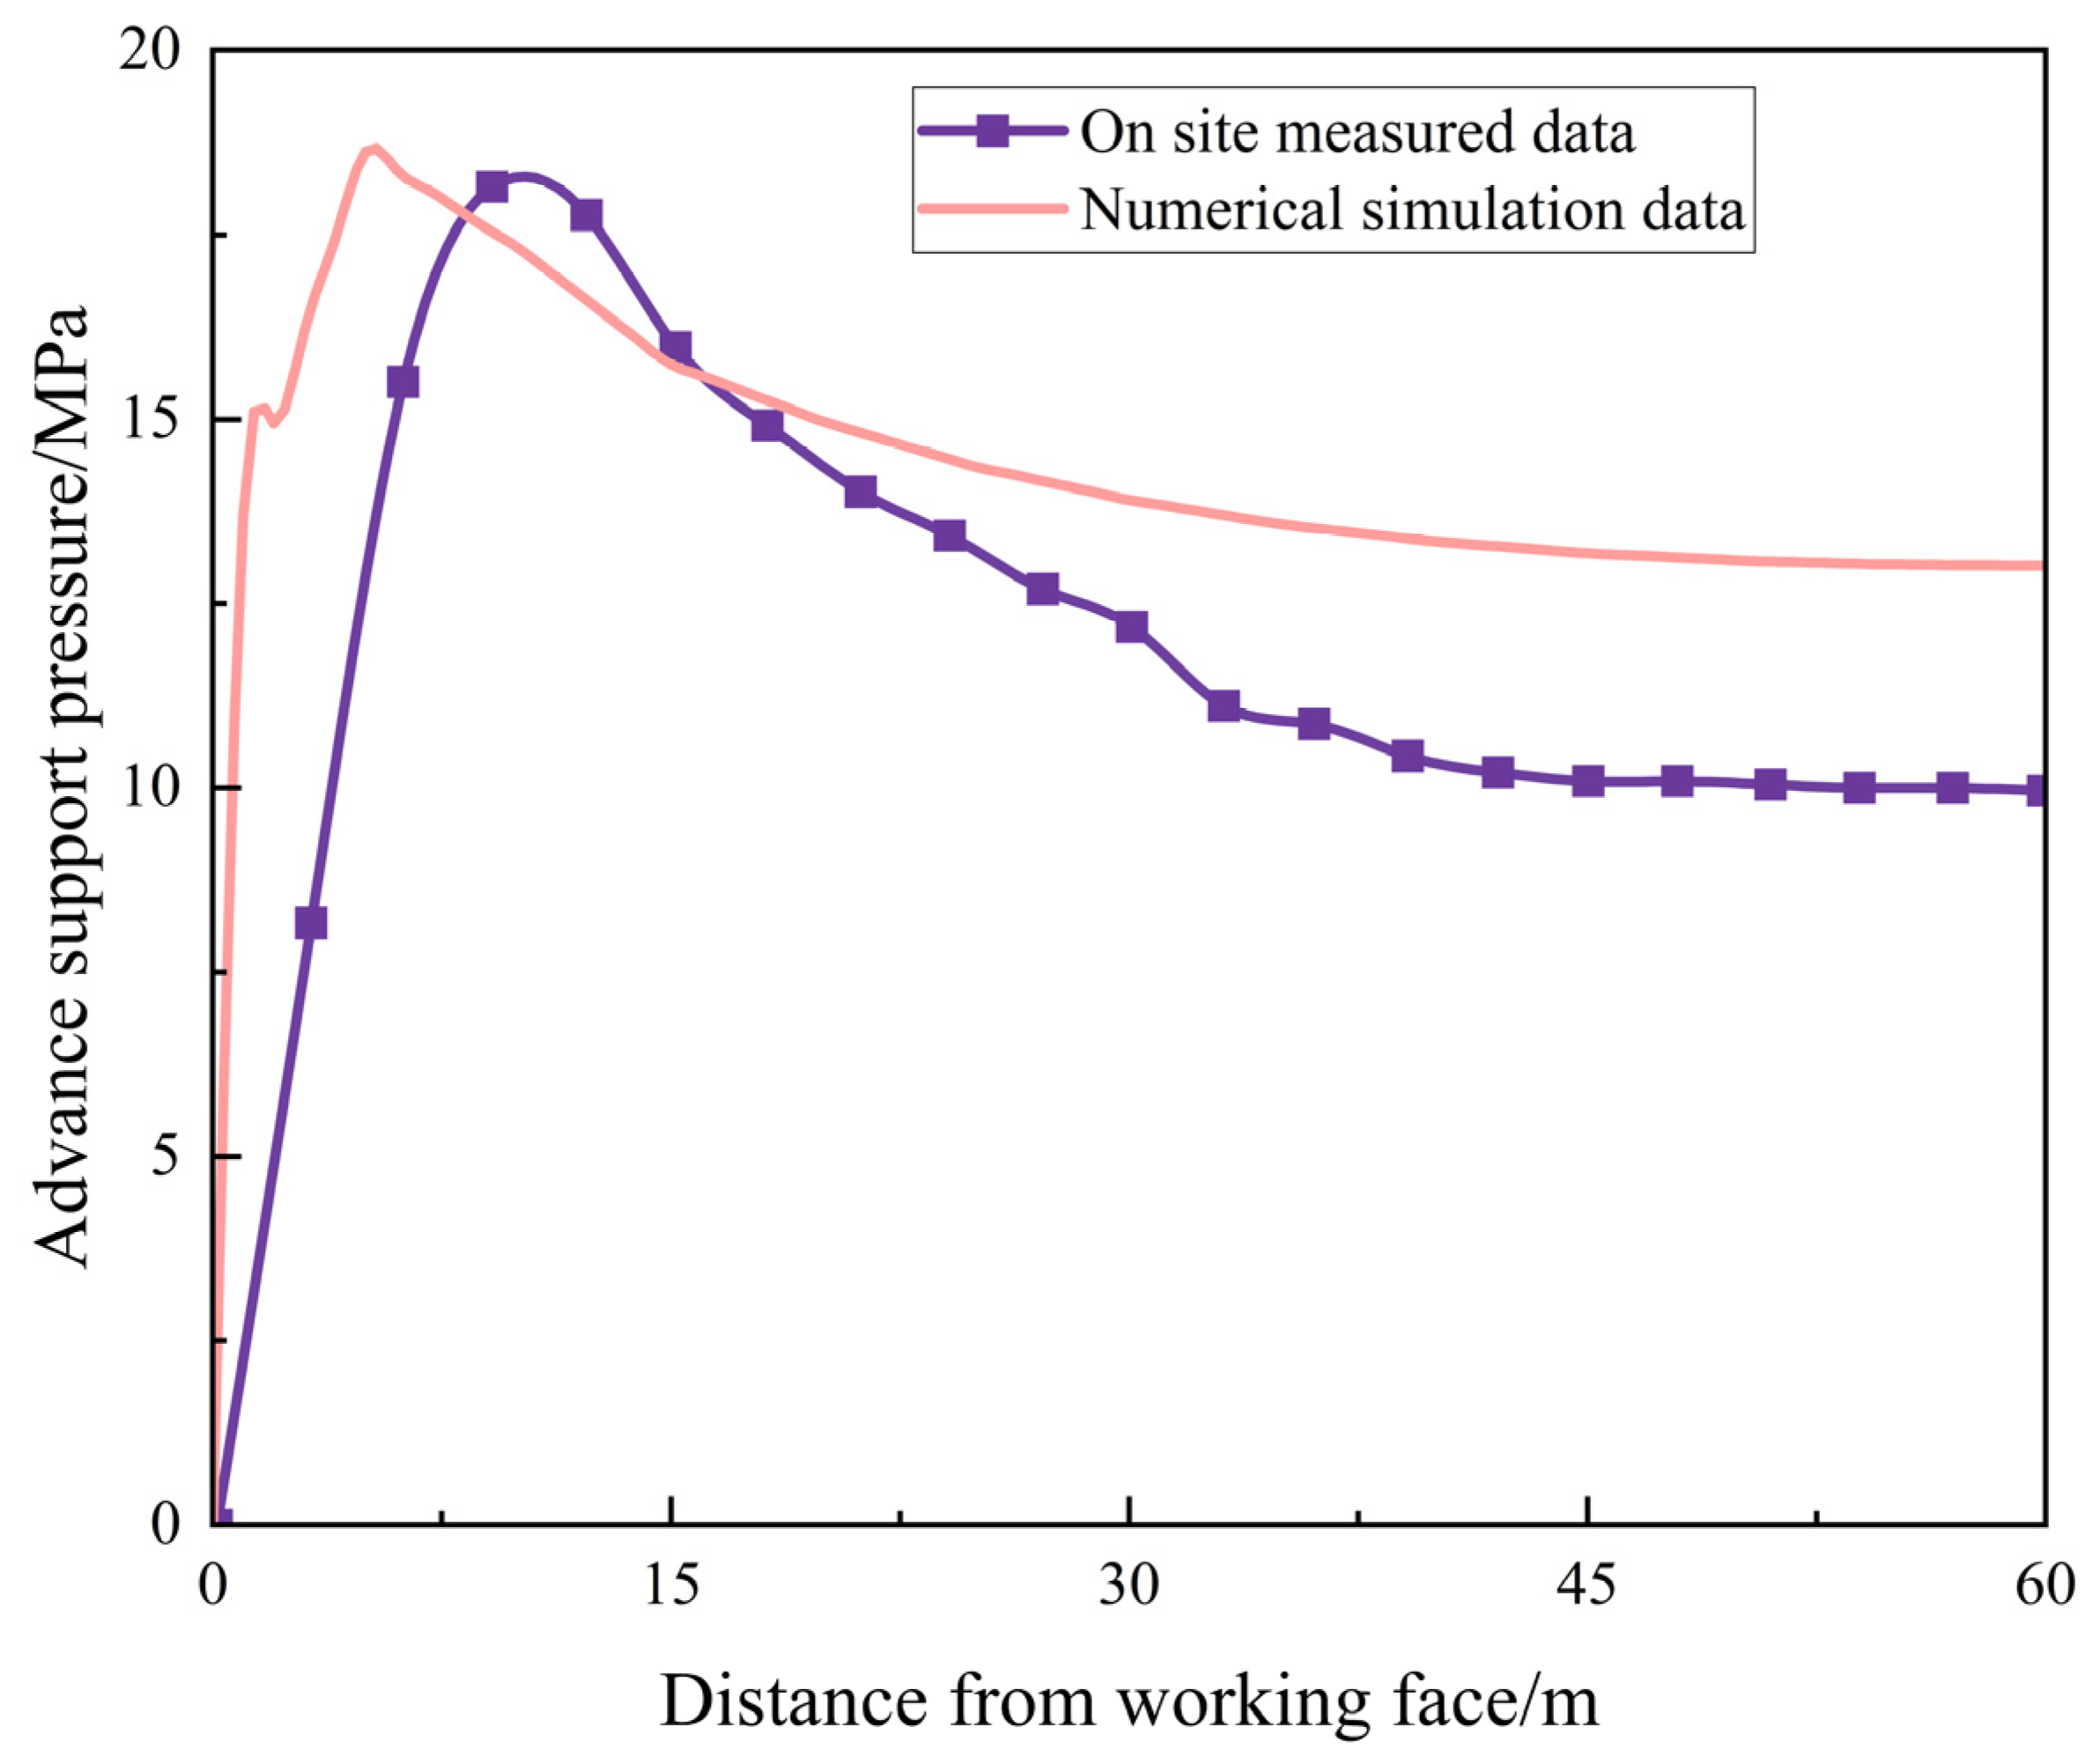
4.3. On-Site Advanced Support Pressure Observation

An advanced support pressure of a certain working face is observed in detail using a mine pressure observation station that was set up there in order to confirm the model’s accuracy. This working face is located in the middle section of Hedong Coalfield in western Shanxi Province. The elevation of the working face bottom plate is 430–570 m and the ground elevation is 840–966 m. The variation range of the coal seam thickness is 1.5–4.2 m. The observation location is situated on the side of the coal wall in the intake airflow roadway, 80 m away from the open-off cut, and a 6 m deep hole has been drilled on the side of the coal wall. Within the hole, a borehole stress gauge has also been fitted. Figure 17 depicts the borehole stress gauge’s layout.
Because the borehole stress gauge was not in close touch with the hole wall during its initial installation, the stress gauge’s initial value is only 0 MPa. The coal within the drill wall, however, starts to progressively shatter and collapse as the work goes on, filling the whole borehole area. As a result, the borehole stress gauge comes into total contact with the coal on the working face and starts to display readings. It is feasible to analyze the variations in stress gauge readings as the working face progresses by watching and recording the borehole stress gauge readings inside the measuring station and the distance data from the working face. That is, the extent to which the stress gauges at various locations are affected by the advanced support pressure. The same graph, as seen in Figure 18, plots these data together with the numerical simulation results, only the data at 60 m from the working face where the reading appears is recorded.
As the working face moves to a point about 40 m from the borehole stress gauge location, Figure 18 demonstrates that the borehole stress gauge measurement starts to shift. The drilling stress gauge reading increases significantly when the working face moves to a point approximately 30 m from the drilling stress gauge location. This suggests that the advanced support pressure’s influence range on the working face is roughly 30 m. About 9 m from the working face, at 18.1 MPa, is the highest point of the advanced support pressure. The trend seen in the numerical simulation findings has similarities to the advanced support pressure curve observed on-site. The numerical simulation indicates that the advanced support pressure’s effect range on the working face is approximately 35 m and that the pressure’s peak is located around 5 m from the working face, approximately 18.6 MPa. It is obvious that this approach has a good application effect in real-world on-site settings.

5. Conclusions

Based on the “rock-coal-rock” model, the deep coal seam mining process was studied through numerical simulation. In the course of mining the working face, the dynamic development that occurs in the stress field, displacement field, energy field, and plastic zone of the coal seam and the overlying strata was analyzed. The trend of the results of this model is similar to that of a complete numerical model. The following are the primary conclusions:
(1)
By means of numerical modeling, the multi-physical field properties under conditions of deep coal seam mining were acquired. Following coal seam mining, an advanced support pressure develops in front of the working face. This pressure reaches its peak around 5 m in front of the coal wall, where it reaches 39.28 MPa. From 1.28 to 3.13, the stress concentration coefficient rises and then falls to 2.97. In the center of the goaf, there is a pressure relief zone where some places have a minimum pressure of 0 MPa. Overall, the pressure relief zone evolves from a rectangle to an outward square and to a circular distribution. The deformation and failure of rock layers form a fracture field around the goaf and the range of the fracture field increases with the increase in goaf distance. After the coal seam is fully mined, the roof collapses and the floor bulges. The maximum settlement value is 4 m, situated in the middle of the goaf, and the settlement gradually reduces from the center to the surrounding region;
(2)
Depending on the Mohr–Coulomb criterion, the “stress energy” characteristics of the coal rock body were obtained. The degree of stress concentration drops and the maximal elastic energy drops from 700 KJ to 650 KJ when the roof collapses. Part of the elastic performance accumulates in the compacted area in the middle of the goaf, with a maximum value of 350 KJ. The elastic energy curve of the overlaying rock in the center of the goaf has two peak points during the course of the coal seam mining era. The peak point of the protective coal pillar after the goaf rises with the length of the goaf distance, from 25.1 KJ to 147.6 KJ. As the goaf distance increases, the peak point on the working face’s coal wall continues to advance;
(3)
The results of the “rock-coal-rock” model were validated by constructing a complete numerical model. The results indicate that the stress curve, displacement curve, and elastic energy curve trends of the two models are basically consistent. Finally, the on-site measured advanced support pressure was compared with the numerical simulation results and the effect was good. Therefore, the train of thought of the “rock-coal-rock” model proposed in this study is valid.

Author Contributions

Writing-original draft preparation, F.D. and L.D.; methodology, F.D., Y.Z., L.D., W.C. and B.W.; validation, F.D., Y.Z., L.D., W.C., B.W. and J.S.; formal analysis, L.D. and B.W.; investigation, L.D., W.C. and Y.Z.; resources, F.D.; data curation, L.D. and W.C.; Conceptualization, Y.Z., L.D., W.C., B.W. and J.S.; writing—review and editing, L.D.; visualization, Y.Z. and W.C.; supervision, L.D.; funding acquisition, F.D. and L.D. All authors have read and agreed to the published version of the manuscript.

Funding

This research was funded by the National Natural Science Foundation of China (No. 52374249, 52274246), the National Key R&D Program Projects (2023YFC3009003), the Key Project of Science and Technology Innovation and Entrepreneurship Fund of Tiandi Technology Co., Ltd. (No. 2023-2-TD-ZD001), the Natural Science Foundation of Chongqing (No. CSTB2022NSCQ-MSX1080), the Open Research Fund of State Key Laboratory of Gas Disaster Detecting, Preventing and Emergency Controlling (No. 2022SKLKF11), and the Fundamental Research Funds for the Central Universities (2024JCCXAQ01).

Data Availability Statement

All data and/or models used in this study appear in the submitted article.

Conflicts of Interest

The authors declare no conflicts of interest.

References

  1. Xie, H.; Li, C.; He, Z.; Li, C.; Lu, Y.; Zhang, R.; Gao, M.; Gao, F. Experimental study on rock mechanical behavior retaining the in situ geological conditions at different depths. Int. J. Rock Mech. Min. Sci. Géoméch. Abstr. 2021, 138, 104548. [Google Scholar] [CrossRef]
  2. Höök, M.; Zittel, W.; Schindler, J.; Aleklett, K. Global coal production outlooks based on a logistic model. Fuel 2010, 89, 3546–3558. [Google Scholar] [CrossRef]
  3. Das, A.J.; Mandal, P.K.; Ghosh, N.; Singh, A.P.; Kumar, R.; Tewari, S.; Bhattacharjee, R. Evaluation of energy accumulation, strain burst potential and stability of rock mass during underground extraction of a highly stressed coal seam under massive strata-a field study. Eng. Geol. 2023, 322, 107178. [Google Scholar] [CrossRef]
  4. Ranjith, P.; Zhao, J.; Ju, M.; De Silva, R.V.; Rathnaweera, T.; Bandara, A.K. Opportunities and Challenges in Deep Mining: A Brief Review. Engineering 2017, 3, 546–551. [Google Scholar] [CrossRef]
  5. Khan, M.; He, X.Q.; Guo, J.; Song, D.Z. Accurate prediction of indicators for engineering failures in complex mining environ-ments. Eng. Fail. Anal. 2024, 155, 107736. [Google Scholar] [CrossRef]
  6. Driad-Lebeau, L.; Lahaie, F.; Al Heib, M.; Josien, J.; Bigarré, P.; Noirel, J. Seismic and geotechnical investigations following a rockburst in a complex French mining district. Int. J. Coal Geol. 2005, 64, 66–78. [Google Scholar] [CrossRef]
  7. Du, F.; Wang, K.; Zhang, X.; Xin, C.P.; Shu, L.Y.; Wang, G.D. Experimental Study of Coal–Gas Outburst: Insights from Coal–Rock Structure, Gas Pressure and Adsorptivity. Nat. Resour. Res. 2020, 29, 2481–2493. [Google Scholar] [CrossRef]
  8. Du, F.; Ma, J.; Guo, X.; Wang, T.; Dong, X.; Li, J.; He, S.; Nuerjuma, D. Rockburst mechanism and the law of energy accumulation and release in mining roadway: A case study. Int. J. Coal Sci. Technol. 2022, 9, 6. [Google Scholar] [CrossRef]
  9. Jiránková, E.; Petroš, V.; Šancer, J. Assessment of stress around mine workings at the time of rockburst occurrence. Géoméch. Geoengin. 2013, 8, 297–303. [Google Scholar] [CrossRef]
  10. Yuan, L. Research progress of mining response and disaster prevention and control in deep coal mines. J. China Coal Soc. 2021, 46, 716–725. [Google Scholar]
  11. Rajwa, S.; Janoszek, T.; Prusek, S. Model tests of the effect of active roof support on the working stability of a longwall. Comput. Geotech. 2020, 118, 103302. [Google Scholar] [CrossRef]
  12. Li, Y.; Ren, Y.; Peng, S.S.; Cheng, H.; Wang, N.; Luo, J. Measurement of overburden failure zones in close-multiple coal seams mining. Int. J. Min. Sci. Technol. 2021, 31, 43–50. [Google Scholar] [CrossRef]
  13. Iwanec, A.S.; Carter, J.; Hambleton, J. Geomechanics of subsidence above single and multi-seam coal mining. J. Rock Mech. Geotech. Eng. 2016, 8, 304–313. [Google Scholar] [CrossRef]
  14. Zhang, L.; Li, Y.; Tu, S.H.; Tu, H.S.; Li, W.L. Evolution mechanism and control technology of mining-induced stress in the bifurcation and merging area of deep coal seam. J. Min. Saf. Eng. 2022, 39, 702–710. [Google Scholar]
  15. Bu, Q.W.; Tu, M.; Zhang, X.Y.; Yuan, B.Q.; Zhao, Q.C.; Dang, J.X. Study on fracture instability and energy accumulation-release evolution of thick-hard roof in stope. J. Min. Saf. Eng. 2022, 39, 867–878. [Google Scholar]
  16. Zhao, S.K.; Qi, Q.X.; Li, Y.P.; Deng, Z.G.; Li, Y.Z.; Su, Z.G. Theory and practice of rockburst stress control technology in deep coal mine. J. China Coal Soc. 2020, 45, 626–636. [Google Scholar]
  17. Suchowerska, A.; Merifield, R.; Carter, J. Vertical stress changes in multi-seam mining under supercritical longwall panels. Int. J. Rock Mech. Min. Sci. Géoméch. Abstr. 2013, 61, 306–320. [Google Scholar] [CrossRef]
  18. Xie, H.; Gao, M.; Zhang, R.; Peng, G.; Wang, W.; Li, A. Study on the Mechanical Properties and Mechanical Response of Coal Mining at 1000 m or Deeper. Rock Mech. Rock Eng. 2019, 52, 1475–1490. [Google Scholar] [CrossRef]
  19. Yin, D.W.; Chen, S.J.; Chen, B.; Liu, X.Q.; Ma, H.F. Strength and failure characteristics of the rock-coal combined body with single joint in coal. Geomech. Eng. 2018, 15, 1113–1124. [Google Scholar]
  20. Li, S.W.; Gao, M.Z.; Yang, X.J.; Zhang, R.; Li, R.; Zhang, Z.P.; Li, G.; Zhang, Z.T.; Xie, J. Numerical simulation of spatial dis-tributions of mining-induced stress and fracture fields for three coal mining layouts. J. Rock Mech. Geotech. Eng. 2018, 10, 907–913. [Google Scholar] [CrossRef]
  21. Das, A.J.; Mandal, P.K.; Prakash, A.; Roy, L.B.; Tewari, S. Underground extraction methodology of contiguous coal seams ensuring the safety of the parting and the surface structures. Saf. Sci. 2020, 121, 215–230. [Google Scholar] [CrossRef]
  22. Chen, S.J.; Qu, X.; Yin, D.W.; Liu, X.Q.; Ma, H.F. Investigation lateral deformation and failure characteristics of strip coal pillar in deep mining. Geomech. Eng. 2018, 14, 421–428. [Google Scholar]
  23. Ning, J.; Wang, J.; Tan, Y.; Zhang, L.; Bu, T. In situ investigations into mining-induced overburden failures in close multiple-seam longwall mining: A case study. Géoméch. Eng. 2017, 12, 657–673. [Google Scholar] [CrossRef]
  24. Xiao, Z.; Gu, S.; Zhang, Y.; Wang, H. A coal seam-roof-floor coupling destressing control method of fault coal bursts induced by deep coal seam mining. Energy Sci. Eng. 2022, 10, 2170–2190. [Google Scholar] [CrossRef]
  25. Jia, C.Y.; Wang, H.L.; Sun, X.Y.; Yu, X.B.; Luan, H.J. Study on rockburst prevention technology of isolated working face with thick-hard roof. Geomech. Eng. 2020, 20, 447–459. [Google Scholar]
  26. Lu, J.; Jiang, C.; Jin, Z.; Wang, W.; Zhuang, W.; Yu, H. Three-dimensional physical model experiment of mining-induced deformation and failure characteristics of roof and floor in deep underground coal seams. Process. Saf. Environ. Prot. 2021, 150, 400–415. [Google Scholar] [CrossRef]
  27. Zhao, Y.; Lin, B.; Liu, T.; Zheng, Y.; Kong, J.; Li, Q.; Song, H. Mechanism of multifield coupling-induced outburst in mining-disturbed coal seam. Fuel 2020, 272, 117716. [Google Scholar] [CrossRef]
  28. Tuncay, D.; Tulu, I.B.; Klemetti, T. Investigating different methods used for approximating pillar loads in longwall coal mines. Int. J. Min. Sci. Technol. 2021, 31, 23–32. [Google Scholar] [CrossRef]
  29. Unver, B.; Yasitli, N. Modelling of strata movement with a special reference to caving mechanism in thick seam coal mining. Int. J. Coal Geol. 2006, 66, 227–252. [Google Scholar] [CrossRef]
  30. Shang, Y.; Zhang, L.; Kong, D.; Wang, Y.; Cheng, Z. Overlying strata failure mechanism and gas migration law in close distance outburst coal seams: A case study. Eng. Fail. Anal. 2023, 148, 107214. [Google Scholar] [CrossRef]
  31. Jiang, H. Simple three-dimensional Mohr-Coulomb criteria for intact rocks. Int. J. Rock Mech. Min. Sci. Géoméch. Abstr. 2018, 105, 145–159. [Google Scholar] [CrossRef]
  32. Liu, W.; Pang, L.; Xu, B.; Sun, X. Study on overburden failure characteristics in deep thick loose seam and thick coal seam mining. Geomat. Nat. Hazards Risk 2020, 11, 632–653. [Google Scholar] [CrossRef]
  33. Basarir, H.; Oge, I.F.; Aydin, O. Prediction of the stresses around main and tail gates during top coal caving by 3D numerical analysis. Int. J. Rock Mech. Min. Sci. Géoméch. Abstr. 2015, 76, 88–97. [Google Scholar] [CrossRef]
  34. Shi, M.J. Study on Distribution Characteristics and Control of Deviatoric Stress Field in Surrounding Rock of Deep Coal Roadway. Master’s Thesis, Taiyuan University of Technology, Taiyuan, China, 2022. [Google Scholar]
  35. Xie, H.; Li, L.; Peng, R.; Ju, Y. Energy analysis and criteria for structural failure of rocks. J. Rock Mech. Geotech. Eng. 2009, 1, 11–20. [Google Scholar] [CrossRef]
  36. Tu, Q.; Cheng, Y.; Xue, S.; Ren, T.; Cheng, X. Energy-limiting factor for coal and gas outburst occurrence in intact coal seam. Int. J. Min. Sci. Technol. 2021, 31, 729–742. [Google Scholar] [CrossRef]
  37. Gao, R.; Yu, B.; Xia, H.; Duan, H. Reduction of Stress Acting on a Thick, Deep Coal Seam by Protective-Seam Mining. Energies 2017, 10, 1209. [Google Scholar] [CrossRef]
  38. Liu, H.; Huo, T.; Li, Y.; Luo, M.; Zhou, G.; He, Z. Numerical Simulation Study on the Distribution Law of Deviatoric Stress of Floor under the Influence of Mining. Geofluids 2021, 2021, 1–14. [Google Scholar] [CrossRef]
Figure 1. Borehole column chart of the working face.
Processes 12 00726 g001
Figure 2. FLAC3D model diagram: (a) Simulation schematic; (b) Monitoring line layout.
Processes 12 00726 g002
Figure 3. Spatial distribution cloud map of overlying strata stress at a distance of 12 m from the bottom of the coal seam: (a) 25 m; (b) 50 m; (c) 75 m; (d) 100 m; (e) 125 m.
Processes 12 00726 g003
Figure 4. Stress cloud map of coal seam and overlying strata along the advancing direction of the working face: (a) 25 m; (b) 50 m; (c) 75 m; (d) 100 m; (e) 125 m.
Processes 12 00726 g004
Figure 5. At various distances from the coal seam’s bottom, the vertical stress curves of the coal seam and the overlying strata: (a) Inclination distance of 2 m, 12 m; (b) Strike distance of 2 m, 12 m.
Processes 12 00726 g005
Figure 6. Curve of support pressure variation in front of the working face: (a) Strike distance; (b) Distance from coal wall.
Processes 12 00726 g006
Figure 7. Spatial distribution of overlying rock stress at a distance of 12 m from the bottom of the coal seam: (a) 25 m; (b) 50 m; (c) 75 m; (d) 100 m; (e) 125 m.
Processes 12 00726 g007
Figure 8. Cloud map of the coal seam and overlying rock displacement along the advancing direction of the working face: (a) 25 m; (b) 50 m; (c) 75 m; (d) 100 m; (e) 125 m.
Processes 12 00726 g008
Figure 9. Vertical displacement curves of the coal seam and overlying strata at various distances from the bottom underneath the coal seam: (a) Inclination distance of 2 m, 12 m; (b) Strike distance of 2 m, 12 m.
Processes 12 00726 g009
Figure 10. Vertical displacement curve of the overlying strata at a distance of 12 m from the bottom of the coal seam in the middle of the goaf.
Processes 12 00726 g010
Figure 11. Energy distribution of overlying rock at a distance of 12 m from the bottom of the coal seam: (a) 25 m; (b) 50 m; (c) 75 m; (d) 100 m; (e) 125 m.
Processes 12 00726 g011
Figure 12. Elastic energy cloud map of the coal seam and overlying strata along the advancing direction of the working face: (a) 25 m; (b) 50 m; (c) 75 m; (d) 100 m; (e) 125 m.
Processes 12 00726 g012
Figure 13. Elastic energy curve of the coal seam and overburden at various distances from the bottom of the coal seam: (a) Inclination distance of 2 m, 12 m; (b) Strike distance of 2 m, 12 m.
Processes 12 00726 g013
Figure 14. Elastic performance curve of overlying strata at a distance of 12 m from the bottom of the coal seam in the middle of the goaf.
Processes 12 00726 g014
Figure 15. Cloud map of the coal seam and overlying strata plastic zones along the advancing direction of the working face: (a) 25 m; (b) 50 m; (c) 75 m; (d) 100 m; (e) 125 m.
Processes 12 00726 g015
Figure 16. In the center of the goaf, a comparison of the stress, displacement, and energy curves of the overlaying strata at a distance of 12 m from the coal seam’s bottom: (a) Stress; (b) Displacement; (c) Elastic energy.
Processes 12 00726 g016
Figure 17. Layout of borehole stress gauges.
Processes 12 00726 g017
Figure 18. Distribution of advanced support pressure based on field measurement and numerical simulation results.
Processes 12 00726 g018
Table 1. Physical and mechanical parameters of coal rock layers.
Rock StrataThickness/(m)Density/(kg·m−3)Friction Angle/(°)Cohesion/MPaBulk Modulus/GPaShear Modulus/GPaTensile Strength/MPa
Sandstone302500324.65.42.51.70
Coal Seam41500262.52.21.50.65
Mudstone122461283.02.52.00.90
Table 2. Physical and mechanical parameters of coal and rock layers in the complete model.
Rock StrataThickness/
(m)
Density/
(kg·m−3)
Friction
Angle/(°)
Cohesion/
MPa
Bulk Modulus/
GPa
Shear Modulus/
GPa
Tensile
Strength/MPa
Sandy Mudstone112461283.02.52.00.90
Siltstone72500331.24.52.32.00
Sandy Mudstone62461283.02.52.00.90
Medium Grained Sandstone62500324.65.42.51.70
Coal Seam 3#41500262.52.21.50.65
Sandy Mudstone62461283.02.52.00.90
Mudstone62461273.02.52.00.95
Disclaimer/Publisher’s Note: The statements, opinions and data contained in all publications are solely those of the individual author(s) and contributor(s) and not of MDPI and/or the editor(s). MDPI and/or the editor(s) disclaim responsibility for any injury to people or property resulting from any ideas, methods, instructions or products referred to in the content.

