Article

Experimental Investigation into the Process of Hydraulic Fracture Propagation and the Response of Acoustic Emissions in Fracture–Cavity Carbonate Reservoirs

1
State Key Laboratory of Coal Mine Disaster Dynamics and Control, Chongqing University, Chongqing 400044, China
2
Department of Civil and Environmental Engineering, University of Alberta, Edmonton, AB T6G 1H9, Canada
3
State Key Laboratory of Geomechanics and Geotechnical Engineering, Institute of Rock and Soil Mechanics, Chinese Academy of Sciences, Wuhan 430071, China
4
Shale Gas Research Institute of PetroChina Southwest Oil & Gas Field Company, Chengdu 610051, China
*
Author to whom correspondence should be addressed.
Processes 2024, 12(4), 660; https://doi.org/10.3390/pr12040660
Submission received: 25 February 2024 / Revised: 21 March 2024 / Accepted: 23 March 2024 / Published: 26 March 2024

Abstract

:
Fracture–cavity carbonate reservoirs account for a considerable proportion of oil and gas resources. Because of the complicated relationships between cavities, fractures and pores in these reservoirs, which are defined as cavity clusters, fracturing technology is employed to enhance their hydrocarbon productivity. However, almost all previous studies have just considered the effect of a single natural cavity or fracture on the propagation of a hydraulic fracture; therefore, the mechanism by which a hydraulic fracture interacts with a cavity cluster needs to be clarified. In this study, cavity clusters with different distributions were accurately prefabricated in synthetically made samples, and large-scale simulation equipment was employed to systematically perform fracturing experiments considering different horizontal differential stress levels. Meanwhile, the hydraulic fracture propagation behaviors were comprehensively analyzed through fracture morphology, fracturing curves, the complexity of the fracture network and acoustic emission monitoring. It was found that a natural fracture with a smaller approach angle is favorable in guiding a hydraulic fracture to a cavity. The fracturing curves were divided into the following four types: frequent fluctuations with “step-like” shapes, great fluctuations with slightly lower closure pressure, fluctuations with obviously lower closure pressure, and little fluctuations with obviously lower closure pressure. And different cavity cluster distributions play a dominant role in the complexity of generated hydraulic fracture networks. In addition, AE energy was used to judge the ease of crossing the cavity. The above findings indicated that for the actual exploration and exploitation of carbonate reservoirs, the geological exploration of different fracture–cavity structures in reservoirs would be required, and targeted fracturing engineering designs need to be carried out for different fracture–cavity carbonate reservoirs.

1. Introduction

Carbonate reservoirs account for a considerable proportion of all proven oil and gas resource reserves in the world (40% of the remaining gas and 60% of the remaining oil reserves) [1,2]. However, dissolution fractures, karst caves and dissolution pores dominate the storage space in carbonate reservoirs [3]. The distribution of a typical fracture–cavity carbonate reservoir is shown in Figure 1. Due to the random combination of and the complicated relationships between cavities, fractures and pores in this type of reservoir and because a carbonate reservoir has significant heterogeneity [4,5], fracturing techniques have to be employed to enhance its hydrocarbon productivity [6].
Completely different from conventional reservoirs, hydraulic fracture (HF) propagation is significantly impacted by natural fractures (NFs), natural caves (NCs) and faults in the exploitation of fracture–cavity carbonate reservoirs [7,8]. Revealing and understanding this impact is considerable for the fracturing scheme design and the improvement in hydrocarbon recovery. Limited by experimental conditions and theoretical methods, studying the interaction between hydraulic fractures and complicated fracture–cavity structures is highly challenging. The current research mainly focuses on HF-NF interaction HF-NC interaction.
1. HF-NF interaction. Among the most popular approaches is numerical simulation. Corresponding methods primarily involve the classical finite element method [9], the displacement discontinuity method [10,11], the extended finite element method [12,13] and the discrete element method [14,15]. Meanwhile, many studies have been carried out on HF-NF interaction based on physical simulation experiments and analytical methods. Blanton [16] and Warpinski et al. [17] successively carried out classic experimental studies and summarized the possible occurrences of hydraulic fractures encountering natural fractures into three types: crossing, arresting and opening. Renshaw et al. [18] and Gu et al. [19], respectively, established criteria for judging under what circumstances HFs could cross NFs on the basis of the stresses near a fracture tip in linear elastic fracture mechanics. In addition, test experiments for analyzing HF-NF interaction have also been extensively studied, including semi-circular bending (SCB) [20,21], central straight notched Brazilian discs (CSNBDs) [22] and Brazilian tests [23].
2. HF-NC interaction. Some numerical simulation methods on HF-NC interaction have been built, including the linear elastic finite element model [24], the extended finite element method [25,26], and the phase field method [27]. Meanwhile, some studies have been carried out in physical simulation experiments and analytical methods. Liu et al. [8] firstly concluded there were three types of interactions between HF and NC (crossing, arresting and bypassing) in their study using fracturing simulation experiments. Yu [28] pointed out that different stress differences could cause hydraulic fractures to bypass or cross through a cavity by calculating the stress analytical solution of a 2D cavity. And the stress intensity factors (SIFs) of an HF tip close to a natural cavity were, respectively, calculated and analyzed by using complex variable analytic function theory [29] and the superposition principle [30]. In addition, some test methods, including dynamic photo-elasticity [31,32] and electron microscopy [33], have been used to analyze crack–void interaction.
In summary, almost all previous studies have just considered the effect of a single NC or a single NF on hydraulic fracture propagation. However, in fracture–cavity carbonate reservoirs, the NCs are often connected to each other by NFs in many cases, forming what are known as cavity clusters [34]. Compared with a single NC, NFs connected to a cavity can greatly alleviate the stress concentration around the NC, thus facilitating the connection between HFs and NCs [34]. Compared with a single NF, when an HF enters a low-internal-pressure NC through cavity clusters, the injection pressure in the wellbore will suddenly decrease, the HF propagation process may be interrupted and the difficulty of passing through the cavity clusters will be greatly increased [35]. Cavity clusters would have more complicated interactions with hydraulic fractures: HF-NF interaction is the key to the formation of complicated fracture networks [36,37], while the stress concentration in the vicinity of the NC has a significant effect on HF non-planar propagation [34]. At present, there has been some numerical simulation research into HFs and cavity clusters. Qiao et al. [35] mainly studied the effect of NF strike angle on the connectivity between HF and NCs; Liu et al. [34] considered the surrounding fractured zone of a cavity and studied the influences of in situ stress, fracture inclination and injection rate on HF–cavity cluster interaction. However, these studies cannot provide information about further HF propagation after entering the cavities and need to be validated by corresponding experimental studies. Therefore, it is crucial to conduct an in-depth study of the interaction between HFs and cavity clusters due to its complexity.
Undertaking physical simulation experiments in the laboratory proves to be immensely beneficial for comprehending the influence of diverse parameters on HF propagation. This understanding is pivotal before embarking on costly fracturing operations in the field [38]. In previous study by Yang et al. [39], the precise prefabrication of cavity clusters with varying distributions by using synthetically made samples was achieved, and true-triaxial simulation experiments were systematically conducted, considering two main factors: horizontal differential stress and the approach angle of natural fractures. However, previous investigations mainly focused on propagation path analysis and stimulation effectiveness evaluation; this study will further conduct an in-depth interaction analysis between HFs and cavity clusters by observing the HF propagation process, which includes the fracturing curve characteristics, 3D fracture network complexity, and AE data features. The findings of this study offer dependable guidance for the optimization of hydraulic fracturing design in fracture–cavity carbonate reservoirs.

2. Experimental Materials and Methods

2.1. Material Selection for Sample

Because the outcrop cores of fracture–cavity carbonate rock cannot control the orientation, size and distribution of the cavity clusters, it is necessary to prepare synthetically made samples containing cavity clusters. Mortar has been used in many hydraulic fracturing experiments due to its following advantages: cheapness, availability and ease of shaping to different sizes [40,41]. The 40–80 mesh continuous-graded quartz sand was dry mixed with Portland cement (PC52.5R) at a low speed before mortar preparation [42,43], and the cement mortar was prepared according to JGJ/T70-2009 [44] after water and a certain amount of concrete admixture (polycarboxylate superplasticizer and defoamer) were added to the mixture. In this study, the authors carried out the mechanical strength tests by controlling the mass ratio of cement and quartz sand (as depicted in Table 1) and selected a mortar mix to simulate carbonate rock, which could obtain higher-strength and more homogeneous synthetically made samples. Prior to assessing mechanical strength, the end faces of the samples were accurately cut using automatic feed diamond saws to meet the specific standard outlined in ASTM D4543 [45].

2.2. Scheme Design

The horizontal differential stress and the approach angle of natural fractures are two key factors affecting the fracturing stimulation effect of fracture–cavity carbonate reservoirs [46].
Given the current limited understanding of the HF propagation law in fracture–cavity carbonate reservoirs, it has become essential to streamline the distribution of NFs and NCs in cavity clusters for effective analysis. Considering different approach angles of natural fractures in a cavity cluster, four distribution schemes were selected: single cavity, cavity and fracture (0°), cavity and fracture (30°) and cavity and fracture (45°) (Figure 2).
In addition, the simulation of in situ stress conditions is pivotal in hydraulic fracturing experiments. Considering the limitations of the experimental conditions, the triaxial stress of the simulation experiments was reduced in proportion to the actual in situ stress of the deep carbonate strata in the Shunbei Area of the Tarim Basin (Table 2), and four schemes of horizontal stress difference coefficient Kh were determined: 0.08, 0.22, 0.40 and 0.65.

2.3. Sample Preparation

To accurately prefabricate the NCs and NFs within cavity clusters according to the distribution schemes, the existing mold needed to be improved. The schematic diagram of the improved mold is shown as Figure 3, and sample preparation was carried out on this basis. The detailed preparation procedure is as follows:
  • The simulated NCs’ and NFs’ preparation. Because of the strong sealing properties and being occupied by oil/gas in carbonate reservoirs [47], minute perforations were made at the extremities of the egg, followed by the extraction of egg liquid with a syringe. Subsequently, oil was infused into the eggshell to serve as a reservoir for storage space. And thick plastic plates of fixed size were cut out to mimic the NFs, as depicted in Figure 3a.
  • The fixing of prefabricated cavities and fractures. To avoid interference with prefabricated cavities and fractures during the subsequent pouring and vibration process, it was necessary to fix the prefabricated cavities and fractures in the design position of the sample. As illustrated in Figure 3b, thin wires were threaded through both ends of the prefabricated cavities and fractures and were fixed with fixed sticks and cap screws at the upper and lower ends of the mold. Glass glue was used to seal the drilled holes of eggs.
  • The pouring and vibration of the mortar mix. Cement, quartz sand and water were mixed as the mortar mix according to the proportion. And the mixture was then poured into the mold, and a vibration table was employed to eliminate any air bubbles entrapped within the mixture, as shown in Figure 3c.
  • The prefabrication of the fracturing wellbore. As illustrated in Figure 3d, the wellbore was placed and fixed after placing the cross frame. The round goniometer function of the cross frame could control the direction of directional perforation at the wellbore opening.
  • The demolding and curing of samples. As shown in Figure 3e, the cross frame was removed after 4 h, and the upper surface of the hardened mixture was smoothed to mitigate the stress concentration caused by the subsequent loading. After a curing period of 24 h, the sample was delicately extricated from the mold and submerged in a water bath for 28 days to achieve its ultimate strength, which was more than 90% [48].

2.4. Experimental Procedure and Methods

True-triaxial testing equipment was employed to simulate the hydraulic fracturing process [49]. To forestall shear stress between the pressure platen and the sample, a thin layer of Vaseline and Teflon was attached to both sides of the samples. Throughout the experiments, the wellbore was aligned with the σv direction, and the directional perforation was initiated in accordance with the σH direction.
Operational parameters such as fluid viscosity and injection rate should be adjusted to allow enough time for recording the corresponding pressure–time data; this is to ensure that laboratory experiments are close to field conditions [38]. A lower injection rate (0.5 mL/s) and high fluid viscosity (48–51 mPa·s) were selected. Concurrently, the PAC PCI-2 acoustic emission monitoring system was employed to document AE signals throughout the experiment [50].
In the analysis stage of fracture morphology, high-definition photographs were firstly captured after dissection along the HF propagation path. Then, as depicted by Figure 4, a 3D optical scanner was employed to scan the surface of whole fracture networks (scanning accuracy was within 0.1 mm), and the visualization of the 3D hydraulic fracture network was realized through the scanning stage and preprocessing stage in sequence. Finally, the fracture network complexity was quantified using Fractal Dimension (FD), determined by the Octree Box-Counting Method (detailed by Yang et al. [51]).

3. Experimental Results

In Section 2.2, a series of hydraulic fracturing simulation experiments were successfully conducted on 16 sets of meticulously crafted synthetic blocks, which included an exhaustive exploration of four unique cavity cluster distributions under four different stress differential scenarios. The experimental outcomes were examined from several perspectives: the fracture propagation morphology, fracturing curves, the fracture network complexity and the characteristics of AE signals.

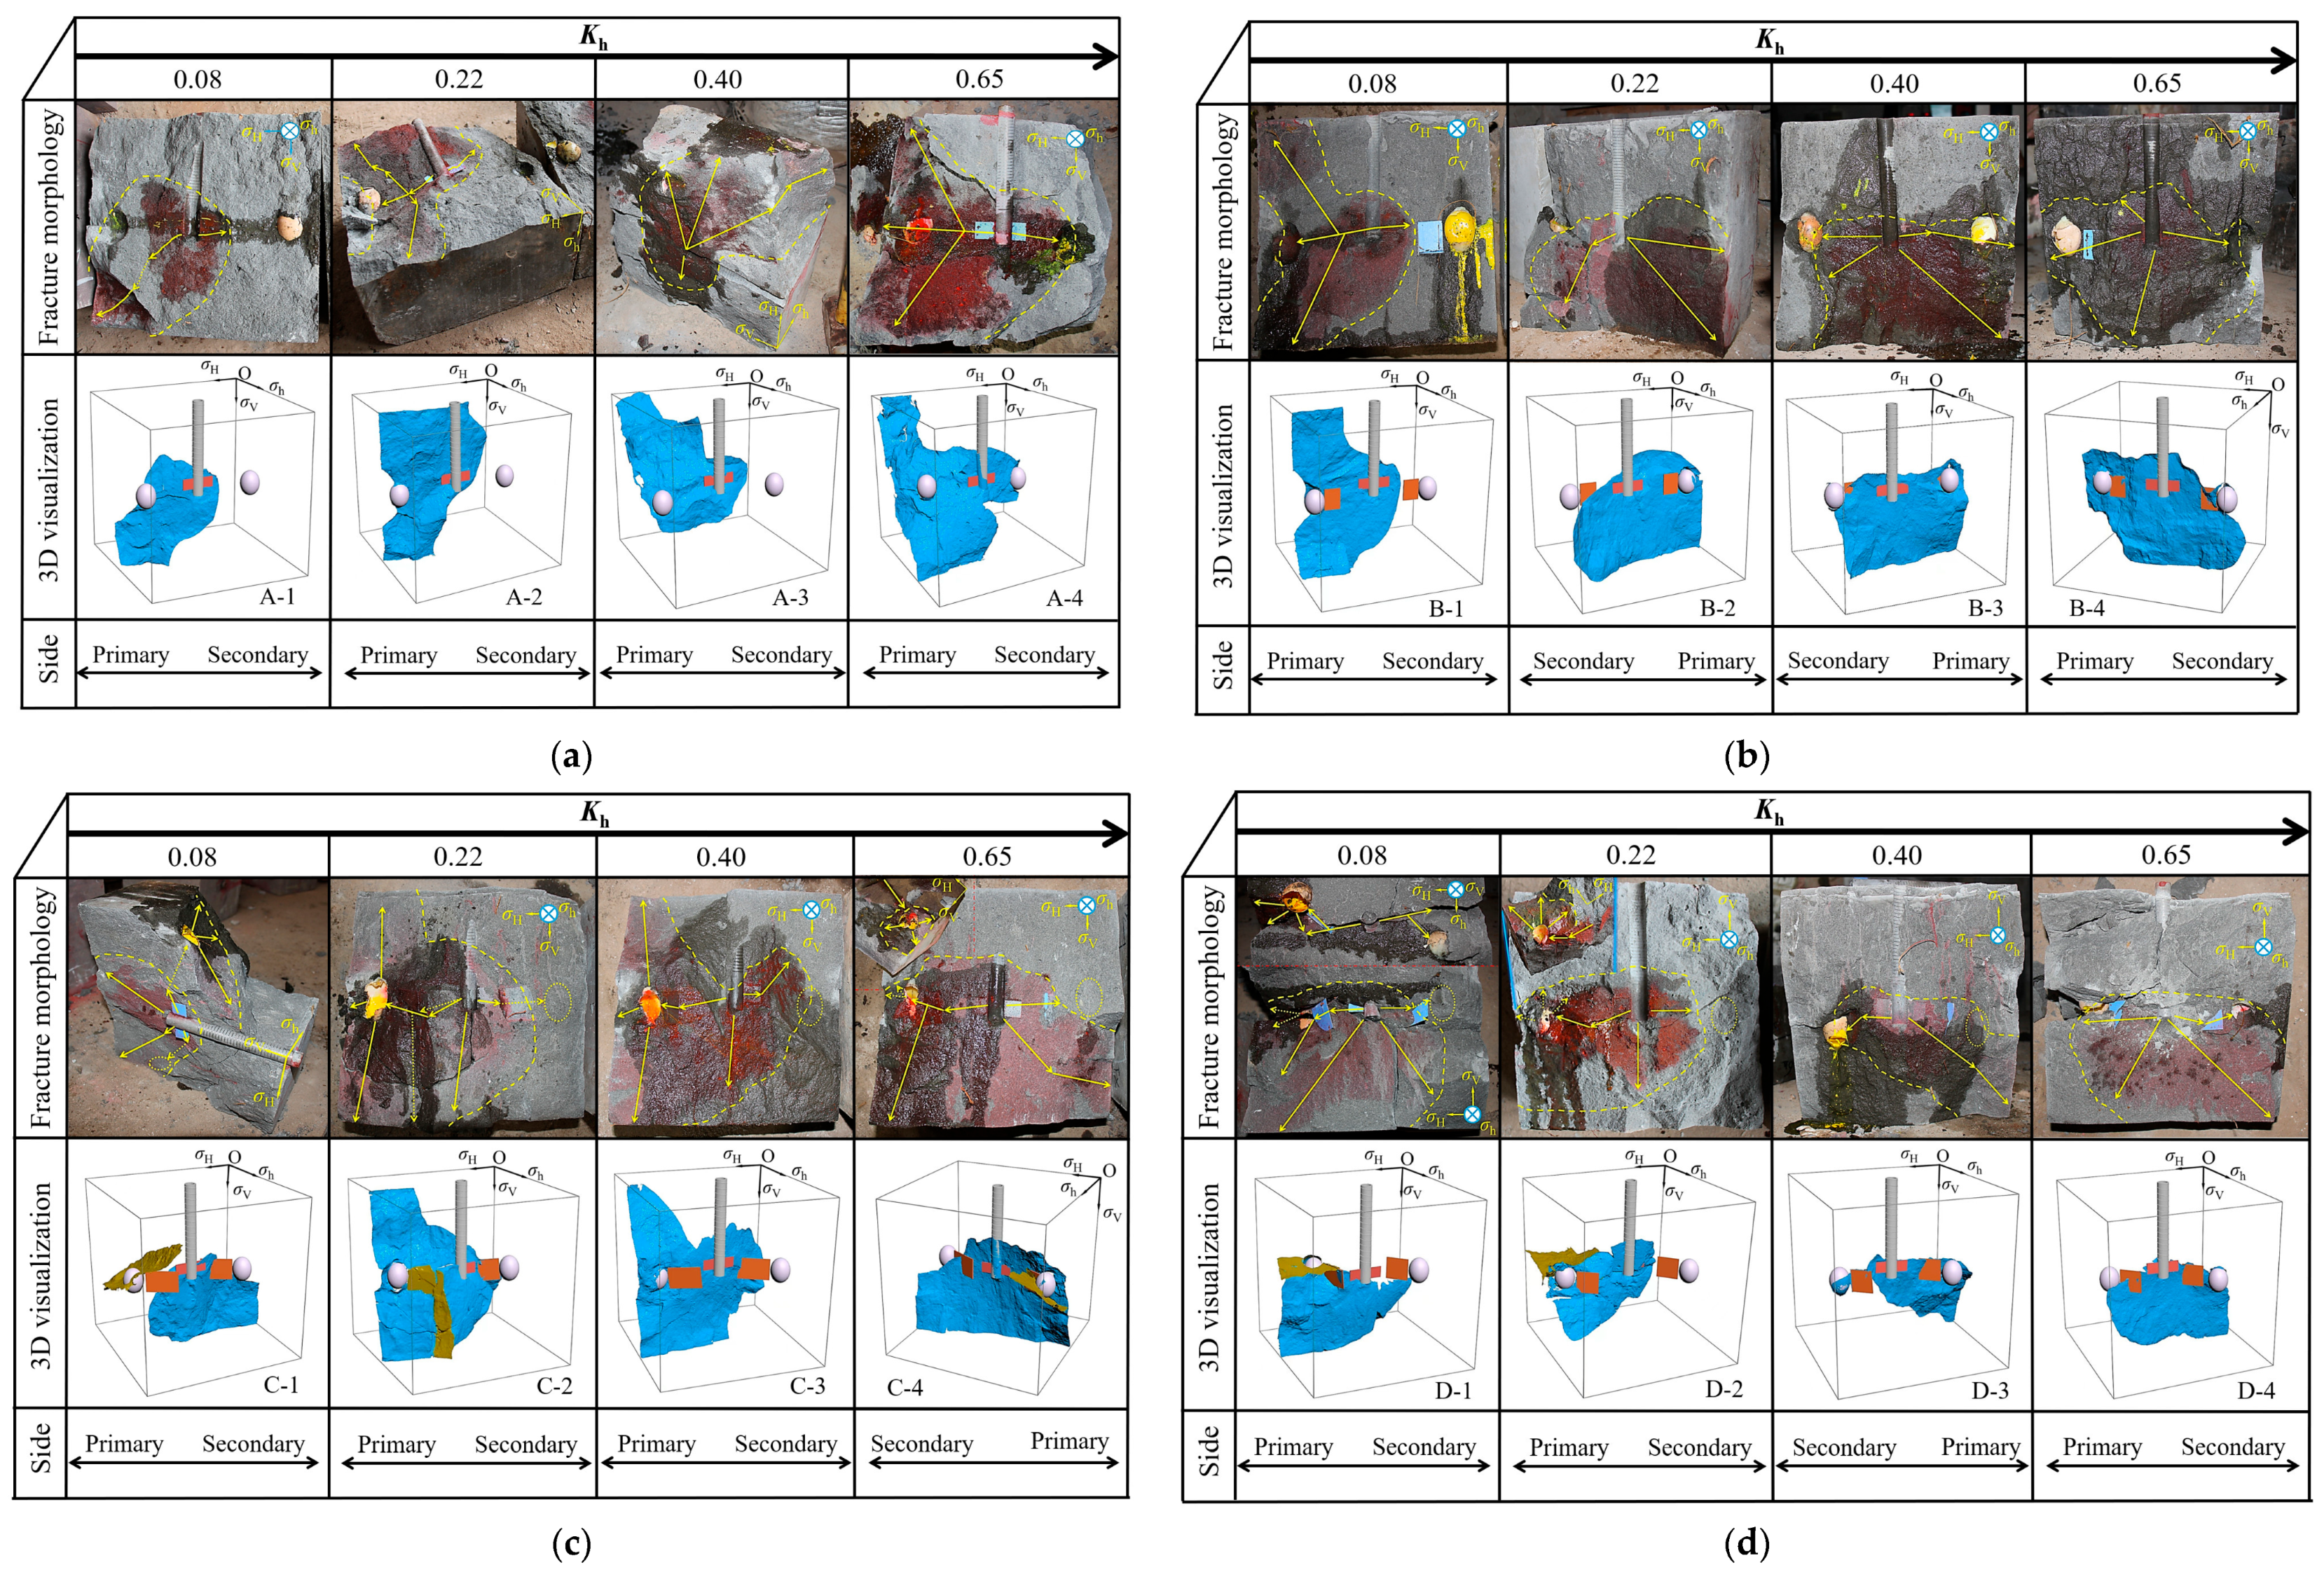
3.1. Analysis of Hydraulic Fracture Morphology

In comparison to the conventional HF’s elliptical symmetrical morphology, the stress concentration in the vicinity of prefabricated cavities can inhibit the hydraulic fracture and cause its non-planar propagation [34], while the prefabricated natural fracture may increase the bifurcation and complexity of the HFs [36,37]. Therefore, the HF’s morphology characteristics on both sides are completely different. For the convenience of analysis, this study designated the side with the more extended propagation path as the primary side, whereas the side with the less extended propagation path was termed the secondary side. As depicted in Figure 5, through inspecting the high-definition photographs and the 3D visualization of HFs, the HF-NF and HF-NC interactions and fracture morphology are displayed in Table 3. It is evident that the stress difference and cavity cluster distribution jointly affect the HF-NF and HF-NC interactions and fracture morphology.

3.1.1. The Effect of Stress Difference

In the case of samples featuring single-cavity distribution, under conditions of a higher horizontal stress difference (Kh greater than 0.22), the HF on both the primary and secondary sides could communicate with the cavity (arresting or crossing). Conversely, when Kh is lower than 0.22, the hydraulic fracture would tend to bypass the cavity or experience limited propagation due to the stress concentration around the cavity (Table 3). This is consistent with the previous research conclusion of Liu et al. [8]. The ability to connect the cavity is strengthened, the overall propagation morphology becomes more symmetrical, and the degree of non-planar deflection gradually decreases (Figure 5a).
For the samples with cavity and fracture (0°) distribution, when Kh is greater than 0.22, the relationship between the primary HF and the cavity varies from arresting to crossing, while a secondary hydraulic fracture also changes from almost no propagation to being captured by the NC, and the ability to connect the cavity is further strengthened (Table 3). The HF-NF relationship in front of the cavity changes from bypassing to opening, and the fracture morphology is closer to the planar propagation (Figure 5b).
For the samples with cavity and fracture (30°) distribution, when Kh is greater than 0.40, the HF on the secondary side goes from opening the NF and connecting the NC to crossing the NF and bypassing the NC, and the connectivity between the hydraulic fracture and the cavity is gradually weakened, such as sample C-4 in Figure 5c.
For the samples with cavity and fracture (45°) distribution, when Kh is greater than 0.22, the propagation behaviors of the primary HF transition from deflecting into the NC via the NF to across the NF, bypassing the NC for continued propagation. Consequently, the ability to connect the fracture–cavity structure becomes weaker than that of the cavity and natural fracture (30°) distribution. This is consistent with previous studies about HF-NF interaction [52,53], which suggests that under conditions of lower approach angles and stress differences, the HFs can open the NFs and transfer fracturing fluids. Conversely, under higher approach angles and stress differences, the HFs tend to cross the NFs. Although the secondary HFs could communicate with the cavity through opening the NFs, crossing the cavity becomes challenging due to the primary HF propagation, such as sample D-3 in Figure 5d.
Through the above analysis, it can be found that there are four types of HF-NC interaction modes, namely, bypassing (as observed in samples A-1 and D-4), arresting (as seen in samples A-2 and B-1), crossing along the original direction (as noted in samples A-4 and B-2), and crossing along a new direction (as evidenced in samples C-1 and D-2).

3.1.2. The Effect of Different Fracture–Cavity Distributions

Irrespective of the magnitude of stress difference, when there is no NF surrounding the cavity cluster (single cavity), the stress concentration around the cavity inhibits the HF propagation, resulting in an asymmetric distribution of the HFs on both the primary and secondary sides (Figure 5a). Meanwhile, the propagation path of a primary HF is also inhibited near the cavity and shows non-planar deflection.
Different from the single-cavity distribution, when there is an NF with a 0° or 30° approach angle at the front of the NC, the HF-NC communication ability would greatly increase, resulting in a more symmetrical HF morphology on both sides of the wellbore (Figure 5b,c). This indicates that the NF surrounding the NC could weaken the stress concentration caused by the cavity, thereby facilitating the guidance of HF propagation and enhancing the likelihood of establishing communication with the cavity.
With the further increase in the approach angle (from 30° to 45°) of the NF at the front of the NC, under conditions of lower stress difference, it becomes easier for the HF on both sides to open the NF and continue to communicate with the cavity. However, under conditions of higher stress difference, a primary HF (corresponding to a 45° approach angle) or secondary HF (corresponding to a 30° approach angle) would cross the NF and bypass the cavity (Figure 5d).
Therefore, different fracture–cavity distributions in carbonate reservoirs would have a great impact on the HF propagation. In the actual exploitation stage of carbonate reservoirs, the geological exploration of fracture–cavity structures in carbonate reservoirs is required, and different fracturing engineering designs might need to be carried out for different reservoirs.

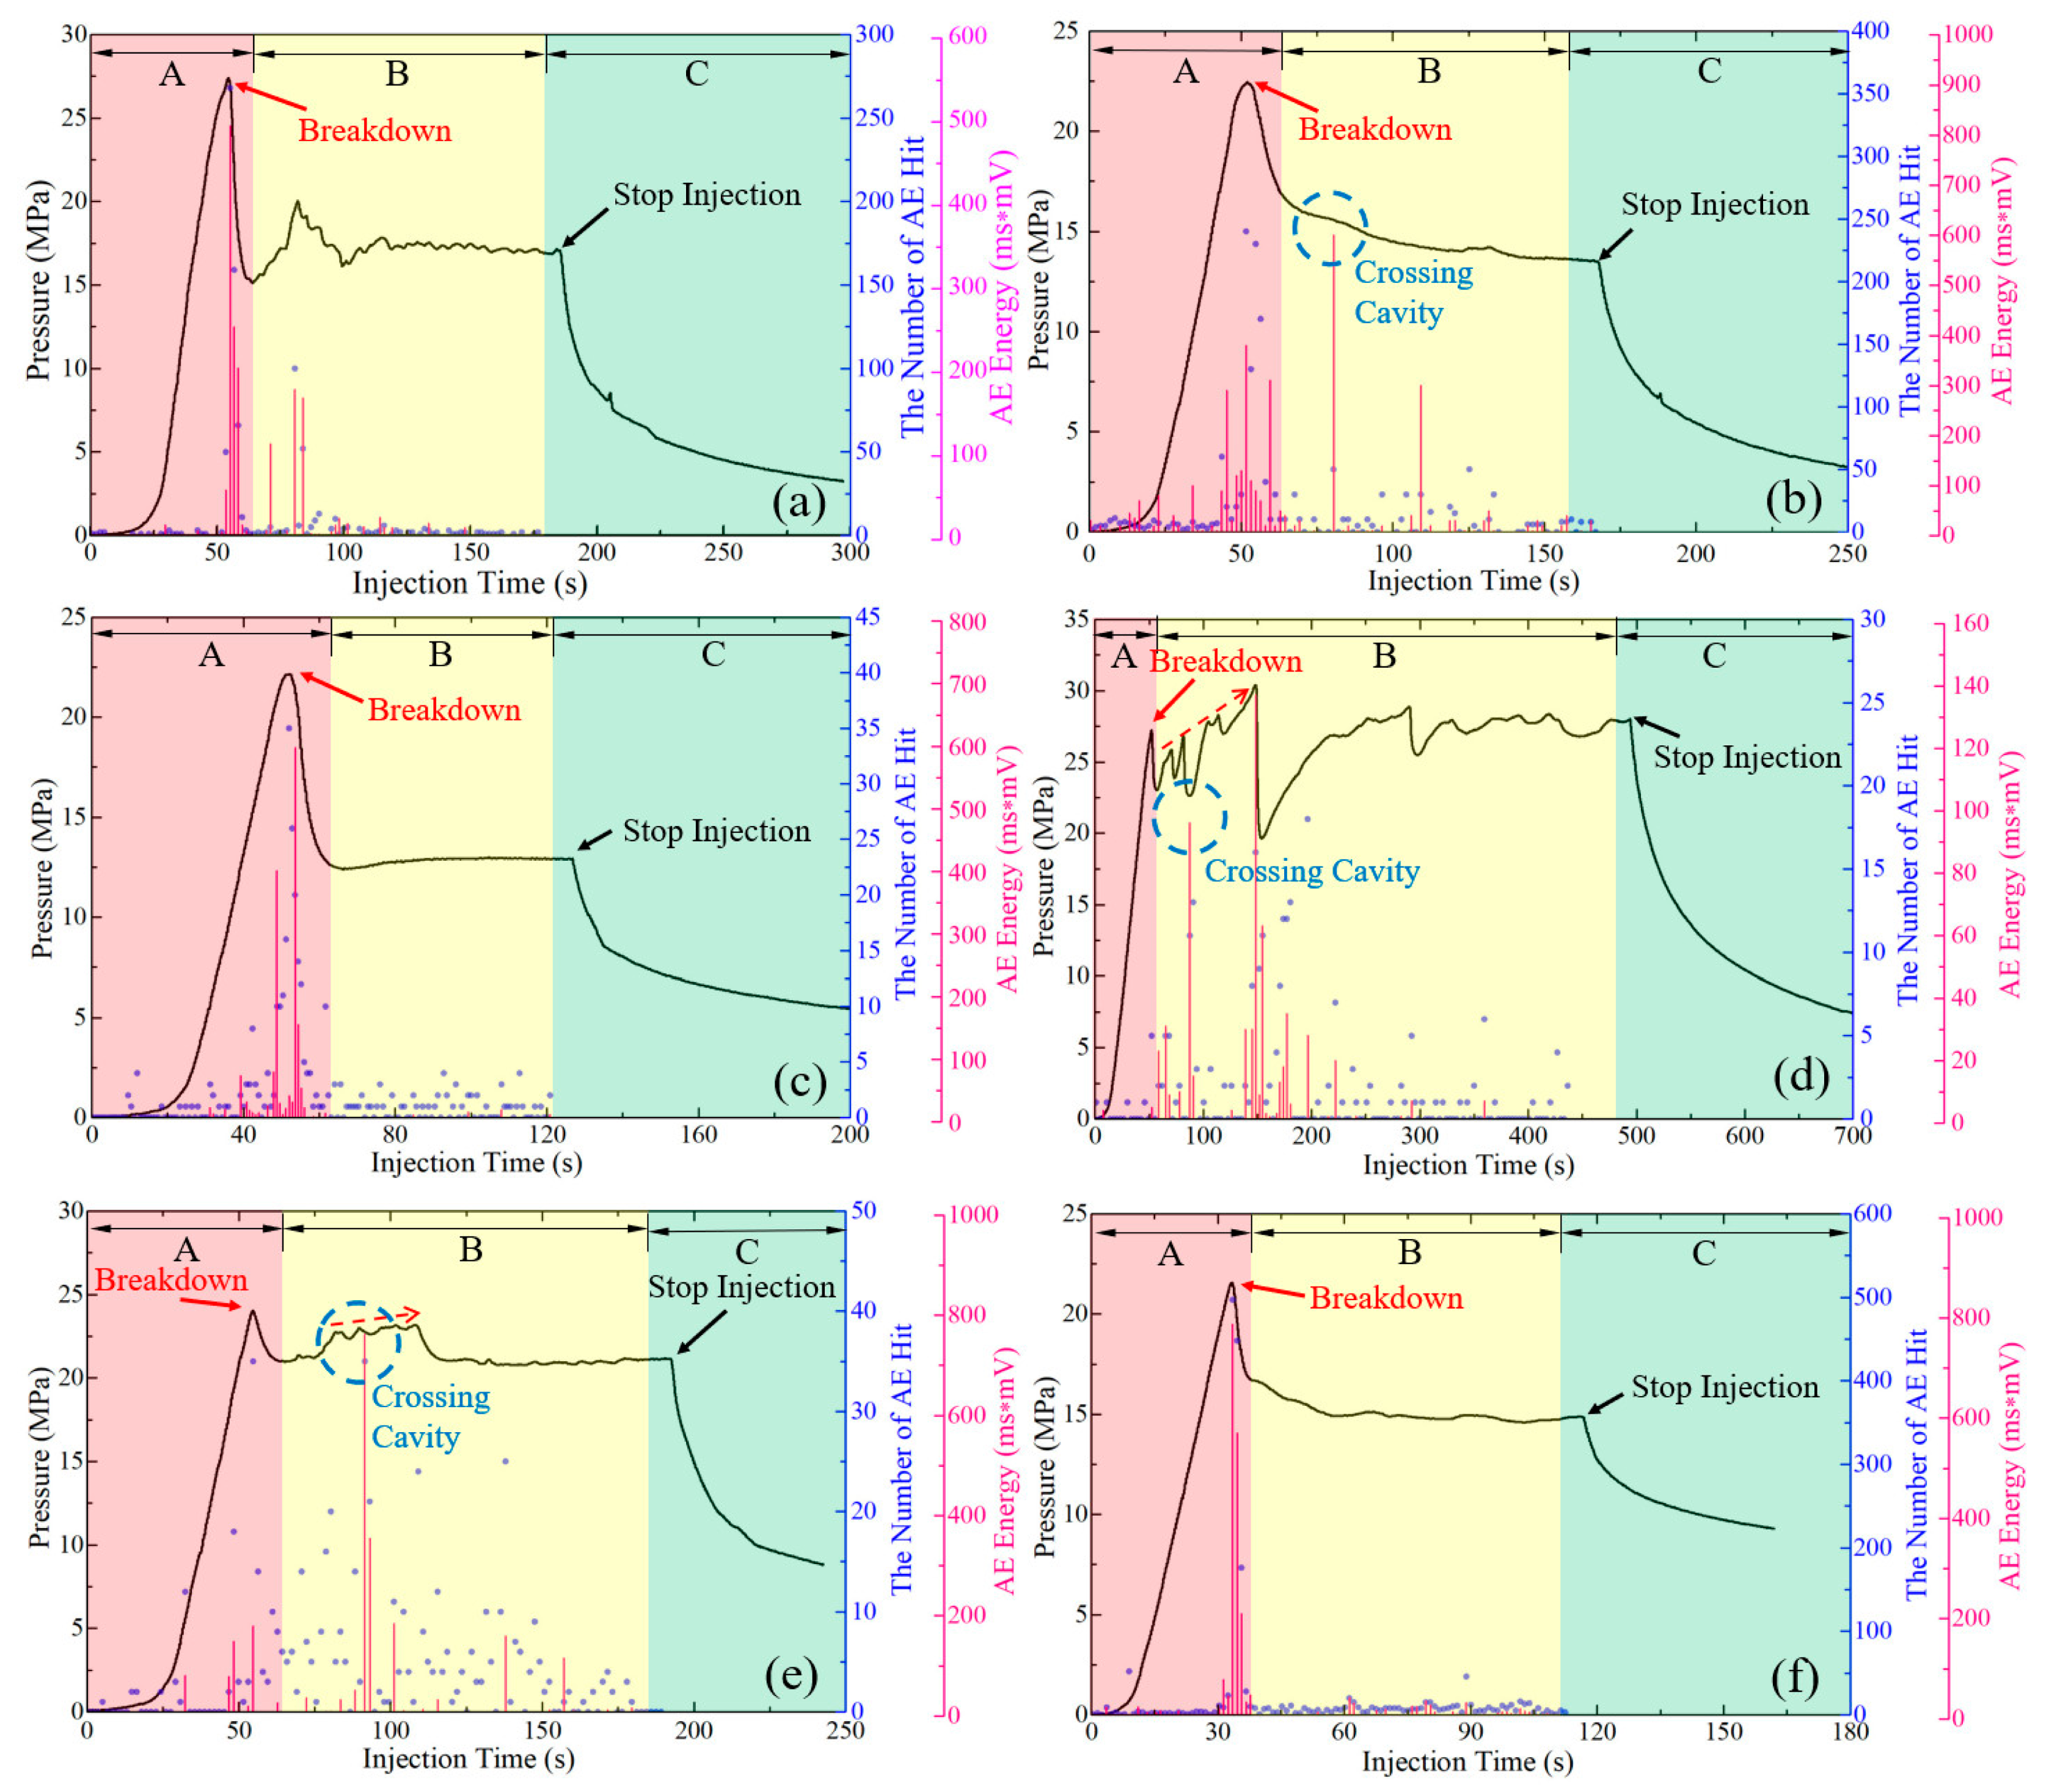
3.2. Analysis of Fracturing Curves

The analysis of fracturing curves is very important to reflect the HF initiation and propagation characteristics. As the HF propagates to the sample boundary in the fracturing process, the fracturing curve eventually tends to be stable, and the fluid pressure required to maintain the fracture unclosed is called the closure pressure. Figure 6 summarizes the fracturing curves of all samples, which could be categorized into four distinct types:
  • The fracturing curve rises in a “step-like” shape, with frequent fluctuations. When the curve reaches the initial breakdown pressure, the pressure drops down and then rises rapidly, and it finally becomes stable as the closure pressure after many fluctuations. This indicates that the hydraulic fracture is deflected or bifurcated multiple times to form new fractures during the propagation progress, which increases the difficulty of realization and results in the progressive increase in the subsequent higher breakdown pressures. The typical samples are shown by A-2 (Figure 6a) and C-2 (Figure 6c).
  • The closure pressure is slightly lower than the breakdown pressure, characterized by significant fluctuations in the curve. Because of obvious non-planar propagation or larger deflection during the propagation progress, the closure pressure always keeps at a higher level. The typical samples are shown by C-1 (Figure 6c) and D-2 (Figure 6d).
  • The closure pressure is obviously lower than the breakdown pressure, characterized by significant fluctuations in the curve. The HF propagation path remains relatively unchanged, but there is a small range of non-planar propagation or deflection, resulting in fluctuations in the fracturing curve. The typical samples are shown by A-1 (Figure 6a) and D-3 (Figure 6d).
  • The closure pressure is obviously lower than the breakdown pressure, with minimal fluctuations observed in the curve. Since the hydraulic fracture of both sides is close to planar propagation, the fracturing curve has no obvious fluctuation. The typical samples are shown by B-3 and B-4 (Figure 6b).
On this basis, as depicted in Figure 7, the variations in breakdown pressure and closure pressure with stress difference are summarized for the samples with four types of cavity cluster distributions.
According to the HF initiation criterion [54,55], when the fluid pressure within the reservoir surpasses the sum of the σh and the rock tensile strength, tensile failure would occur, leading to the initiation of hydraulic fracturing within the rock. By analyzing the breakdown pressures of samples with four types of cavity cluster distributions in Figure 7, it is evident that all breakdown pressures are within a reasonable range (greater than σh).
When the HF finally propagates to the sample boundary, since the size of the fracturing experiments is very limited relative to the actual exploitation scale in the formation, the closure pressure that keeps the fracture unclosed is likely to be less than the σh. By analyzing the variations in the closure pressures with stress difference, it can be found that no matter what kind of cavity cluster distribution, the closure pressure is always sustained at a high level when the stress difference coefficient is 0.22, while the closure stress generally drops more under other stress difference conditions. In conjunction with the HF morphology characteristics detailed in Section 3.1, the hydraulic fractures of the samples at the Kh of 0.22 both have the most complicated non-planar propagation or bifurcation phenomenon, thus maintaining a high degree of the closure pressure.
It is noteworthy that this diverges from the typical HF-NF interaction law. In other words, the HFs are more inclined to connect with the NFs and create a complex fracture network under conditions of lower stress difference [56,57]. This discrepancy arises from the stress concentration around the NC, which increases the instability and complexity of HF propagation. When the Kh is at 0.22, the HF cannot directly bypass or cross through the cavity, and the typical samples are shown by A-2 (Figure 5a) and C-2 (Figure 5c).

3.3. Analysis of 3D Fracture Network Complexity

The 3D fracture network complexity could be evaluated by Fractal Dimension (FD) in Section 2.4 (Appendix A for detailed FD calculation). The FD value calculated by this method can comprehensively encapsulate the intricacy of the fracture network structure and the stimulated reservoir area.
Figure 8 summarizes the 3D fracture network complexity for all samples. It is evident that different fracture–cavity distributions play a dominant role in the FD value. Specifically, in the case of samples featuring single-cavity distribution, hydraulic fractures cannot symmetrically propagate on both sides, and the samples both have a single hydraulic fracture (Figure 5a). The fracture network complexity of the samples remains at a relatively lower level. In the case of samples featuring cavities accompanied by a fracture at a 0° angle, the presence of a natural fracture helps guide hydraulic fractures into the natural cavity. The HF propagation morphology on both the primary and secondary sides is relatively more symmetrical (Figure 5b), thereby increasing the stimulated reservoir area and maintaining a higher level of fracture network complexity. In the case of samples featuring cavities accompanied by a fracture at a 30° angle, a natural fracture with a low approach angle still helps guide hydraulic fractures into the natural cavity (Figure 5c) and greatly increases the fracture network complexity through the bifurcation of hydraulic fractures and the formation of complicated new fractures after crossing the cavities (the FD values remain at the higher level). In the case of samples featuring cavities accompanied by a fracture at a 45° angle, the HFs are more likely to pass through the NFs and cannot communicate with the cavities and exhibit asymmetric propagation patterns on the primary and secondary sides of the wellbore (as depicted in Figure 5d), reducing the complexity of the fracture network (the FD values remain at the lower level).
In addition, it also can be found that when the Kh is 0.22, the samples with four different fracture–cavity distributions both have the highest FD values. This phenomenon is related to the formation of relatively complex fracture morphology (Figure 5) and the maintenance of higher closure pressure in the fracturing curve (Figure 7) in this condition.

3.4. Analysis of AE Signal Characteristics

Throughout the fracturing experiments, Acoustic Emission Technology (AET) was employed to monitor real-time fracture propagation signals in all samples via AE Hit and energy (ENE) measurements. The AE signals transformed from elastic waves generated by fracture initiation and propagation could provide significant data for assessing the fracture characteristics of rocks [50]. The number of AE Hits, defined as signals that surpass the detection threshold and trigger a system channel to record data, correlates with the damage degree of crack initiation and propagation [58]. Moreover, AE energy, as another important parameter, can reflect the relative intensity of the crack [59]. The variations in AE signals and pump pressure over time for six typical samples are summarized in Figure 9, and three stages in the fracturing curves were preliminarily distinguished: the initial breakdown stage, the further propagation stage and the stopping injection stage. And we found the following:
In the initial breakdown stage of all samples, cracking actively occurs inside the rock, manifested as a macroscopic rupture. Accompanied by the obvious pump pressure drop in the fracturing curve, relatively denser AE Hits and higher energy are generated during this process. As the HF continues to propagate (combined with the specific fracture characteristics in Section 3.1), if deflection in the fracture’s path occurs (such as sample A-1 in Figure 9a) or new hydraulic fractures are formed (such as sample D-2 in Figure 9e) during the propagation process, accompanied by frequent fluctuations of the fracturing curve, the AE signal (both AE Hits and energy) also increases. Therefore, both the complete fracturing curve and the AE monitoring method could be used to preliminarily judge the HF propagation characteristics. The obvious fluctuations in the fracturing curve, in conjunction with the synchronous increase in the AE signal, indicate that the geometry of fracture propagation has become more complicated.
However, the interactions between the hydraulic fracture and the cavity may not be reflected in the fracturing curve. For example, the pump pressure of sample A-3 (Figure 9b) has no obvious fluctuation after the initial breakdown, but the AE energy occurs at high amplitude, which corresponds to the further HF propagation through the cavity. Therefore, the AE energy can be used to judge the ease of different HF-NC interactions as follows:
  • In the case of samples featuring single-cavity distribution, due to the inhibition of the cavity (stress concentration near the cavity), more energy is required in the process of communicating and crossing the cavity, which would generate high-amplitude AE energy, such as sample A-3 (Figure 9b);
  • For samples of the distribution with cavities and 0° fractures, the natural fracture near the cavity can lead the HF to propagate in a near in-plane manner, making it easier to cross the cavity in this case, so there are no more AE signals, such as sample B-3 (Figure 9c);
  • For samples of the distribution with cavities and fractures (30°/45°), when the HF opens the NF and subsequently encounters and crosses the cavity to form new fractures, this process increases the difficulty of realization, so more AE energy could generate, such as sample C-2 (Figure 9d) and sample D-2 (Figure 9e);
  • When the HF is only arrested by the cavity or bypasses the cavity to continue to propagate, this process does not require much energy to generate new fractures, so it does not generate much AE energy, such as sample D-4 (Figure 9f).

4. Discussion

The analysis from Section 3.1 on the interaction between the HFs and prefabricated cavity clusters with varying distributions reveals that distinct cavity cluster distributions exert differing influences on the HF propagation. Under conditions of higher stress differences, the samples with single-cavity distribution and cavity + fracture (0°) distribution more easily communicate with the cavity, the principal hydraulic fracture can extend a longer path and the fracture morphology is closer to symmetrical propagation in the plane. Conversely, under conditions of lower stress differences, the samples of the distribution with cavities and natural fractures (30° or 45°) more easily open the NF and continue to communicate with the cavity. The HF non-planar deflection and propagation along the natural fracture, as well as new fracture formation after initiating around the cavity, contribute to a more complex fracture geometry (Figure 5c,d). However, this is actually not conducive to the effective exploitation of a carbonate reservoir. Natural fractures are densely distributed in actual carbonate reservoirs. When complex multiple fractures are formed near the wellbore, the fracturing fluid loss could increase significantly and near-wellbore tortuousness could easily occur, thereby interfering with the principal HF extension [60] and the transport of the proppant [61].
To this end, it is necessary to not only ensure that the principal HF extends to a longer distance and avoid too complicated fractures near the wellbore, but also effectively communicate with more cavities. The important goal of hydraulic fracturing is to achieve a fracture network with a predefined geometry and the appropriate distribution of proppant materials within the fracture [62]. The existing fracturing technology requires enhancement. Acid fracturing has gradually been replaced by proppant fracturing, as it requires a large amount of acidic fluid to be consumed near the wellbore, resulting in a significant reduction in the effective action distance [2,63]. More stimulation techniques need to be tried to obtain better reservoir stimulation effectiveness, such as temporary plugging technology [64], multi-stage hydraulic fracturing treatments [65] and intensive-stage fracturing technique [66]. In addition, because the fracture–cavity distribution and the in situ stress are formation attributes that cannot be altered, better stimulation effectiveness can be realized by controlling fluid viscosity and displacement, the type of fracturing fluid and other engineering design parameters. Given the constraints of field conditions, modifying fluid viscosity represents a practical approach to enhance fracturing efficiency [67]. For this reason, a comprehensive fracturing conception—variable fluid viscosity conception—was proposed (Figure 10).
To significantly reduce the tortuosity and multiple fractures in the near-wellbore fracture path, employing high-viscosity fracturing fluid as pre-pad fluid is essential firstly. Due to the high viscous resistivity of high-viscosity fracturing fluid, the HF tends to cross natural micro-fractures more easily and extends a longer distance along the principal fracture direction [68,69]. In addition, high-viscosity fracturing fluid can ensure that most proppants remain suspended during the treatment and closure process [70]. This results in an improved overall fracture geometry. Afterwards, in conjunction with the temporary plugging process, high-viscosity fracturing fluid is replaced with low-viscosity fracturing fluid and continues to propagate based on the established fracture network. In general, the low-viscosity fracturing fluid offers superior penetration and connection effects on micro-fractures, so it can effectively open more natural fractures and communicate with more cavities [71]. By utilizing this approach, the fracturing fluid could not only extend thoroughly along the primary HF but also efficiently link more cavity clusters distributed near the primary HF. This maximizes fracture network complexity and increases the stimulated reservoir volume. It is worth noting that for this fracturing method, how to determine the optimal switching time and the variation range of fluid viscosity needs further research under different geological conditions to determine better stimulation effectiveness.

5. Conclusions

By accurately prefabricating cavity clusters with different distributions in synthetically made samples, true-triaxial hydraulic fracturing experiments were detailly carried out considering two main factors: the horizontal stress difference and the approach angle of a natural fracture (NF) at the front of the natural cavity (NC). The HF propagation process was comprehensively analyzed through the fracture morphology, fracturing curve, the fracture network complexity and acoustic emission monitoring. The experimental results clearly demonstrate that the distribution of cavity clusters significantly affects the HF propagation behavior and fracture network complexity. The conclusions are as follows:
  • The fracturing curves, which can reflect different HF-NC interactions, are divided into four types: frequent fluctuations with “step-like” shapes, great fluctuations with slightly lower closure pressure, great fluctuations with obviously lower closure pressure and little fluctuations with obviously lower closure pressure.
  • A natural fracture with a smaller approach angle is favorable for guiding a hydraulic fracture to a cavity.
  • Different fracture–cavity distributions play a dominant role in the fracture network complexity. A natural fracture with a low approach angle around the fracture–cavity structure greatly increases the fracture network complexity through more symmetrical propagation and the formation of complicated new fractures after crossing the cavities.
  • Both the complete fracturing curve and the AE monitoring technique could be employed to preliminarily judge the HF propagation characteristics, and the AE energy can be used to judge the ease of different HF-NC interactions.
  • Given the constraints of field conditions, a new fracturing conception—the variable fluid viscosity technique—was proposed, which is beneficial in connecting more fracture–cavity reservoirs.

Author Contributions

Conceptualization: H.Y.; writing—original draft preparation: H.Y.; writing—review and editing: L.W. and Y.G.; formal analysis and investigation: H.Y., Z.B. and G.Z.; visualization: J.G., W.G., Y.H. and G.Q.; funding acquisition: Y.G.; methodology: L.W. All authors have read and agreed to the published version of the manuscript.

Funding

This research was funded by the “National Natural Science Foundation of China” [Grant Nos. 52104010, U22B6003, and U22A20166].

Data Availability Statement

The data presented in this study are available from the corresponding author on reasonable request.

Acknowledgments

The authors extend their gratitude for the financial support received from the China Scholarship Council.

Conflicts of Interest

Author Junchuan Gui was employed by the company Shale Gas Research Institute of PetroChina Southwest Oil & Gas Field Company. The remaining authors declare that the research was conducted in the absence of any commercial or financial relationships that could be construed as a potential conflict of interest.

Appendix A

Table A1. Detailed calculation process of the OBCM method (the number of boxes N(r) corresponding to the side length of boxes r).
Recursion number, n12345678910
Boxes with edge length, r (mm)1507537.518.759.3754.68752.34381.17190.58590.2930
The number of boxes N(r)Single cavityA-1815371174651791679826,500100,889359,435
A-282259212836335113,23051,861196,956701,891
A-372158216789300711,60344,868167,672572,012
A-4620812931110428316,71664,570241,375816,873
Cavity and fracture (0°)B-161649191724290111,42844,786171,871626,566
B-281758243916355313,64753,353201,853717,170
B-381957199829325412,67749,444185,901646,048
B-471756234859328913,10150,859191,669676,269
Cavity and fracture (30°)C-172470234963378414,53756,444212,788754,208
C-2618622741058426516,62164,613243,044835,956
C-382167236989386814,64456,744213,264741,706
C-4722712701092429616,85865,942248,803872,072
Cavity and fracture (45°)D-1616461736442567997139,359149,022511,558
D-281958214848325212,55548,936183,831636,068
D-3817431505131889716427,514102,536349,486
D-4821551666252318902334,970132,940474,456

References

  1. Zhao, W.; Shen, A.; Hu, S.; Zhang, B.; Pan, W.; Zhou, J.; Wang, Z. Geological Conditions and Distributional Features of Large-Scale Carbonate Reservoirs Onshore China. Pet. Explor. Dev. 2012, 39, 1–14. [Google Scholar] [CrossRef]
  2. Jeon, J.; Bashir, M.O.; Liu, J.; Wu, X. Fracturing Carbonate Reservoirs: Acidising Fracturing or Fracturing with Proppants? In Proceedings of the SPE Asia Pacific Hydraulic Fracturing Conference, Beijing, China, 24–26 August 2016. [Google Scholar] [CrossRef]
  3. Loucks, R.G. Paleocave Carbonate Reservoirs: Origins, Burial-Depth Modifications, Spatial Complexity, and Reservoir Implications. Am. Assoc. Pet. Geol. Bull. 1999, 83, 1795–1834. [Google Scholar] [CrossRef]
  4. Kerans, C. Karst-Controlled Reservoir Heterogeneity in Ellenburger Group Carbonates of West Texas. Am. Assoc. Pet. Geol. Bull. 1988, 72, 1160–1183. [Google Scholar] [CrossRef]
  5. Oliveira, T.J.L.; Neumann, L.F.; Azevedo, C.T. Acid or Propped Fracturing in Deep Carbonates? Experiments and Field Results. SPE Eur. Form. Damage Conf. Proc. EFDC 2014, 1, 123–137. [Google Scholar] [CrossRef]
  6. Zhang, F.; Damjanac, B.; Maxwell, S. Investigating Hydraulic Fracturing Complexity in Naturally Fractured Rock Masses Using Fully Coupled Multiscale Numerical Modeling. Rock Mech. Rock Eng. 2019, 52, 5137–5160. [Google Scholar] [CrossRef]
  7. Daneshy, A.A. Hydraulic Fracture Propagation in the Presence of Planes of Weakness. In Proceedings of the SPE European Spring Meeting, Amsterdam, The Netherlands, 29–30 May 1974. [Google Scholar] [CrossRef]
  8. Liu, B.; Jin, Y.; Chen, M. Influence of Vugs in Fractured-Vuggy Carbonate Reservoirs on Hydraulic Fracture Propagation Based on Laboratory Experiments. J. Struct. Geol. 2019, 124, 143–150. [Google Scholar] [CrossRef]
  9. Carrier, B.; Granet, S. Numerical Modeling of Hydraulic Fracture Problem in Permeable Medium Using Cohesive Zone Model. Eng. Fract. Mech. 2012, 79, 312–328. [Google Scholar] [CrossRef]
  10. Wu, K.; Olson, J.E. Investigation of Critical In Situ and Injection Factors in Multi-Frac Treatments: Guidelines for Controlling Fracture Complexity. In Proceedings of the SPE Hydraulic Fracturing Technology Conference, The Woodlands, TX, USA, 4–6 February 2013. [Google Scholar]
  11. Ren, L.; Su, Y.; Zhan, S.; Hao, Y.; Meng, F.; Sheng, G. Modeling and Simulation of Complex Fracture Network Propagation with SRV Fracturing in Unconventional Shale Reservoirs. J. Nat. Gas Sci. Eng. 2016, 28, 132–141. [Google Scholar] [CrossRef]
  12. Khoei, A.R.; Vahab, M.; Hirmand, M. Modeling the Interaction between Fluid-Driven Fracture and Natural Fault Using an Enriched-FEM Technique. Int. J. Fract. 2016, 197, 1–24. [Google Scholar] [CrossRef]
  13. Wang, X.; Shi, F.; Liu, C.; Lu, D.; Liu, H.; Wu, H. Extended Finite Element Simulation of Fracture Network Propagation in Formation Containing Frictional and Cemented Natural Fractures. J. Nat. Gas Sci. Eng. 2018, 50, 309–324. [Google Scholar] [CrossRef]
  14. Nagel, N.B.; Sanchez-Nagel, M.A.; Zhang, F.; Garcia, X.; Lee, B. Coupled Numerical Evaluations of the Geomechanical Interactions Between a Hydraulic Fracture Stimulation and a Natural Fracture System in Shale Formations. Rock Mech. Rock Eng. 2013, 46, 581–609. [Google Scholar] [CrossRef]
  15. Zou, Y.; Zhang, S.; Ma, X.; Zhou, T.; Zeng, B. Numerical Investigation of Hydraulic Fracture Network Propagation in Naturally Fractured Shale Formations. J. Struct. Geol. 2016, 84, 1–13. [Google Scholar] [CrossRef]
  16. Blanton, T.L. An Experimental Study of Interaction Between Hydraulically Induced and Pre-Existing Fractures. In Proceedings of the SPE Unconventional Gas Recovery Symposium, Pittsburgh, PA, USA, 16–18 May 1982. [Google Scholar] [CrossRef]
  17. Warpinski, N.R.; Teufel, L.W. Influence of Geologic Discontinuities on Hydraulic Fracture Propagation. J. Pet. Technol. 1987, 39, 209–220. [Google Scholar] [CrossRef]
  18. Renshaw, C.E.; Pollard, D.D. An Experimentally Verified Criterion for Propagation across Unbounded Frictional Interfaces in Brittle, Linear Elastic Materials. Int. J. Rock Mech. Min. Sci. 1995, 32, 237–249. [Google Scholar] [CrossRef]
  19. Gu, H.; Weng, X.; Lund, J.; MacK, M.; Ganguly, U.; Suarez-Rivera, R. Hydraulic Fracture Crossing Natural Fracture at Nonorthogonal Angles: A Criterion and Its Validation. SPE Prod. Oper. 2012, 27, 20–26. [Google Scholar] [CrossRef]
  20. Lee, H.P.; Olson, J.E.; Holder, J.; Gale, J.F.W.; Myers, R.D. The Interaction of Propagating Opening Mode Fractures with Preexisting Discontinuities in Shale. J. Geophys. Res. Solid Earth 2015, 120, 169–181. [Google Scholar] [CrossRef]
  21. Wang, W.; Olson, J.E.; Prodanović, M.; Schultz, R.A. Interaction between Cemented Natural Fractures and Hydraulic Fractures Assessed by Experiments and Numerical Simulations. J. Pet. Sci. Eng. 2018, 167, 506–516. [Google Scholar] [CrossRef]
  22. Zhou, J.; Zeng, Y.; Guo, Y.; Chang, X.; Liu, L.; Wang, L.; Hou, Z.; Yang, C. Effect of Natural Filling Fracture on the Cracking Process of Shale Brazilian Disc Containing a Central Straight Notched Flaw. J. Pet. Sci. Eng. 2021, 196, 107993. [Google Scholar] [CrossRef]
  23. Mokhtari, M.; Nath, F.; Hayatdavoudi, A.; Nizamutdinov, R.; Jiang, S.; Rizvi, H. Complex Deformation of Naturally Fractured Rocks. J. Pet. Sci. Eng. 2019, 183, 106410. [Google Scholar] [CrossRef]
  24. Bittencourt, T.N.; Wawrzynek, P.A.; Ingraffea, A.R.; Sousa, J.L. Quasi-Automatic Simulation of Crack Propagation for 2D Lefm Problems. Eng. Fract. Mech. 1996, 55, 321–334. [Google Scholar] [CrossRef]
  25. Cheng, L.; Luo, Z.; Yu, Y.; Zhao, L.; Zhou, C. Study on the Interaction Mechanism between Hydraulic Fracture and Natural Karst Cave with the Extended Finite Element Method. Eng. Fract. Mech. 2019, 222, 106680. [Google Scholar] [CrossRef]
  26. Luo, Z.; Zhang, N.; Zhao, L.; Zeng, J.; Liu, P.; Li, N. Interaction of a Hydraulic Fracture with a Hole in Poroelasticity Medium Based on Extended Finite Element Method. Eng. Anal. Bound. Elem. 2020, 115, 108–119. [Google Scholar] [CrossRef]
  27. Liu, Z.; Lu, Q.; Yuan, S.; Tang, X.; Shao, Z.; Weng, Z. Investigation of the Influence of Natural Cavities on Hydraulic Fracturing Using Phase Field Method. Arab. J. Sci. Eng. 2019, 44, 10481–10501. [Google Scholar] [CrossRef]
  28. Yu, H.-S. Cavity Expansion Methods in Geomechanics; Springer Science & Business Media: Berlin/Heidelberg, Germany, 2000; ISBN 9789048140237. [Google Scholar]
  29. Cheong, S.K.; Kwon, O.N. Analysis of a Crack Approaching Two Circular Holes in [0n 90m]s Laminates. Eng. Fract. Mech. 1993, 46, 235–244. [Google Scholar] [CrossRef]
  30. Hu, K.X.; Chandra, A.; Huang, Y. Multiple Void-Crack Interaction. Int. J. Solids Struct. 1993, 30, 1473–1489. [Google Scholar] [CrossRef]
  31. Kobayashi, A.; Johnson, B.; Wade, B. Crack Approaching a Hole. Fract. Anal. Proc. Natl. Symp. Fract. Mech. Part II 1974, 560, 53–68. [Google Scholar] [CrossRef]
  32. Theocaris, P.S.; Milios, J. The Process of the Momentary Arrest of a Moving Crack Approaching a Material Discontinuity. Int. J. Mech. Sci. 1981, 23, 423–436. [Google Scholar] [CrossRef]
  33. Kranz, R.L. Crack-Crack and Crack-Pore Interactions in Stressed Granite. Int. J. Rock Mech. Min. Sci. Geomech. Abstr. 1979, 16, 37–47. [Google Scholar] [CrossRef]
  34. Liu, S.; Liu, Z.; Zhang, Z. Numerical Study on Hydraulic Fracture-Cavity Interaction in Fractured-Vuggy Carbonate Reservoir. J. Pet. Sci. Eng. 2022, 213, 110426. [Google Scholar] [CrossRef]
  35. Qiao, J.; Tang, X.; Hu, M.; Rutqvist, J.; Liu, Z. The Hydraulic Fracturing with Multiple Influencing Factors in Carbonate Fracture-Cavity Reservoirs. Comput. Geotech. 2022, 147, 104773. [Google Scholar] [CrossRef]
  36. Dahi-Taleghani, A.; Olson, J.E. Numerical Modeling of Multistranded-Hydraulic-Fracture Propagation: Accounting for the Interaction between Induced and Natural Fractures. SPE J. 2011, 16, 575–581. [Google Scholar] [CrossRef]
  37. Keshavarzi, R.; Mohammadi, S.; Bayesteh, H. Hydraulic Fracture Propagation in Unconventional Reservoirs: The Role of Natural Fractures. In Proceedings of the 46th U.S. Rock Mechanics/Geomechanics Symposium, Chicago, IL, USA, 24–27 June 2012. [Google Scholar]
  38. Sarmadivaleh, M.; Rasouli, V. Test Design and Sample Preparation Procedure for Experimental Investigation of Hydraulic Fracturing Interaction Modes. Rock Mech. Rock Eng. 2015, 48, 93–105. [Google Scholar] [CrossRef]
  39. Yang, H.; Chang, X.; Yang, C.; Guo, W.; Wang, L.; Zhao, G.; Guo, Y. Visualization and Characterization of Experimental Hydraulic Fractures Interacting with Karst Fracture-Cavity Distributions. J. Rock Mech. Geotech. Eng. 2023; in press. [Google Scholar] [CrossRef]
  40. Johnson, E.; Cleary, M.P. Implications of Recent Laboratory Experimental Results for Hydraulic Fractures. In Proceedings of the Low Permeability Reservoirs Symposium, Denver, CO, USA, 15–17 April 1991. [Google Scholar]
  41. Van Dam, D.B.; De Pater, C.J.; Romijn, R. Analysis of Hydraulic Fracture Closure in Laboratory Experiments. SPE Prod. Facil. 2000, 15, 151–158. [Google Scholar] [CrossRef]
  42. Jalal, M.; Mansouri, E.; Sharifipour, M.; Pouladkhan, A.R. Mechanical, Rheological, Durability and Microstructural Properties of High Performance Self-Compacting Concrete Containing SiO2 Micro and Nanoparticles. Mater. Des. 2012, 34, 389–400. [Google Scholar] [CrossRef]
  43. Ghafari, E.; Costa, H.; Júlio, E.; Portugal, A.; Durães, L. The Effect of Nanosilica Addition on Flowability, Strength and Transport Properties of Ultra High Performance Concrete. Mater. Des. 2014, 59, 1–9. [Google Scholar] [CrossRef]
  44. JGJ/T70-2009; Standard for Test Method of Performance on Building Mortar Construction Ministry of China. China Architecture & Building Press: Beijing, China, 2009.
  45. ASTM D4543; Standard Practices for Preparing Rock Core as Cylindrical Test Specimens and Verifying Conformance to Dimensional and Shape Tolerances. ASTM International: West Conshohocken, PA, USA, 2008.
  46. Kolawole, O.; Ispas, I. Interaction between Hydraulic Fractures and Natural Fractures: Current Status and Prospective Directions. J. Pet. Explor. Prod. Technol. 2020, 10, 1613–1634. [Google Scholar] [CrossRef]
  47. Wan, Y.Z.; Liu, Y.W.; Chen, F.F.; Wu, N.Y.; Hu, G.W. Numerical Well Test Model for Caved Carbonate Reservoirs and Its Application in Tarim Basin, China. J. Pet. Sci. Eng. 2018, 161, 611–624. [Google Scholar] [CrossRef]
  48. Aitcin, P.-C. Concrete Structure, Properties and Materials. Can. J. Civ. Eng. 1986, 13, 499. [Google Scholar] [CrossRef]
  49. Song, X.; Guo, Y.; Zhang, J.; Sun, N.; Shen, G.; Chang, X.; Yu, W.; Tang, Z.; Chen, W.; Wei, W.; et al. Fracturing with Carbon Dioxide: From Microscopic Mechanism to Reservoir Application. Joule 2019, 3, 1913–1926. [Google Scholar] [CrossRef]
  50. Guo, W.; Guo, Y.; Yang, H.; Wang, L.; Liu, B.; Yang, C. Tensile Mechanical Properties and AE Characteristics of Shale in Triaxial Brazilian Splitting Tests. J. Pet. Sci. Eng. 2022, 219, 111080. [Google Scholar] [CrossRef]
  51. Yang, H.; Guo, Y.; Wang, L.; Bi, Z.; Guo, W.; Zhao, G.; Yang, C. Study on the Stimulation Effectiveness Evaluation of Large-Scale Hydraulic Fracturing Simulation Experiment Based on Optical Scanning Technology. SPE J. 2022, 27, 2941–2959. [Google Scholar] [CrossRef]
  52. Keshavarzi, R.; Mohammadi, S. A New Approach for Numerical Modeling of Hydraulic Fracture Propagation in Naturally Fractured Reservoirs. In Proceedings of the SPE/EAGE European Unconventional Resources Conference and Exhibition, Vienna, Austria, 20–22 March 2012. [Google Scholar]
  53. Dahi Taleghani, A.; Gonzalez-Chavez, M.; Yu, H.; Asala, H. Numerical Simulation of Hydraulic Fracture Propagation in Naturally Fractured Formations Using the Cohesive Zone Model. J. Pet. Sci. Eng. 2018, 165, 42–57. [Google Scholar] [CrossRef]
  54. Haimson, B.C.; Charles, F. Initiation and Extension of Hydraulic Fractures in Rocks. SPE J. 1967, 7, 310–318. [Google Scholar] [CrossRef]
  55. Naghi, A.; Kamran, D. Experimental Investigation of Hydraulic Fracture Propagation in Fractured Blocks. Bull. Eng. Geol. Environ. 2014, 74, 887–895. [Google Scholar] [CrossRef]
  56. Guo, T.; Zhang, S.; Qu, Z.; Zhou, T.; Xiao, Y.; Gao, J. Experimental Study of Hydraulic Fracturing for Shale by Stimulated Reservoir Volume. Fuel 2014, 128, 373–380. [Google Scholar] [CrossRef]
  57. Zhang, X.; Lu, Y.; Tang, J.; Zhou, Z.; Liao, Y. Experimental Study on Fracture Initiation and Propagation in Shale Using Supercritical Carbon Dioxide Fracturing. Fuel 2017, 190, 370–378. [Google Scholar] [CrossRef]
  58. Grosse, C.U.; Ohtsu, M. Acoustic Emission Testing: Basics for Research-Applications in Civil Engineering; Springer Nature: Berlin/Heidelberg, Germany, 2008. [Google Scholar]
  59. Wu, S.; Ge, H.; Wang, X.; Meng, F. Shale Failure Processes and Spatial Distribution of Fractures Obtained by AE Monitoring. J. Nat. Gas Sci. Eng. 2017, 41, 82–92. [Google Scholar] [CrossRef]
  60. Li, Y.; Wang, Y.; Cheng, X.; Che, M.; Zhang, F.; Peng, J. Propped Fracturing in High Temperature Deep Carbonate Formation. In Proceedings of the SPE Hydraulic Fracturing Technology Conference, The Woodlands, TX, USA, 19–21 January 2009. [Google Scholar]
  61. Dehghan, A.N.; Goshtasbi, K.; Ahangari, K.; Jin, Y. The Effect of Natural Fracture Dip and Strike on Hydraulic Fracture Propagation. Int. J. Rock Mech. Min. Sci. 2015, 75, 210–215. [Google Scholar] [CrossRef]
  62. Gu, Q.; Hoo, K.A. Model-Based Closed-Loop Control of the Hydraulic Fracturing Process. Ind. Eng. Chem. Res. 2015, 54, 1585–1594. [Google Scholar] [CrossRef]
  63. Navarrete, R.C.; Miller, M.J.; Gordon, J.E. Laboratory and Theoretical Studies for Acid Fracture Stimulation Optimization. In Proceedings of the SPE Permian Basin Oil and Gas Recovery Conference, Midland, TX, USA, 23–26 March 1998; pp. 231–248. [Google Scholar] [CrossRef]
  64. Ying, X.; Yuan, X.; Yadong, Z.; Ziyi, F. Study of Gel Plug for Temporary Blocking and Well-Killing Technology in Low-Pressure, Leakage-Prone Gas Well. SPE Prod. Oper. 2021, 36, 234–244. [Google Scholar] [CrossRef]
  65. Siddhamshetty, P.; Wu, K.; Kwon, J.S.-I. Optimization of Simultaneously Propagating Multiple Fractures in Hydraulic Fracturing to Achieve Uniform Growth Using Data-Based Model Reduction. Chem. Eng. Res. Des. 2018, 136, 675–686. [Google Scholar] [CrossRef]
  66. Cote, A.; Cameron, N.; Grunberg, D. When Is There Too Much Fracture Intensity? In Proceedings of the SPE Annual Technical Conference and Exhibition, Calgary, AB, Canada, 30 September–2 October 2019. [Google Scholar] [CrossRef]
  67. Huang, C.-H.; Zhu, H.-Y.; Wang, J.-D.; Han, J.; Zhou, G.-Q.; Tang, X.-H. A FEM-DFN Model for the Interaction and Propagation of Multi-Cluster Fractures during Variable Fluid-Viscosity Injection in Layered Shale Oil Reservoir. Pet. Sci. 2022, 19, 2796–2809. [Google Scholar] [CrossRef]
  68. Aud, W.W.; Wright, T.B.; Cipolla, C.L.; Harkrider, J.D. The Effect of Viscosity on Near-Wellbore Tortuosity and Premature Screenouts. In Proceedings of the SPE Annual Technical Conference and Exhibition, New Orleans, LA, USA, 25–28 September 1994. [Google Scholar]
  69. Zoveidavianpoor, M.; Samsuri, A.; Shadizadeh, S.R. Well Stimulation in Carbonate Reservoirs: The Needs and Superiority of Hydraulic Fracturing. Energy Sources, Part A Recover. Util. Environ. Eff. 2013, 35, 92–98. [Google Scholar] [CrossRef]
  70. Siddhamshetty, P.; Kwon, J.S.-I.; Liu, S.; Valkó, P.P. Feedback Control of Proppant Bank Heights during Hydraulic Fracturing for Enhanced Productivity in Shale Formations. AIChE J. 2018, 64, 1638–1650. [Google Scholar] [CrossRef]
  71. Jiang, T.; Bian, X.; Wang, H.; Li, S.; Jia, C.; Liu, H.; Sun, H. Volume Fracturing of Deep Shale Gas Horizontal Wells. Nat. Gas Ind. B 2017, 4, 127–133. [Google Scholar] [CrossRef]
Figure 1. Distribution of a typical fracture–cavity carbonate reservoirs (quoted from Loucks [3]).
Processes 12 00660 g001
Figure 2. The distribution schemes for simplified cavity clusters. (a) Single cavities, (b) cavities accompanied by a fracture at a 0° angle, (c) cavities accompanied by a fracture at a 30° angle and (d) cavities accompanied by a fracture at a 45° angle (note: the green circle represents the wellbore; the orange circle represents the cavity).
Processes 12 00660 g002
Figure 3. The schematic diagram of the improved mold and the sample preparation process. (a) The simulated NCs’ and NFs’ preparation, (b) the fixing of prefabricated cavities and fractures, (c) the pouring and vibration of the mortar mix, (d) the prefabrication of the fracturing wellbore, (e) the demolding and curing of samples and (f) the schematic diagram of the improved mold.
Processes 12 00660 g003
Figure 4. Flow chart of scanning stage, preprocessing stage and analysis stage of hydraulic fracture morphology [51].
Processes 12 00660 g004
Figure 5. Fracture morphology and 3D visualization of the samples with (a) single cavities, (b) cavities accompanied by a fracture at a 0° angle, (c) cavities accompanied by a fracture at a 30° angle and (d) cavities accompanied by a fracture at a 45° angle (adapted from Yang et al. [39]).
Processes 12 00660 g005
Figure 6. Fracturing curves of the samples with 4 types of cavity cluster distributions: (a) single cavities, (b) cavities accompanied by a fracture at a 0° angle, (c) cavities accompanied by a fracture at a 30° angle and (d) cavities accompanied by a fracture at a 45° angle.
Processes 12 00660 g006
Figure 7. The variations in breakdown pressure and closure pressure with stress difference for the samples. (a) Single cavities, (b) cavities accompanied by a fracture at a 0° angle, (c) cavities accompanied by a fracture at a 30° angle and (d) cavities accompanied by a fracture at a 45° angle. Note: PB refers to the breakdown pressure, PC refers to the closure pressure, σh represents the minimum horizontal principal stress and the red arrow shows higher closure pressure at the Kh of 0.22.
Processes 12 00660 g007
Figure 8. The 3D fracture network complexity for the samples with 4 types of cavity cluster distributions (note: the arrow indicates that samples featuring cavities accompanied by a fracture at a 0°/30° angle have higher fracture network complexity).
Processes 12 00660 g008
Figure 9. The variations in AE signals and pump pressure over time for six typical samples. (a) A-1 (single cavity, Kh = 0.08); (b) A-3 (single cavity, Kh = 0.40); (c) B-3 (cavity cluster with cavity and fracture (0°), Kh = 0.40); (d) C-2 (cavity cluster with cavity and fracture (30°), Kh = 0.22); (e) D-2 (cavity cluster with cavity and fracture (45°), Kh = 0.22); (f) D-4 (cavity cluster with cavity and fracture (45°), Kh = 0.65). Note: Point A is the initial breakdown stage, point B is the further propagation stage and point C is stopping injection stage.
Processes 12 00660 g009
Figure 10. Schematic diagram of variable fluid viscosity conception.
Processes 12 00660 g010
Table 1. Physical properties of hardened mortar mixes (note: data in table indicate average value).
Mass Ratio of Cement and Quartz SandDensity (g/cm3)Unconfined Compressive Strength (MPa)Young’s Modulus (GPa)Tensile Strength (MPa)
1:12.2664.0712.545.08
1:1.52.1258.5310.454.85
1:22.0742.837.644.79
1:2.52.0133.485.423.82
1:31.9820.784.962.36
Table 2. The schemes of horizontal stress difference coefficient.
TypeKh1σH (MPa)σh (GPa)σv (MPa)Remark
-0.25170136190Measured in situ stress well
10.08282632
20.22282332
30.40282032Reduction by the same proportion
40.65281732
1 Note: The horizontal stress difference coefficient Kh = (σHσh)/σh, where σH and σh represent the maximum and minimum horizontal principal stresses, respectively, and σv denotes the vertical principal stress.
Table 3. Summary of the HF-NF and HF-NC interactions and fracture morphology in all samples.
NumberKh1HF-NF InteractionHF-NC InteractionFracture Morphology
Primary SideSecondary SidePrimary SideSecondary Side
A-10.08--BypassingLimited propagationNon-planar propagation
A-20.22--ArrestingLimited propagationSome larger non-planar deflections in the vertical direction
A-30.40--CrossingLimited propagationA larger non-planar deflection
A-40.65--CrossingArrestingMinor deflection and tends to planar propagation
B-10.08BypassingLimited propagationArrestingLimited propagationClose to planar propagation
B-20.22BypassingBypassingCrossingBypassingNon-planar propagation
B-30.40OpeningBypassingCrossingArrestingClose to planar propagation
B-40.65OpeningOpeningCrossingArrestingPlanar propagation
C-10.08OpeningOpeningCrossingArrestingForm a new fracture after initiating in the cavity
C-20.22OpeningOpeningCrossingArrestingForm complicated multi-fractures before and after encountering the cavity
C-30.40OpeningCrossingCrossingBypassingSome larger non-planar deflections in the vertical direction
C-40.65OpeningCrossingCrossingBypassingForm a new fracture after initiating in the cavity
D-10.08OpeningOpeningCrossingArrestingForm a new fracture after initiating in the cavity
D-20.22OpeningLimited propagationCrossingLimited propagationForm a new fracture after initiating in the cavity
D-30.40CrossingOpeningBypassingArrestingClose to planar propagation
D-40.65CrossingOpeningBypassingArrestingClose to planar propagation
1 Note: The horizontal stress difference coefficient Kh = (σHσh)/σh, where σH and σh represent the maximum and minimum horizontal principal stresses, respectively.
Disclaimer/Publisher’s Note: The statements, opinions and data contained in all publications are solely those of the individual author(s) and contributor(s) and not of MDPI and/or the editor(s). MDPI and/or the editor(s) disclaim responsibility for any injury to people or property resulting from any ideas, methods, instructions or products referred to in the content.

