Article

High-Performance Defect Detection Methods for Real-Time Monitoring of Ceramic Additive Manufacturing Process Based on Small-Scale Datasets

1
Key Laboratory of Space Manufacturing Technology (SMT), Technology and Engineering Center for Space Utilization, Chinese Academy of Sciences, Beijing 100094, China
2
University of Chinese Academy of Sciences, Beijing 100049, China
3
Changchun Institute of Optics, Fine Mechanics and Physics, Key Laboratory of Optical System Advanced Manufacturing Technology, Chinese Academy of Sciences, Changchun 130033, China
*
Authors to whom correspondence should be addressed.
Processes 2024, 12(4), 633; https://doi.org/10.3390/pr12040633
Submission received: 28 February 2024 / Revised: 18 March 2024 / Accepted: 21 March 2024 / Published: 22 March 2024

Abstract

:
Vat photopolymerization is renowned for its high flexibility, efficiency, and precision in ceramic additive manufacturing. However, due to the impact of random defects during the recoating process, ensuring the yield of finished products is challenging. At present, the industry mainly relies on manual visual inspection to detect defects; this is an inefficient method. To address this limitation, this paper presents a method for ceramic vat photopolymerization defect detection based on a deep learning framework. The framework innovatively adopts a dual-branch object detection approach, where one branch utilizes a fully convolution network to extract the features from fused images and the other branch employs a differential Siamese network to extract the differential information between two consecutive layer images. Through the design of the dual branches, the decoupling of image feature layers and image spatial attention weights is achieved, thereby alleviating the impact of a few abnormal points on training results and playing a crucial role in stabilizing the training process, which is suitable for training on small-scale datasets. Comparative experiments are implemented and the results show that using a Resnet50 backbone for feature extraction and a HED network for the differential Siamese network module yields the best detection performance, with an obtained F1 score of 0.89. Additionally, as a single-stage defect object detector, the model achieves a detection frame rate of 54.01 frames per second, which meets the real-time detection requirements. By monitoring the recoating process in real-time, the manufacturing fluency of industrial equipment can be effectively enhanced, contributing to the improvement of the yield of ceramic additive manufacturing products.

1. Introduction

Ceramics play a crucial role in various high-tech fields due to their excellent physical and chemical properties [1]. Traditional methods for ceramic component manufacturing mainly rely on molds, resulting in complex processing steps and long production cycles. Moreover, traditional ceramic manufacturing cannot produce parts with intricate internal structures, which limits its applications in high-performance ceramics. Additive manufacturing (AM), as an emerging technology, can directly construct part prototypes layer by layer based on three-dimensional (3D) digital models. This approach offers the advantages of efficiently creating intricate internal structures [2], reducing part weight, and enhancing material utilization, making it particularly advantageous in weight-sensitive applications. Among all the vat photopolymerization-based ceramic AM processes, digital light processing (DLP) and stereolithography (SLA) are more prominent. In comparison with the line scanning based SLA, DLP is more efficient, since DLP can directly project specific-shaped light onto the manufacturing surface. A slurry consisting of fine ceramic powder mixed with photosensitive resin is utilized as the raw material. Upon exposure to light at a specific wavelength, the resin in the slurry undergoes a curing reaction, simultaneously solidifying the embedded ceramic solid powder and accumulating layer by layer to manufacture the part.
However, ceramic AM technologies, represented by DLP, face significant challenges in quality control. During the layer-by-layer formation process, issues like agglomeration and poor fluidity within the slurry may lead to defects such as bubbles, pits, or even material shortage in the manufactured layers. These defects result in uneven material distribution within the part and significantly affect the property and yield of finished products in industrial applications. With the trend of upscaling for ceramic AM, the construction time of the green body increases dramatically, while the tolerance for defects in large parts becomes even more stringent because even minor defects may cause catastrophic damage. Currently, the level of automation in ceramic AM equipment is inadequate and process monitoring mainly relies on manual visual inspection, which heavily depends on personal experience and lacks efficient defect detection methods for the entire manufacturing process.
To address this issue, this study employs machine vision (MV) for real-time monitoring of the DLP recoating process. The optical images are captured using a high-resolution industrial camera and are analyzed using a deep learning (DL) model. Through image analysis, various potential defects during the recoating process can be recognized. Furthermore, detected defects are compensated and recorded. Considering the multi-image fusion characteristic of the DLP process, the DL model is designed to decouple the feature maps from the attention module. This model includes two independent branches: the first branch focuses on feature extraction from the fusion images, while the second branch utilizes a differential Siamese network to compute the difference between the current and previous recoating images, which represent spatial attention weights of the fused image. Siamese networks are commonly used in similarity calculation [3], topographic change [4], and target tracking tasks [5], but this study pioneers the application of a differential Siamese network in defect object detection to extract attention weights. The two branches of the framework are uncoupled, and the image attention matrix can enhance the features of the fused image. Furthermore, the design of dual branches can filter out the influence of abnormal points in feature maps, ensuring the stability of the model training process. After feature extraction, the feature maps from different scales are enhanced bidirectionally, and multiple prediction heads are employed to achieve parallel defect predictions for various prediction tasks. Finally, the prediction results from multiple heads are fused using non-maximum suppression. Experimental results demonstrate that the prediction information from different scales can effectively fill the gaps between each other and improve defect detection accuracy. In terms of evaluating defect detection performance, commonly used metrics include accuracy, recall, mean average precision (mAP), and F1 score. Among these, mAP is prone to being influenced by class imbalance. When there are significant differences in the number of defects in each class in multi-class problems, it is difficult to objectively reflect the true situation. On the other hand, the F1 score can comprehensively reflect both accuracy and recall, and it can also convert multi-class problems into binary classification problems. Therefore, the F1 score is chosen as the final evaluation metric for defect detection performance. In evaluating model efficiency, frame rate per second (FPS), which represents the number of images the model can process per second, is used. This metric intuitively demonstrates the computational speed of the model. After defect detection, defect information is used to segment the manufactured model’s slice images, and 3D reconstruction techniques are employed to perform reverse modeling of the DLP process. The modeling results visually reflect internal defect information of ceramic AM prototypes. Practical applications show that this method can assist manufacturing equipment in making decisions and promptly rejecting the detected defects. As for the defects which cannot be solved automatically, their information will be recorded for quality traceability. This information provides significant guidance for subsequent processes.
In summary, the main contributions of this study include the following:
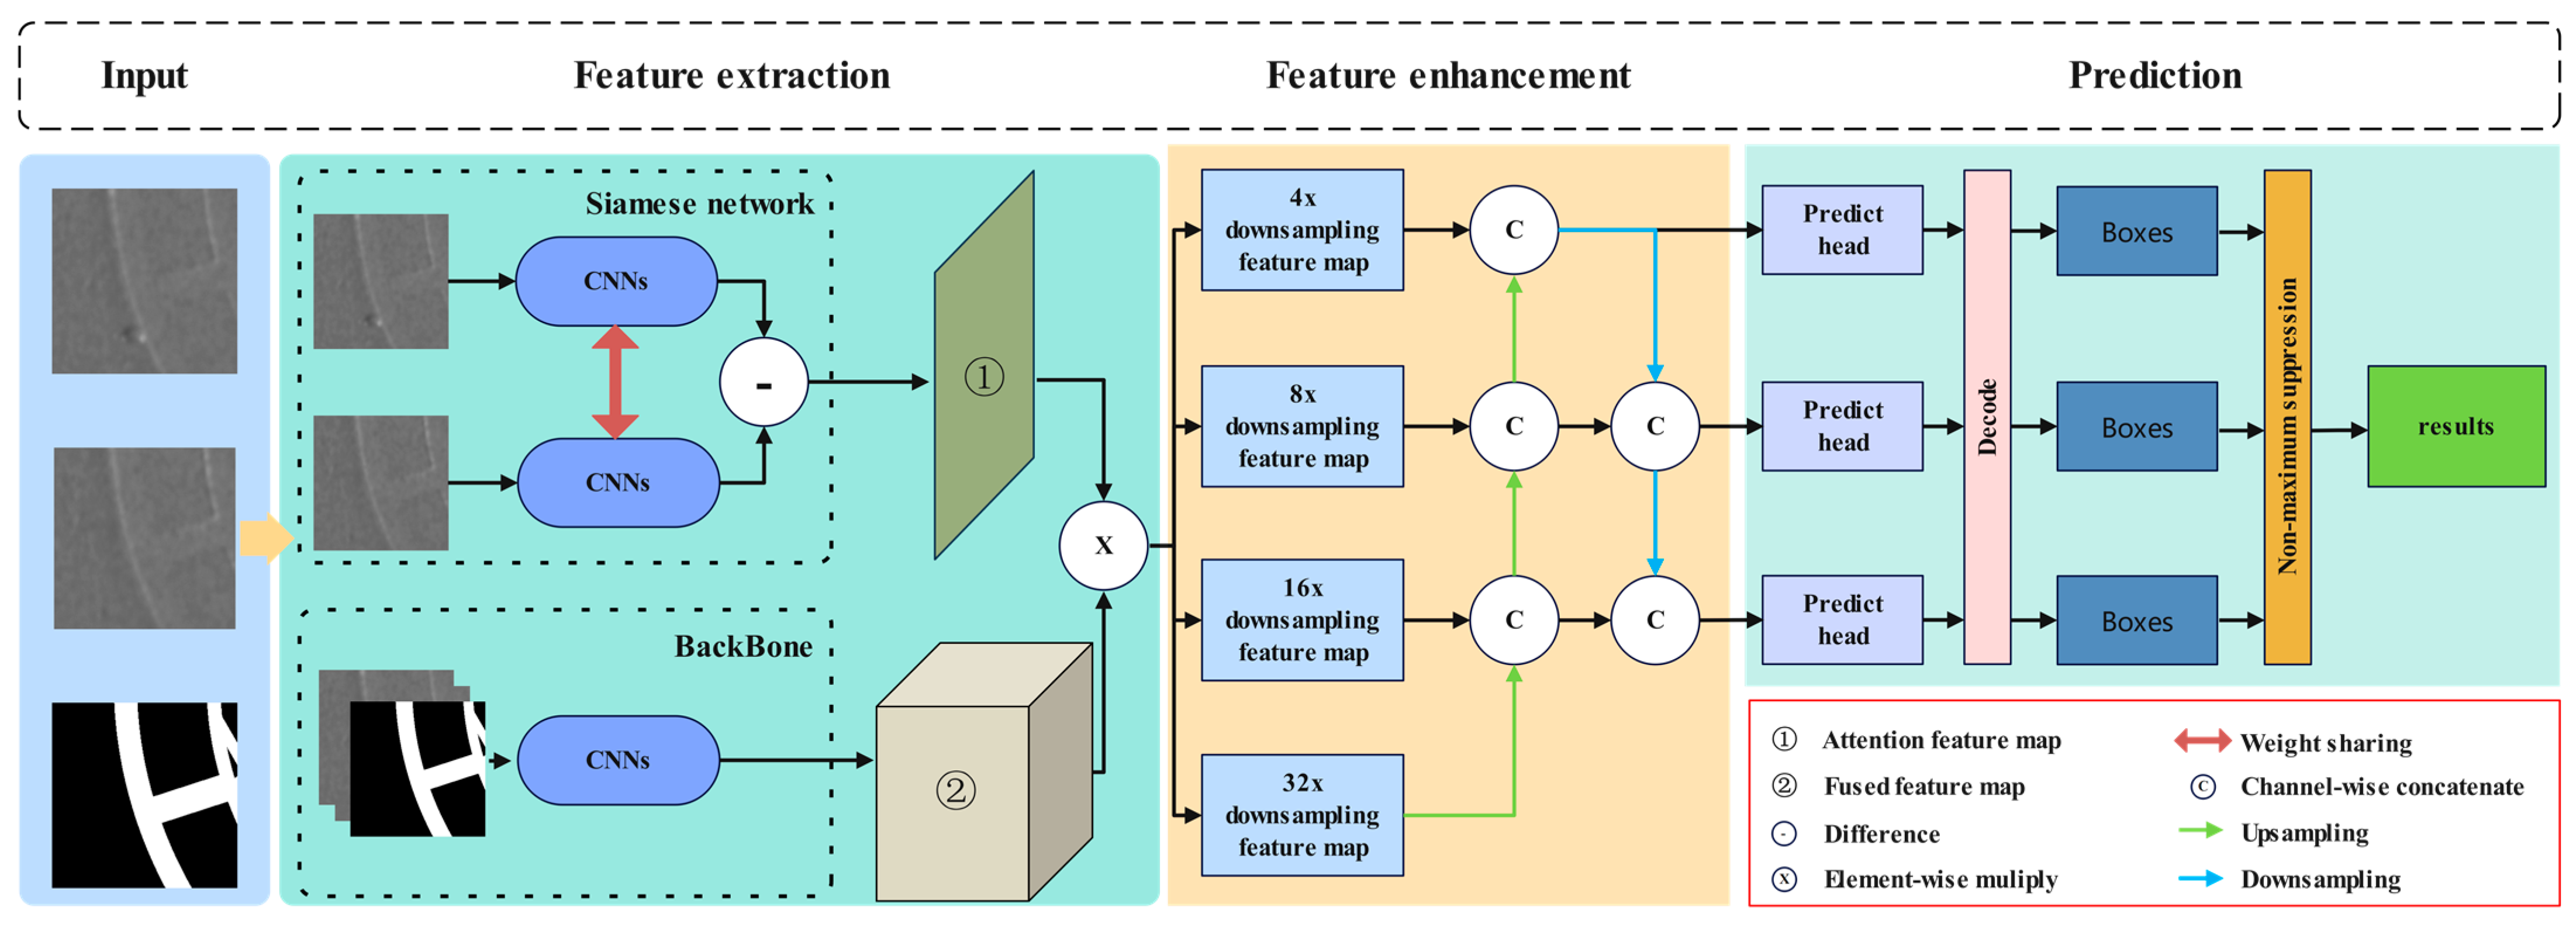
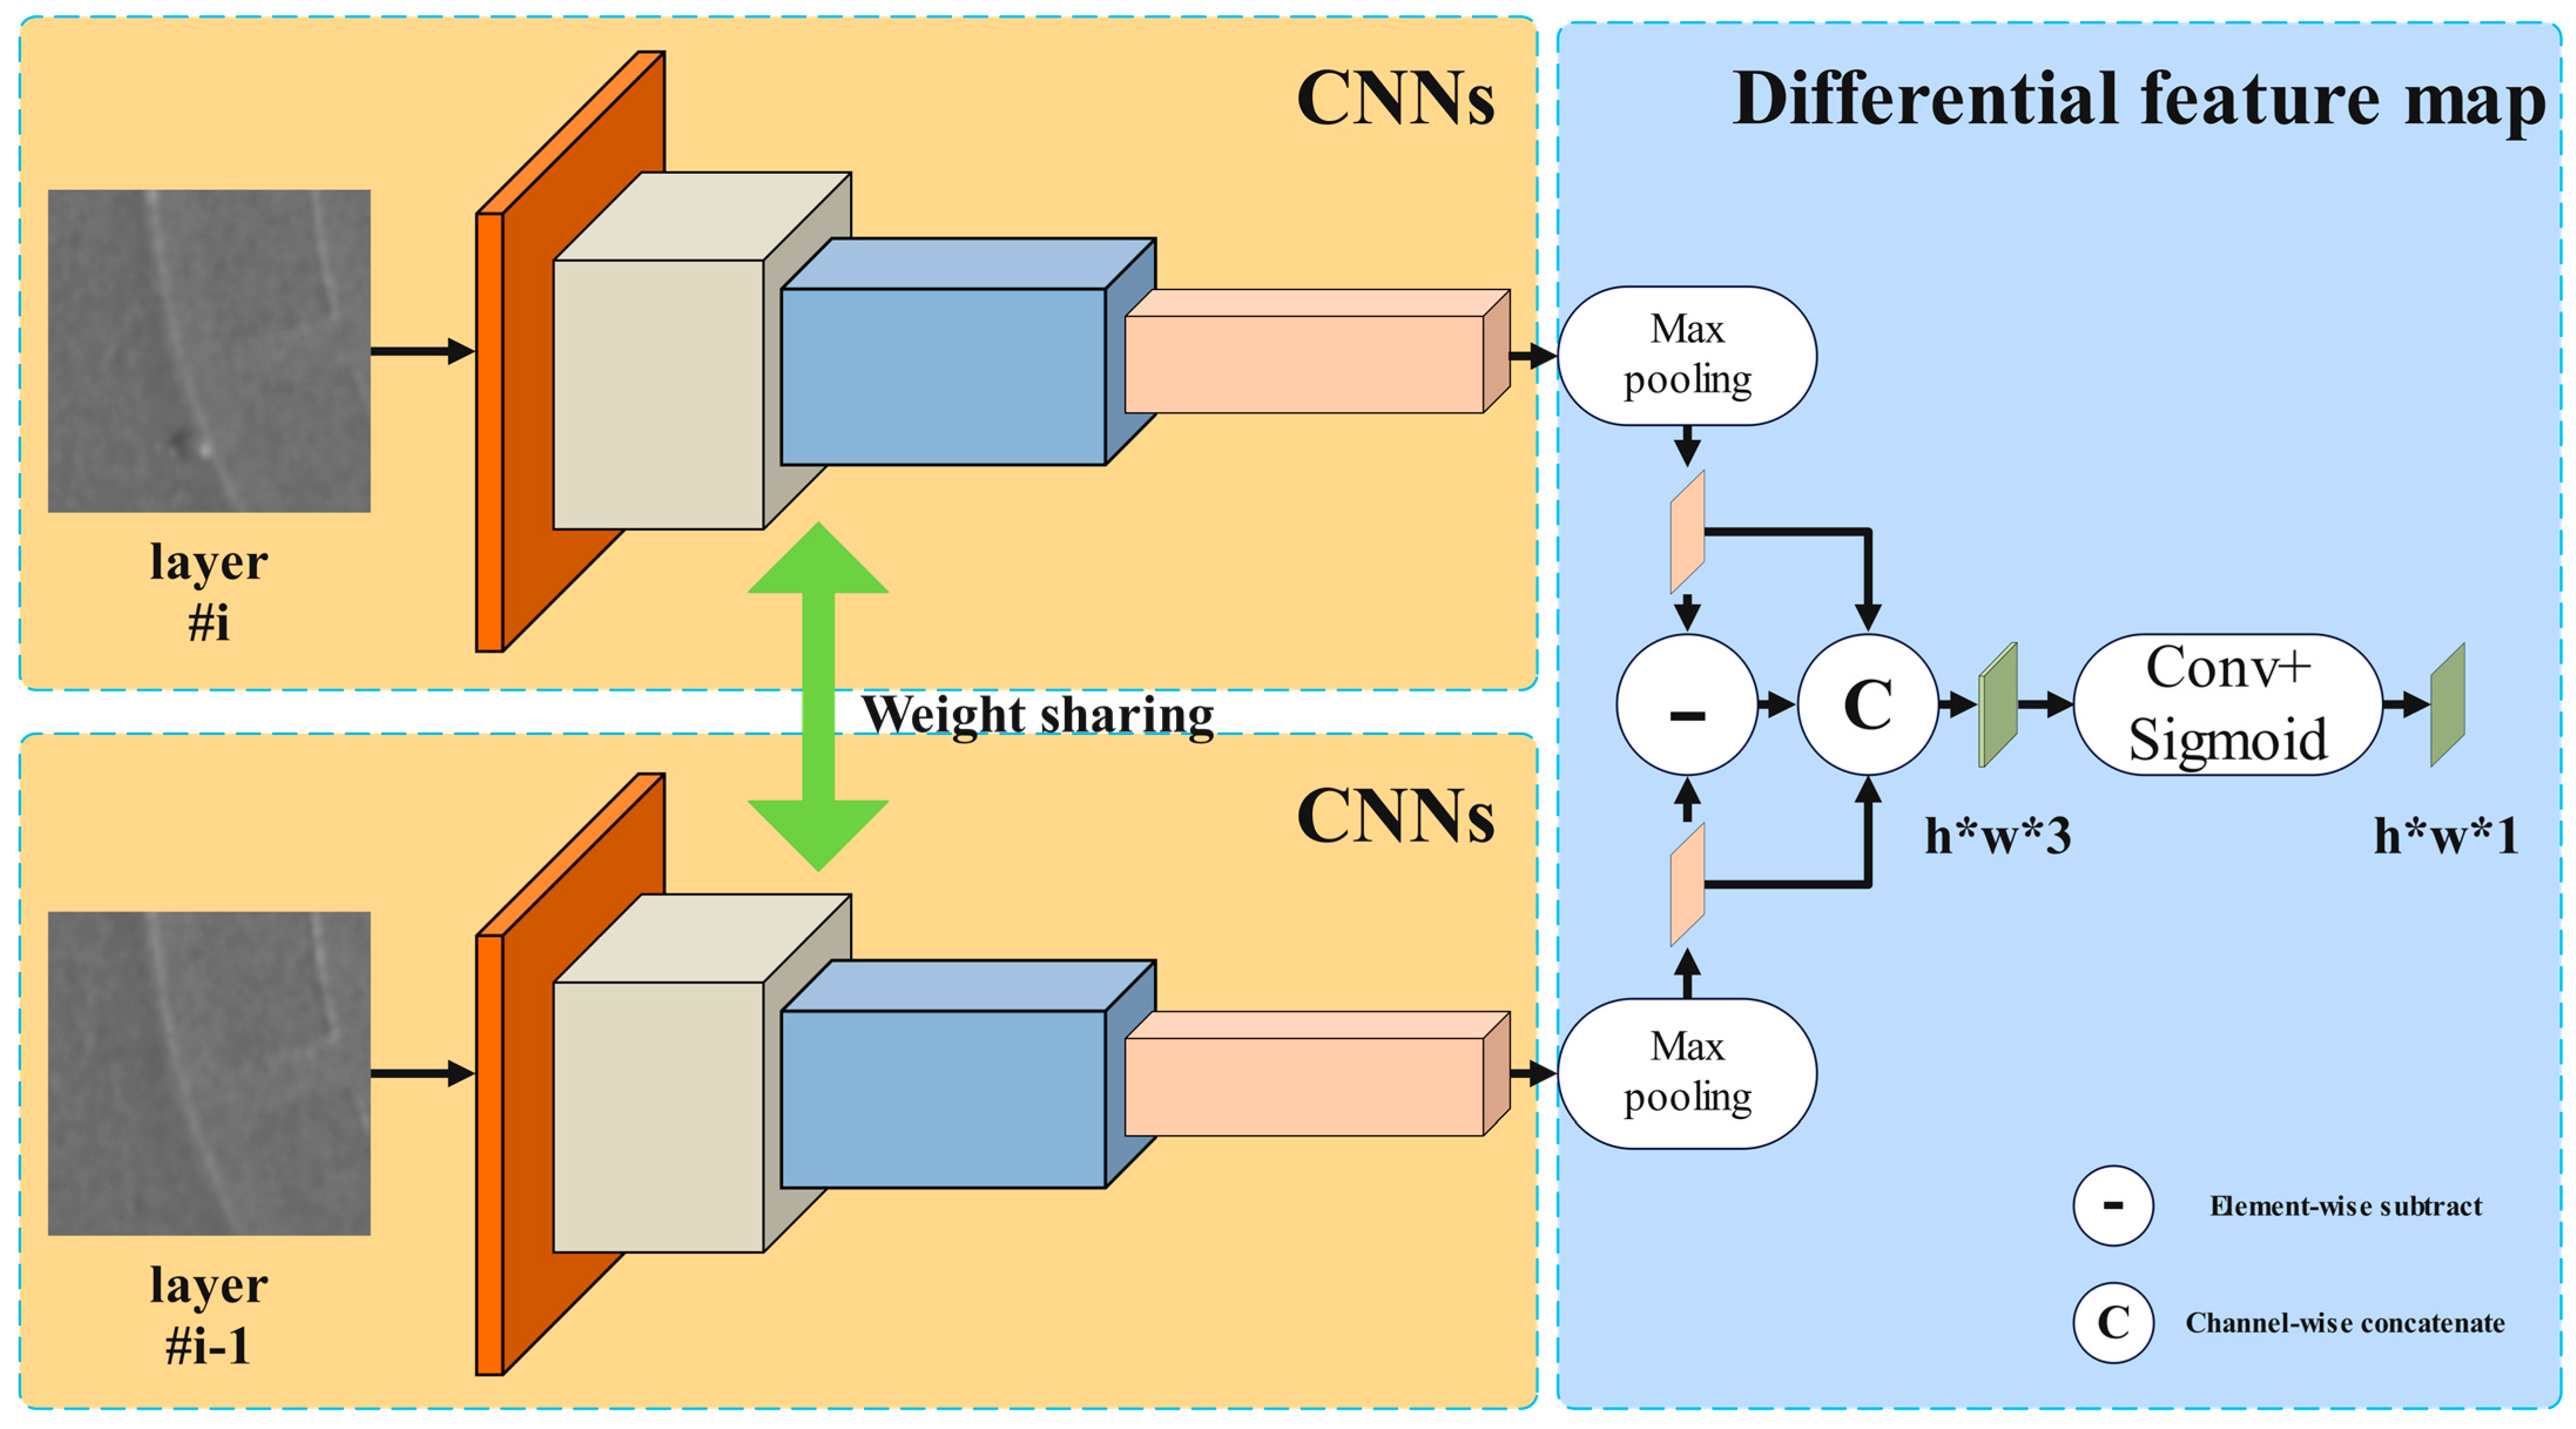
  • A dual-branch object detection model is proposed based on the characteristics of multi-image fusion. In the first branch, two layers of recoating images are put into a differential Siamese network to extract images differences. Two layers of recoating images and one layer of slice image are fused as a three-channel image and put into another branch. Through this operation, multiple feature extraction is achieved.
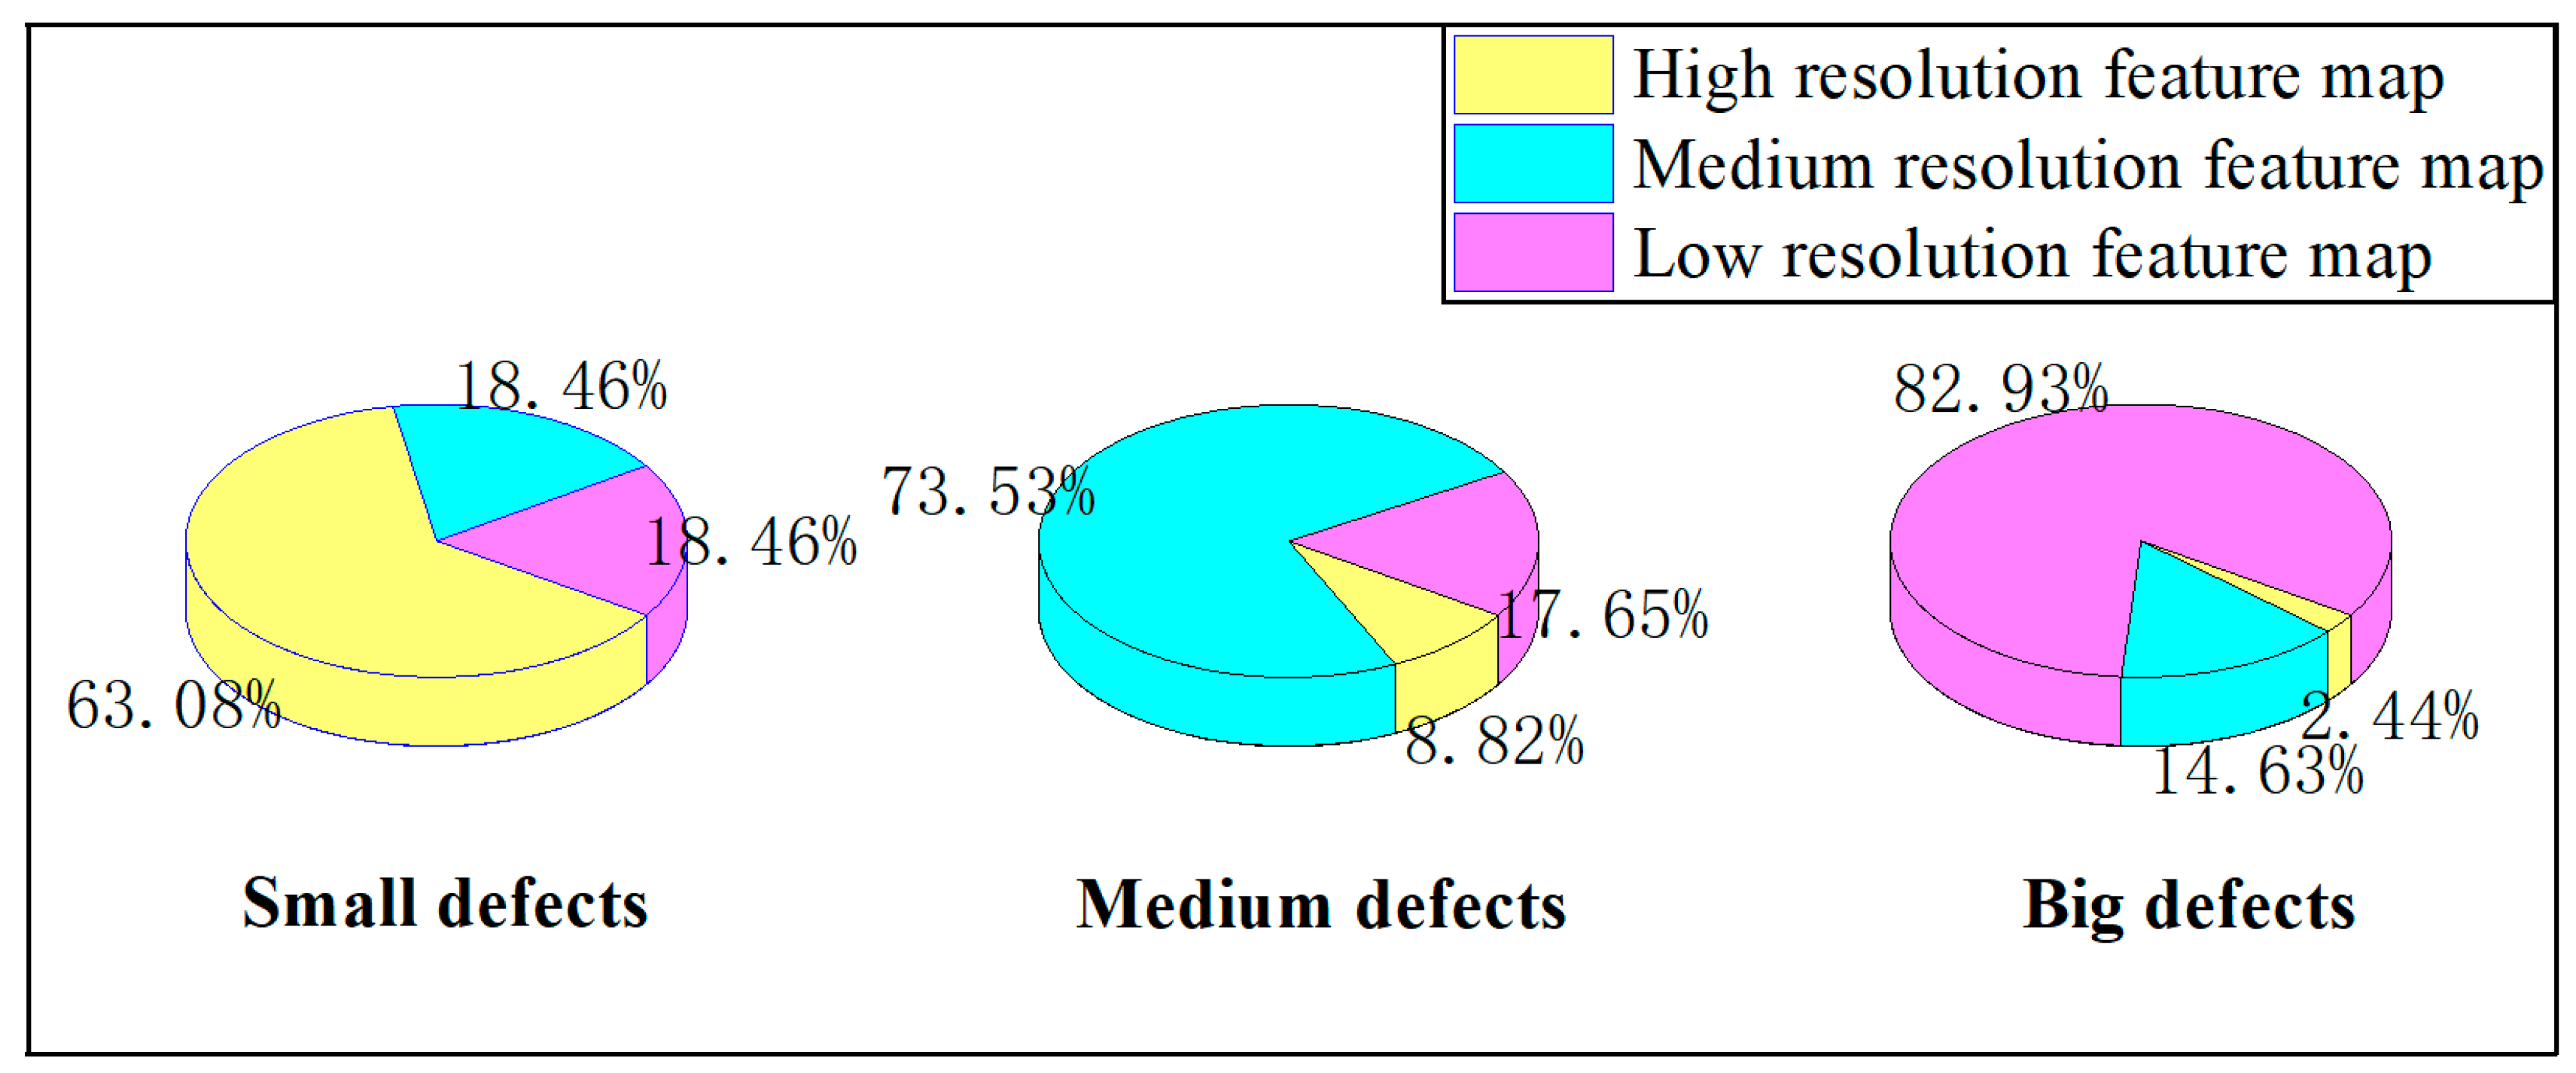
  • By employing the approach of parallel prediction with multiple prediction heads in this task, each prediction head is responsible for predicting defect targets of different scales. Subsequently, duplicate results are filtered through the non-maximum suppression principle. This method significantly improves the efficiency of the framework.
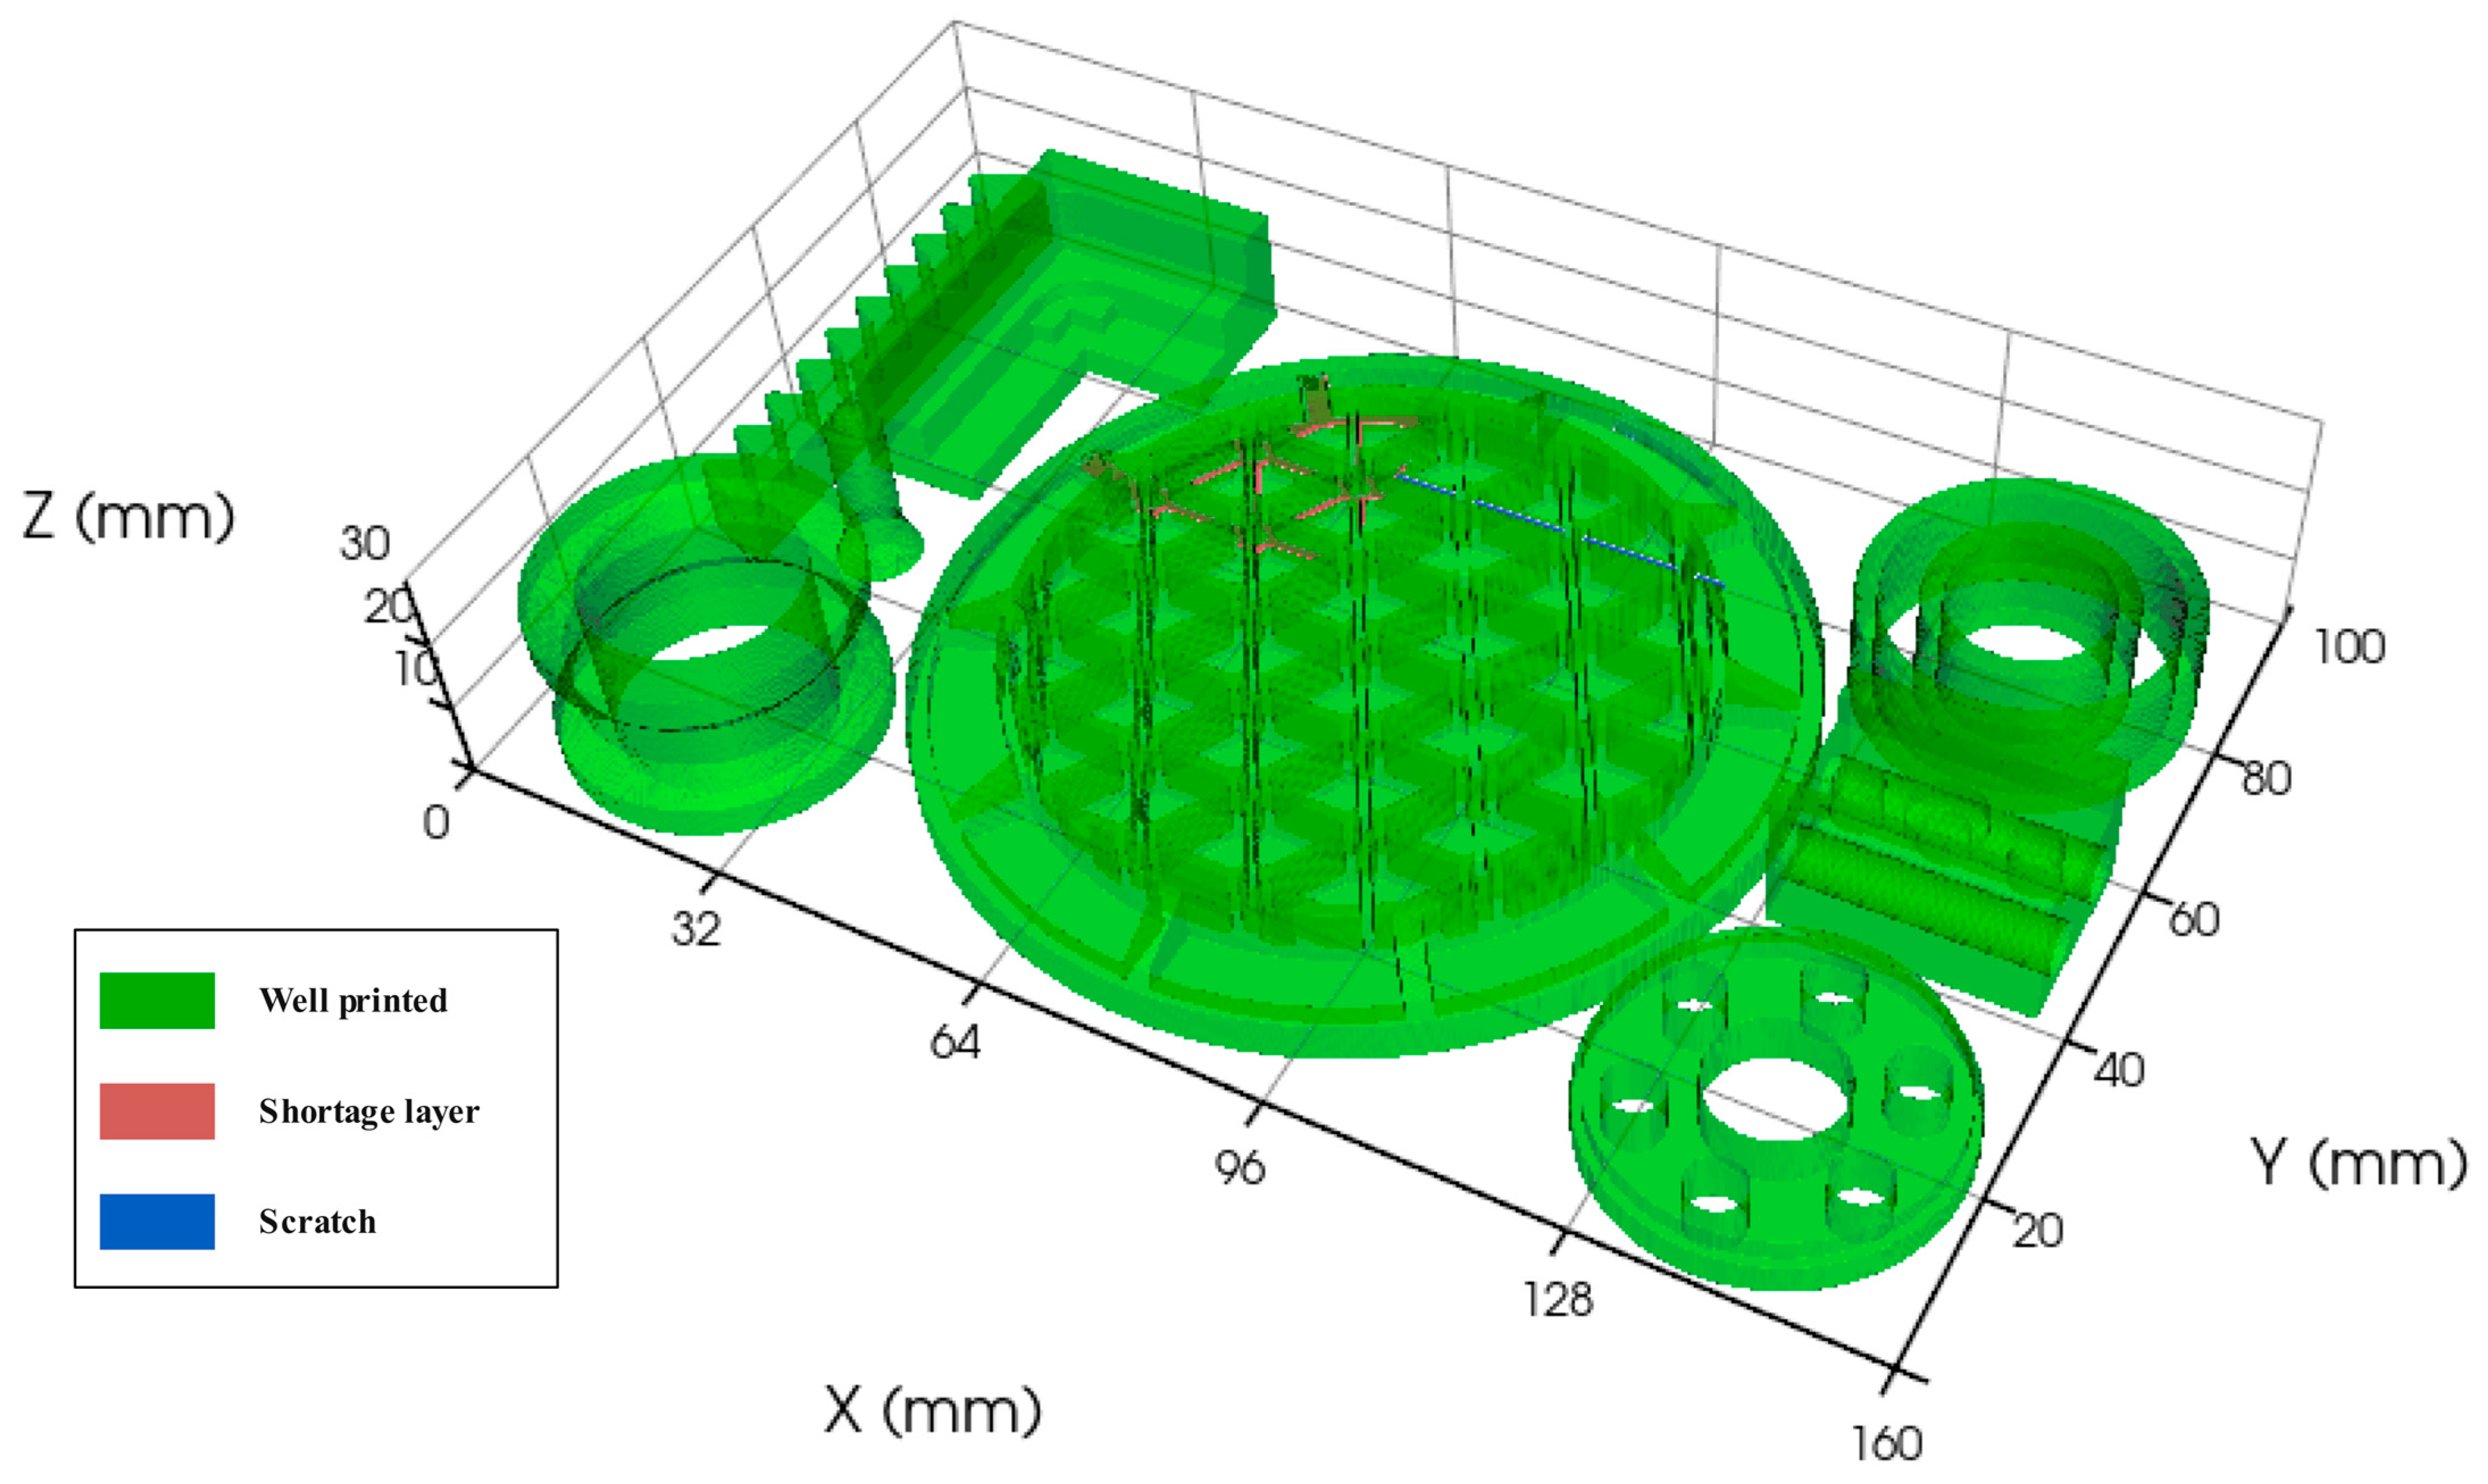
  • Based on the detection results and 3D reconstruction technology, quality close-up control of the DLP manufacturing process is achieved, which can be used to guide the subsequent processes.
The organization of this paper is as follows: Section 2 provides a review of the relevant latest technologies, Section 3 introduces the details of the dual-branch ceramic AM recoating defect method, and Section 4 presents the experiment results and discussions. In the end, Section 5 summarizes this study and outlines future directions.

2. Related Work

Currently, the primary methods used to improve the yield of additive manufacturing products mainly include online monitoring, material modification, and process optimization. Among them, process monitoring focuses on detecting and eliminating manufacturing defects in real time. Both machine learning (ML) techniques and traditional defect detection methods are applied in the monitoring of AM processes [6,7], and ML has demonstrated significantly stronger performance compared to traditional methods [8,9]. Since ceramic AM and metal AM share many similarities, research findings in metal AM can be regarded as a reference for ceramic AM. Research related to process monitoring in metal AM began earlier than those in ceramic. For example, Jacobsmühlen [10] collected surface images of the manufacturing process and used various operators to extract image features, which were then input into different models for defect classification. However, the slow calculation speed of these operators makes them unsuitable for real-time monitoring scenarios. Zhang [11] proposed a method using structured light projection to reconstruct the 3D information to determine whether the manufacturing process was abnormal. Yet, this method requires high precision, resulting in a detection range of only 28 × 15 mm2, limiting its efficiency for monitoring the production of large parts. Li [12] similarly utilized stripe projection technology to measure the evenness of the powder bed and the manufacturing platform after sintering. They presented measurement results in the form of height maps, which provide defect information for both the powder bed and the sintered layer. Based on a similar approach, Wang [13] integrated stereo vision technology with stripe projection to measure the 3D information of the manufacturing surface in metal AM. Xiong [14] used virtual stereo vision to measure the molten pool morphology during gas tungsten arc welding (GTAW), achieving stable AM process by real-time adjustment of control parameters. While these methods involving MV for measuring the 3D morphology of the manufacturing surface are effective, they are complex in terms of both system design and algorithm. Moreover, the 3D information of the manufacturing surface does not always directly reflect defects, thus limiting the applicability of such methods. Scrime [15] introduced an improved MsCNN model based on AlexNet [16], which involved cropping large images of the manufacturing surface into 900 × 900 pixel images, followed by segmenting these images into multiple 25 × 25 sub-images. These sub-images were individually classified to achieve defect recognition and coarse localization. This method directly utilizes information from 2D images, filtering out the influence of 3D manufacturing surface information. However, this method transforms the defect detection task into an image classification task and relies solely on image segmentation for localization, resulting in relatively coarse performance. Gaikwad [17] used an optical camera to record images of each layer during the production of titanium alloy parts in different building orientations. Subsequently, they analyzed the quality of parts using X-ray analysis and established a mapping relationship between images and part quality using a deep leaning network. Similarly, Liu [18] employed a DL model to predict 3D information from 2D images of the manufacturing surface, which eliminating the need for complex 3D scanning measurements. However, this method may not perform well on surfaces with significant fluctuations. Bevans [19] utilized various types of optical sensors to capture images during the manufacturing process of Inconel 718 nickel alloy parts. By analyzing spectral images, they detected defects at part level, medium scale, and micro scale. Nevertheless, the complexity of this method and the use of thermal signals make it challenging to apply in non-heating manufacturing processes. Nguyen [20] monitored the recoating process using an optical camera and employed a DL model built by MATLAB (R2012a, MathWorks) to detect defects in each layer. Repossini [21] used a high-speed camera mounted obliquely to capture real-time images of the molten pool. By analyzing the stability of the model pool, the evenness of the powder bed could be indirectly inferred. Similarly, Rodrigues [22] also employed this technique and found that it could only indirectly reflected the evenness of the powder bed and lacked the ability to compensate for defects promptly upon detections.
In terms of manipulation of material and process, the focus of research is on adjusting raw materials and process parameters to acquire better performance of AM parts. Li [23] conducted experiments and finite element simulations to delve into the effects of thickness and powder size on the flow properties of slurry during the recoating process. They proposed optimizing the print layer thickness to control the impact of the turbulent zone in front of the scraper. This method, based on the manipulation of materials and processes, partially addressed the recoating issues of ceramic slurry. Zhao [24] performed finite element analysis on interlayer bonding during the DLP process and proposed a method to optimize the interlayer bonding force of printed parts. However, this method’s control over the recoating process is not intuitive and may not effectively address sudden or random defects. Other research on defect detection in ceramic AM mainly focuses on non-destructive testing of ceramic parts. Chen [25] used laser speckle photometry (LSP) to observe stress concentration within ceramic parts. Coherence tomography (CT) technology has been extensively applied in non-destructive testing for metal AM [26], but it is less common in the ceramic manufacturing field. Su [27] studied internal defects in alumina ceramics, while Saâdaoui [28] used X-ray coherence tomography (XCT) technology to observe zirconia parts and establish the inherent relationship between predicted strength and effective strength. Diener [29] utilized XCT technology to study the porous structure of silicon nitride parts created through direct writing. Non-destructive testing methods are convenient and visual for detecting internal defects in ceramic parts. However, these methods cannot achieve in situ testing results. In summary, typical research achievements in the field of AM process control are shown in Table 1.
In defect detection of metal AM, two primary methods were adopted. The first one is the direct measurement of 3D powder bed information to reflect its evenness. The other approach is to indirectly assess the uniformity of the powder by observing the stability of the molten pool during the metal AM process. While ceramic AM shares significant process similarities with metal AM, there are notable differences in their surface characteristics. In metal AM, regular metal powders are utilized, which allows for a relatively flat powder bed surface. This enables accurate representation of surface defects via 3D information. Conversely, ceramic AM employs a kind of high-viscosity paste, which is a mixture of solid ceramic powders, liquid resin, and photosensitive initiators. Due to the influence of surface tension, this mixture can form significant bulges and deformations, sometimes exceeding the manufacturing plane by 3 to 4 mm. As a result, the methods relying on 3D morphology measurements are no longer applicable for monitoring the process of ceramic AM. The dynamic and fluid nature of the ceramic slurry makes it challenging to assess surface evenness using traditional 3D measurement techniques.
Based on an investigation of existing research achievements, it is evident that there are certain deficiencies in the quality control aspects of ceramic AM:
  • Insufficient research: Currently, there is a lack of comprehensive research on defect detection of ceramic AM. Most of the existing literature focuses primarily on material modification or non-destructive testing of finished components, with limited emphasis on direct monitoring of the DLP printing process.
  • Inapplicability of techniques: Despite the similarity of metal AM and DLP, the majority of techniques used for process monitoring in metal AM cannot be directly applied to DLP. Considering the specific materials and process characteristics of ceramic AM, the applicability of existing techniques to DLP process monitoring may be limited.
Therefore, further research and exploration are necessary to enhance the manufacturing quality and efficiency of the ceramic DLP printing process.

3. Methodology

Addressing the aforementioned limitations, this paper proposes an MV-based defect detection method for DLP recoating process. The method involves capturing images of the recoating process with a high-resolution industrial camera and utilizing a DL model to identify defects on the manufacturing surface. By directly analyzing 2D images for defect recognition, this approach can mitigate the influence of height variations on the manufacturing surface. Moreover, it enables real-time and in situ monitoring, enhances equipment intelligence, and improves the data collection method for monitoring the ceramic AM process.

3.1. Model Overview

In this study, defects in the DLP recoating process were categorized into five types: bubble, sunken, scratch, shortage, and collapse. These categories are illustrated in typical images, as shown in Figure 1. Among them, bubble, sunken, and collapse are distinct and directly recognizable in the images. However, scratch and shortage defects may be misidentified as the edges of normally cured printing. To address this issue, the authors employed a multi-image fusion approach. Here is a brief introduction to this method: By merging the adjacent two layers of recoating images and their corresponding slice images, the differences in traces as the same positions in the two layers of images can be compared. This process enables the identification of recoating defects in the images. If a trace that is not present in the recoating image of the previous layer appears in the current layer’s recoating image, then this trace is likely to be caused by recoating defect.
In the field of AM process monitoring, DL has frequently been applied as an efficient method for defect detection tasks. In recent research, the attention mechanism has emerged as a highly useful module to enhance detection performance. Both traditional attention mechanisms [30,31] and the more recent attention mechanisms based on the transformer architecture [32,33] have been employed. Traditional attention mechanisms directly compute attention weights from feature maps of images using a sigmoid function. The sigmoid function, as shown in Equation (1), maps input feature values to the range of 0–1, which represents the attention weights. However, this coupling of weights and feature maps can lead to a significant impact from outliers, affecting the performance of the mechanism. On the other hand, while transformer-based methods offer substantial advantages in terms of image receptive fields, this structure disrupts the inherent spatial position information of images. Consequently, it demands a large volume of training data and may not be suitable for training with small-scale datasets.
A t t e n t i o n w e i g h t = 1 1 + e F e a t u r e v a l u e
In this study, to fully exploit the advantages of multi-image fusion and further enhance detection performance, a hybrid Siamese network model with serial and parallel branches is proposed. The framework of this model is illustrated in Figure 2. The model adopts a dual-backbone structure. Serial backbone employs a fully convolutional architecture, with input consisting of a three-channel image that fuses two layers of recoating image and one layer of slicing image. This branch is responsible for extracting defect-related features. Parallel backbone is a differential Siamese network, taking two layers of material images as input and producing the probability of differences at corresponding positions on these two layers. Different images are input into separate convolutional branches that share convolutional weights to ensure consistent transformations, thereby extracting the disparity information between the two material layers. The dual-backbone design decouples the attention module from the feature maps, effectively mitigating the influence of outliers. This approach alleviates the vulnerability of small datasets to the impact of individual outliers, thereby enhancing the model’s adaptability and robustness. The main branches produce feature maps of different scales, which are subsequently enhanced via a feature pyramid. After feature enhancement, these layers are fed into multiple prediction heads using a multi-head prediction approach to improve detection efficiency. Finally, non-maximum suppression is applied to eliminate redundant results from different prediction heads.

3.2. Serial Branch

The serial backbone is responsible for extracting defect-related features, commonly achieved through a series of operations including convolution, downsampling, and activation. The network is constructed in a fully convolutional manner, where the size of the output feature map after downsampling is calculated using Equation (2) [34]. In this equation,  W 0  represents the size of the output feature map,  W i  is the size of the input feature map, F denotes the size of the convolution kernel, S is the stride of the convolution operation, and P is the number of pixels used for padding the edges of the feature map. In this study, downsampling is performed using a compensating size of 2, a convolutional kernel size of 3, and padding of 1 pixel along the edges. As a result, the output feature map is halved compared to the input. During the progressive compression of the feature map, deeper feature maps correspond to larger image information under the convolutional kernels, effectively expanding the receptive field of the convolutional kernel. The activation function employed is the LeakyRelu function as shown in Equation (3), which helps to alleviate the gradient vanishing phenomenon during training. As the network deepens, the input image undergoes gradual compression, resulting in feature maps with varying dimensions. Shallow feature maps have a smaller compression ratio, capturing rich image details, while deeper feature maps have a larger compression ratio, containing richer semantic information. In common object detection frameworks, prediction information for the image is usually output from the last three feature maps, which are often compressed by factors of 8, 16, and 32, respectively. In conventional object detection tasks, objects with resolutions below 32 × 32 are considered as small targets [35]. In terms of DLP recoating defect detection, a considerable proportion of defects fall within the category of small objects. To address this issue, this study increases the resolution of the feature map by using the outputs from the last four layers of the network, which supplements a feature map compressed by a factor of 4. This strategy effectively mitigates the loss of information during the downsampling process for small defects in the feature extraction stage. The feature layers, after being weighted with the differential information output by the Siamese network, are put into the feature enhancement section of the network for multi-scale feature fusion.
W 0 = W i F + P S + 1
L e a k y R e l u x = x       x > 0 α x       x x

3.3. Dual Branch

As for the defect detection in the DLP recoating process, defect information is manifested in regions characterized by dense edge information and abrupt transitions between different recoating images. Conversely, regions lacking edge information exhibit minimal grayscale variation, which indicates relative flatness and limited significance. Therefore, during the detection process, the model should focus on the regions with concentrated edges. Siamese neural networks [36] offer significant advantages in capturing differences between distinct images. They are commonly employed in tasks such as identifying changes in topography in remote sensing images [4,37], object tracking [5,38], and defect classification [39]. In this study, a Siamese neural network is utilized to extract differences in edge information from different recoating images, thereby directing the model’s attention to the desired regions.
The edge information in a recoating image can be categorized into two types: edges produced by the solidification of the slurry and edges generated due to defects. Therefore, the model should focus more on the regions with dense edge information. Edge detection is a fundamental research area in digital image processing. Early edge detection algorithm [40] focuses on the grayscale differences between target pixels and their neighboring pixels. If the grayscale change exceeds a certain threshold, the pixel is considered as belonging to an edge. However, these algorithms only consider neighboring pixels, making them susceptible to uneven illumination and image noise. DL methods have the ability to increase the receptive field of pixels during feature extraction, enabling a better understanding of deep semantic information in images. In recent years, DL techniques have been widely applied to image edge detection tasks [41]. In DL-based edge detection tasks, the goal is to accurately classify each pixel in the image as belonging to an edge or not, making it a binary semantic segmentation task. Compared to traditional edge detection methods, DL methods can effectively mitigate the influence of lighting conditions and noise and can combine semantic information to accurately identify real edges in images. In this study, transfer learning [42] techniques are utilized to incorporate a DL-based edge detection network into the Siamese network’s architecture. The proposed network structure is shown in Figure 3. The input of the Siamese network is two layers of recoating images. It can extract edge information from the input images and apply max-pooling and difference operations to the output feature maps. This process enables the Siamese network to produce the edge difference information. The extracted difference information from the Siamese network reflects the degree of dissimilarity between corresponding positions on the manufacturing surface at different time frames. Based on the characteristic behavior of material overlay defects, the occurrence of the edge transition between two adjacent recoating images indicates the presence of a defect. The Siamese network’s ability to extract regions in significant differences enhances the feature maps in the main feature extraction network, making the defect features more prominent.

3.4. Feature Pyramid

After the feature maps are extracted from the main backbone undergo spatial attention weighting through the Siamese network, it is necessary to further integrate the extracted effective feature maps in different layers. This process aims to propagate the semantic information from deep feature maps to shallow ones and transfer the detailed information from shallow feature maps to deep ones. This approach aligns with the common practice of feature enhancement to conventional DL methods. In this study, the input feature enhancement stage involves four effective feature maps, corresponding to feature maps downsampled by factors of 4, 8, 16, and 32. To perform interlayer fusion, the deep feature maps are upsampled and concatenated with shallow feature maps in the channel dimension. Specifically, the shallow feature maps undergo convolutional downsampling with a stride of 2 and are then stacked with deep feature maps. This fusion strategy serves to enhance the information exchange between different layers, ensuring that both semantic richness from deeper layers and fine-grained details from shallower layers are effectively integrated. This approach leverages the strengths of both shallow and deep feature maps to improve the model’s ability to capture complex patterns and variations in the recoating images, ultimately enhancing the accuracy of defect detection.

3.5. Prediction Heads

In object detection tasks, prediction heads are responsible for generating predictions for a set of feature points, where each feature point corresponds to a specific region of interest within the image. Prediction heads can be categorized into two types: anchor based and anchor free. In anchor-based heads, a predefined set of anchor boxes is used, and the network predicts adjustments to these anchor boxes to determine the final bounding box predictions. This method is advantageous for objects with well-defined shapes and sizes. On the other hand, anchor-free prediction heads eliminate the need for predefined anchor boxes. They directly predict the four degrees of freedom required to locate a bounding box, such as center point offset and box width/height [43], distances from feature points to the four boundaries [5], or the coordinates of the box’s top-left and bottom-right cornets [44]. Anchor-free prediction heads are particularly beneficial for predicting irregularly shaped objects, as they are not constrained by predefined anchor box shapes and sizes.
In terms of defect detection in DLP, where defects often exhibit irregular shapes, an anchor-free prediction head is more suitable. The prediction head design aims to predict the center coordinates of the defect targets and directly forecast the width and height of the object. Each prediction head output consists of a classification head, a center offset head, and a bounding box prediction head. The classification head predicts whether a defect target exists within the image block represented by each feature point in the form of confidence scores. The center offset head predicts the offset of the actual center coordinates of the target object relative to the feature point. The bounding box prediction head directly forecasts the width and height of the target’s bounding box. Each point on the feature map of this prediction head is responsible for predicting a target. However, some objects may span multiple feature points, as illustrated in Figure 4. In the vicinity of the ground truth (GT) bounding box, there is also a substantial amount of target information in the neighboring feature points. Therefore, when constructing the GT for the prediction head, the confidence score around the GT feature points should not be set to zero. Each value on a feature point represents the probability of the presence of a defect target in the corresponding image region. The range of value is from 0 to 1. The degree of overlap between the bounding boxes predicted by neighboring feature points and the GT bounding box can effectively reflect the similarity between the corresponding regions in the image and the GT defect target. The overlap between two bounding boxes can be quantified using the intersection over union (IOU) value, as shown in Equation (4). Here, A and B represent two adjacent bounding boxes, A∩B denotes the area of overlap between the two bounding boxes, and A∪B represents the combined area of the two bounding boxes. The IOU value is used as the confidence score GT for the neighboring feature point. The offset head and bounding box prediction head directly input the values of the GT bounding box onto the feature map.
I O U = A B A B
The feature maps extracted by the backbone network are enhanced and then exported to three prediction heads. These prediction heads consist of a low-resolution feature map after 16× downsampling, a medium-resolution feature map after 8× downsampling, and a high-resolution feature map after 4× downsampling. In traditional object detection methods, these prediction heads are typically used for detecting large, medium, and small objects, respectively. However, in this study, there is no restriction on using these prediction heads exclusively for specific object sizes. Instead, all three prediction heads are employed simultaneously to predict objects of any size. Subsequently, the output results from these three prediction heads are stacked together and subjected to non-maximum suppression to obtain the final predictions. The purpose of this approach is to fully utilize the output information from all prediction heads, thereby enhancing the overall detection efficiency of the network.

3.6. Loss Function

In the classification head, each feature point represents a sample. However, due to the scarcity of target objects in the image, a significant portion of feature points in the prediction head correspond to negative samples. In the presence of highly imbalanced positive and negative samples, the focal loss function is utilized to magnify the loss of challenging samples and suppress the loss of easy samples. This approach significantly alleviates the impact of class imbalance and has been widely applied to single-stage object detection tasks, which has greatly improved the accuracy of such algorithms. In this paper, the focal loss function is employed for the sample classification task. The expression of the function is shown Equation (5), where  α t  and γ are two hyperparameters. Values 2 and 4 are adopted according to the reference [38]. The center offset and bounding box width–height prediction head both directly output the differences between predicted values and GT. The distinction lies in the range of loss values, where the loss value for the center offset head is confined to the range of 0 to 1, while for the weight–height prediction head, it spans from 0 to infinity. Therefore, the loss function can provide appropriate gradients for both large and small differences between predicted and true values to ensure stable training. As is shown in Equation (6), the smooth L1 loss is used, since it combines the advantages of L1 and L2 losses, offering favorable gradient information for differences between predictions and GT. The final loss is the sum of three components. To balance the contribution of each loss component and mitigate the impact of the larger loss generated by the width–height prediction head, a small coefficient is multiplied. Additionally, to address the difficulty of detecting small targets, the final loss is combined with the target’s scale, assigning a greater weight to small targets to enhance their prominence in the final loss function. The expression of the ultimate loss function is presented in Equation (7), where α is the balancing coefficient for the bounding box width–height loss (set as 0.1) and β represents the target scale factor:
L c l s = α t 1 p t γ log p t
L h w x , y = L o f f s e t x , y = 1 n i = 1 n 0.5 × y i f x i 2 ,                   if y i f x i < 1 y i f x i 0.5 ,                                                     otherwise
L t o t a l = L c l s + L o f f s e t + α × L h w × β

4. Experiments and Discussion

4.1. Environment and Datasets

All the image data were collected from the product CeraStation 160 by QuickDemos company. The detection model is built using PyTorch (1.13.0). The model training and testing are conducted on a DL workstation with the Windows 11 professional operating system. The workstation is equipped with a 13th Gen Inter(R) Core (TM) i9-13900KF 3.0 GHz CPU and an Nvidia 4070 Ti graphics card with 12 GB of VRAM. The dataset used in the experiment consists of grayscale images captured during the printing process of silicon carbide (SiC). After dividing the images into blocks, the dataset’s image resolution is set as 320 × 320. Due to the high cost of obtaining the dataset images, data augmentation [35] techniques such as changing color space and introducing random noise were applied to a small portion, resulting in a total of 6498 defect images. During the training process, the dataset is randomly divided into training, validation, and test sets in the ratio of 7:1:2. For model performance evaluation, commonly used metrics include accuracy, recall, and F1 score. In this paper, the evaluation criterion employed is the F1 score, calculated using Equation (8):
F 1 = 2 × P e r c i s i o n × R e c a l l P e r c i s i o n + R e c a l l
where precision is the ratio of true positive predictions to the total number of positive predictions and recall is the ratio of true positive predictions to the total number of actual positive instances, as shown in Equations (9) and (10), meanings of each parameter are displayed in Table 2.
P r e c i s i o n = T P T P + F P
R e c a l l = T P T P + F N

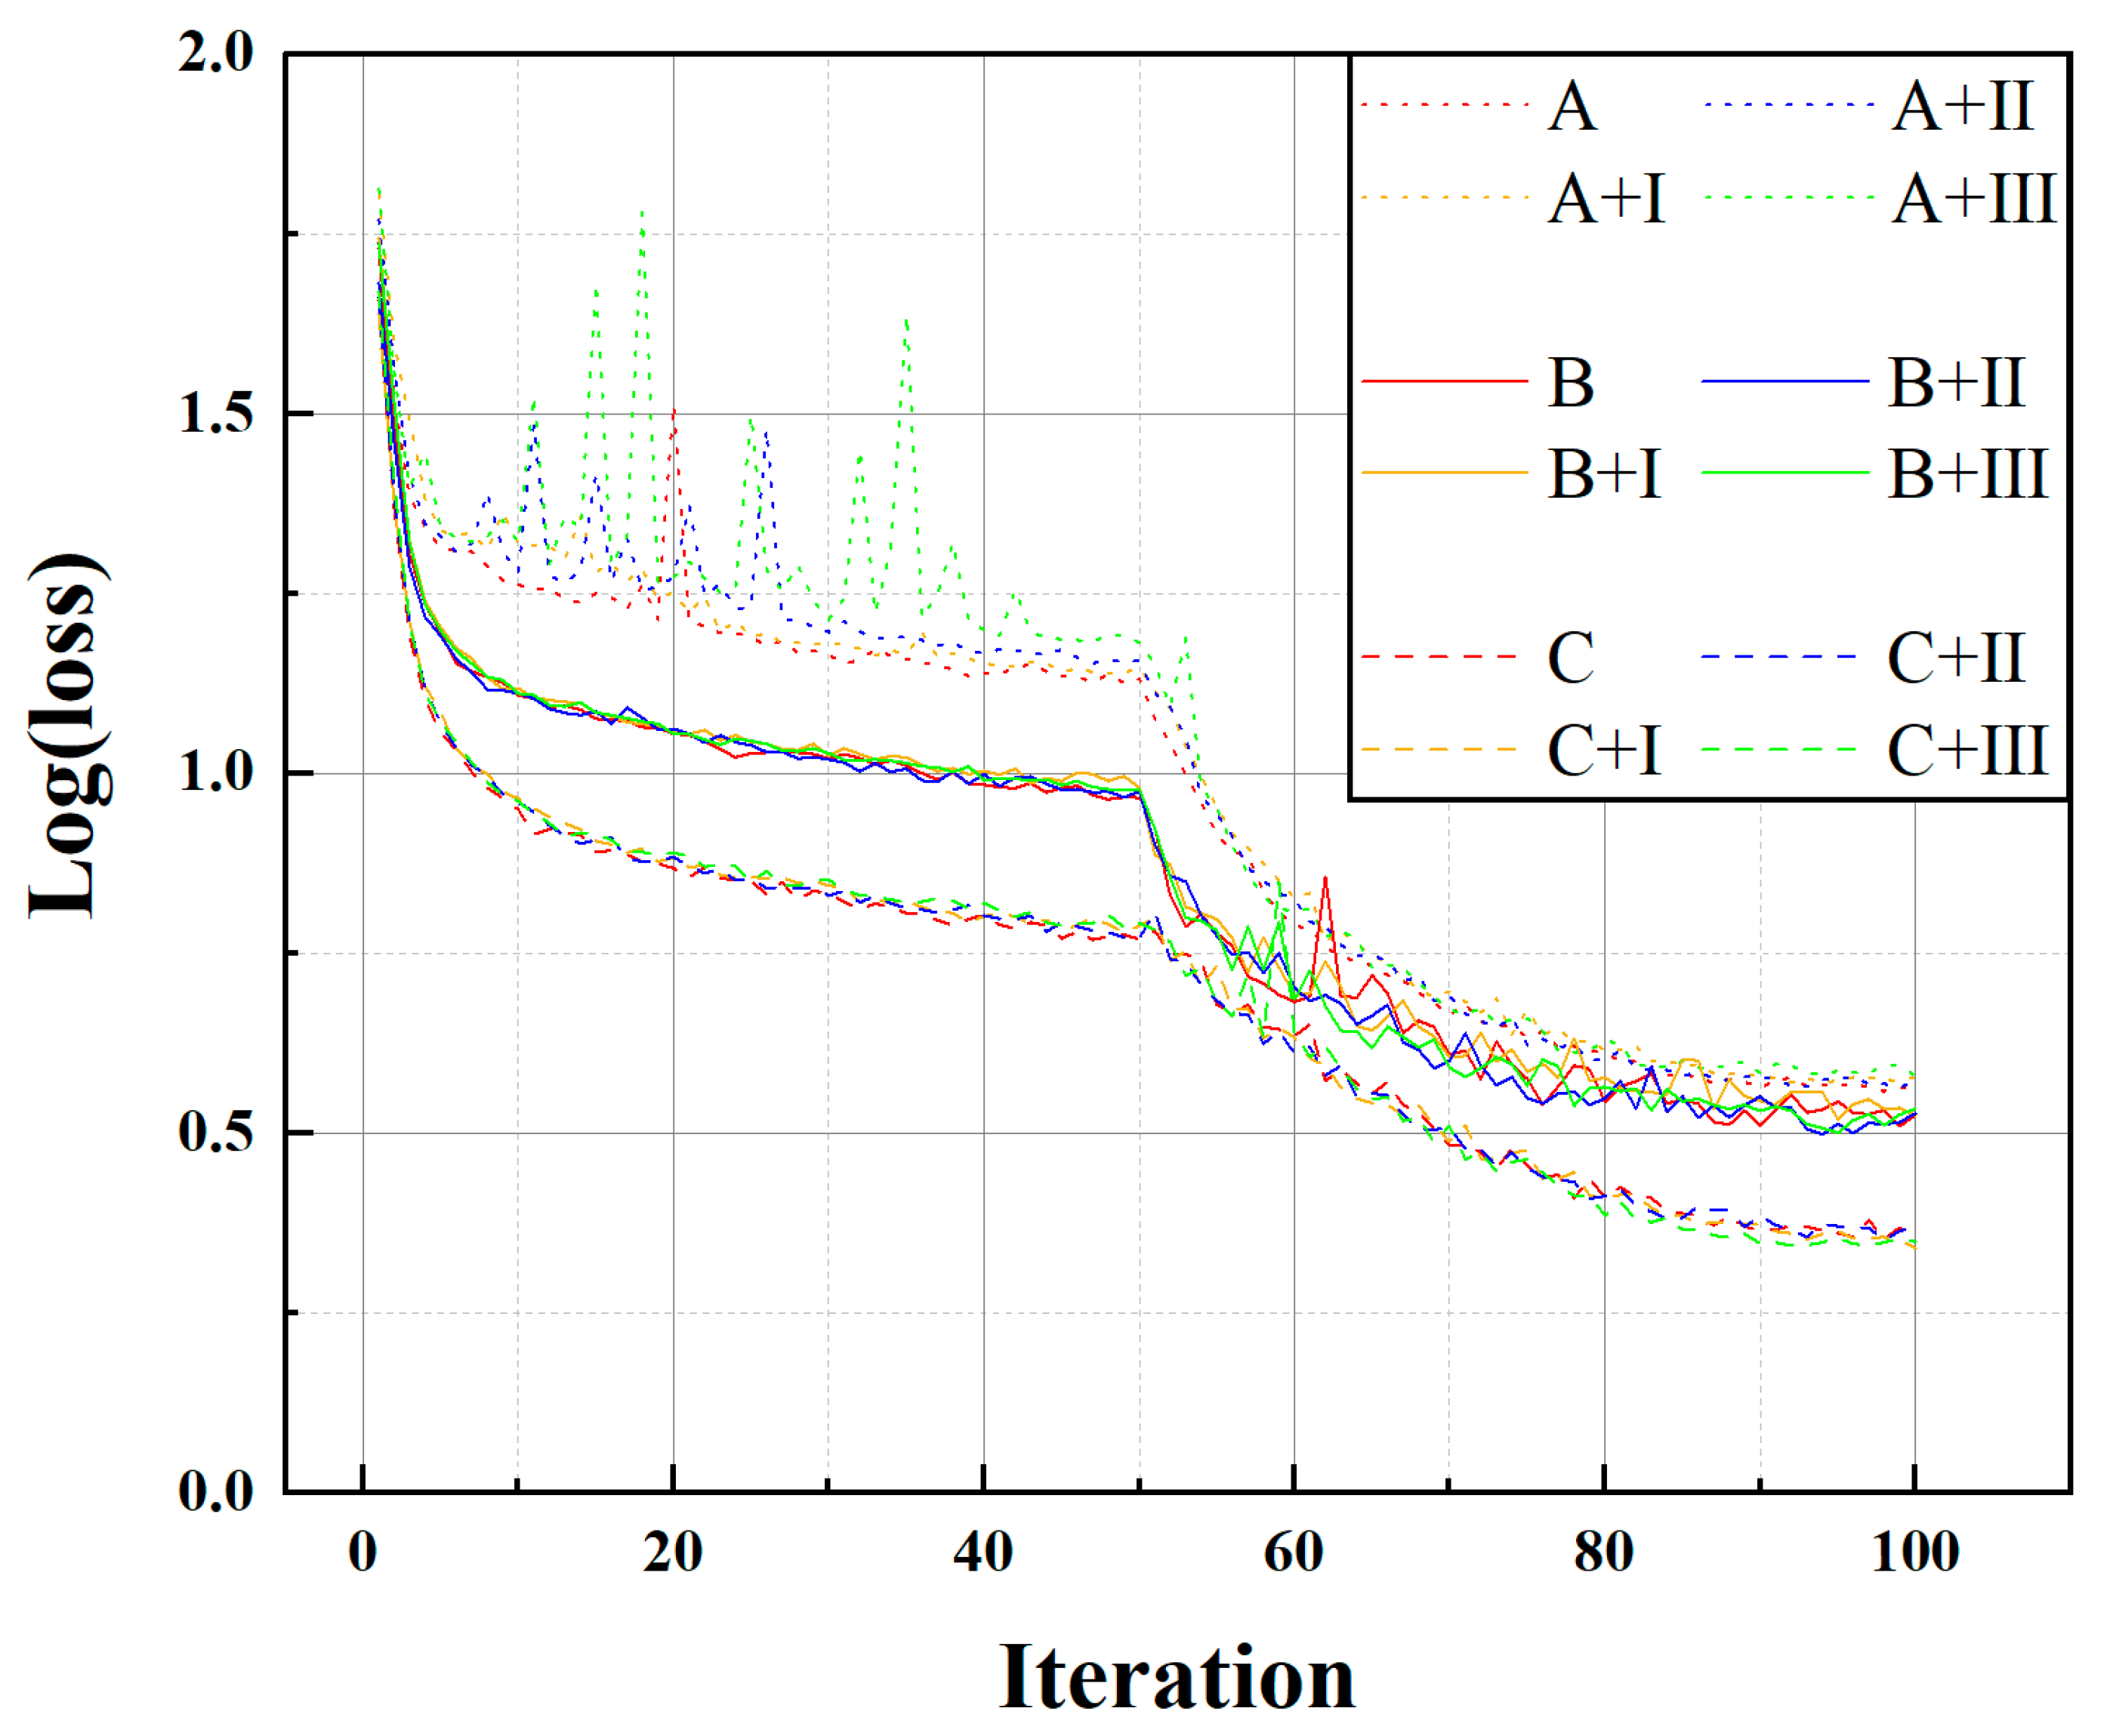
4.2. Analysis of the Model

To validate the effectiveness of the proposed framework, resnet50 [45], darknet [46], and mobilenet [47] are chosen as serial backbone and HED [48], pidinet [49], and BDCN [50] are chosen as edge detection backbone. Edge detection module networks are selected in the Siamese network module, and their pre-trained weights are loaded to make them more sensitive to image edge information. All networks undergo 100 rounds of training. To ensure training stability, the weights of the feature extraction module are frozen during the first 50 rounds of training, focusing on training the feature enhancement network and prediction heads. After 50 rounds, the weights of the main feature network are unfrozen. The training process is displayed in Figure 5. The results reveal that in the early stages of training, the resnet50-based network exhibited the most stable and effective training performance, followed by mobilenet. The darknet’s training results show the highest loss in the validation set and an unstable process, experiencing significant oscillations in the early stages of training. After unfreezing the main network weights, mobilenet experiences some oscillations, while darknet training gradually stabilized. Resnet50 consistently exhibited stable training performance throughout the whole process and ultimately produced superior results. The adoption of the differential Siamese network has a moderating effect on the training process, reducing oscillations to some extent. Among the variations, the network trained with the HED edge detection module showed the least oscillation during training, particularly evident in darknet architecture.
The final experimental results are summarized in Table 3. It can be observed that the combination of resnet50 and HED achieved the best results. The average F1 score for five types of defects reaches 0.885. Among them, the scratch, shortage, and collapse defects, belonging to medium to large-sized defects, achieve F1 scores above 0.97. This indicates that the detection of these three defects is highly accurate. On the other hand, the bubble and sunken defects are in smaller scale, and their losses in the loss function are still relatively minor. The F1 scores for these defects are 0.65 and 0.67, respectively. The detailed data is shown in Table 4, it can be observed that the accuracy for both bubble and sunken defects is relatively high, while the recall rate if low, resulting in a low F1 score. This is because these two types of defects are small-target defects, with fewer effective pixels in the image, resulting in significant information loss during feature extraction compression. The poor accuracy of small-target detection is a common problem in the field of object detection [35], which needs to be addressed in the next stage of research. Although the detection accuracy is lower compared with medium to large-sized defects, the performance is still relatively favorable compared to other networks.
In terms of detection speed, the detection model we designed is a single-stage detection model, unlike two-stage detection models that first extract possible regions of defect targets from images and then classify the defect targets within those regions. Single-stage object detection models directly classify and locate defect targets in images, making them much faster than two-stage detection models. Although the detection model composed of resnet50 and HED is slightly slower than the other models due to its higher parameter count. However, as a single-stage detection model, the detection frame rate still reaches 54.01 frames, which meets the requirements for real-time industrial inspection.
In terms of comparative effectiveness with other object detection methods, the Faster-RCNN [51] and YOLOv7 [46] algorithms are used for comparison, and the results are shown in Table 5. From the table, it can be concluded that the method proposed in this paper exhibits significantly higher accuracy, even surpassing the two-stage Faster RCNN algorithm. This is because the algorithm designed in this paper can selectively extract the differences between the two layers of recoating images through the Siamese network, there by achieving higher sensitivity to recoating defects.
The visualization of the model’s performance is depicted in Figure 6. The spatial attention weights output from the Siamese network are visualized as heatmaps in the fifth column. It can be observed that the network highlights the differences between two layers of recoating image through the attention weights, which enhances the image features and produces superior detection results. The detection images in the figure are captured from various positions on the manufacturing platform, exhibiting varying degrees of brightness, darkness, and noise levels due to different lighting conditions. However, the detection results indicate that the proposed model demonstrates strong adaptability, effectively detecting defects on the manufacturing surface across diverse lighting environments.

4.3. Analysis of Multiple Heads

The DL-based object detection networks utilize multiple prior boxes, which are commonly obtained through clustering within the dataset. These prior boxes are then categorized into three groups based on their sizes: small, medium, and large. Consequently, corresponding prediction heads are employed to forecast targets of varying scales. However, this approach may exhibit limitations, particularly in cases where clustered prior boxes fail to align seamlessly with the resulting feature map. For instance, in datasets primarily featured with small objects, the clustered prior boxes might predominantly encompass small sizes, disregarding the need to incorporate larger prior boxes for predicting relatively large small-scale objects within low-resolution feature maps. This scenario can potentially hinder detection efficiency. In this study, an alternative approach is embraced, involving the abandonment of the anchor box mechanism. Moreover, no artificial constraints are imposed on the dimensions of the targets predicted by the feature map. Instead, a multi-prediction head strategy is adopted, which allows the network to concurrently produce predictions across multiple scales. Subsequently, a non-maximum suppression is employed to consolidate and refine the array of predictions. This novel strategy endows the model with heightened flexibility to adapt to diverse target scales and configurations, thereby augmenting both the efficiency and accuracy of the detection results.
The test dataset in this study consists of ceramic AM tile defect images with dimensions of 320 × 320 pixels. The resulting prediction heads have width and height dimensions of 20 × 20, 40 × 40, and 80 × 80 pixels, corresponding to three distinct scales of low, medium, and high-resolution feature maps. Defect targets with resolutions less than one-tenth of the entire image are classified as small-scale objectives, while those with resolutions ranging from one-tenth to half of the full image are categorized as medium-scale objectives. Targets larger than half of the image are designated as large-scale objectives. In the evaluation phase of the test set, the model predicts and localizes defect targets while identifying the originating prediction head. The outcomes are presented in Figure 7. It reveals that feature maps of varying scales contribute meaningfully to predicting targets of different sizes. The adoption of multiple parallel prediction heads significantly enhances the precision of the detection results. This approach demonstrates the effectiveness of utilizing diverse-scale feature maps to achieve more accurate and reliable defect detection.

4.4. Analysis of a Build

By utilizing the visualization toolkit (VTK) 3D reconstruction technique, serialized binary images can be rapidly transformed into visual models. After the completion of a single printing process, leveraging the detected defect information on the ceramic tile surface allows the segmentation of a slice image into regions representing normal print and defective sections. This forms the basis for constructing a 3D model to depict the detection information, as illustrated in Figure 8. The tangible printed object is shown in Figure 9. During a printing task, a 3D reconstructed SiC mirror model is generated based on defect detection outcomes. The normally printed portions are visualized in green and are rendered transparent to enhance the visibility of internal defects. Shortage defects indicated by brown, tend to result in an insufficient interlayer bond. Furthermore, a collapse defect is shown in cyan, and a scratch defect is depicted in blue. It is evident that a shortage defect occurs midway through the part’s printing process, affecting the interlayer bonding and ultimately causing delamination of the mirror blank. The 3D reconstruction of defects provides an intuitive visualization of their occurrence locations and types, facilitating rapid quality assessment for the printed component.

5. Conclusions

In this paper, a dual-backbone object detection model is proposed for defect detection in the ceramic AM recoating process. The model consists of two branches: a sequential convolutional model and a differential Siamese network. The design of these two backbones can decouple the feature map and spatial attention weight, enabling the model to focus more precisely on specific regions of the feature map, thereby reducing susceptibility to outliers. Experimental results demonstrate that the dual-backbone feature extractor significantly reduces training oscillations, ensuring stability during the training process, which is crucial for training on small-scale datasets. Through the experiments, it is found that the combination of resnet50 and HED achieves the most stable training process and optimal results. Performed on the SiC AM defect dataset, the F1 score of 0.89 is achieved. As for larger defect targets, the F1 scores reach above 0.97, which indicates excellent detection performance. The model achieves a detection speed of 54.01 frames per second, meeting the real-time detection requirements of industrial applications. The multi-head parallel prediction approach demonstrated that different scale feature maps can contribute to the prediction of targets of various sizes, enhancing the accuracy of detection results. Based on the detection model’s results, a 3D reconstruction is performed utilizing the VTK toolkit, where the slice images of the specimen are segmented into normal print and defect sections. It can enable timely insight into the internal defect of the manufactured specimen and provides a convenient method for rapid quality assessment. Our proposed method demonstrates the potential to enhance the industrialization and application scope of ceramic AM. By enabling real-time monitoring and defect removal, our approach contributes to the improvement of product yield and the overall efficiency of the manufacturing process. Furthermore, the method’s capability for in situ monitoring enhances the intelligence of ceramic AM equipment, paving the way for broader industrial applications in the future.
Although the proposed method shows good performance in the defect detection of medium and large targets on the ceramic AM recoating process, it still needs to improve the detection accuracy of small defect targets. In future work, further improvements to the model can be made to address the issue of poor detection performance for small target defects, aiming to enhance the overall detection effectiveness. Additionally, beyond detecting in-plane defects during the ceramic AM recoating process, detecting longitudinal defects could be a potential research direction. By fusing information from multiple layers of images, it becomes possible to obtain developmental information on longitudinal defects. Therefore, this technology holds promise for directly identifying internal defects within the workpiece. Finally, the five types of defects proposed in this paper are based on a long-term observation of the ceramic additive manufacturing recoating process. However, the possibility of new defects emerging cannot be ruled out. The effectiveness of our method for detecting newly emerging defects will need further validation in future research efforts.

Author Contributions

Methodology, X.J.; Software, X.J.; Validation, B.L. and G.W.; Data curation, C.C. and W.L.; Writing—original draft, X.J.; Writing—review & editing, T.W.; Supervision, B.L.; Funding acquisition, S.L. All authors have read and agreed to the published version of the manuscript.

Funding

The financial support from the National Natural Science Foundation of China (Grant No. 52005479) and Grant No. 52303305). the funding from Youth Innovation Promotion Association of Chinese Academy of Sciences (No. 2022160), Key Laboratory Fund (No. 2022KLOMT02-03) from Key Laboratory of Optical System Advanced Manufacturing Technology, Chinese Academy of Sciences.

Data Availability Statement

Data will be provided when required.

Acknowledgments

The authors sincerely thank the editors and reviewers.

Conflicts of Interest

The authors declare that no conflicts of interest exist.

References

  1. He, R.; Zhou, N.; Zhang, K.; Zhang, X.; Zhang, L.; Wang, W.; Fang, D. Progress and Challenges towards Additive Manufacturing of Sic Ceramic. J. Adv. Ceram. 2021, 10, 637–674. [Google Scholar] [CrossRef]
  2. Yang, Y.; Liu, B.; Li, H.; Li, X.; Wang, G.; Li, S. A nesting optimization method based on digital contour similarity matching for additive manufacturing. J. Intell. Manuf. 2022, 34, 2825–2847. [Google Scholar] [CrossRef]
  3. Zagoruyko, S.; Komodakis, N. Learning to compare image patches via convolutional neural networks. In Proceedings of the IEEE Conference on Computer Vision and Pattern Recognition (CVPR), Boston, MA, USA, 7–12 June 2015; pp. 4353–4361. [Google Scholar]
  4. Daudt, R.C.; Le Saux, B.; Boulch, A. Fully Convolutional Siamese Networks for Change Detection. In Proceedings of the 2018 25th IEEE International Conference on Image Processing (ICIP), Athens, Greece, 7–10 October 2018; pp. 4063–4067. [Google Scholar]
  5. Cui, Y.; Guo, D.; Shao, Y.; Wang, Z.; Shen, C.; Zhang, L.; Chen, S. Joint Classification and Regression for Visual Tracking with Fully Convolutional Siamese Networks. Int. J. Comput. Vis. 2022, 130, 550–566. [Google Scholar] [CrossRef]
  6. Jin, Z.; Zhang, Z.; Demir, K.; Gu, G.X. Machine learning for advanced additive manufacturing. Matter 2020, 3, 1541–1556. [Google Scholar] [CrossRef]
  7. Grierson, D.; Rennie, A.E.W.; Quayle, S.D. Machine learning for additive manufacturing. Encyclopedia 2021, 1, 576–588. [Google Scholar] [CrossRef]
  8. Abdallah, M.; Joung, B.-G.; Lee, W.J.; Mousoulis, C.; Raghunathan, N.; Shakouri, A.; Sutherland, J.W.; Bagchi, S. Anomaly detection and inter-sensor transfer learning on smart manufacturing datasets. Sensors 2023, 23, 486. [Google Scholar] [CrossRef]
  9. Abdallah, M.; Lee, W.J.; Raghunathan, N.; Mousoulis, C.; Sutherland, J.W.; Bagchi, S. Anomaly detection through transfer learning in agriculture and manufacturing IoT systems. arXiv 2021, arXiv:2102.05814. [Google Scholar]
  10. Jacobsmuhlen, J.Z.; Kleszczynski, S.; Witt, G.; Merhof, D. Elevated Region Area Measurement for Quantitative Analysis of Laser Beam Melting Process Stability. In Proceedings of the 26th International Solid Free Form Fabrication (SFF), Austin, TX, USA, 10–12 August 2015. [Google Scholar] [CrossRef]
  11. Zhang, B.; Ziegert, J.; Farahi, F.; Davies, A. In situ surface topography of laser powder bed fusion using fringe projection. Addit. Manuf. 2016, 12, 100–107. [Google Scholar] [CrossRef]
  12. Li, Z.; Liu, X.; Wen, S.; He, P.; Zhong, K.; Wei, Q.; Shi, Y.; Liu, S. In Situ 3D Monitoring of Geometric Signatures in the Powder-Bed-Fusion Additive Manufacturing Process via Vision Sensing Methods. Sensors 2018, 18, 1180. [Google Scholar] [CrossRef] [PubMed]
  13. Wang, M.; Zhang, Q.; Li, Q.; Wu, Z.; Chen, C.; Xu, J.; Xue, J. Research on Morphology Detection of Metal Additive Manufacturing Process Based on Fringe Projection and Binocular Vision. Appl. Sci. 2022, 12, 9232. [Google Scholar] [CrossRef]
  14. Xiong, J.; Shi, M.; Liu, Y.; Yin, Z. Virtual binocular vision sensing and control of molten pool width for gas metal arc additive manufactured thin-walled components. Addit. Manuf. 2020, 33, 101121. [Google Scholar] [CrossRef]
  15. Scime, L.; Beuth, J. A Multi-Scale Convolutional Neural Network for Autonomous Anomaly Detection and Classification in a Laser Powder Bed Fusion Additive Manufacturing Process. Addit. Manuf. 2018, 24, 273–286. [Google Scholar] [CrossRef]
  16. Krizhevsky, A.; Sutskever, I.; Hinton, G.E. Imagenet Classification with Deep Convolutional Neural Networks. Commun. ACM 2017, 60, 84–90. [Google Scholar] [CrossRef]
  17. Gaikwad, A.; Imani, F.; Yang, H.; Reutzel, E.; Rao, P. In Situ Monitoring of Thin-Wall Build Quality in Laser Powder bed Fusion Using Deep Learning. Smart Sustain. Manuf. Syst. 2019, 3, 98–121. [Google Scholar] [CrossRef]
  18. Liu, C.; Wang, R.R.; Ho, I.; Kong, Z.J.; Williams, C.; Babu, S.; Joslin, C. Toward online layer-wise surface morphology measurement in additive manufacturing using a deep learning-based approach. J. Intell. Manuf. 2022, 34, 2673–2689. [Google Scholar] [CrossRef]
  19. Bevans, B.; Barrett, C.; Spears, T.; Gaikwad, A.; Riensche, A.; Smoqi, Z.; Halliday, H.; Rao, P. Heterogeneous sensor data fusion for multiscale, shape agnostic flaw detection in laser powder bed fusion additive manufacturing. Virtual Phys. Prototyp. 2023, 18, e2196266. [Google Scholar] [CrossRef]
  20. Nguyen, N.V.; Hum, A.J.W.; Do, T.; Tran, T. Semi-Supervised Machine Learning of Optical in-Situ Monitoring Data for Anomaly Detection in Laser Powder bed Fusion. Virtual Phys. Prototyp. 2022, 18, e2129396. [Google Scholar] [CrossRef]
  21. Repossini, G.; Laguzza, V.; Grasso, M.; Colosimo, B.M. On the use of spatter signature for in-situ monitoring of Laser Powder Bed Fusion. Addit. Manuf. 2017, 16, 35–48. [Google Scholar] [CrossRef]
  22. Rodriguez, E.; Mireles, J.; Terrazas, C.A.; Espalin, D.; Perez, M.A.; Wicker, R.B. Approximation of absolute surface temperature measurements of powder bed fusion additive manufacturing technology using in situ infrared thermography. Addit. Manuf. 2015, 5, 31–39. [Google Scholar] [CrossRef]
  23. Li, Q.; Qiu, Y.; Hou, W.; Liang, J.; Mei, H.; Li, J.; Zhou, Y.; Sun, X. Slurry flow characteristics control of 3D printed ceramic core layered structure: Experiment and simulation. J. Mater. Sci. Technol. 2023, 164, 215–228. [Google Scholar] [CrossRef]
  24. Zhao, D.; Su, H.; Hu, K.; Lu, Z.; Li, X.; Dong, D.; Liu, Y.; Shen, Z.; Guo, Y.; Liu, H.; et al. Formation mechanism and controlling strategy of lamellar structure in 3D printed alumina ceramics by digital light processing. Addit. Manuf. 2022, 52, 102650. [Google Scholar] [CrossRef]
  25. Chen, L.; Cikalova, U.; Muench, S.; Roellig, M.; Bendjus, B. Stress Characterization of Ceramic Substrates by Laser Speckle Photometry. In Proceedings of the 2019 42nd International Spring Seminar on Electronics Technology (ISSE), Wroclaw, Poland, 15–19 May 2019; pp. 1–6. [Google Scholar]
  26. Liu, W.; Chen, C.; Shuai, S.; Zhao, R.; Liu, L.; Wang, X.; Hu, T.; Xuan, W.; Li, C.; Yu, J.; et al. Study of pore defect and mechanical properties in selective laser melted Ti6Al4V alloy based on X-ray computed tomography. Mater. Sci. Eng. A 2020, 797, 139981. [Google Scholar] [CrossRef]
  27. Su, R.; Kirillin, M.; Chang, E.W.; Sergeeva, E.; Yun, S.H.; Mattsson, L. Perspectives of mid-infrared optical coherence tomography for inspection and micrometrology of industrial ceramics. Opt. Express 2014, 22, 15804–15819. [Google Scholar] [CrossRef]
  28. Saâdaoui, M.; Khaldoun, F.; Adrien, J.; Reveron, H.; Chevalier, J. X-ray tomography of additive-manufactured zirconia: Processing defects—Strength relations. J. Eur. Ceram. Soc. 2020, 40, 3200–3207. [Google Scholar] [CrossRef]
  29. Diener, S.; Franchin, G.; Achilles, N.; Kuhnt, T.; Rösler, F.; Katsikis, N.; Colombo, P. X-ray microtomography investigations on the residual pore structure in silicon nitride bars manufactured by direct ink writing using different printing patterns. Open Ceram. 2020, 5, 100042. [Google Scholar] [CrossRef]
  30. Hu, J.; Shen, L.; Sun, G. Squeeze-and-Excitation Networks. In Proceedings of the 2018 IEEE/CVF Conference on Computer Vision and Pattern Recognition, Salt Lake City, UT, USA, 18–23 June 2018; pp. 7132–7141. [Google Scholar] [CrossRef]
  31. Woo, S.; Park, J.; Lee, J.Y.; Kweon, I.S. CBAM: Convolutional Block Attention Module. In Proceedings of the European Conference on Computer Vision, Munich, Germany, 8–14 September 2018. [Google Scholar] [CrossRef]
  32. Carion, N.; Massa, F.; Synnaeve, G.; Usunier, N.; Kirillov, A.; Zagoruyko, S. End-to-End Object Detection with Transformers. arXiv 2020, arXiv:2005.12872. [Google Scholar] [CrossRef]
  33. Zhu, X.; Su, W.; Lu, L.; Li, B.; Wang, X.; Dai, J. Deformable DETR: Deformable Transformers for End-to-End Object Detection. arXiv 2020, arXiv:2010.04159. [Google Scholar] [CrossRef]
  34. Karpathy, A. CS231n Convolutional Neural Networks for Visual Recognition. 2017. Available online: https://cs231n.github.io/convolutional-networks/#overview (accessed on 5 February 2018).
  35. Kisantal, M.; Wojna, Z.; Murawski, J.; Naruniec, J.; Cho, K. Augmentation for small object detection. arXiv 2019, arXiv:1902.07296. [Google Scholar]
  36. Bromley, J.; Bentz, J.W.; Bottou, L.; Guyon, I.; Lecun, Y.; Moore, C.; Säckinger, E.; Shah, R. Signature verification using a “siamese” time delay neural network. In Proceedings of the Advances in Neural Information Processing Systems, Denver, CO, USA, 28 November–1 December 1994; pp. 737–744. [Google Scholar] [CrossRef]
  37. Zhan, Y.; Fu, K.; Yan, M.; Sun, X.; Wang, H.; Qiu, X. Change Detection Based on Deep Siamese Convolutional Network for Optical Aerial Images. IEEE Geosci. Remote Sens. Lett. 2017, 14, 1845–1849. [Google Scholar] [CrossRef]
  38. Yang, K.; He, Z.; Zhou, Z.; Fan, N. SiamAtt: Siamese attention network for visual tracking. Knowl.-Based Syst. 2020, 203, 106079. [Google Scholar] [CrossRef]
  39. Marino, F.; Distante, A.; Mazzeo, P.L.; Stella, E. A Real-Time Visual Inspection System for Railway Maintenance: Automatic Hexagonal-Headed Bolts Detection. IEEE Trans. Syst. Man Cybern. Part C 2007, 37, 418–428. [Google Scholar] [CrossRef]
  40. Canny, J. A Computational Approach to Edge Detection. IEEE Trans. Pattern Anal. Mach. Intell. 1986, 8, 679–698. [Google Scholar] [CrossRef]
  41. Pu, M.; Huang, Y.; Liu, Y.; Guan, Q.; Ling, H. EDTER: Edge Detection with Transformer. In Proceedings of the 2022 IEEE/CVF Conference on Computer Vision and Pattern Recognition (CVPR), New Orleans, LA, USA, 18–24 June 2022; pp. 1392–1402. [Google Scholar] [CrossRef]
  42. Yosinski, J.; Clune, J.; Bengio, Y.; Lipson, H. How transferable are features in deep neural networks? In Proceedings of the Advances in Neural Information Processing Systems (NIPS) 27, Montreal, QC, Canada, 8–13 December 2014. [CrossRef]
  43. Zhou, X.; Wang, D.; Krähenbühl, P. Objects as Points. arXiv 2019, arXiv:1904.07850. [Google Scholar] [CrossRef]
  44. Law, H.; Teng, Y.; Russakovsky, O.; Deng, J. CornerNet-Lite: Efficient Keypoint Based Object Detection. arXiv 2019, arXiv:1904.08900. [Google Scholar] [CrossRef]
  45. He, K.; Zhang, X.; Ren, S.; Sun, J. Deep Residual Learning for Image Recognition. In Proceedings of the 2016 IEEE Conference on Computer Vision and Pattern Recognition (CVPR), Las Vegas, NV, USA, 27–30 June 2016; pp. 770–778. [Google Scholar] [CrossRef]
  46. Wang, C.Y.; Bochkovskiy, A.; Liao, H.Y. YOLOv7: Trainable bag-of-freebies sets new state-of-the-art for real-time object detectors. arXiv 2022, arXiv:2207.02696. [Google Scholar] [CrossRef]
  47. Sandler, M.; Howard, A.; Zhu, M.; Zhmoginov, A.; Chen, L.C. MobileNetV2: Inverted Residuals and Linear Bottlenecks. In Proceedings of the 2018 IEEE/CVF Conference on Computer Vision and Pattern Recognition, Salt Lake City, UT, USA, 18–23 June 2018; pp. 4510–4520. [Google Scholar] [CrossRef]
  48. Xie, S.; Tu, Z. Holistically-Nested Edge Detection. Int. J. Comput. Vis. 2015, 125, 3–18. [Google Scholar] [CrossRef]
  49. Su, Z.; Liu, W.; Yu, Z.; Hu, D.; Liao, Q.; Tian, Q.; Pietikainen, M.; Liu, L. Pixel Difference Networks for Efficient Edge Detection. In Proceedings of the 2021 IEEE/CVF International Conference on Computer Vision (ICCV), Montreal, QC, Canada, 10–17 October 2021; pp. 5097–5107. [Google Scholar] [CrossRef]
  50. He, J.; Zhang, S.; Yang, M.; Shan, Y.; Huang, T. Bi-Directional Cascade Network for Perceptual Edge Detection. In Proceedings of the 2019 IEEE/CVF Conference on Computer Vision and Pattern Recognition (CVPR), Long Beach, CA, USA, 15–20 June 2019; pp. 3823–3832. [Google Scholar] [CrossRef]
  51. Ren, S.; He, K.; Girshick, R. Faster R-CNN: Towards Real-Time Object Detection with Region Proposal Networks. Trans. Pattern Anal. Mach. Intell. 2017, 39, 1137–1149. [Google Scholar] [CrossRef]
Figure 1. Typical images of five defects in the DLP recoating process.
Processes 12 00633 g001
Figure 2. Flowchart of dual-backbone defect detection model.
Processes 12 00633 g002
Figure 3. Structure of Siamese network.
Processes 12 00633 g003
Figure 4. IOU in neighboring feature points. Positive point represented in green, a neighboring point of positive point is represented in blue and negative samples represented in orange.
Processes 12 00633 g004
Figure 5. Training process of each network. The letters A, B, and C represent darknet, mobilenet, and resnet50, respectively; the Roman numerals I, II, and III represent HED, pidinet, and BDCN, respectively.
Processes 12 00633 g005
Figure 6. Visual defect detection rendering. (a) Recoating image with defects, (b) previous image, (c) slice image, (d) GT marked in red box, (e) visual heatmap of spatial attention, (f) detection results displayed with center points (yellow point) and height/width (red arrow).
Processes 12 00633 g006
Figure 7. Ratio of detected defects in different prediction head.
Processes 12 00633 g007
Figure 8. 3D reconstruction of SiC mirror with defects.
Processes 12 00633 g008
Figure 9. Actual print model.
Processes 12 00633 g009
Table 1. Some recent studies on AM process control.
ContributorMaterialMethodTarget
Jacobsmühlen [10]Inconel 625, Inconel 718SVM, RF, SGDStructure defects
Zhang [11]Inconel 625Topography analysisFlatness of powder bed
Wang [13]30CrMnSiNi2ATopography analysisFlatness of powder bed
Xiong [14]/Visual binocular visionThin-walled components
Scime [15]Inconel 718MsCNNFlatness of powder bed
Li [12]MetalTopography analysisFlatness of powder bed
Gaikwrad [17]Ti-6Al-4VCNNGeometric integrity
Liu [18]Ti-6Al-4 V alloyCNNEBM powder bed
Bevans [19]Inconel 718Multi-sensor fusionPart-level and micro defects
Repossini [21]Nickel alloyStatisticsMelt pool
Rodriguez [22]Ti-6Al-4VRegressionMelt pool
Li [23]ZrO2, SiO2Finite element simulationSlurry flow
Zhao [24]Alumina ceramicsFinite element simulationlamellar structure
Chen [25]ZrO2LSPInternal defects of ceramic parts
Su [27]Alumina ceramicsOCTMorphology of ceramic parts
Saâdaoui [28]ZirconiaXCTStrength of parts
Diener [29]silicon nitrideXCTResidual pore
structure
Table 2. Definitions of the indicators.
IndicatorDefinition
TPThe target is identified as a defect, and the true value is the defect target.
FPThe target is identified as a defect, but the true value is the background.
TNTarget recognition is the background, and the true value is the background.
FNTarget recognition is background, but the true value is the defect target.
Table 3. Results of different networks. Best detection effect displayed in bold.
Serial SiameseBubbleSunkenScratchShortageCollapseMeanFPS
darknet/0.48420.45460.83180.76800.96470.7293115.95
HED0.50000.46860.83720.83000.97650.755864.33
pidinet0.49460.45710.83570.72960.97040.722569.65
BDCN0.49460.45460.83180.79350.96470.737867.22
mobilenet/0.40900.40810.84070.92810.95860.7775104.42
HED0.52080.46050.88000.93190.96470.804762.15
pidinet0.38380.41610.83480.83510.95860.742265.22
BDCN0.45090.40260.87780.92910.96430.737863.11
resnet50/0.50000.52940.93220.93150.98230.825291.51
HED0.65380.67420.97050.97220.98230.885354.01
pidinet0.62000.57490.92310.96140.98230.852463.25
BDCN0.56310.60670.92500.95170.98230.846960.12
Table 4. Detection results of resnet50 and HED.
DefectPrecisionRecallF1
Bubble0.94440.50000.6538
Sunken0.96780.51720.6742
Scratch0.97460.96640.9705
Shortage0.98590.95890.9722
Collapse0.98810.97650.9822
Table 5. Comparison with classical methods.
AlgorithmBubbleSunkenScratchShortageCollapseMean
Faster RCNN0.58590.61710.85590.91780.82930.7796
YOLOv70.59410.60120.85070.90100.83130.7735
Ous (resnet50+HED)0.65380.67420.97050.97220.98230.8853
Disclaimer/Publisher’s Note: The statements, opinions and data contained in all publications are solely those of the individual author(s) and contributor(s) and not of MDPI and/or the editor(s). MDPI and/or the editor(s) disclaim responsibility for any injury to people or property resulting from any ideas, methods, instructions or products referred to in the content.

