1. Introduction
With the ultimate goal of all-important carbon neutrality, the steel industry that currently accounts for 7–8% of the global anthropogenic carbon dioxide (CO
2) emissions is racing to develop and deploy CO
2-lean steelmaking technologies [
1,
2,
3,
4,
5]. At present, the dominating blast furnace-basic oxygen furnace route that inherently relies on carbon as a source for iron ore reduction and thermal energy is unlikely to achieve deep decarbonization. Instead, the breakthrough route involving a reduction shaft furnace operated with pure H
2 (HSF) and the well-known electric arc furnace (EAF) has been widely accepted as one of the most viable options for industrial-scale production of high-quality steel with minor CO
2 emissions [
6,
7,
8,
9]. More specifically, the total emissions may be substantially reduced to 50 kg-CO
2/t-steel in an ideal scenario where clean electricity and green hydrogen are provided for the HSF-EAF route [
6]. In this context, an increasing number of studies have been themed around the new steelmaking route and the majority of them have particularly focused on the HSF process [
10,
11,
12,
13,
14,
15,
16,
17,
18,
19,
20,
21,
22,
23,
24] where iron oxide pellets are heated and converted to direct reduced iron (DRI) by the (preheated) pure H
2.
Although the HSF shows strong resemblance with the commercial syngas-based (MIDREX, HYL/Energiron or COREX) shaft furnace, due attention is called for since the use of pure H2 introduces a list of challenges primarily owing to the fundamental differences in the gas atmospheres. First, the heavily endothermic nature of iron ore reduction by H2 inevitably requires a high gas demand in order to carry adequate sensible heat for offsetting the associated temperature drop. For instance, requiring a full metallization of the burden at a H2 feed temperature of 1173 K, previous simulations revealed that a rate of feed gas being approximately 1700 Nm3-H2/t-pellet was needed. This eventually gives rise to a poor gas utilization in comparison with the syngas-based shaft furnace where the exothermic effect of iron ore reduction by carbon monoxide (CO) can compensate for the temperature drop caused by H2 reduction to some extent. Second, the weak kinetic energy spawned by the light molecular weight of H2 (i.e., 2 g/mol vs. 28 g/mol for CO) overly shortens the penetration depth of the injection stream. This consequently leads to a severe maldistribution of in-furnace gas flows, thus further worsening the gas utilization. Although the unutilized H2 remaining in the off-gas can be recovered by adopting a top-gas-recycling (TGR) system, recycling a large off-gas stream requires a high amount of energy for operating the associated processes of dedusting, condensing, compressing as well as reheating, thus increasing the overall costs. In order to strengthen the (economic) competitiveness of the new steelmaking route, therefore, it is of considerable significance to seek for technically feasible means for achieving a better HSF performance in terms of gas utilization.
As aforementioned, the severe maldistribution of in-furnace gas flows stemming from the overly shortened penetration depth of the injection stream worsens the HSF gas utilization. Thus, one strategy for better gas utilization is to enhance the gas flows in the furnace center. To the best knowledge of the authors, however, pertinent work on the HSF has not been published, although some related studies regarding the COREX (pre-reduction) shaft furnace have been reported in the literature [
25,
26,
27]. Noticing the poor gas utilization caused by weak gas flows in the center of the COREX-3000 shaft furnace with an enlarged reduction zone diameter (>8.2 m), a center gas distributor (CGD) that allows for injecting the reducing gas into the furnace center was devised. Both numerical investigations and physical experiments have been carried out to reveal how the new device and its operation affect the thermochemical behaviors and flow characteristics of the gas and solid phases in the furnace. It has been shown that center gas flows can be effectively enhanced by providing a portion of the reducing gas via a CGD installed at the bottom of the furnace. Consequently, the gas utilization degree and the uniformity of the solid reduction degree are improved. These arguments were later confirmed by subsequent production practice pertaining to the COREX-3000 shaft furnace.
With the intent to achieve better gas utilization for the HSF, the current work was undertaken to clarify whether gas utilization can be improved by adopting the CGD operation and to what extent the gas utilization is increased. To answer the first question, a computational fluid dynamics (CFD) HSF model previously built by the present authors was utilized to perform simulations that mimicked the scenario where the CGD operation is adopted. To answer the second question, analyses were carried out to illuminate how the gas utilization degree varies when changing the CGD feed ratio from 0 to 30% under a condition where the total gas feed rate is fixed at 1400 Nm3/t-pellet. Moreover, the CGD operation was also assessed in terms of the uniformity of the solid reduction degree. It is hoped that the findings of the current work may serve as guidelines for the design of more efficient HSF operations.
2. Modelling
2.1. Process Description
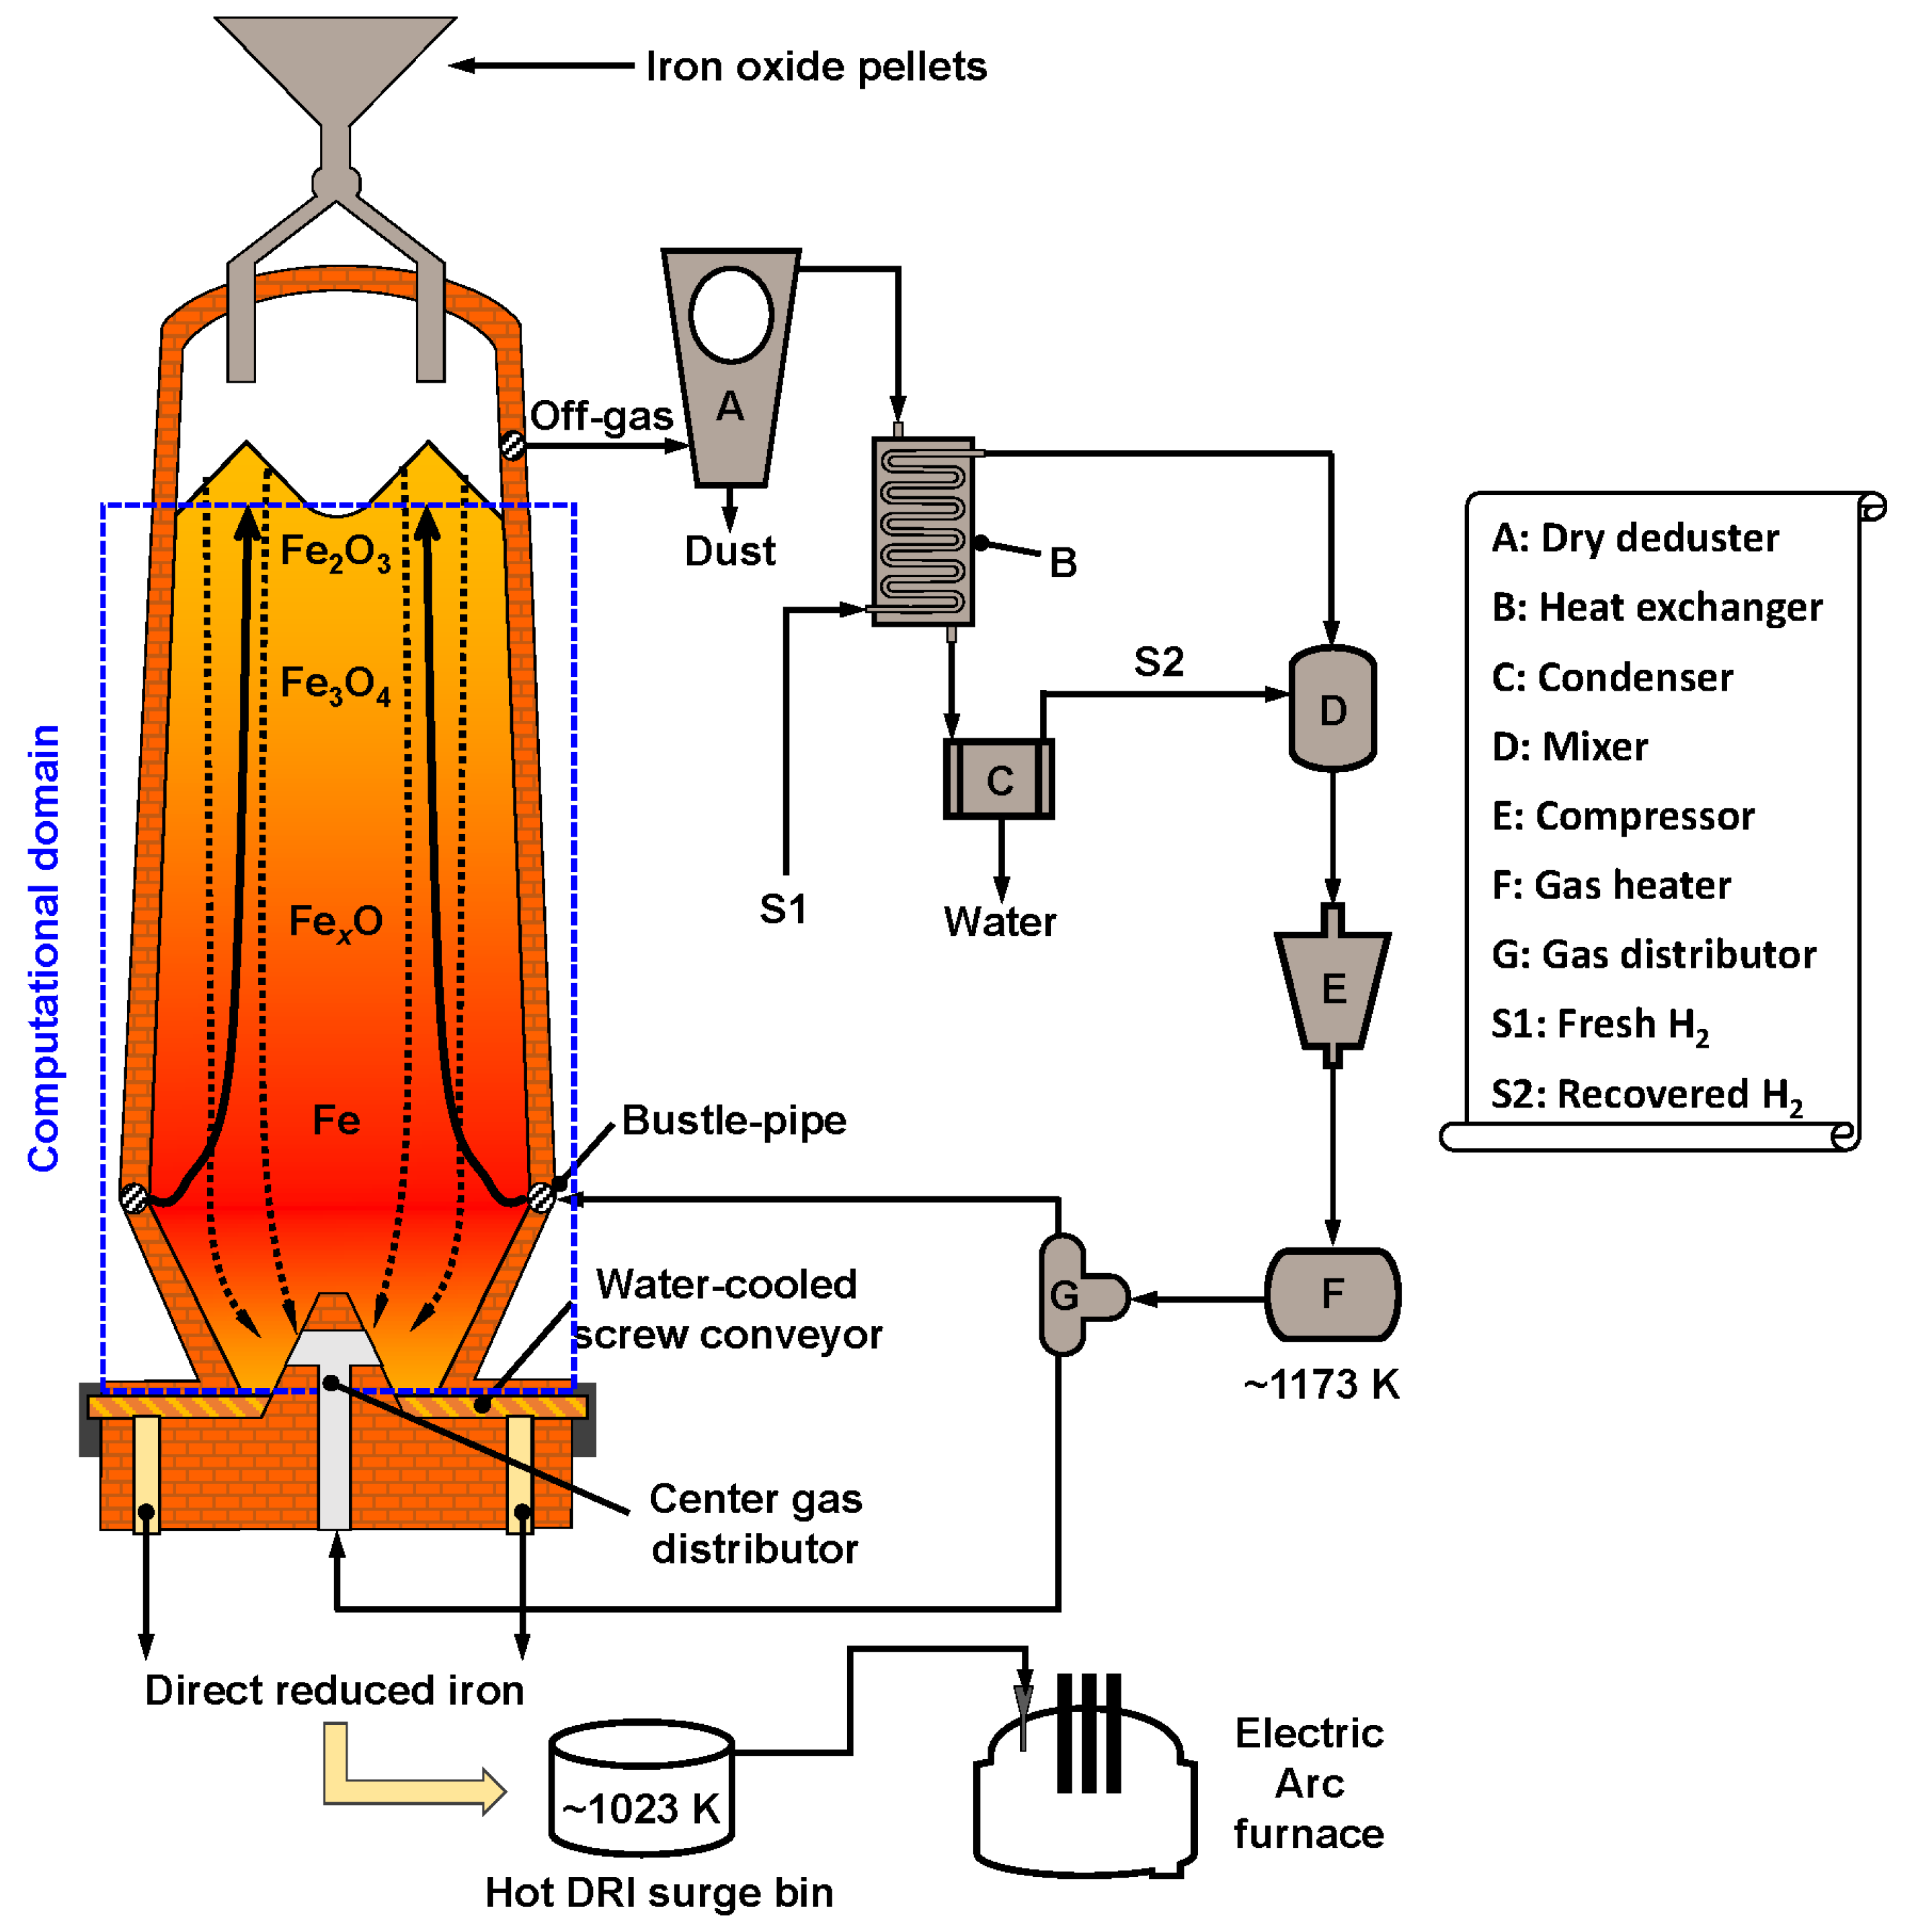
The DRI-production unit numerically studied in the current work is a TGR-HSF with a CGD installed at the bottom, as schematically depicted in
Figure 1. As can be seen, the TGR system for treating the off-gas leaving the furnace top mainly consists of a dry deduster (i.e., (A) in
Figure 1), a counter-flow heat exchanger (B) where a stream of room-temperature fresh H
2 (S1) is injected, a condenser (C) for water removal, a mixer (D) for blending the preheated fresh H
2 from the heat exchanger and the recovered H
2 (S2) from the condenser, a compressor (E) as well as a heater (F). By using a distributor (G), the heated gas is divided into two streams where one is blown into the HSF via a bustle-pipe circumferentially installed around the lower part of the unit. However, the other stream is introduced into the furnace center via the CGD located at the bottom. As the high-temperature gas gradually ascends in the furnace, it heats and reduces the descending column of iron oxide pellets charged at the furnace top. Eventually, the pellets are converted to DRI with a high reduction degree. The hot DRI is then removed by a series of water-cooled screw conveyors and stored in a surge bin, and is finally charged into the EAF where a small quantity of carbon-containing feed is added to aid the refinement.
2.2. Model Basics
Figure 1 also shows the computational domain where the countercurrent gas-solid reactive flows are numerically investigated in the current work utilizing a two-fluid CFD model previously built by the present authors. For brevity, only the model basics are introduced in this section and the reader is referred to [
12,
14,
22] for a thorough description of the numerical model as well as detailed formulae and parameters.
In the CFD model, the multi-species gas and solid phases are mathematically regarded as interpenetrating continua and conservation laws of mass, momentum as well as heat are individually satisfied by each phase. The underlying mechanisms for the inter-phase exchange of mass, momentum as well as heat are formulated as additional source terms in the governing equations that express the conservation laws. For the sake of completeness, the steady-state governing equations are written here as the following generalized coordinate-free form:
where subscript
q denotes the phase under consideration, and
ε,
ρ and
u are the phasic volume fraction, density and velocity vector, respectively.
ϕ and
Γ are the field variable and its associated diffusion coefficient.
S symbolizes the source term formulating the interphase exchange.
By changing
ϕ, the above Equation (1) can represent different conservation laws. When
ϕ becomes 1,
u,
H (enthalpy) or
wi (mass fraction of species
i), the expression is identical to the equation of continuity, momentum, heat or species transport, respectively. Correspondingly,
Γ and
S must take different values/forms. It should be stressed that the key process of iron ore reduction by H
2 is described by the commonly used unreacted shrinking core model, which basically considers three consecutive elementary steps including mass transfer through the boundary film, mass diffusion through the porous shell as well as the chemical reaction at the interface. In addition, the following ideal gas law is applied to factor in the non-negligible influence of temperature and pressure on gas density.
where
Tgas and
Pgas are the temperature and pressure of gas phase, and
γ is the universal gas constant.
Mi is the molecular weight of species
i in gas phase.
Speaking of numerical computing, Equation (1) is discretized utilizing a high-order scheme based on the finite volume method and then iteratively solved. The well-known SIMPLE algorithm is applied to tackle the coupling between pressure and velocity. For guaranteeing high computing accuracy and stability, the under-relaxation factors for all field variables (i.e., velocity, temperature, species mass fraction) are aptly tuned. For each field variable, the corresponding calculation is deemed converged when the relative residual error is less than 1 × 10⁻⁷.
2.3. Model Validation
The CFD model is validated by comparing the calculation results and experimental measurements of a small laboratory-scale shaft furnace operated with pure H2 of which the reduction zone length, inner diameter, pellet size, top gas pressure as well as total Fe in pellet are 2.0 m, 0.129 m, 13.0 mm, 0.116 MPa and 64.6 wt %, respectively. The mass flow rate of the pellet is 34.77 kg/h and the feed rate of pure H2 (preheated to 1180 K) is 2314.8 mol/h. These two values give a specific feed rate of 1490 Nm3-H2/t-pellet, which is higher than the one for a typical syngas-based shaft furnace.
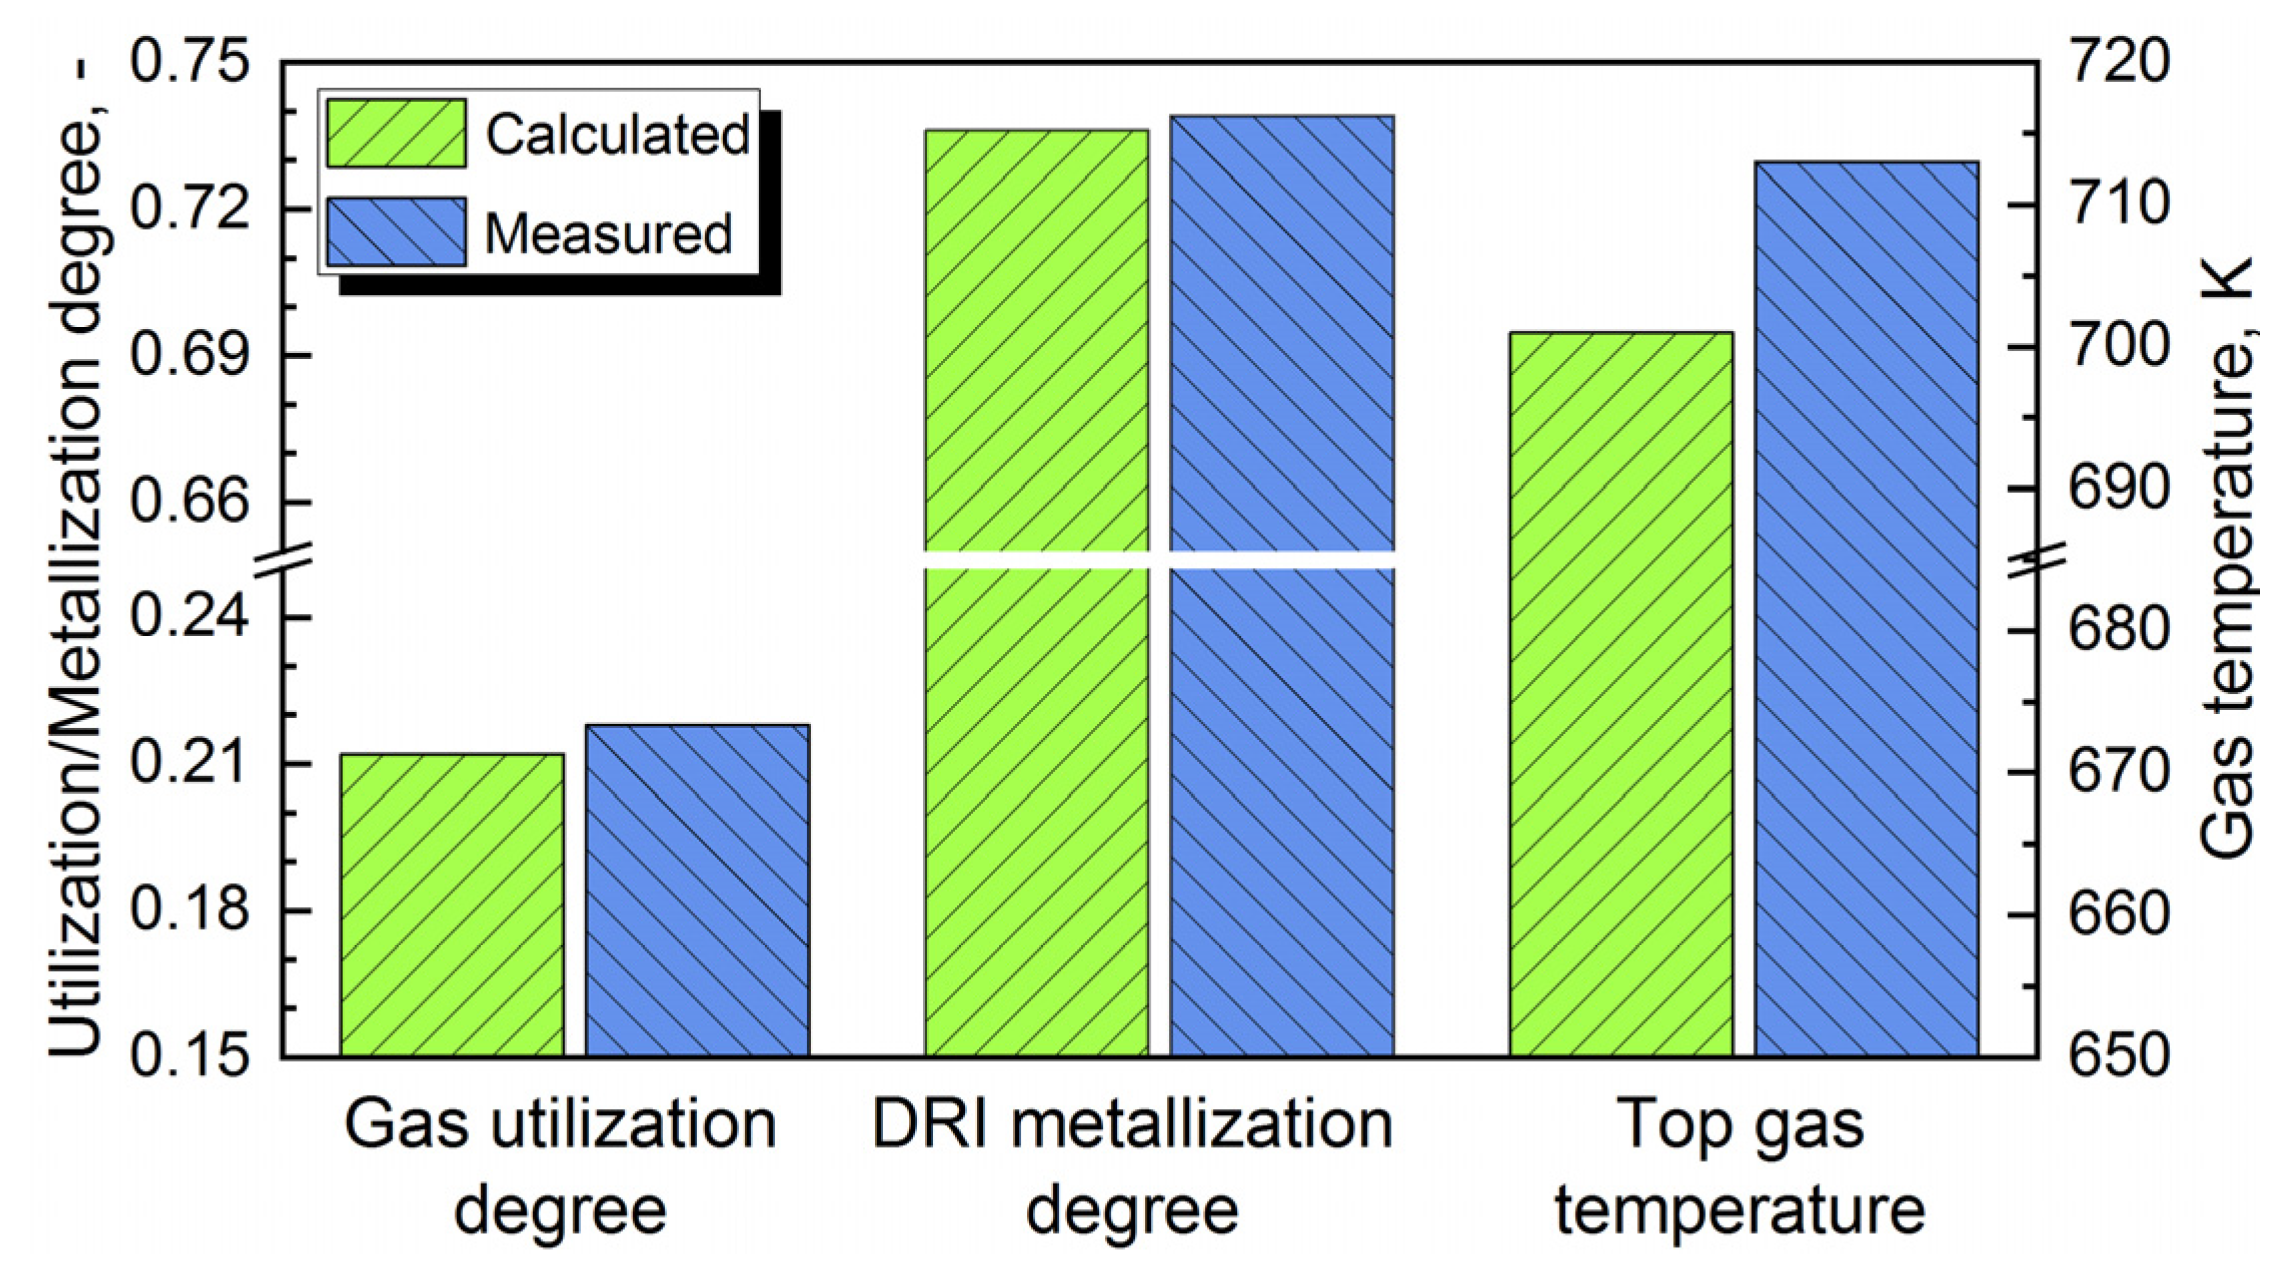
Figure 2 compares the calculated performance indicators including the gas utilization degree, the DRI metallization degree as well as the top gas temperature with the corresponding measured data. It is clearly seen that the calculated results agree well with the measurements, thus proving the accuracy of the CFD model. The relatively big mismatch (i.e., 1.68% in relative error) in temperatures could be attributed to an over-estimation of the coefficient regarding heat transfer between the two phases. Thus, the empirical correlation for estimating the heat transfer coefficient will be further tuned when results from H
2-based pilot- or full-scale shaft furnaces become available in the near future.
3. Results and Discussion
3.1. Computational Grids and Boundary Conditions
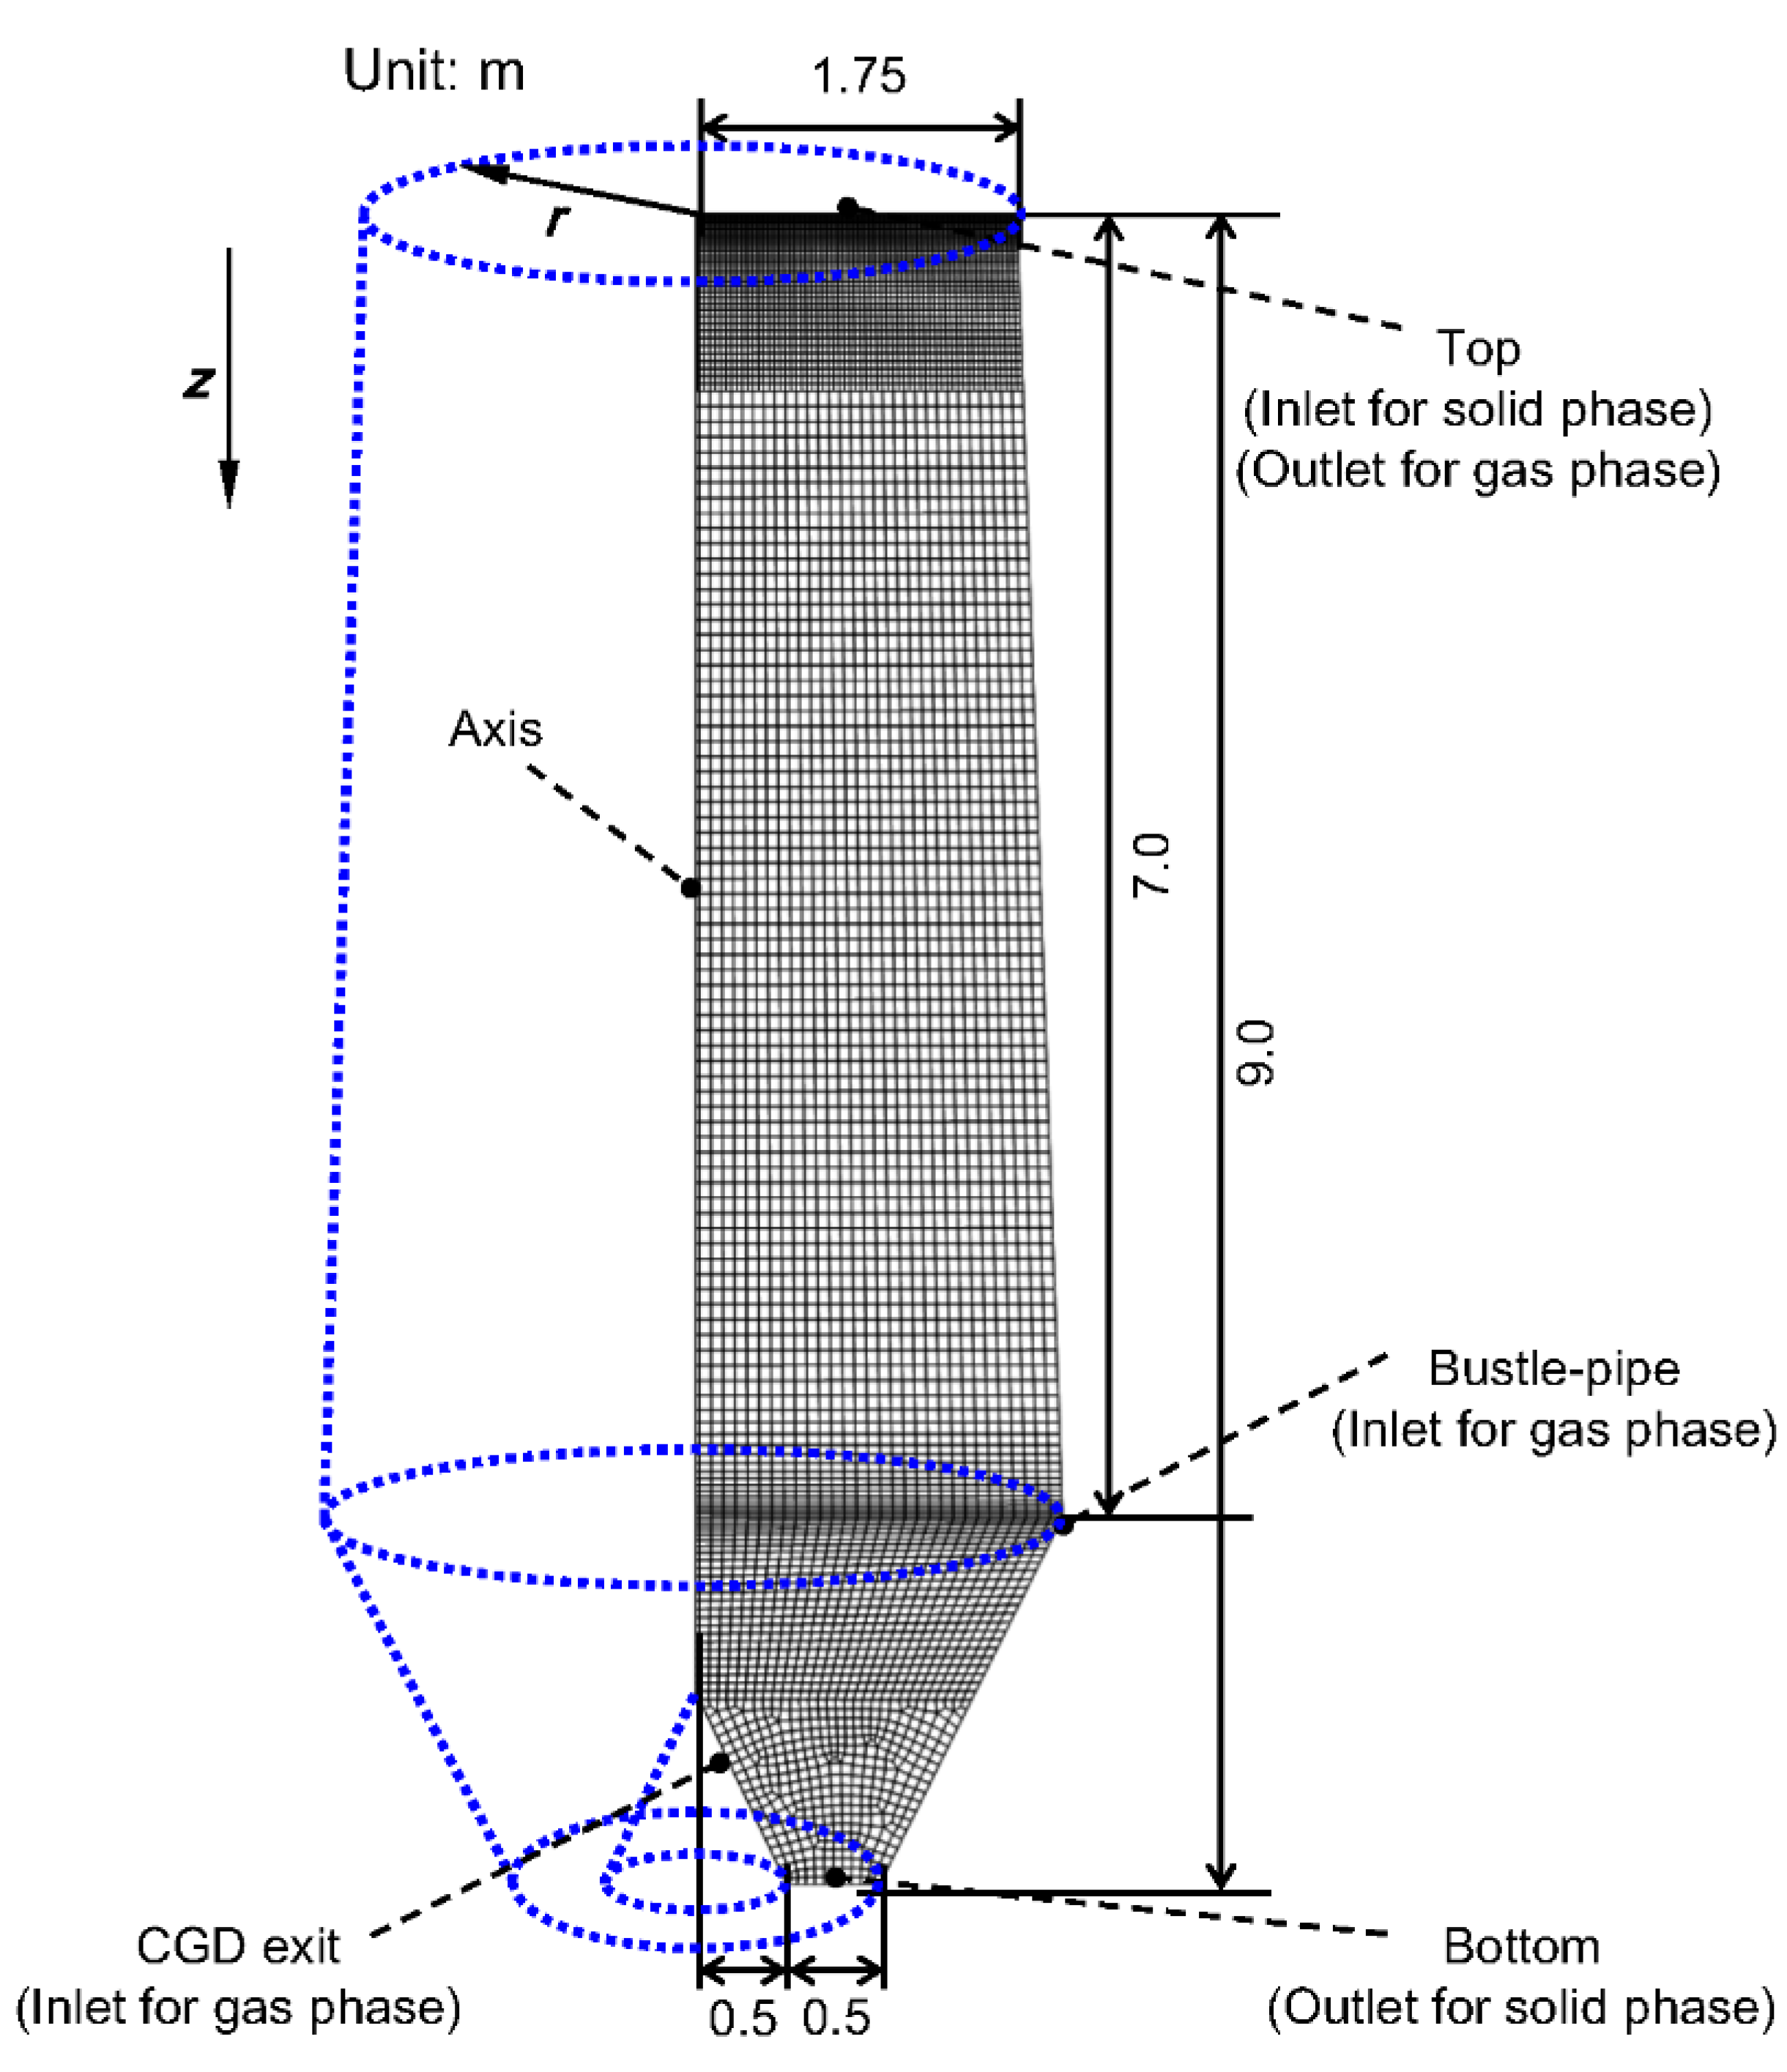
In the current work, the computational domain (marked in
Figure 1) is simplified as a two-dimensional axisymmetric geometry that can be discretized into block-structured grids, as depicted in
Figure 3. Simulations in three-dimensional domains are being undertaken and will be deferred to a future work. It can also be seen in
Figure 3 that the grid resolution is higher in regions where gas velocity and temperature significantly vary, e.g., in the vicinity of the bustle-pipe level and the upper part of the furnace. According to a preliminary analysis on grid sensitivity, the two-dimensional computational domain is discretized into 22,000 quadrilateral grids for the simulation cases studied in the following section.
As for the configuration of boundary conditions, variables that must be specified at the surfaces representing the bustle-pipe and CGD exit include the gas feed rate, temperature as well as composition. At the top surface (cf.
Figure 3), moreover, the solid temperature, feed rate, initial reduction degree as well as gas pressure are required. The CFD model is utilized to clarify how different amounts of CGD feed gas affect the HSF performance by simulating a set of cases, for which the gas feed rates and temperatures are listed in
Table 1.
In
Table 1, Case 1 represents a reference scenario where 1400 Nm
3/t-pellet of pure H
2 is solely injected from the bustle-pipe. As for the remaining cases involving CGD operation, the total gas feed rate is fixed at 1400 Nm
3/t-pellet. However, the CGD feed ratio is increased from 10% (for Case 2) with an increment of 5%. In addition, the gas feed temperature is fixed at 1173 K, as can be seen in the last column of the table.
For all the simulation cases, some key modelling parameters are listed in
Table 2. For the sake of brevity, other information pertaining to the parameter setup is not presented here: the reader is referred to [
12,
14,
22,
28] for pellet composition, auxiliary equations of kinetic parameters as well as empirical correlations of thermodynamic data and physical properties.
3.2. In-Furnace Thermochemical State
Figure 4 shows the distributions of the gas temperature, solid temperature, mole fraction of H
2O as well as solid reduction rate under the conditions of the reference case without CGD operation (i.e., Case 1 in
Table 1). As can be observed in panel (a), the gas temperature gradually decreases as the hot stream injected from the bustle-pipe ascends toward the furnace top where the solid (i.e., iron oxide pellets) charged at 298 K is quickly heated up. This favors the endothermic reaction that eventually consumes the sensible heat carried by the hot stream. In panel (b) of
Figure 4, it can be seen that the mole fraction of H
2O rapidly rises in a semi-oval shaped region (surrounding the injection point) where the reduction reaction is thermodynamically and kinetically facilitated with a high temperature and strong gas flows. However, a stagnant zone (approximately 8.0-m in height and 0.3-m in diameter) with a nearly constant and high H
2O mole fraction (approximately 0.35–0.36) can be found in the furnace center, where the gas temperature is relatively high as shown in panel (a). This is because the gas velocity is fairly low owing to the overly shortened penetration depth of the H
2 stream injected from the circumferentially installed bustle-pipe. As a result, species transport is severely hindered and H
2O accumulates in the stagnant zone, thus suppressing the endothermic reduction and, in turn, giving rise to a locally high temperature. These arguments are substantiated by the results in panel (c), where the solid reduction rate is high in the semi-oval shaped region surrounding the injection point. However, the reduction barely occurs in the furnace center where the stagnant zone is located.
For comparison,
Figure 5 shows the distributions of the gas temperature, mole fraction of H
2O as well as solid reduction rate under the conditions of Case 2 where 140 Nm
3/t-pellet of feed gas is supplied via the CGD. As can be seen, the H
2O mole fraction is effectively lowered in the furnace center where the endothermic reduction is consequently facilitated and in turn decreases the gas temperature. In addition, a stagnant zone with a nearly constant and high H
2O mole fraction can be found in the confluence of the two gas flows originating from the injections of the bustle-pipe and CGD, as sketched in panel (b) of
Figure 5. However, the volume and H
2O mole fraction (approximately 0.32–0.33) of the stagnant zone are observed to be smaller than the ones shown in panel (b) of
Figure 4. It is therefore implied that the CGD operation can lead to a better overall performance of the HSF by simply enhancing the center gas flows.
3.3. Detailed Analysis
In order to clarify to what extent the overall performance of HSF can be improved by adopting the CGD operation, the distributions of solid reduction degree under different CGD feed ratios are demonstrated in
Figure 6, where the 0.025 iso-line (i.e., the dashed curve) is plotted in each panel for identifying a region where the reduction degree is minor. As can be observed in panel (a) of
Figure 6, the solid reduction degree for Case 1 (without CGD operation) generally rises along the vertical downward direction and is minor in the furnace center. With CGD operation, a portion of the hot feed gas is injected into the center of the furnace, where some amount of sensible heat is supplied and, more importantly, the local gas flows are enhanced. This eventually facilitates the reduction reaction in the furnace center and, consequently, the minor reduction degree region is shortened as demonstrated by the results in panels (b–f) for Cases 2–6, respectively. Moreover, it is indicated that a more uniform final reduction degree can be achieved by adopting the CGD operation even though the total gas feed rate is fixed. To confirm this, the distributions of the final reduction degree along the radial direction at the furnace bottom are demonstrated in
Figure 7, where it can be clearly seen that the uniformity of the final reduction degree is well improved when a portion of the feed gas is injected via the CGD, as indicating by the vertical upward arrow in the figure.
From
Figure 6 and
Figure 7, it can also be observed that the ‘shortening’ of the minor reduction degree region as well as the ‘uniforming’ of the final reduction degree distribution are discernable when the CGD feed ratio is increased from 0 to 20%, and then barely progress with a further increase in the ratio. This is because gas flows in the peripheral region of the furnace are overly weakened when excessive amount of the feed gas is injected via the CGD. As a result, the thermochemical condition in the peripheral region of the furnace deteriorates for the reduction reaction, although it is improved in the furnace center with a high CGD feed ratio.
In order to further assess the CGD operation, the final mean reduction degrees corresponding to Cases 1–6 are compared in
Figure 8, where it is evidently shown that the performance indicator rises by about 0.005 when increasing the CGD feed ratio to 20% (i.e., for Case 4) and then slightly drops with an further increase in the CGD feed ratio since gas flows in the peripheral region of the furnace are overly weakened. Correspondingly,
Figure 9 finally compares the (mass-average mean) top gas utilization degrees under different CGD feed ratios and the results show compliant variation with the one in
Figure 8.
4. Conclusions and Future Work
In order to explore technically feasible options for improving the performance of the H2 shaft furnace (HSF), a previously built and validated computational fluid dynamics (CFD) model was employed to assess the potential of the operation based on a center gas distributor (CGD) installed at the bottom of the furnace. To conduct a quantitative analysis on the CGD operation, a set of simulations with different CGD feed ratios was performed in the current work. The main conclusions can be summarized as follows.
(1) Without CGD operation, a relatively large stagnant zone (approximately 8.0-m in height and 0.3-m in diameter) exists in the furnace center where the gas flows are weak owing to an overly shortened penetration depth of the H2 stream solely injected from the circumferentially installed bustle-pipe.
(2) When adopting the CGD operation, the center gas flows can be effectively enhanced, consequently squeezing the stagnant zone and thus leading to a better overall performance of the HSF.
(3) Under the investigated condition where the total gas feed rate is fixed at 1400 Nm3/t-pellet, the uniformity of the final reduction degree (mean values ranging from 0.8846 to 0.8896) of the solid phase (i.e., pellets) is well improved by injecting a portion of the feed gas through the CGD.
(4) For the final mean reduction degree of solid and top gas utilization degree, the two performance indicators rise to maximal values when the CGD feed ratio is increased to 20% and then slightly drop with a further increase in the ratio.
In future work, the results of simulations in three-dimensional domains and involving more factors such as the CGD structure parameters, furnace top pressure as well as pellet size and composition will be reported. In addition, the overall pressure drop, fluidization factor and exergy will be used to carry out multi-criteria optimization of the overall process.
Author Contributions
Conceptualization, L.S. and Z.Z.; literature review and original draft preparation, S.Y. and L.S.; review and editing, L.S. and Z.Z.; funding acquisition, S.Y. and L.S. All authors have read and agreed to the published version of the manuscript.
Funding
This research was funded by the Natural Science Foundation of Liaoning Province of China [grant number 2023-MS-291], National Science Foundation of China [grant number 52374329] as well as China Baowu Low Carbon Metallurgy Innovation Foundation [grant number BWLCF202119].
Data Availability Statement
Data are contained within the article.
Conflicts of Interest
The authors declare no conflicts of interest. The funders had no role in the design of the study or interpretation of the results.
References
- Pei, M.; Petäjäniemi, M.; Regnell, A.; Wijk, O. Toward a Fossil Free Future with HYBRIT: Development of Iron and Steelmaking Technology in Sweden and Finland. Metals 2020, 10, 972. [Google Scholar] [CrossRef]
- Patisson, F.; Mirgaux, O. Hydrogen Ironmaking: How It Works. Metals 2020, 10, 922. [Google Scholar] [CrossRef]
- Holappa, L. A General Vision for Reduction of Energy Consumption and CO2 Emissions from the Steel Industry. Metals 2020, 10, 1117. [Google Scholar] [CrossRef]
- Zhang, X.; Jiao, K.; Zhang, J.; Guo, Z. A review on low carbon emissions projects of steel industry in the world. J. Clean. Prod. 2021, 306, 127259. [Google Scholar] [CrossRef]
- Liu, W.; Zuo, H.; Wang, J.; Xue, Q.; Ren, B.; Yang, F. The production and application of hydrogen in steel industry. Int. J. Hydrogen Energy 2021, 46, 10548–10569. [Google Scholar] [CrossRef]
- Vogl, V.; Åhman, M.; Nilsson, L.J. Assessment of hydrogen direct reduction for fossil-free steelmaking. J. Clean. Prod. 2018, 203, 736–745. [Google Scholar] [CrossRef]
- Duarte, P. Trends in hydrogen steelmaking. Steel Times Int. 2020, 44, 35–39. [Google Scholar]
- Wang, R.R.; Zhao, Y.Q.; Babich, A.; Senk, D.; Fan, X.Y. Hydrogen direct reduction (H-DR) in steel industry—An overview of challenges and opportunities. J. Clean. Prod. 2021, 329, 129797. [Google Scholar] [CrossRef]
- Kim, W.; Sohn, I. Critical challenges facing low carbon steelmaking technology using hydrogen direct reduced iron. Joule 2022, 6, 2228–2232. [Google Scholar] [CrossRef]
- Ghadi, A.Z.; Valipour, M.S.; Vahedi, S.M.; Sohn, H.Y. A review on the modeling of gaseous reduction of iron oxide pellets. Steel Res. Int. 2020, 91, 1900270. [Google Scholar] [CrossRef]
- Rechberger, K.; Spanlang, A.; Conde, A.S.; Wolfmeir, H.; Green, C.H. Hydrogen-Based Direct Reduction for Low-Carbon Steelmaking. Steel Res. Int. 2020, 91, 2000110. [Google Scholar] [CrossRef]
- Shao, L.; Wang, Q.; Qu, Y.; Saxén, H.; Zou, Z. A Numerical Study on the Operation of the H2 Shaft Furnace with Top Gas Recycling. Metall. Trans. B 2020, 52, 451–459. [Google Scholar] [CrossRef]
- Krüger, A.; Andersson, J.; Grönkvist, S.; Cornell, A. Integration of water electrolysis for fossil-free steel production. Int. J. Hydrogen Energy 2020, 45, 29966–29977. [Google Scholar] [CrossRef]
- Shao, L.; Zhang, X.; Zhao, C.; Qu, Y.; Saxén, H.; Zou, Z. Computational analysis of hydrogen reduction of iron oxide pellets in a shaft furnace process. Renew. Energy 2021, 179, 1537–1547. [Google Scholar] [CrossRef]
- Pimm, A.J.; Cockerill, T.T.; Gale, W.F. Energy system requirements of fossil-free steelmaking using hydrogen direct reduction. J. Clean. Prod. 2021, 312, 127665. [Google Scholar] [CrossRef]
- Bhaskar, A.; Abhishek, R.; Assadi, M.; Somehesaraei, H.N. Decarbonizing primary steel production: Techno-economic assessment of a hydrogen based green steel production plant in Norway. J. Clean. Prod. 2022, 350, 131339. [Google Scholar] [CrossRef]
- Liu, Z.; Lu, S.; Wang, Y.; Zhang, J.; Cheng, Q.; Ma, Y. Study on optimization of reduction temperature of hydrogen-based Shaft Furnace—Numerical simulation and multi-criteria evaluation. Int. J. Hydrogen Energy 2023, 48, 16132–16142. [Google Scholar] [CrossRef]
- Qiu, Z.; Yue, Q.; Yan, T.; Wang, Q.; Sun, J.; Yuan, Y.; Che, Z.; Wang, Y.; Du, T. Gas utilization optimization and exergy analysis of hydrogen metallurgical shaft furnace. Energy 2023, 263, 125847. [Google Scholar] [CrossRef]
- Ghadi, A.Z.; Radfar, N.; Valipour, M.S.; Sohn, H.Y. A Review on the Modeling of Direct Reduction of Iron Oxides in Gas-Based Shaft Furnaces. Steel Res. Int. 2023, 94, 2200742. [Google Scholar] [CrossRef]
- Li, Z.; Qi, Z.; Zhang, L.; Guo, M.; Liang, D.; Dong, Q. Numerical simulation of H2-intensive shaft furnace direct reduction process. J. Clean. Prod. 2023, 409, 137059. [Google Scholar] [CrossRef]
- Boretii, A. The perspective of hydrogen direct reduction of iron. J. Clean. Prod. 2023, 429, 139585. [Google Scholar] [CrossRef]
- Shao, L.; Xu, J.; Saxén, H.; Zou, Z.S. A numerical study on process intensification of hydrogen reduction of iron oxide pellets in a shaft furnace. Fuel 2023, 348, 128375. [Google Scholar] [CrossRef]
- Cavaliere, P.; Perrone, A.; Dijon, L.; Laska, A.; Koszelow, D. Direct reduction of pellets through hydrogen: Experimental and model behaviour. Int. J. Hydrogen Energy 2024, 49, 1444–1460. [Google Scholar] [CrossRef]
- Tian, X.; Zhou, H.; Zhang, Y.; Zhang, T.; Huang, J.; Cai, H.; Kou, M.; Wu, S. Numerical simulation of the influence of operating parameters on the inner characteristics in a hydrogen-enriched shaft furnace. Int. J. Hydrogen Energy 2024, 55, 1131–1142. [Google Scholar] [CrossRef]
- Zhang, X.; Luo, Z.; Zou, Z. Numerical Analysis on Performance of COREX CGD Shaft Furnace with Top Gas Recycling. ISIJ Int. 2019, 59, 1972–1981. [Google Scholar] [CrossRef]
- Zhou, H.; Xu, K.; Hu, Y.; Wu, S.; Kou, M.; Luo, Y. Numerical study on the influence of center gas supply device on gas-solid residence time distribution in COREX shaft furnace. Part. Sci. Technol. 2021, 39, 887–895. [Google Scholar] [CrossRef]
- Zhou, H.; Xu, K.; Hu, Y.; Tian, X.; Kou, M.; Wu, S.; Shen, Y. Influence of burden profile on gas-solid distribution in COREX shaft furnace with center gas supply by CFD-DEM model. Powder Technol. 2021, 392, 672–679. [Google Scholar] [CrossRef]
- Takahashi, R.; Takahashi, Y.; Yagi, J.; Omori, Y. Operation and Simulation of Pressurized Shaft Furnace for Direct Reduction. Trans. Iron Steel Inst. Jpn. 1986, 26, 765–774. [Google Scholar] [CrossRef]
- Zou, R.P.; Yu, A.B. The packing of spheres in a cylindrical container: The thickness effect. Chem. Eng. Sci. 1995, 50, 1504–1507. [Google Scholar] [CrossRef]
| Disclaimer/Publisher’s Note: The statements, opinions and data contained in all publications are solely those of the individual author(s) and contributor(s) and not of MDPI and/or the editor(s). MDPI and/or the editor(s) disclaim responsibility for any injury to people or property resulting from any ideas, methods, instructions or products referred to in the content. |
© 2024 by the authors. Licensee MDPI, Basel, Switzerland. This article is an open access article distributed under the terms and conditions of the Creative Commons Attribution (CC BY) license (https://creativecommons.org/licenses/by/4.0/).


