1. Introduction
Lithium-ion batteries are used in a wide range of applications, including electric vehicles, portable electronic devices, and stationary energy storage systems for microgrids. Accurately assessing a battery’s state of charge (SoC) is crucial for optimizing charging speed and battery life, preventing overcharging or deep discharging, and ensuring the safety and reliability of battery-powered systems.
According to [
1], the SoC is defined as the ratio of the difference between the amount of charge of a full battery and the amount of discharged charge in relation to the amount of charge of a full battery. According to this definition, the battery is fully charged if the charging current at constant voltage does not change within 2 h.
There are many different methods for measuring or estimating SoC, each with its own advantages and limitations. Most of these methods are based on: (i) the battery voltage, (ii) the battery current, or (iii) the battery model. Voltage-based methods estimate the SoC based on the measured open circuit voltage (OCV) of the battery [
2,
3]. Depending on the model, their accuracy averages around 88%, with a range of 69% to 97%. These methods are simple and easy to implement but have limited accuracy and are temperature dependent. For a battery to reach its open circuit voltage, it must rest for a long period of time. Depending on the battery type, the relaxation time can be several hours or more. This limitation prohibits real-time estimation using look-up tables only. In order to achieve satisfactory accuracy, it is necessary to expand the models with additional parameters (up to 10 different parameters). Increasing the number of parameters leads to an increase in the number of arithmetic operations and the execution time of the algorithm. Voltage hysteresis, i.e., the difference in OCV between charge and discharge cycles for the same SoC, can also affect the accuracy of voltage-based methods [
4,
5]. To solve the problem of hysteresis, additional models are used to describe the hysteresis, which increases the complexity of these methods. The uncertainty of the voltage measurements can also lead to errors in the estimation process.
Current-based methods estimate the SoC based on the measured charge or discharge current of the battery. The Coulomb counting method, which integrates battery current over time, is often used to estimate capacity and SoC [
6,
7,
8]. Current-based methods are simple and easy to implement, but the initial value of SoC must be known, and cumulative errors occur due to measurement inaccuracies and variations in battery capacity and efficiency. To address the problem of measurement uncertainty, additional mathematical analysis and the development of models to reduce this uncertainty are required. In addition, for batteries with an unknown SoC, at least one charge and discharge cycle must be performed to determine the SoC, which increases the time required for SoC estimation.
Methods for estimating the SoC that use mathematical models are based on estimating the open circuit voltage of the battery. These are more or less complex mathematical models that can be divided into four categories: empirical models, ECMs (equivalent circuit models), electrochemical models, and data-driven models [
9]. In empirical models, the open-circuit voltage of the battery is described as a linear or non-linear mathematical function of the SoC and current [
10]. Such models represent the characteristics of the battery using polynomials or other mathematical expressions. The parameters of these models are estimated using the least-squares method. ECM models can consist of a voltage source (connection to the state of charge), a resistor (internal resistance of the battery), and several RC circuits (battery dynamics) to describe the electrical relationship between the input data (current, SoC, temperature, state of health, …) and the battery terminal voltage [
11,
12]. By increasing the number of model parameters, it is possible to provide a more detailed description of the dynamics of the battery open circuit voltage. Depending on the application of these models, there is a trade-off between the complexity and accuracy of the ECM models [
13]. The Kalman filter (KF) and its variations are commonly used model-based methods that iteratively update the parameters of the battery model based on the measured voltage and current [
14,
15]. The battery model is expressed in the state space, and one of the state variables is SoC [
16]. Electrochemical models describe the electrochemical behavior of a battery and use differential equations to relate the battery voltage and current to its SoC [
17,
18]. They offer high accuracy but require significant computational resources and are sensitive to inaccuracies in the calculation of the model parameters. The sensitivity of each parameter to the output voltage varies, making it impossible to accurately determine all parameters. Data-driven models mainly include neural networks, autoregressive models, and support vector machine (SVM) models [
13]. These models require a large amount of training data. Based on the collected data, these models can estimate the SoC with high precision. With a small amount of data, the accuracy of the SoC estimation decreases significantly, as does the applicability of the model to different battery types. Hybrid methods combine two or more of the above methods to improve the accuracy and robustness of SoC estimation [
19,
20,
21]. They can provide high accuracy and robustness under different operating conditions but require more computational resources and effort in calibration.
A method based on the change of the transfer function of the battery voltage with respect to the current pulse when the SoC changes due to the nonlinearity of the battery model is presented in [
22]. During learning, reference transfer functions for individual SoCs are determined and stored in the database as hyperspace points whose coordinates are the parameters of the transfer function. For the unknown SoC, the corresponding transfer function is estimated and the SoC is determined based on the Euclidean distance to the reference points. This method does not require knowledge of the initial state of the SoC. Estimating the parameters of the transfer function during online operation is time-consuming and challenging.
This paper presents a new method for estimating the state of charge of lithium-ion cells based on the learned reference transfer functions of the battery voltage with respect to the current pulse. To avoid an optimization process during the real-time estimation of SoC, the ISE criterion of the time response of the reference transfer function and the measured voltage signal is calculated for the unknown SoC. The ISE criterion is 0 if the transfer function fully describes the actual battery system and is positive in all other cases. Since each ISE value has a corresponding SoC value according to the reference transfer function used, the SoC estimation is made possible by searching for the minimum ISE value. The advantages of this model are its simplicity of use in real time and the avoidance of real-time optimization procedures. This approach ensures robustness and the possibility of implementation under real working conditions, which is particularly useful for electric vehicle batteries.
The algorithm itself consists of a series of simple mathematical calculations, which reduces the complexity of the algorithm and the computing power and shortens the duration of the estimation. The relative estimation error is acceptable over a wide range of the cell’s operating range.
Section 2 describes the mathematical model of the cell used for estimation and the principle of determining the coefficients of the model’s transfer function using the optimization method.
Section 3 describes algorithms for estimating the state of charge, taking into account the type of lithium-ion cell.
Section 4 presents an experimental verification of the algorithm and analyses of the efficiency of the method. The estimated SoC, battery cell type, and relative error were calculated for eight different states of charge and four different battery cell types. In
Section 5, an analysis of the influence of temperature on the estimation errors is performed, and in
Section 6, the conclusion is presented.
2. The Transfer Function of the Battery Cell
The method proposed in this paper to estimate the SoC of a battery cell and to recognize the cell type is based on the idea that the transfer function of a lithium-ion cell, i.e., the voltage response to a current pulse, depends on the SoC and the cell type. To implement the method, a prior learning phase is required to determine the reference model transfer functions of the cell for known states of charge. These transfer functions form the so-called space of reference points. The transfer function calculated from the voltage response of the cell to the current pulse for the estimated SoC is compared to these reference points.
2.1. Lithium-Ion Cell Model
The transfer functions used in the implementation of the proposed SoC estimation method are calculated based on the electrical model of the cell, i.e., the equivalent circuit model (ECM). A possible ECM of a lithium-ion cell that describes the electrical behavior of the cell sufficiently and accurately is shown in
Figure 1 [
22]. The model consists of an ideal voltage source (U
OC), which represents the open-circuit voltage of the battery, the internal resistance (R
i) of the battery, and two RC circuits.
RC circuits represent the dynamics of polarization and diffusion between electrodes, where:
R1—SEI layer resistance [Ω]
C1—SEI layer capacity [F]
R2—the battery’s cell element resistance [Ω]
C2—the internal battery’s cell capacity [F]
The time constants of these RC circuits differ by several orders of magnitude [
23]. An RC circuit with a smaller time constant represents a fast response of the cell voltage, the influence of which can be perceived immediately after the onset of the current pulse. The RC circuit with a higher time constant represents the slower response of the cell voltage, which becomes visible during the relaxation of the battery. After completion of battery charging or discharging, it takes a long time for the open-circuit voltage of the battery to reach a steady state [
24].
The transfer function of the cell, which is described by the model in
Figure 1, is determined by the ratio of the voltage response signal and the input current signal in the Laplace domain at the operating point. The operating point is determined by the SoC and the open circuit voltage U
OC. The transfer function has the following form:
where:
s—complex frequency
K—gain of the transfer function
bi∀i = 0, …, 2—nominator coefficients of the transfer function
ai∀i = 0, …, 2—denominator coefficients of the transfer function
The transfer function (1) shows the response of the small-signal voltage at the operating point, which is determined by the open-circuit voltage
UOC and SoC, to the current pulse. The estimated total voltage response
Ub, which corresponds to the measured voltage, consists of the transfer function current impulse response with added open-circuit voltage
UOC:
where:
G(s)—the battery’s cell transfer function
I(s)—the battery’s cell current in the Laplace domain
Ub(s)—the battery’s cell voltage in the Laplace domain
According to [
16], the model from
Figure 1 can be simplified so that only the dominant zero in the numerator of the transfer function is used, and the equivalent transfer function
Ge(s) with one zero and two poles is obtained:
Using Equation (3), the overall voltage response of the lithium-ion cell
Ub to the input current pulse I can be described in the Laplace domain by Equation (4):
By reducing the degree of the polynomial in the numerator of the transfer function, it will be shown later in the paper that the SoC estimation method has been simplified, while the accuracy of the method is satisfactory.
2.2. Determination of Transfer Function Coefficients
The coefficients
b1,
b0,
a2, and
a1 of the transfer function (3) were determined using the Nelder–Mead simplex optimization method in MATLAB. Optimization was performed according to the ISE criterion defined in Equation (5):
where:
Ub(t)—simulated the battery’s cell voltage response signal to the current pulse
Um(t)—measured the battery’s cell model voltage to the current pulse
T—duration of the simulation
t—time in seconds
The criterion function (5) is determined as a MATLAB m-function of the form
ISE = f_ISE (
b1,
b0,
a2,
a1). The
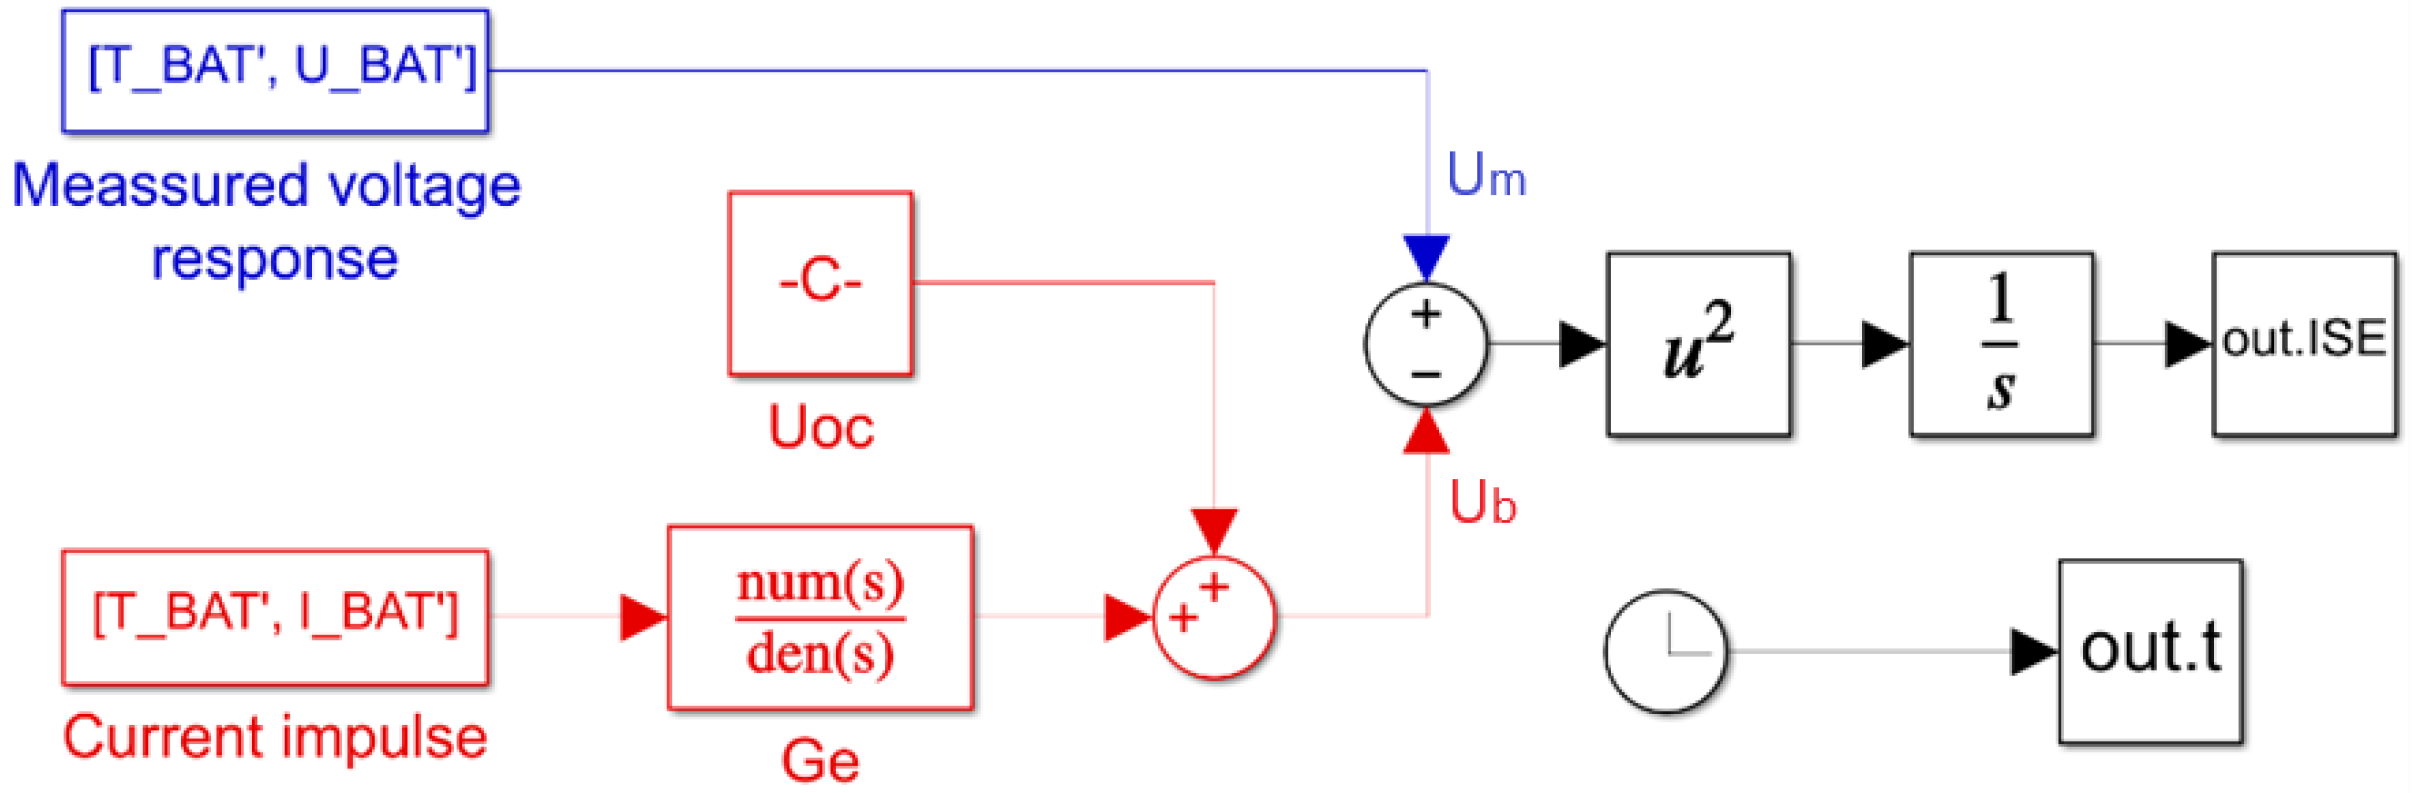
f_ ISE function uses the MATLAB/Simulink model shown in
Figure 2 to calculate the criterion function.
The criterion function
f_ ISE defines the coefficients in the transfer function
Ge(s) of the model in
Figure 1, from the input arguments determined by the optimization function. The simulated voltage response
Ub in the Simulink model in
Figure 1 is calculated using Equation (4) by adding the precalculated voltage of the operating point
UOC to the output of the transfer function. The input of the transfer function is the measured current pulse
I, which is used during measurements to obtain the voltage
Um. To determine the actual constant value of the open circuit voltage
UOC used in Equation (4), the battery cell was unloaded for a long time to stabilize the voltage. The
UOC is calculated as the average of the first 100 measured voltage points before the start of the current pulse. The criterion function is the last value of the
out.ISE signal.
The measured voltage
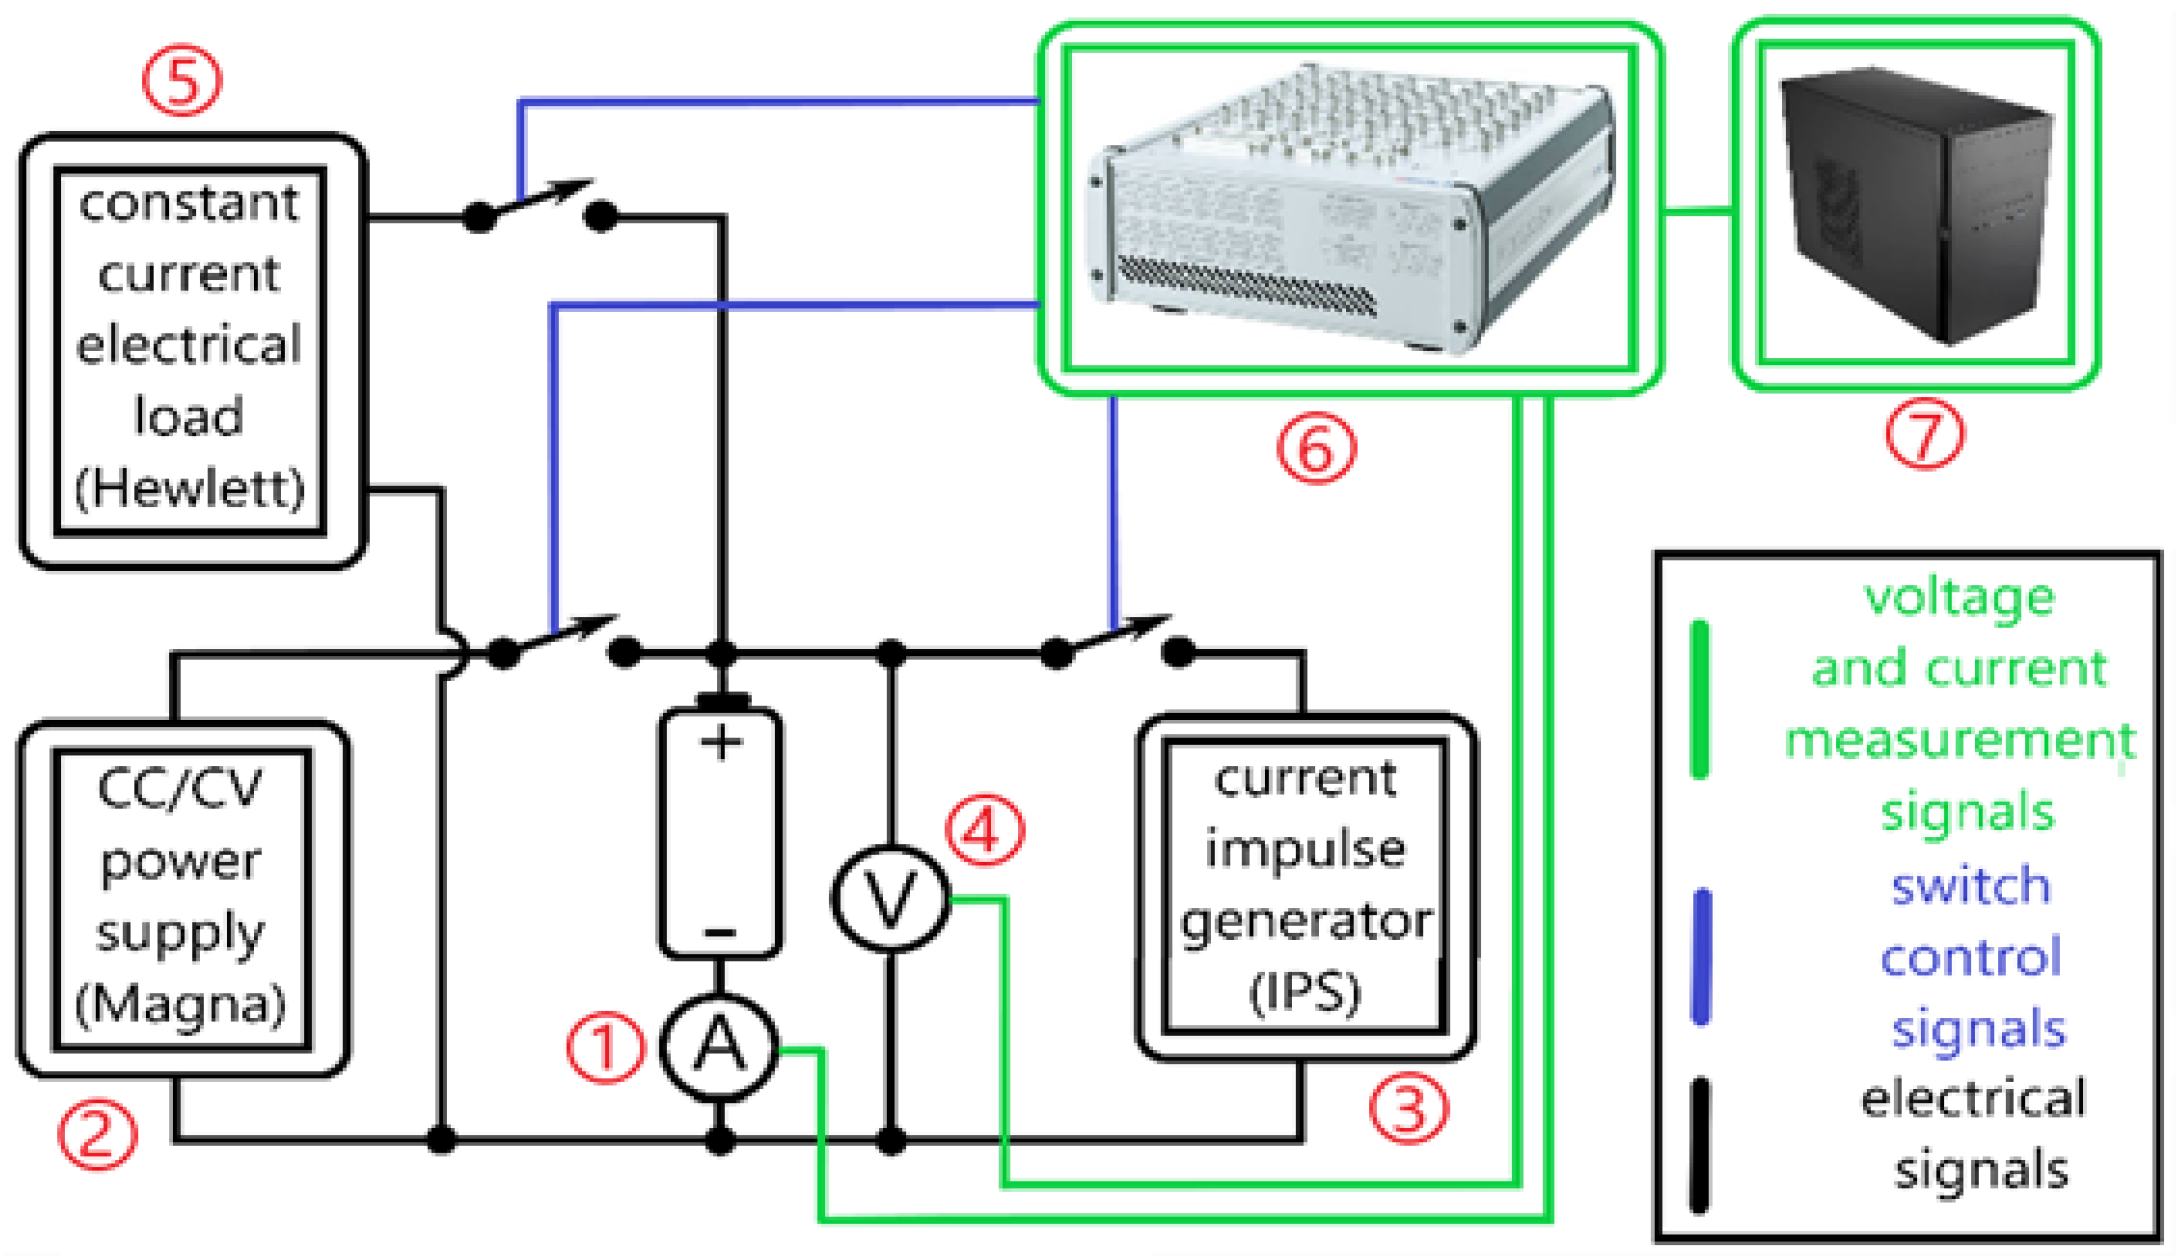
Um is the voltage response of the cell to excitation by a current pulse that is as close as possible to the ideal square wave pulse formed by a suitable electronic circuit. The experimental setup for generating a current pulse and measuring the voltage
Um is shown in
Figure 3. The setup also allows for the charging and discharging cycles of battery cells. The following devices were used for the experimental setup:
- (1)
Current sensor—HY 5-P,48275, JP2
- (2)
Current source—Magna—Power electronics, XR 50-40, 2 kW
- (3)
Current pulse source—Iskra Power Supply (IPS), MA 4171, 1 A, 25 V
- (4)
Voltmeter potential divider
- (5)
Electronic load—Hewlett Packard-6050a
- (6)
Microcomputer for measurement and control—dSPACE-MicroLabBox
- (7)
MATLAB/Simulink package on the PC computer
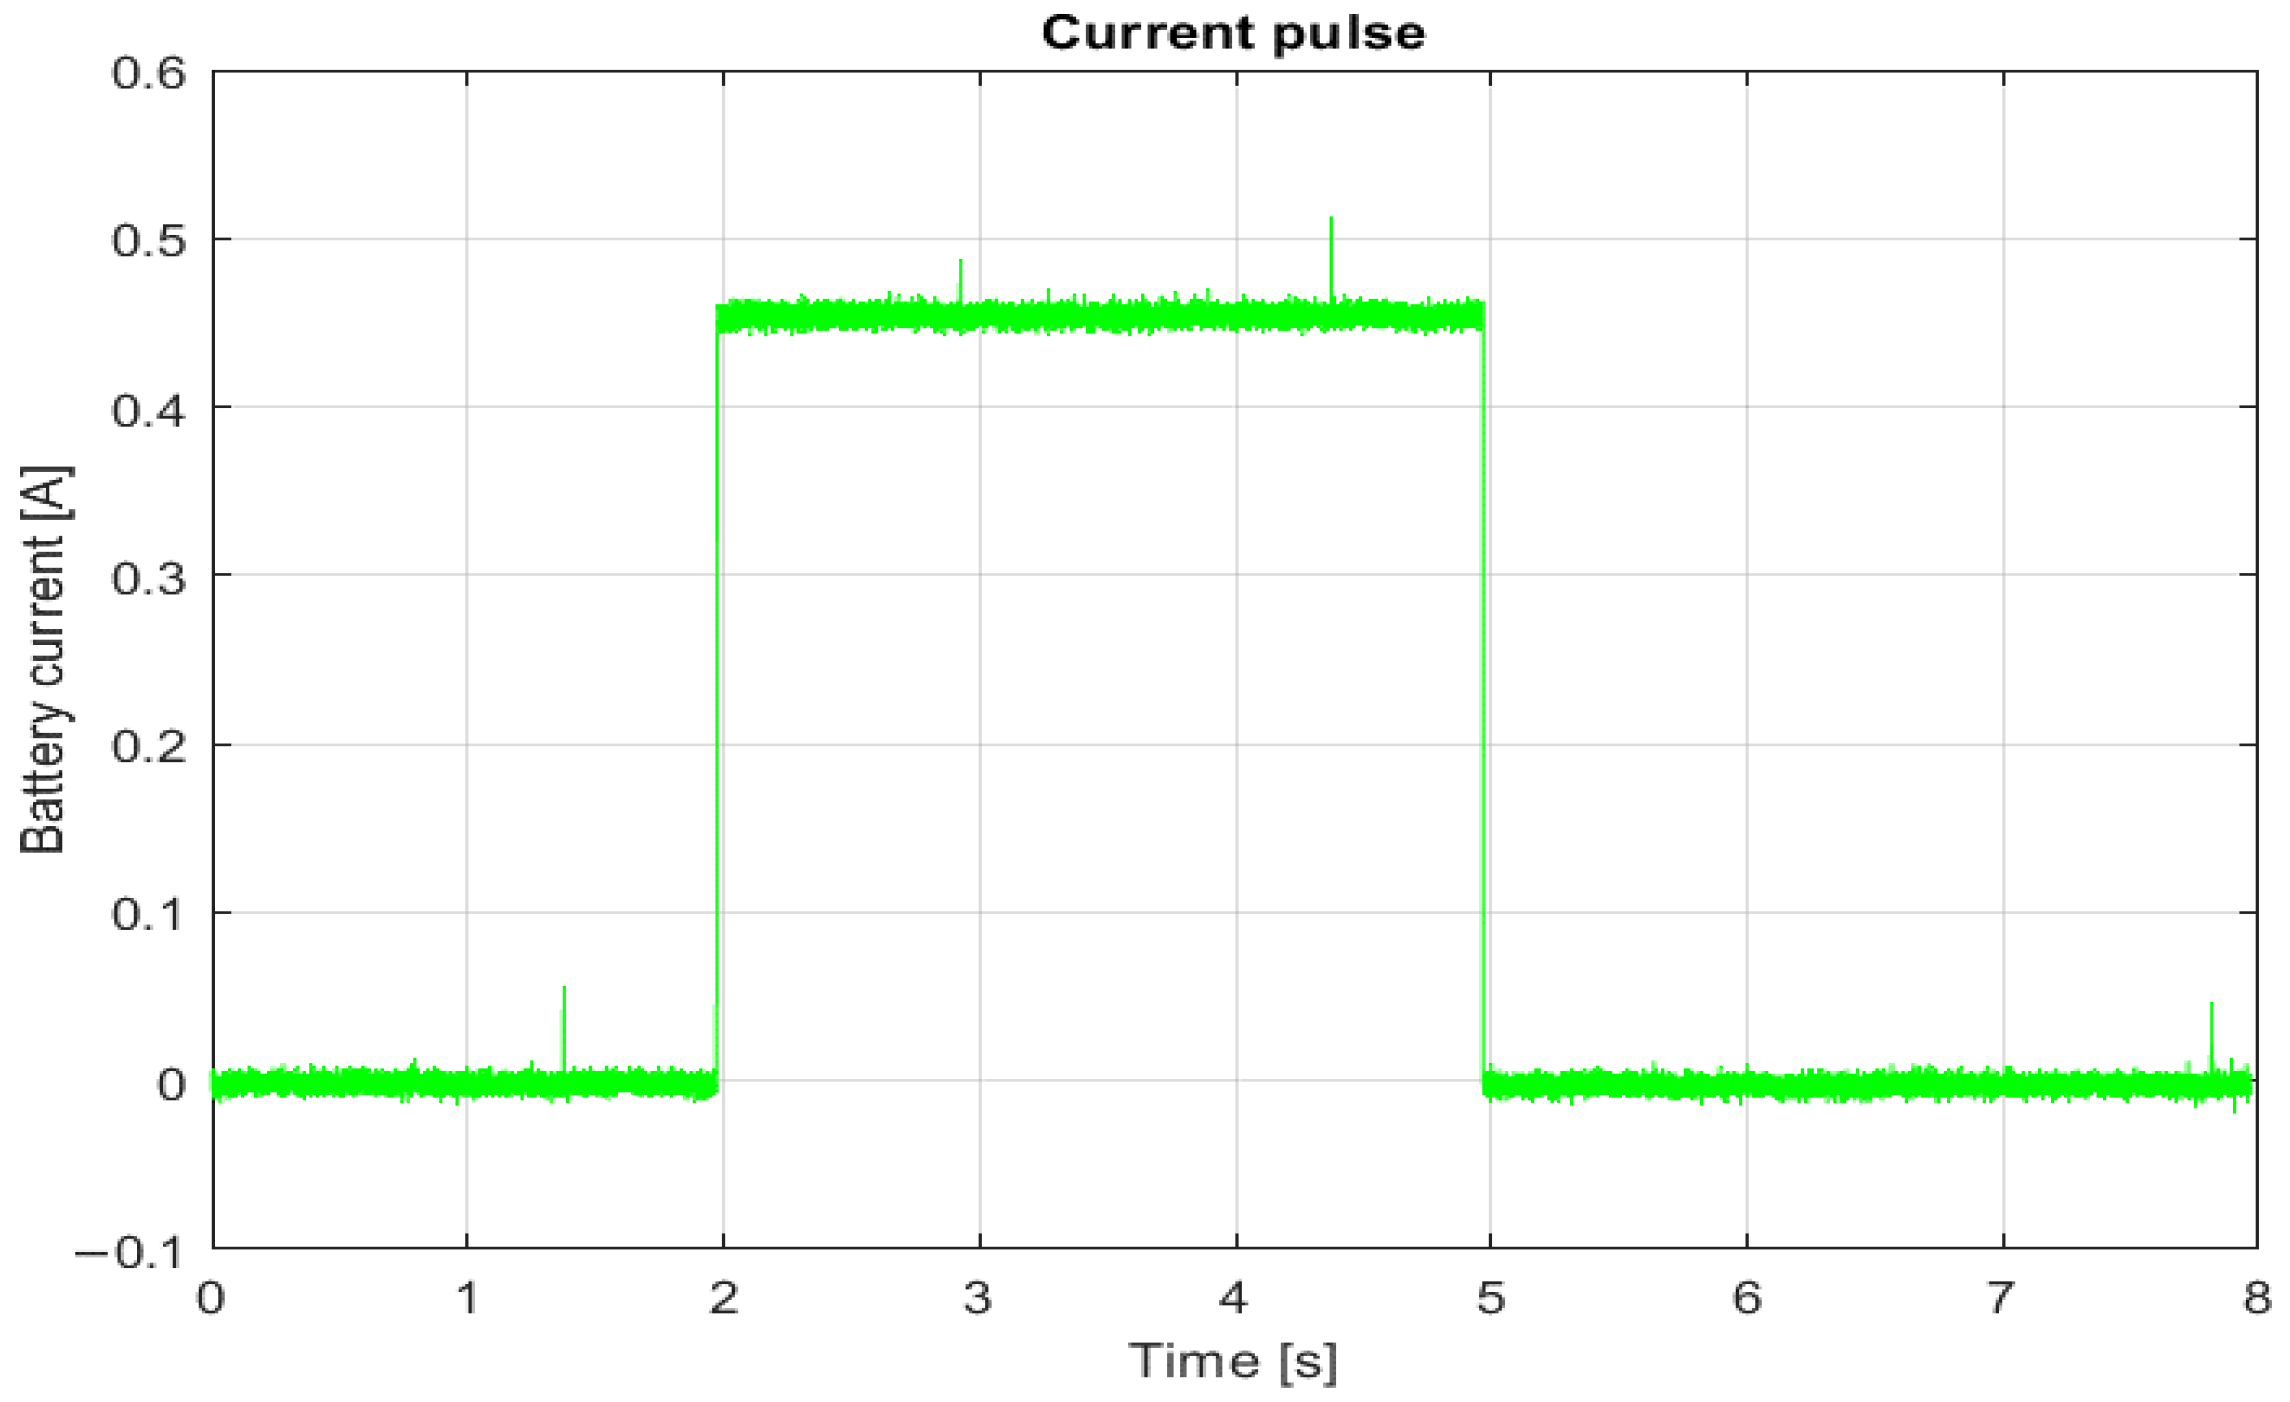
A dSpace microcomputer, programmed with a MATLAB script and a real-time toolbox, was used to control the switches and sources and to acquire measurement data. To capture the dynamics of the voltage response to the current pulse, the resolution of the data recording is 100 μs (the maximum resolution of the dSpace microcomputer). The current pulse is 0.45 A and lasts 3 s (
Figure 4). The magnitude of the current pulse was chosen as a minimum value that makes the voltage change during the duration of the current pulse, large enough so that the measurement noise can be neglected. In this way, the voltage response remains within the linear range of cell operation. The selected pulse width allows fast and slow changes in battery voltage to be recorded without taking too long to estimate the state of charge. The rise time of the current pulse is within 2 ms.
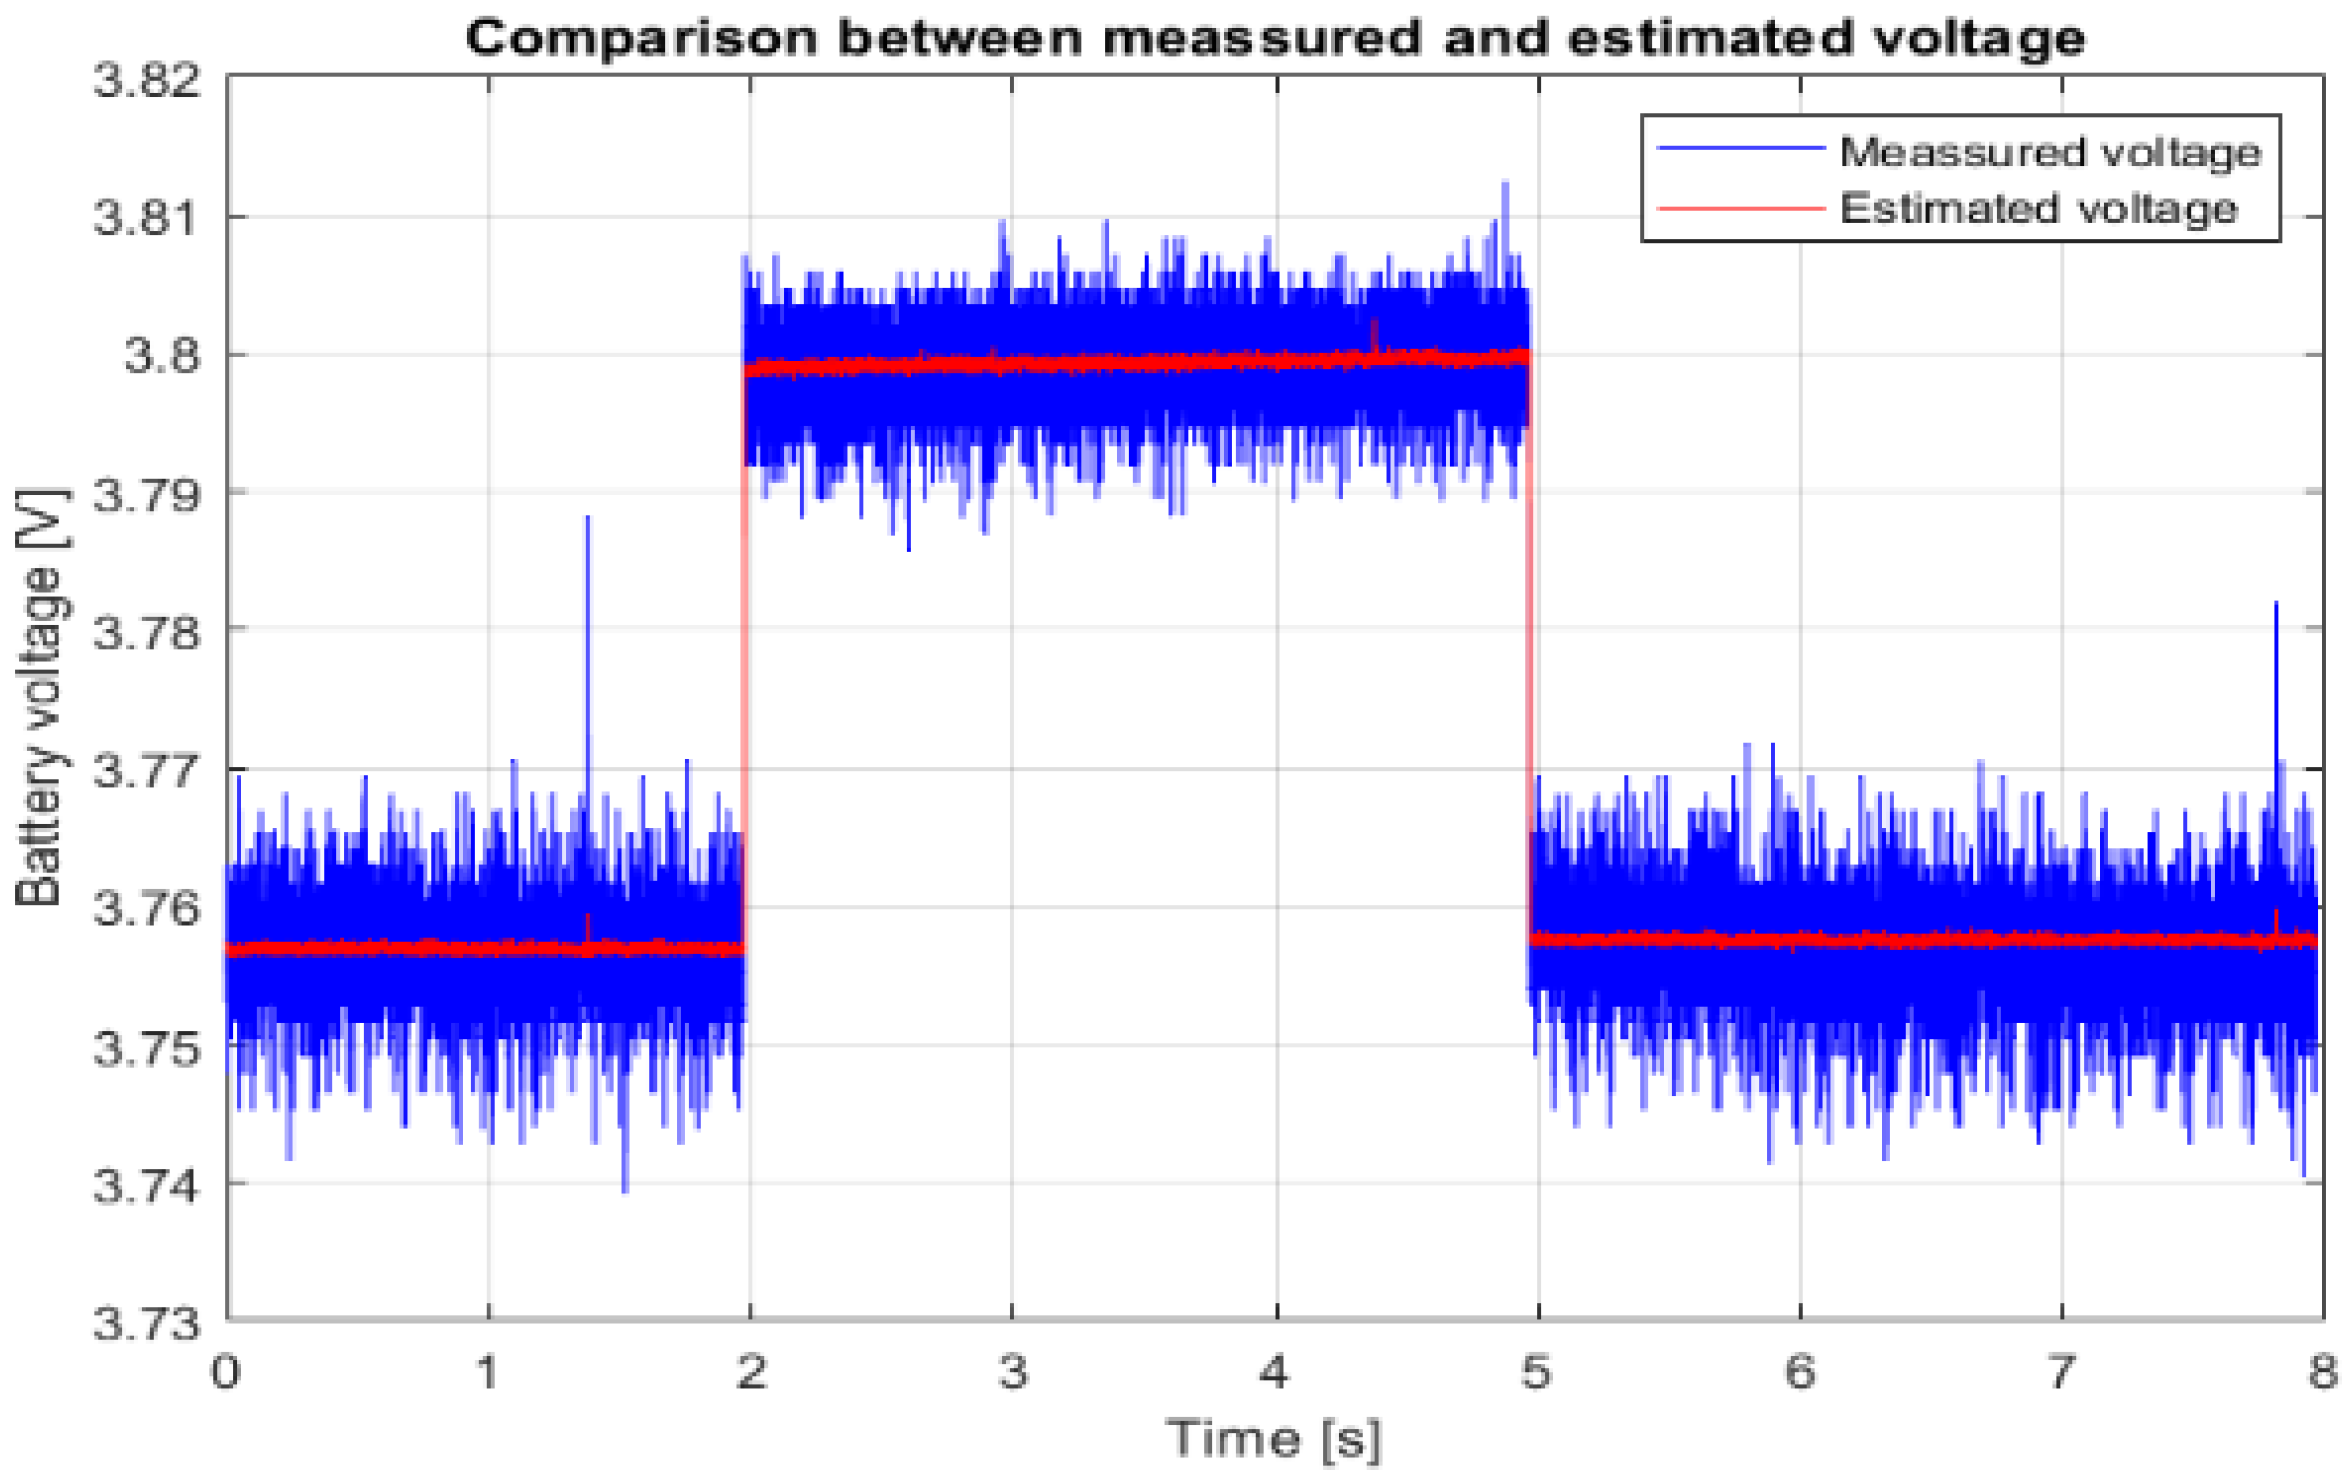
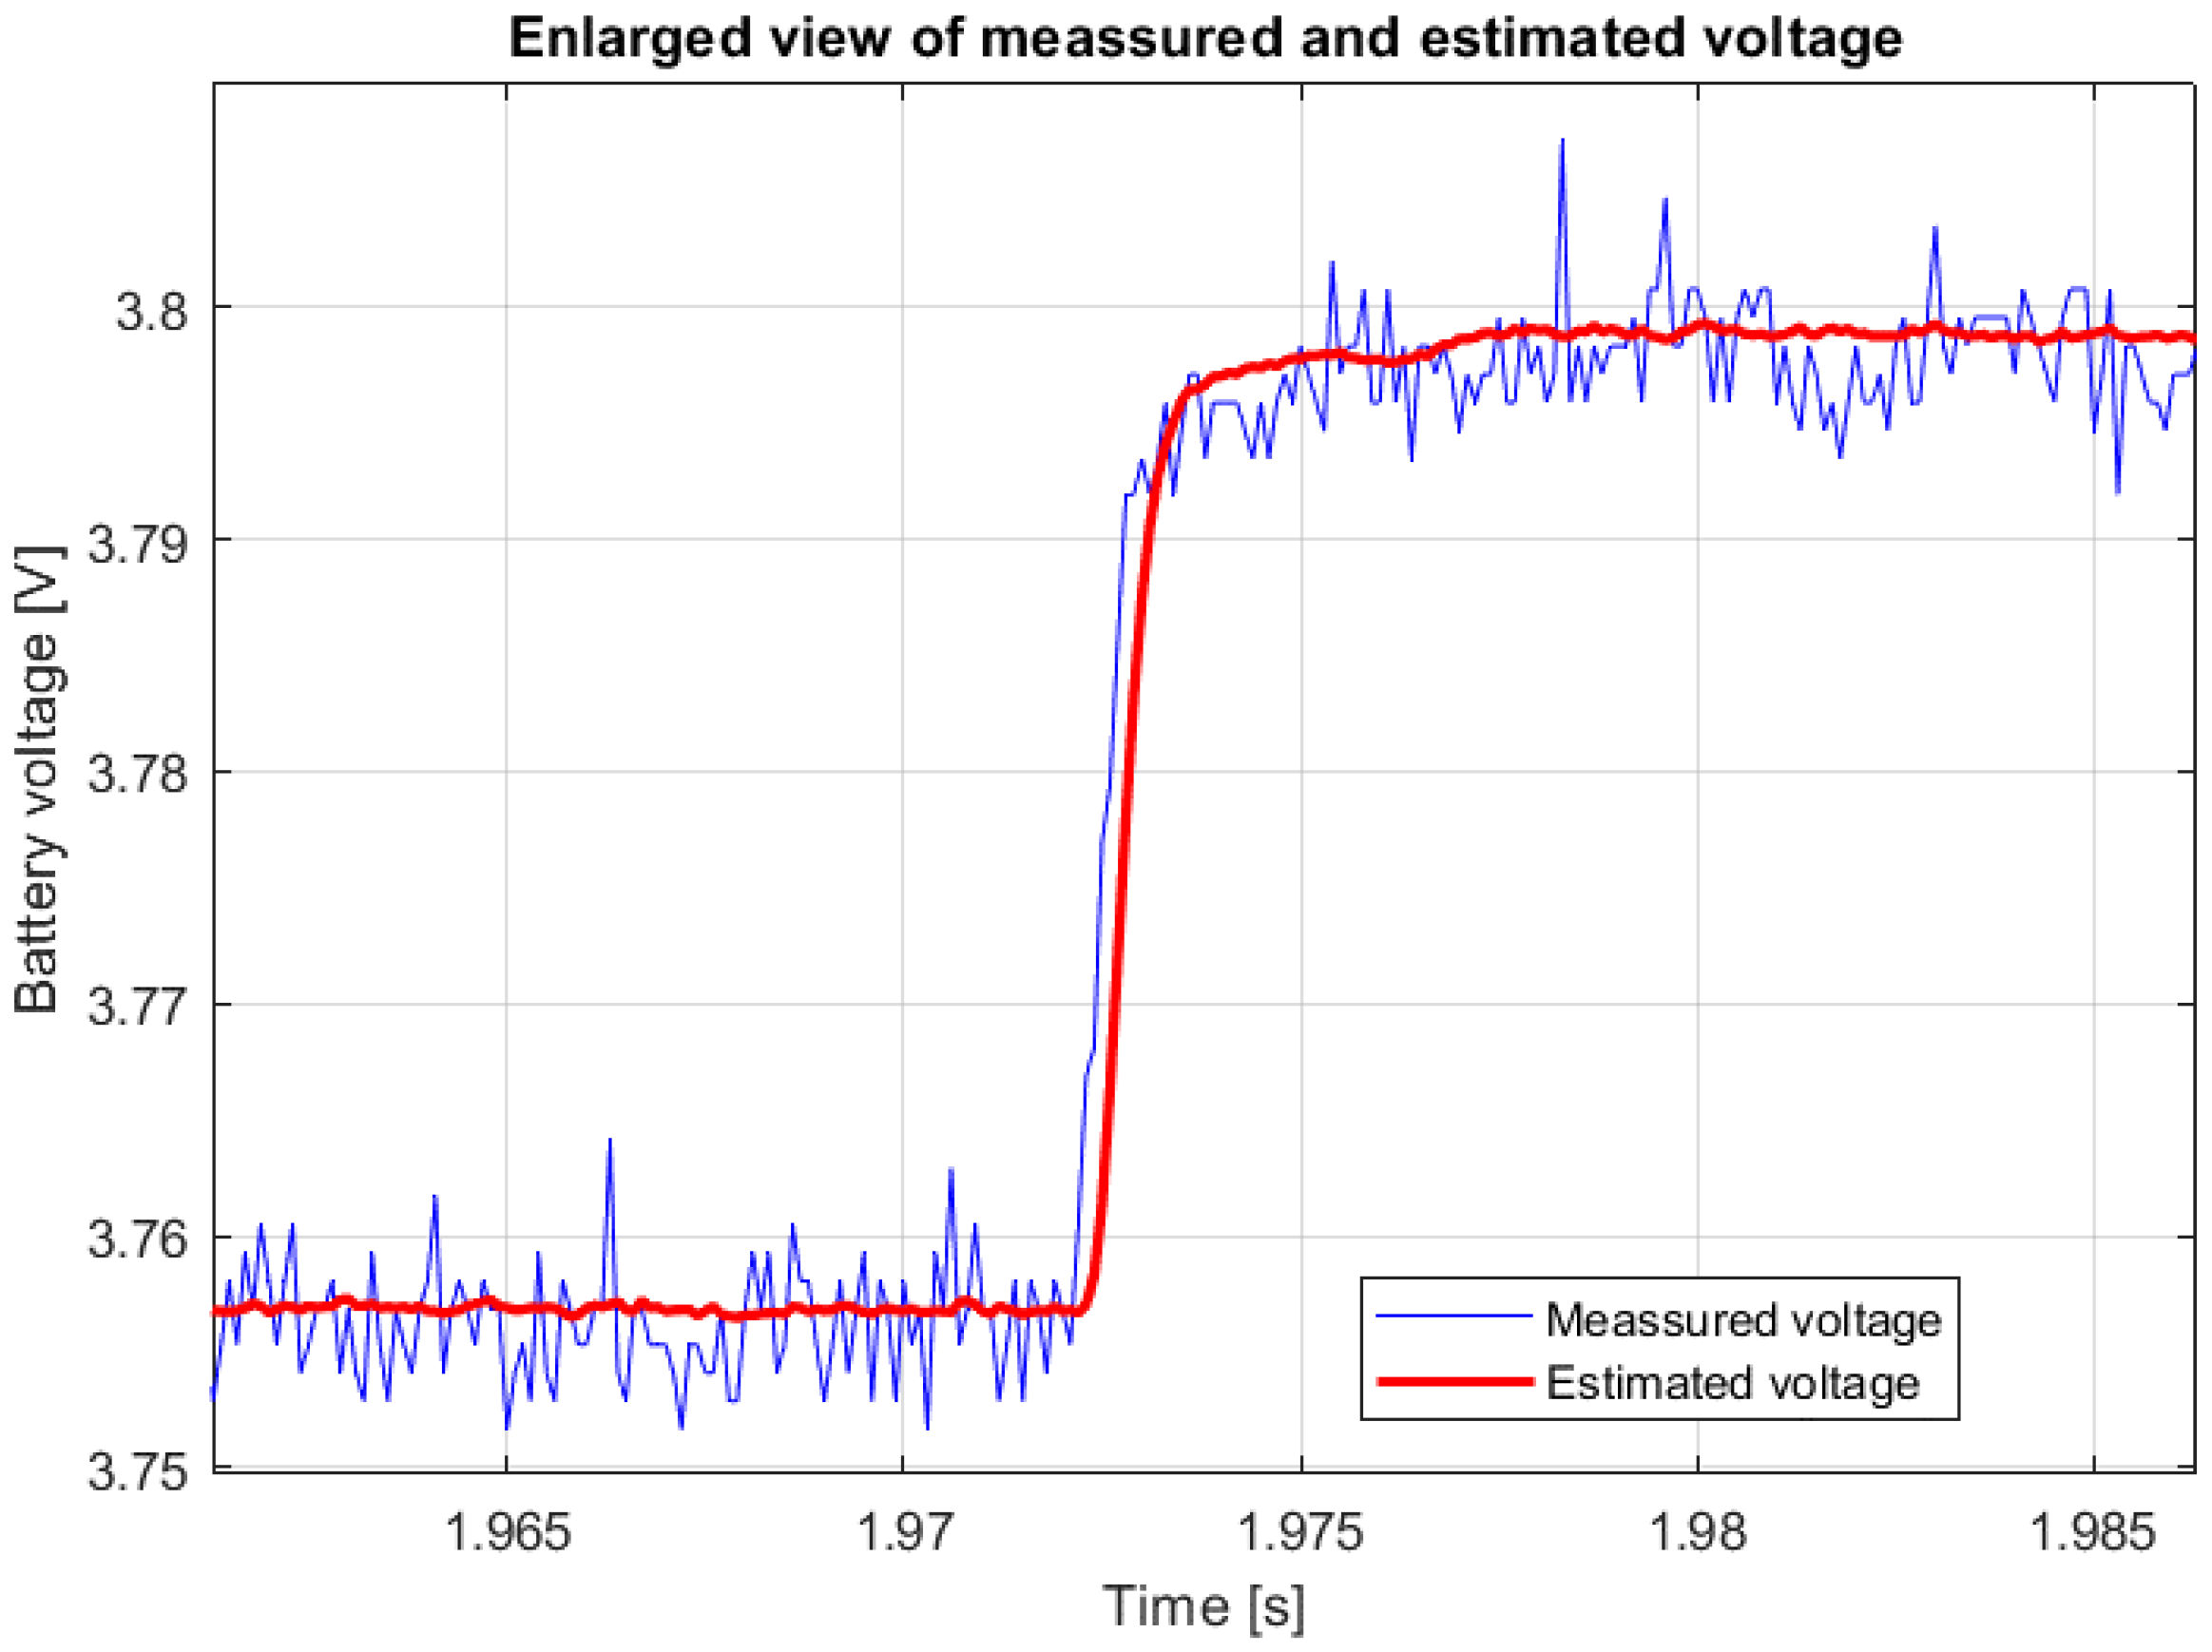
Figure 5 shows the recorded voltage response to the current pulse from
Figure 4. The same figure shows a comparison of the estimated and measured battery voltage response for the cell type SAMSUNG ICR 18650-26J M and an SoC of 50%, and
Figure 6 shows a magnified section of the transient event at the beginning of the current pulse.
After the recorded data are collected, the data are processed offline using the optimization toolbox within the MATLAB/Simulink software package (version 8.5).
Table 1 shows the values of the transfer function coefficients calculated in this way as an example.
2.3. The Database of Reference Points
The coefficients of the transfer functions for the known states of charge of the cells are obtained using the optimization process and stored together with the open circuit voltage UOC in the so-called database of reference points (Ref_ SoC). The procedure for estimating the unknown SoC is based on the comparison of the transfer function of the unknown SoC with the transfer functions from the database of the reference points and the SoC is determined according to the smallest deviation from the reference points.
The reference points from the Ref_ SoC set are determined for nine uniformly distributed cell charge states from 0 to 100% (0, 12.5, 25.0, 37.5, 50.0, 62.5, 75.0, 87.5, 100). The reference points are determined for a total of four types of lithium-ion cells. Thus, a total of 36 transfer functions were determined, which were finally stored in the database of reference points. Each reference point contains five coefficients: UOC, b1, b0, a2, and a1. From all reference points of a given cell type, the UOC coefficients are stored in the vector Vnul of dimension 1 × 9, the coefficients b1 and b0 are stored in the matrix Num of dimension 2 × 9, and the coefficients a2 and a1 are stored in the matrix Den of dimension 2 × 9. Equations (3) and (4) can be used to simulate the response for each reference point. To select a specific reference point of a cell type, data must be read from column k of Ref_ SoC, Vnul, Num, and Den for that cell type, where 1 ≤ k ≤ 9. In this work, the reference points are determined for the following types of battery cells:
Battery 1—SAMSUNG ICR 18650-26J M
Battery 2—LG INR18650-MJ1
Battery 3—PANASONIC NCR18650
Battery 4—SONY/MURATA US18650VT
Data on the types of battery articles used in the experiment are given in
Table 2.
3. SoC and Cell Type Estimation Algorithms
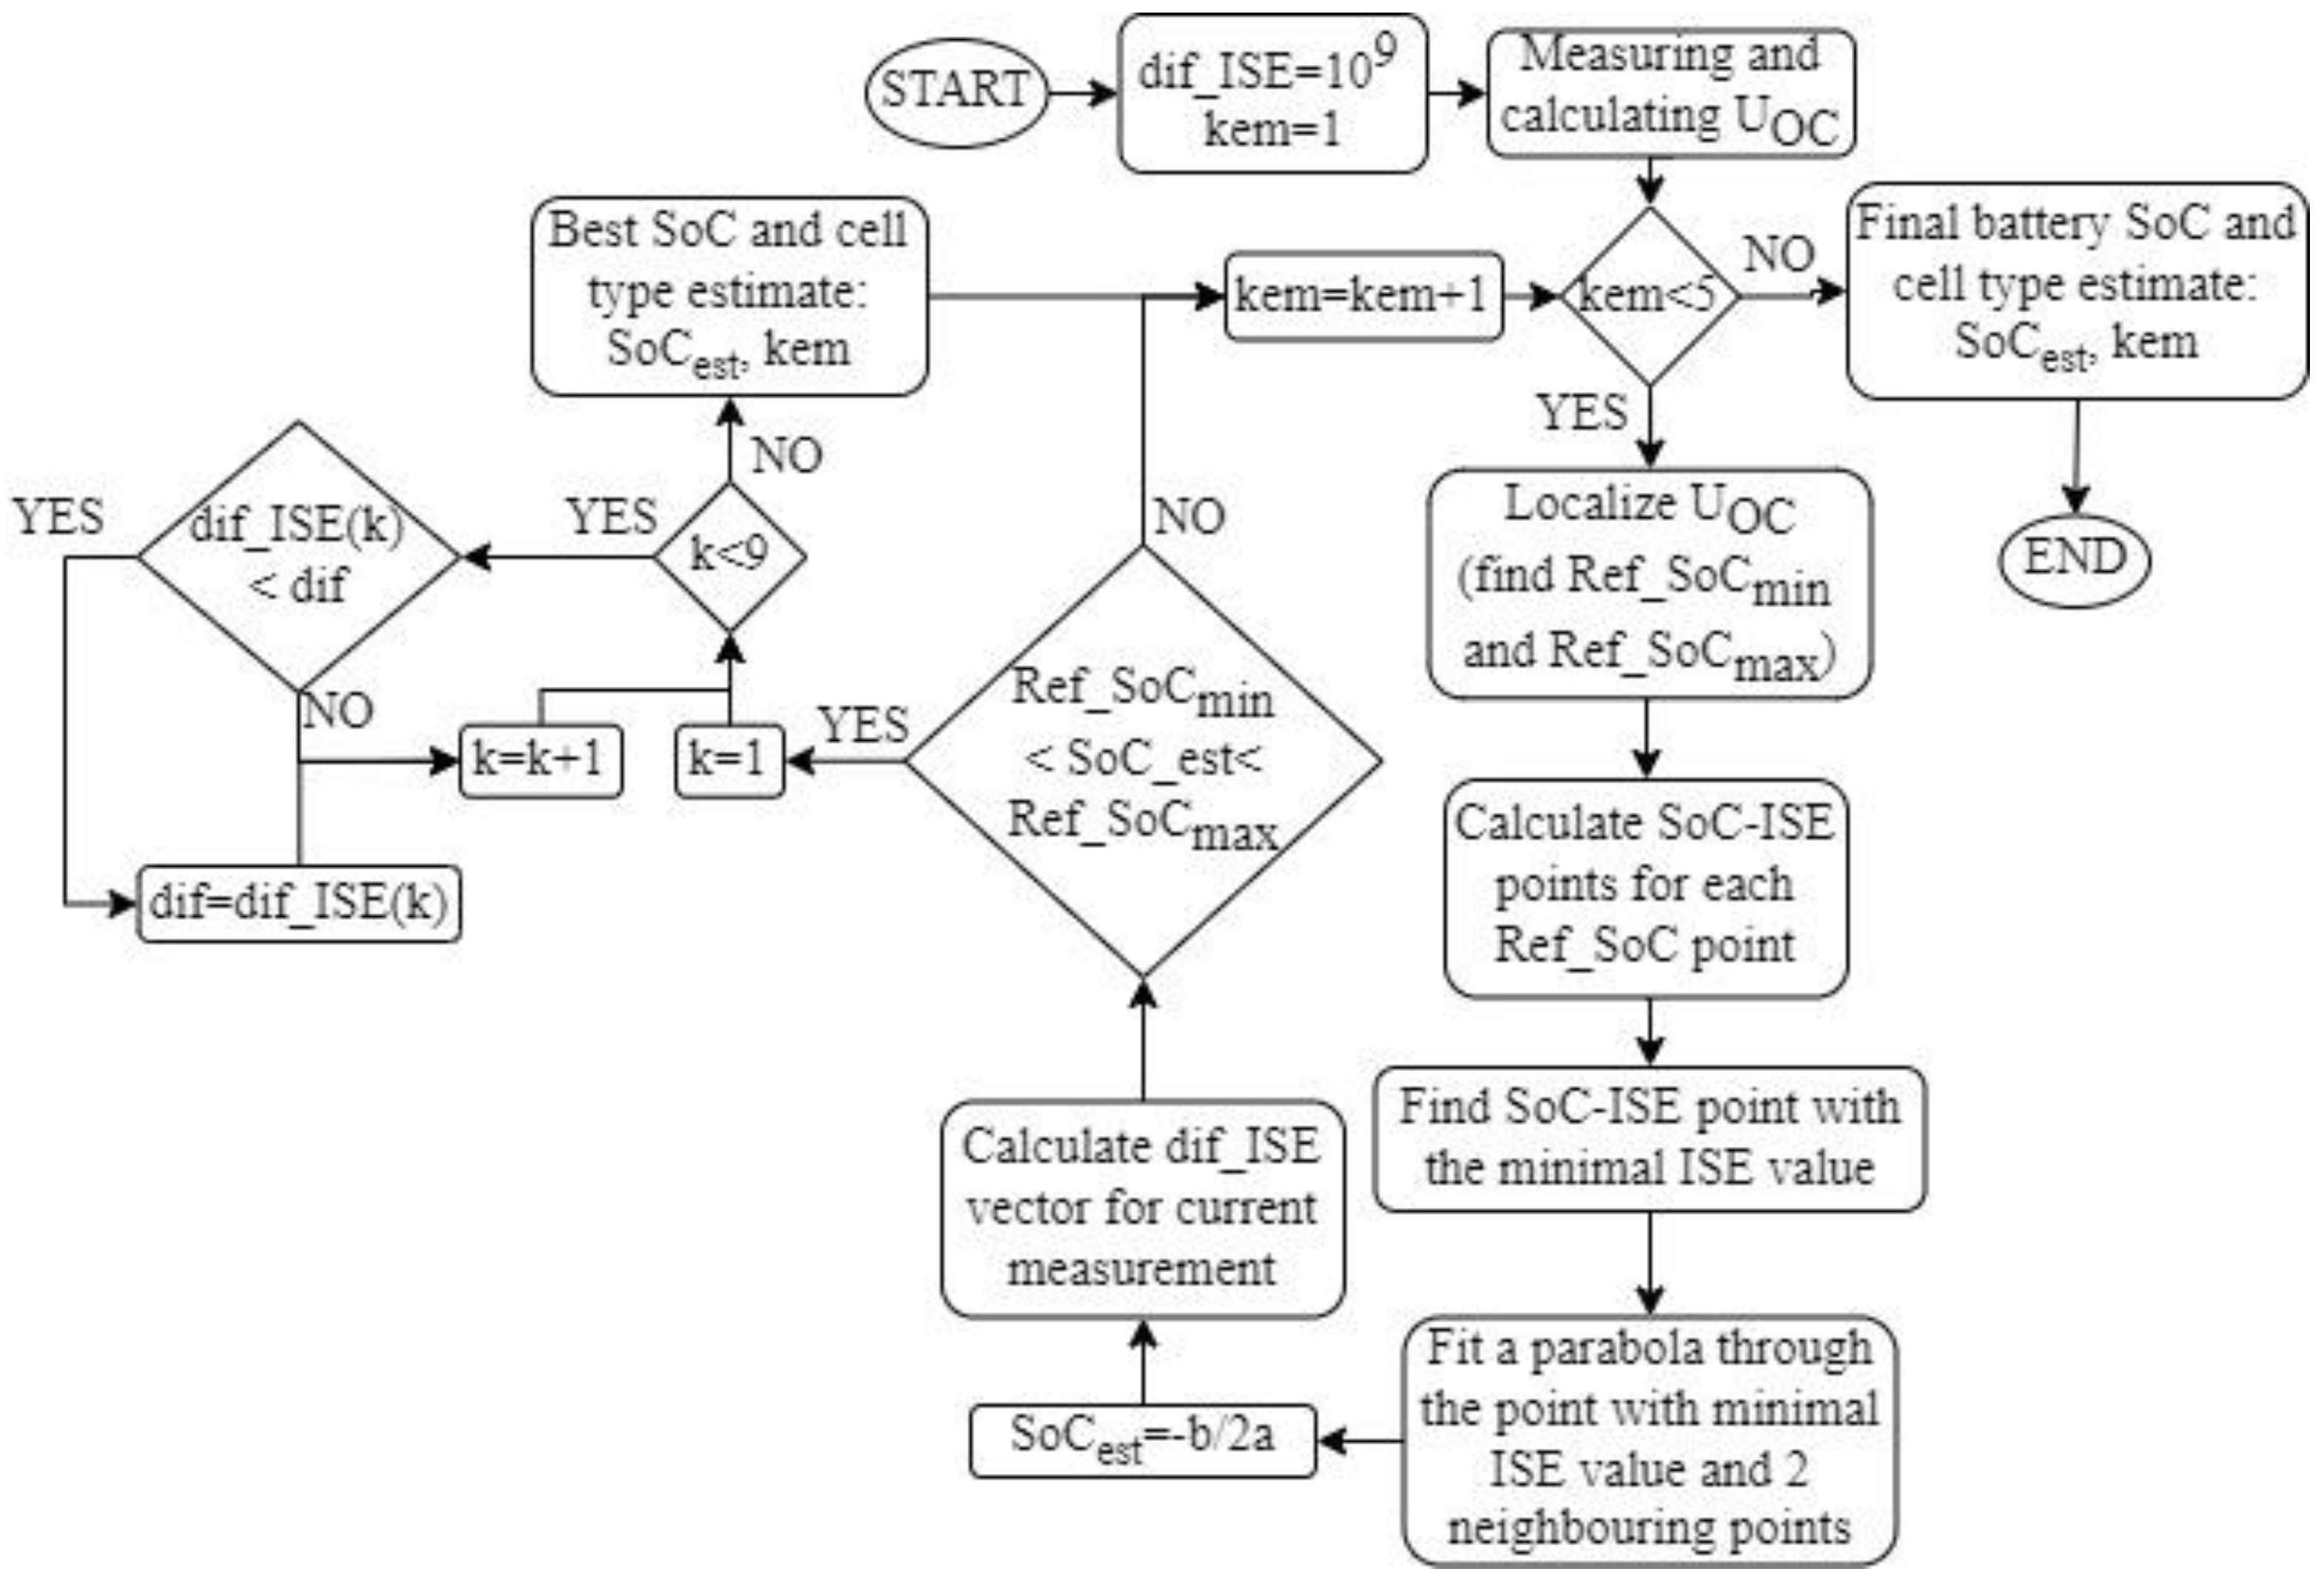
The characteristics of the different battery types are different, so it is important to determine the battery’s chemical type and state of charge. To accomplish this task, the algorithm compares the measured voltage response of an unknown cell with an unknown SoC with the responses of all reference models and finds the best match. Furthermore, fine-tuning of the estimated results is performed by interpolating between the best matches.
3.1. State of Charge EstimationAlgorithm
The algorithm for estimating the state of charge of the battery cell is based on the comparison of the measured voltage response of the battery cell of an unknown SoC with the voltage responses of reference transfer functions for known SoCs from a database to the same current pulse. The comparison is based on the integral of the squared difference between the responses.
The algorithm begins by searching for the two reference points within the Vnul vector between which the UOC of the battery lies at an unknown state of charge. The UOC is calculated as the average of 100 measured voltage values immediately before the start of the current pulse. Since each value in the Vnul vector has its corresponding SoC from the Ref_SoC vector, the lower (Ref_SoCmin) and upper (Ref_SoCmax) limits can be found between which the SoC of the cell under test should lie.
The next step is to calculate the ISE criterion of the measured voltage response and the response of the transfer function defined by each of the reference points to the input signal. The SoC from the reference table that is closest to the SoC of the measured cell corresponds to the reference transfer function whose response is closest to the measured signal. The signal similarity evaluation was performed based on the magnitude of the ISE criterion so that the smallest magnitude of the ISE criterion determines the correct transfer function. This means that the estimated SoC must be close to this reference point.
Since the SoC and the magnitude of the ISE criterion are known for each of the reference points, the points can be visualized in a two-dimensional space with the SoC on the
x-axis and the magnitude of the ISE criterion on the
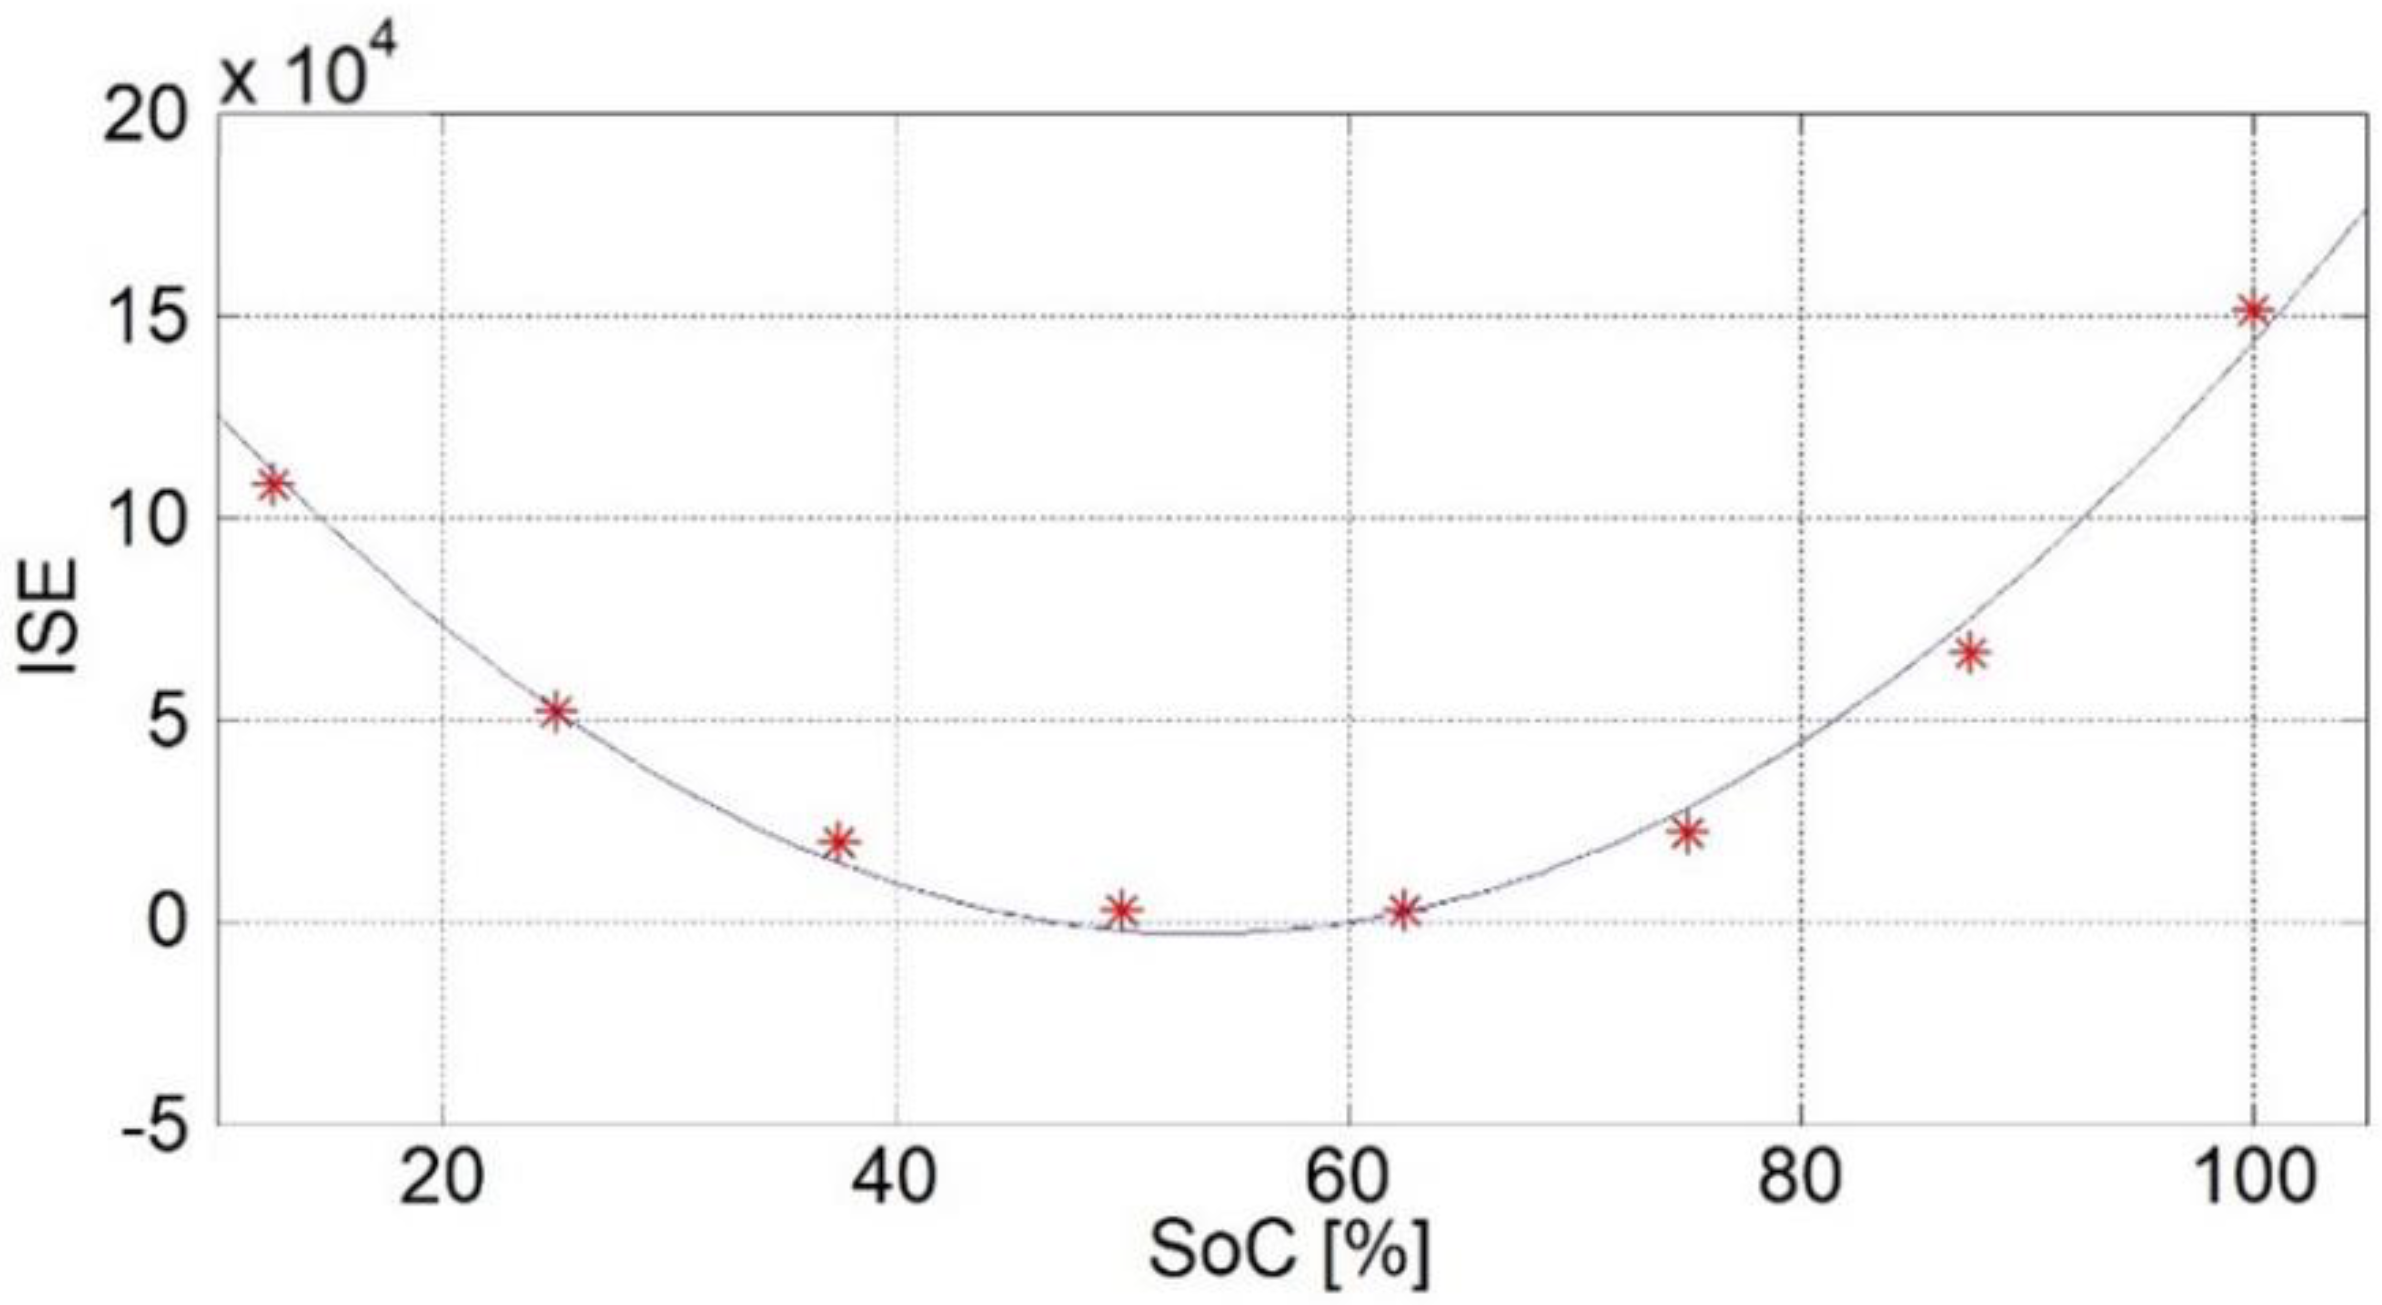
y-axis. As an example,
Figure 7 shows the relationship between the ISE criteria and SoCs for the case of an estimated SoC = 56.25%. Each point (asterisk) on the graph represents one reference point.
The ISE criterion for the first reference point differs considerably from the others. This fact was repeated for the other cases of estimated SoCs during the test and for the other SoC quantities tested. The reason for this is the pronounced nonlinearity of the cell when it is empty. Therefore, the first point is not used for the estimation (unless the amount of the ISE criterion is lowest at that point).
Figure 8 shows the amounts of the ISE criteria for all reference points except the first one. Each point (asterisk) on the graph represents one reference point. These amounts can be approximated using a quadratic parabola described by the expression:
where
a,
b, and
c are the coefficients of the parabola. It can be concluded that the equation of the parabola can be used when estimating the SoC.
Since the amount of the ISE criterion is smallest when the estimated SoC is equal to one of the reference points, it follows that the minimum point of the parabola as a function between the ISE criterion and the SoC represents the estimated SoC. In this algorithm, in addition to the minimum point with the smallest value of the ISE criterion (not necessarily the minimum of the parabola), two neighboring points, one on the left and one on the right side, are also used, based on which the coefficients of the parabola
a,
b, and
c are calculated. These three points were chosen because points close to the minimum cause smaller estimation errors than points farther from the minimum. Since we take three points to find the coefficients of the parabola, the solution will always be unique, with a small number of computational operations. Once the coefficients of the parabola are found, the value of the estimated SoC is determined as the x-coordinate of the vertex of the parabola:
3.2. Cell Type Recognition Algorithm
When the SoCest is estimated by comparing the measured signal of one cell type with the response of the reference transfer function of another cell type, the SoCest of an unknown cell may be estimated with an incorrect estimate of the battery cell type. In this case, experiments have shown that the amount of the estimated SoCest can differ significantly (±10%) from the actual value. One of the reasons for this is that different types of lithium-ion cells have a different minimum allowable voltage below which discharge is not recommended, even though they have the same nominal voltage. The battery cells may have a different operating range of voltage. Therefore, it is necessary to determine which type of lithium-ion cell it is.
When the measured signal of one type of battery cell is compared with the reference transfer function response of this cell, it is shown experimentally that the ISE criterion in the vicinity of the real SoC changes less than an ISE criterion of another battery cell type. The rate of change of the ISE criterion can be expressed as a gradient of the SoC-ISE function, which in this case is represented by a parabola. Each gradient value corresponds to a rate of change between two neighboring SoC points. The minimum value of the gradient should indicate the interval in which the true SoC is located. Since all SoC points are equidistant, the gradient is represented by the difference between the ISE values of two neighboring points. Therefore, it is necessary to calculate the absolute difference of the ISE criteria between neighboring SoC points, i.e., the difference for all battery reference points to which we are currently comparing the measured signal of an unknown SoC and an unknown battery cell type. For the nine selected reference points, we need to calculate eight differences (stored in a 1
× 8
dif_ISE vector). The first difference is the difference of the ISE criteria of the first two points of
Ref_SoC, the second is that of the second two points, etc. The minimum absolute difference value indicates the interval in which the actual SoC of the tested cell should lie for the cell type to which it is being compared. Finally, if the minimum absolute difference for the cell type to which the measured transfer function is compared is less than the minimum absolute difference for the previous cell type, the SoC
est for the current cell type is taken as the best estimate of the SoC and the cell type is recognized at the same time.
Figure 9 shows the absolute differences calculated for four different types of battery cells. For battery number 1 (blue), the minimum absolute difference is the smallest and the estimated SoC is between the reference points SoC = 50% and SoC = 62.5%. In other words, the algorithm recognizes that the voltage outputs of the transfer functions for 50 and 62.5% of battery number 1 deviate the least compared to all other battery types or SoCs.
Figure 10 shows the pseudocode of the cell type detection algorithm.
The same current pulse (0.45 A, 3 s) was used in the experiments to determine the voltage response for optimizing the parameters in the learning phase and the experiment for the evaluation of the unknown SoC of the battery. However, the current pulse does not have to be identical in these two phases of the algorithm implementation; SoC estimation can also be performed with higher current values. The method described in this article is primarily intended for estimating the SoC of a bicycle battery connected to a charging station just before charging begins when the charging current is 0.
4. Estimated Results
The estimation of the unknown SoC is performed for eight states of charge (
Test_SoC (%) = [6.25, 18.75, 31.25, 43.75, 56.25, 68.75, 81.25, 93.75]) for four different battery cells from
Table 2. The same current pulse (0.45 A, 3 s) is used in SoC estimation, like in the parameter optimization procedure. The true SoC for a battery was determined using the Coulomb counting method. The estimated results are shown in
Table 3,
Table 4,
Table 5 and
Table 6. The algorithm’s accuracy was measured using the relative error, which compares the estimated SoC with the actual SoC. The relative error is calculated as the ratio of the absolute difference between the actual SoC and the estimated SoC value relative to the actual SoC value:
where:
ERR—relative error expressed as a percentage,
SoCactual—actual SoC value determined using Coulomb counting method,
SoCest—estimated SoC value.
Table 3.
Experimental results for battery type 1.
Table 3.
Experimental results for battery type 1.
True
SoC [%] | Estimated
SoC [%] | Relative Error
[%] | Estimated
Battery Type | True
Battery Type |
|---|
| 6.2524 | - | - | - | 1 |
| 18.7653 | 18.7135 | 0.2765 | 1 | 1 |
| 31.2549 | 31.2304 | 0.0784 | 1 | 1 |
| 43.7827 | 43.0593 | 1.6522 | 1 | 1 |
| 56.2718 | 56.0986 | 0.3078 | 1 | 1 |
| 68.7492 | 68.3063 | 0.6443 | 1 | 1 |
| 81.2955 | 81.7131 | 0.5136 | 1 | 1 |
| 93.7527 | 94.9304 | 1.2562 | 2 * | 1 |
Table 4.
Experimental results for battery type 2.
Table 4.
Experimental results for battery type 2.
True
SoC [%] | Estimated
SoC [%] | Relative Error
[%] | Estimated
Battery Type | True
Battery Type |
|---|
| 6.2556 | - | - | - | 2 |
| 18.8657 | 18.9857 | 0.6363 | 2 | 2 |
| 31.2331 | 31.1815 | 0.1651 | 2 | 2 |
| 43.7237 | 42.6527 | 2.4495 | 2 | 2 |
| 56.2193 | 55.9225 | 0.5279 | 2 | 2 |
| 68.7249 | 67.1331 | 2.2162 | 2 | 2 |
| 81.8785 | 85.6184 | 4.5677 | 1 * | 2 |
| 93.7156 | 94.8828 | 1.2455 | 2 | 2 |
Table 5.
Experimental results for battery type 3.
Table 5.
Experimental results for battery type 3.
True
SoC [%] | Estimated
SoC [%] | Relative Error
[%] | Estimated
Battery Type | True
Battery Type |
|---|
| 6.2945 | - | - | - | 3 |
| 18.7551 | 20.7964 | 10.8835 | 3 | 3 |
| 31.3064 | 31.3296 | 0.0742 | 3 | 3 |
| 43.7736 | 42.3868 | 3.1682 | 3 | 3 |
| 56.2833 | 55.4569 | 1.4683 | 3 | 3 |
| 68.7586 | 68.3087 | 0.6543 | 3 | 3 |
| 81.4259 | 81.2867 | 0.1710 | 3 | 3 |
| 93.7611 | 92.7874 | 1.0385 | 2 * | 3 |
Table 6.
Experimental results for battery type 4.
Table 6.
Experimental results for battery type 4.
True
SoC [%] | Estimated
SoC [%] | Relative Error
[%] | Estimated
Battery Type | True
Battery Type |
|---|
| 6.25 | - | - | - | 4 |
| 18.7504 | 18.7466 | 0.0205 | 3* | 4 |
| 34.8310 | 31.1705 | 10.5094 | 2 | 4 |
| 43.7555 | 43.4049 | 0.8011 | 4 | 4 |
| 56.4093 | 55.5412 | 1.5389 | 4 | 4 |
| 68.7946 | 67.7699 | 1.4896 | 4 | 4 |
| 81.2546 | 79.4447 | 2.2275 | 4 | 4 |
| 93.7443 | 92.4554 | 1.3748 | 4 | 4 |
Results in
Table 3,
Table 4,
Table 5 and
Table 6 show that the SoC estimation algorithm estimates the state of charge well and recognizes the battery cell type (deviations are marked with an asterisk in the tables).
The results of the SoC estimate are worse at lower states of charge. At states of charge below 10%, the nonlinearity of the voltage response is much more pronounced, which leads to a higher error in the estimation.
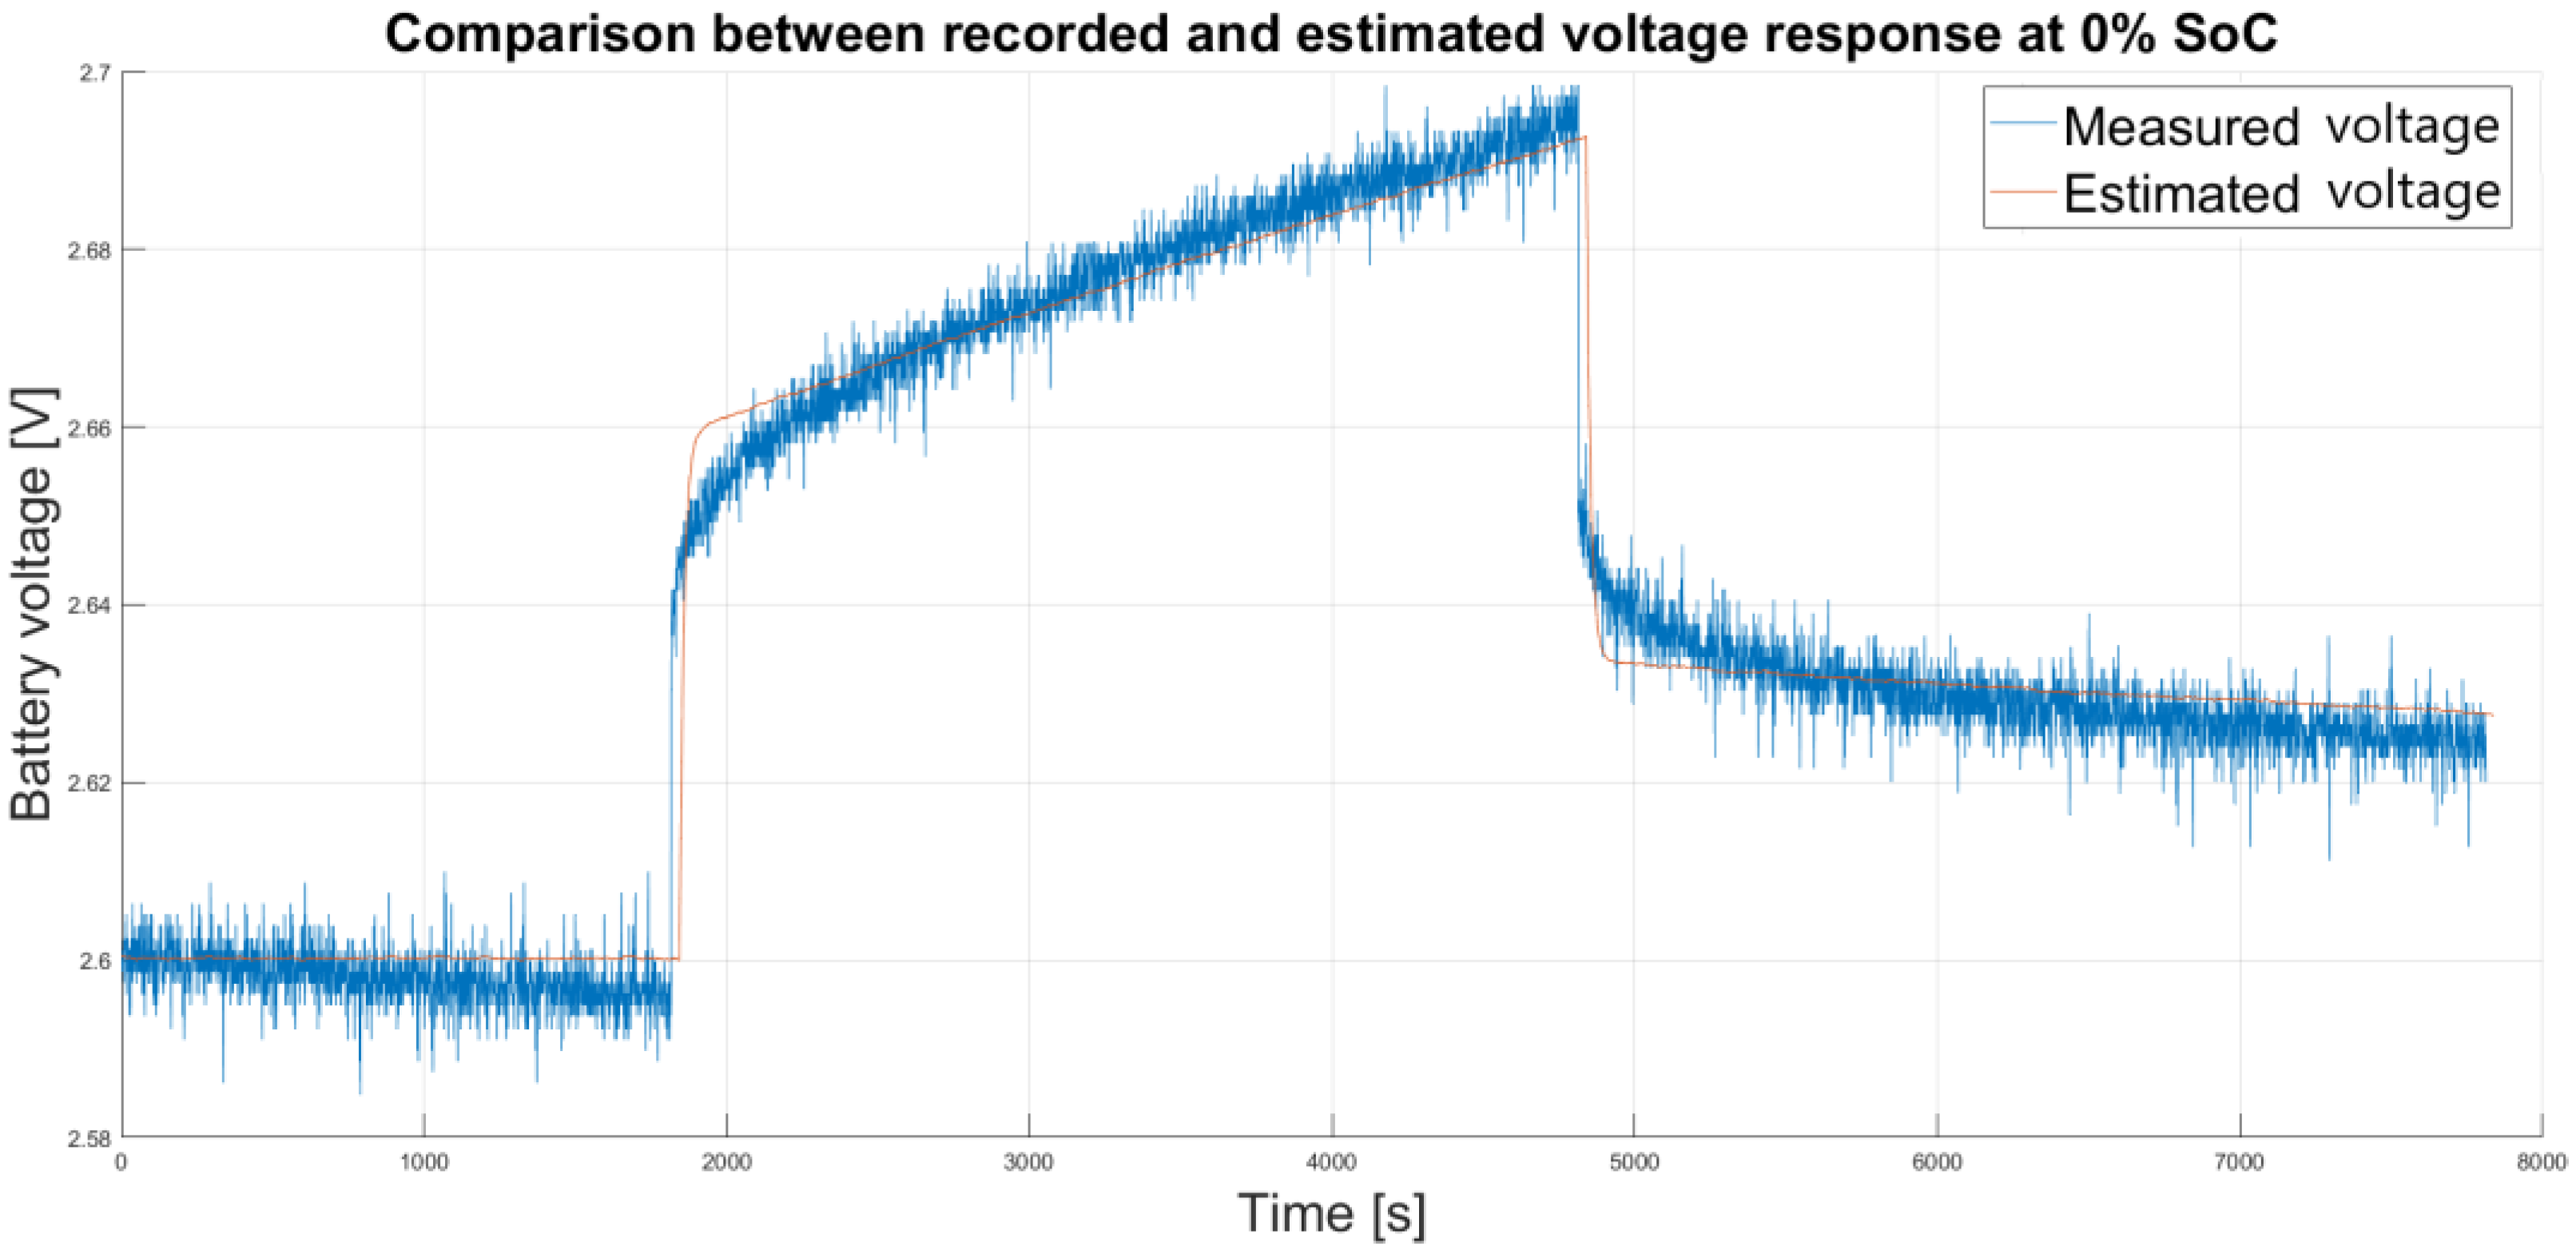
Figure 11 illustrates a comparison between the estimated and recorded voltage response at 0% SoC.
Reference points at 0% charge deviate much more from the actual response than any other reference points. At these states of charge, small changes in voltage have a significant effect on the result of the estimation. As shown in
Figure 7 in
Section 3.1, the value of the ISE criterion for an empty cell differs significantly from the ISE criterion values for other states of charge. As a result, the x-coordinate of the vertex of the parabola (SoC
est) in Equation (7) shifts towards higher SoC values. In this case, SoC
est is located outside the lower limit (
Ref_SoCmin) and the upper limit (
Ref_SoCmax), making precise SoC estimation in this range impossible. However, this is not a practical problem as the battery management system (BMS) prevents the battery cells from discharging to the minimum voltage specified in the data sheet. Discharging the battery below 2.8 V, the available capacity will only increase slightly, and long-term discharge below 2.8 V will lead to significant deterioration of the battery. The voltage at which the discharge of the battery is stopped is typically between 2.8 and 3 V per cell, i.e., at the boundary between the non-linear and linear range.
For the other states of charge, it can be seen from the fourth column that the relative error (8) of the SoC estimate is less than 5%. In some cases (marked with an asterisk in the tables), the estimated SoC value is very close to the actual value, but the battery cell type is incorrectly estimated. This is the case when two different cell types have similar characteristics (and parameters) for the same SoC value. Although the cell type is incorrectly estimated in these cases, the fact is that these cells have very similar characteristics and, more importantly, they have approximately the same SoC value, which is accurately estimated. Accurate SoC estimation ensures safe handling of the cells during charging and discharging, despite incorrect identification. In this case, the influence of the noise on the minimum absolute difference outweighs the influence of the battery cell type in the estimation.
5. The Influence of Temperature on SoC Estimation
During the charging process, the temperature of the cell changes and with it the values of the cell model parameters. It has been shown that the internal resistance of the cell, R
i, has a much stronger dependence on the temperature compared to the RC pairs shown in
Figure 1 [
25,
26]. According to Faraday’s first law of electrolysis, the amount of substance produced at an electrode is proportional to the amount of charge that has passed through the electrode. Heating accelerates the chemical processes within the cell and in this case enables higher electron flow. The dependence of the speed of the chemical reaction on the temperature can be described by the Arrhenius equation:
where:
k—the rate constant of the chemical reaction [s−1]
A—Arrhenius coefficient [s−1]
Ea—activation energy [Jmol−1]
R—universal gas constant [Jmol−1K−1]
T—absolute temperature [K]
According to Equation (9), an increase in temperature
T leads to an increase in the rate constant
k. The consequence of the acceleration of the chemical processes is a reduction in the internal resistance of the cell. To determine the impact of temperature on the accuracy of SoC estimation, tests were performed at different temperatures. The tests were carried out at 20, 30, 40, 50, and 60 °C on a LiNi1/3Co1/3Mn1/3O2 cell (battery 1).
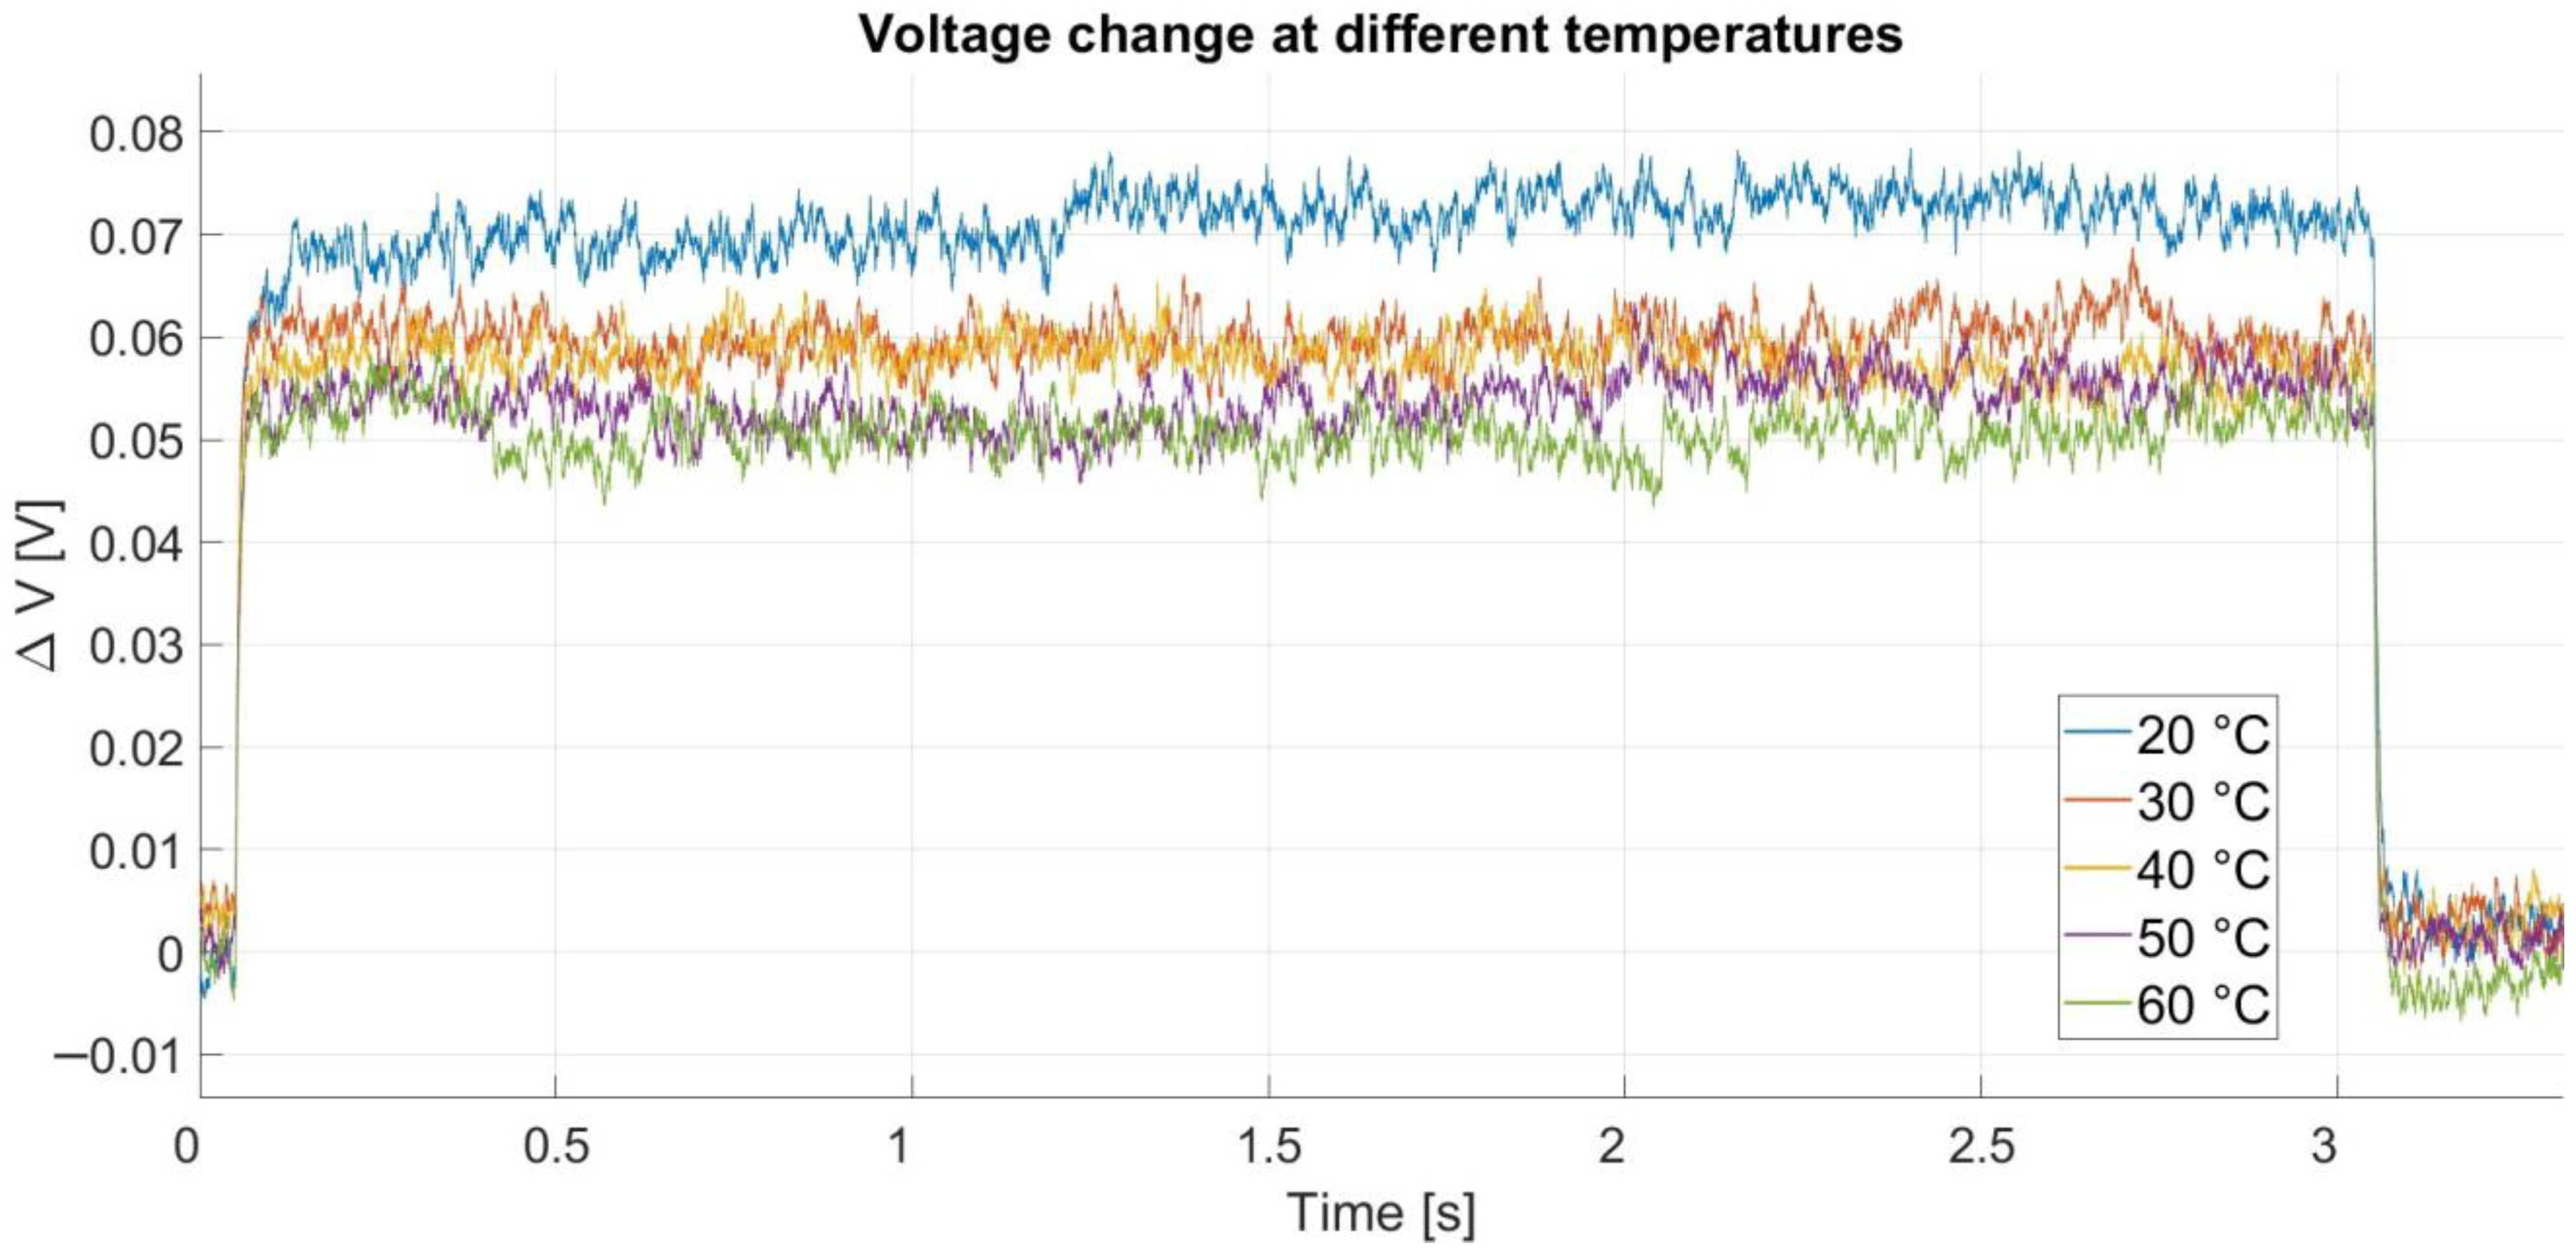
Figure 12 shows a comparison of the cell voltage response to a current pulse from
Figure 4 at these temperatures. The voltage response at each temperature was adjusted by subtracting the open circuit voltage to display only the voltage change during the current pulse. The tests were performed for a single SoC value. It was shown in [
27] that the dependence of internal resistance on the SoC value is much lower (more pronounced at low states of charge) than its dependence on current, especially with respect to its dependence on cell temperature.
Figure 12 shows that the change in voltage decreases with increasing temperature, which is expected considering the reduction in internal resistance. A more detailed comparison of the transfer function coefficients could allow for an analysis of the changes in coefficients
b1, b0, a2, and
a1. However, this is not of great interest in the context of this scientific work. To verify the performance of the algorithm at different temperatures, an SoC estimation was performed for each voltage response. The reference SoC used for comparing the SoC estimation results at other temperatures is at 20 °C. The results of the estimation are shown in
Table 7.
Table 7 shows that the relative error of the estimation compared to the estimation at 20 °C is less than 0.5%. This implies that within the temperature range of 40 °C, the estimated value of the SoC remains practically unchanged, while the type of battery cell is correctly estimated for each temperature. In [
28], the temperature-induced voltage difference is largest at a low SoC. As the SoC increases, the voltage difference between different temperatures decreases. If the relative error at a low SoC of 18.6% is less than 0.5% during the test, it can be expected that the algorithm will have the same or lower relative error at a higher SoC due to the smaller voltage deviation. Formula (9) from
Section 5 shows that the rate of change of a chemical reaction is dominantly influenced by the activation energy and temperature. The batteries on which the test was carried out have cathodes with a similar chemical composition, which means that the difference in activation energies at the same temperature will be relatively small. The change in temperature has a much greater effect on the rate constant of the chemical reaction, so it is expected that the estimation error will be similar for other battery types used for testing. This demonstrates the robustness of the algorithm in response to changes in the operating temperature of the cell.
6. Conclusions
This paper proposes a method for estimating the state of charge and recognizing the type of Li-ion battery cells without the need to know the initial value of the state of charge. The method is based on the idea that the transfer function of a cell, i.e., the voltage response to a current pulse, depends on the state of charge and the cell type. The method necessarily requires a learning phase in which a database of reference points is established, i.e., a set of transfer functions measured for a sufficient number of different states of charge for each type of lithium-ion cell.
The algorithm for estimating the state of charge is performed by comparing the measured voltage signal of the cell of unknown type and unknown state of charge with the response of the transfer functions from the database of the reference points to the same input signal. The integral of square error (ISE) is used as a comparison criterion. It was shown that the magnitude of the ISE criterion changes as a function of the state of charge of the cell corresponding to the parabola in the coordinate system (SoC and ISE) and that the estimated SoC can be determined as the vertex of the parabola. The measurements were performed on four different types of lithium-ion cells commonly used in batteries for electric bicycles. The experimental results show that the algorithm estimates the majority (27 test SoCs), with a relative error of less than 5%. A larger error occurs at lower states of charge, as, in this range, small voltage changes cause large deviations in the state of charge. The problem of inaccurate estimation at low states of charge is not a practical concern because the algorithm is primarily intended for use inside an electric vehicle charging stations, where the lowest states of charge occur at the beginning of the charging process and the batteries are also not normally discharged to such low levels. This is because most batteries have a BMS that prevents discharge below a certain level, which extends the life of the batteries.
The cell type detection algorithm is based on the fact that the ISE criterion in the vicinity of the real SoC for the same battery type changes less than the ISE criterion of any other battery cell type with the same SoC. For this reason, the absolute differences in the amount of ISE criteria for neighboring SoCs around the real SoC are calculated from the reference points for all cells, and the cell under test belongs to the cell type with the smallest difference. The accuracy of the battery cell type estimation is more than 80%. The errors that occur are due to the similarity of the coefficients of the transfer functions of the different cell types for certain states of charge. In the context of computing power and complexity, an algorithm consists of relatively simple mathematical expressions. Arithmetic operations are used to determine the mean value and numerical integration, find the minimum of a vector, calculate a parabola through three points (system of linear equations), and for differential calculation. With noisy measurements of the voltage response to the battery current pulse, good results were obtained in SoC estimation (97–99% in a wide range of SoCs) and in the detection of battery types between batteries with very similar chemical composition, indicating satisfactory robustness of the method. We have also shown that the influence of temperature does not cause a large error at a relatively low state of charge and that by increasing the state of charge, the voltage deviation because of temperature becomes smaller at the same state of charge. Given that not all types of battery cells are covered in the article, research will continue by expanding the database and applying the algorithm to other types of lithium-ion cells. The main focus will be on LFP cells, which exhibit a relatively flat voltage curve over a wide range of state-of-charge conditions.
In real applications, the energy sources consist of stacks with several cells of the same type connected in series and parallel. For this reason, this research will also continue by applying the described algorithms to different types of lithium-ion battery stacks and refining the algorithm to determine the internal structure of the batteries, i.e., the number of cells connected in series and parallel. An accurate estimation of the number of cells connected in series and parallel will help to determine the actual capacity and condition of the battery as well as the maximum voltage to prevent the batteries from being charged beyond the permitted voltage. In the subsequent phases of the research, the dependence of the model parameters, i.e., the effectiveness of the proposed method, will be analyzed in relation to different battery operating modes, current and battery state of health (SoH).


