Abstract
Tight sandstone oil reservoirs in the Upper Triassic Yanchang Formation of the Ordos Basin are the most promising exploration and development fields owing to their huge production potential. Even though they have received considerable attention in recent years, common productivity prediction methods were not well applied during pre-development owing to their strong internal heterogeneity. In this study, the factors influencing oil production of the Chang 9 Member in the Jiyuan area were investigated and summarized based on drill cores, such as sediment characteristic analysis, lithofacies analysis, other analytical tests, and conventional logging curves. The findings show that fine-sandstone reservoirs with smooth sand body architectures are the main types of tight sandstone commercial oil reservoirs. Furthermore, having high porosity and oil content are prerequisites for commercial oil reservoirs, and the cumulative thickness of effective reservoirs serves as a crucial resource base for them. Through the analysis of logging curves, the relative center of gravity, deviation root of variance, petrophysical index, effective reservoir thickness, and evaluation indicator were used to predict daily oil production, thereby establishing the identification criteria for the ranking of tight sandstone oil reservoirs using logging. Then, the productivity of each reservoir in a single well was predicted by processing the log data from each well using the proposed method, and the productivity prediction results agreed well with the tested results of the perforated interval. This approach highlights the integrated influence of geological factors, physical properties, and the thickness scale of an effective reservoir, thereby improving the predictive capacity of logging curves. Additionally, the proposed methods significantly reduce the need for reservoir parameters better than previous ones, streamline operations, and improve practical applications.
1. Introduction
In recent decades, energy companies worldwide have been steadily investigating tight oil reserves [1,2,3]. Consequently, global tight oil production continues to increase each year, with substantial amounts pro-vided by the USA, Canada, Russia, Argentina, China, and other nations. The innate productivity of tight sandstone oil reservoirs, typically sans hydraulic fracturing, pales in comparison to that of conventional oil reservoirs, primarily because of the complex pore–throat structures, weak enmeshment of hydrocarbons, and low movable oil saturation [4,5,6,7]. Therefore, predicting oil production has been a challenging task for engineers. Furthermore, understanding and characterizing the impact of tight sandstone oil reservoirs on oil production is essential from petrophysical and geological perspectives.
The most commonly used approach to predict petroleum productivity in porous media is to build a productivity prediction model based on Darcy’s law of fluid mechanics [8,9,10,11,12,13], as it is based on the effective or relative permeability of the oil, pressure differences within the formation, and viscosity coefficient. Most often, the effective or relative permeability is determined directly or derived through mathematical conversion using the measured porosity of the geomatrix from relational petrophysical experiments. However, tight sandstone reservoirs are highly complex and petroleum flow does not thereby conform to Darcy’s law [14,15,16,17,18,19,20]. Multiple mathematical methods have been used to predict and understand the production capacity of oil reservoirs based on well logging curves and production test results. These methods include fuzzy correlation [21,22], artificial neural networks [23,24,25], and multiple regression analysis [26,27,28,29], which take into account the geological features of a particular study area. Several studies have demonstrated the effectiveness and feasibility of implementing intelligent mathematical approaches using neural network technology by establishing and simulating complex nonlinear relationships between different reservoir parameters and productivity [10,11,25,27]. However, these approaches are arbitrary statistical models and have no petrophysical importance. Therefore, a significant amount of data is required to create a comprehensive training library. In summary, machine modeling methods are not suitable for study areas with limited well drilling, especially in newly explored regions.
In China, there are extensive tight sandstone oil reservoirs in the Ordos, Junggar, Songliao, and Bohaiwan Basins, but they differ in their sedimentary environment, lithology, pore type, and so on [6,30,31,32,33,34]. The Upper Triassic Yanchang Formation in the Ordos Basin is known for its rich oil reserves and is of great importance as the primary exploration target for the Changqing Oilfield in China [7,35,36]. In recent years, over 200 exploration wells in the Chang 9 Member have economically produced tight oil, representing significant development potential [7,37]. However, the physical characteristics and oil production of tight sandstone reservoirs vary significantly in different positions. This is attributed to the significant heterogeneity of tight sandstone regarding the genesis, sedimentary structure, and so on. Recently, extensive research has been conducted on the Chang 9 Member, particularly its sedimentary environment, reservoir characteristics, and petroleum accumulation [36,37,38]. These results provided valuable guidance for predicting favorable reservoirs and understanding petroleum accumulation. However, the evaluation of the influence of geological factors on the productivity of tight sandstone oil reservoirs is necessary to develop a method for predicting productivity from a logging geological perspective.
In this study, the geological and petrophysical properties of tight sandstone reservoirs in the Jiyuan area of the Ordos Basin were analyzed using core experiments and data from drilling logs, conventional logging curves, and daily oil production. Mathematical statistical approaches, such as histograms and scatterings have been used to study the influence of various geological factors on oil production in tight sandstone oil-bearing reservoirs, emphasizing the vital roles of sedimentary beddings, high porosity, and oil-bearing properties. Then, a dependable method for predicting productivity is established using primary influencing factors’ integration.
2. Geological Settings
The Ordos Basin is a multicyclic cratonic basin with an area of 25 × 104 km2. It originated in the late Paleozoic period on the North China massifs (Figure 1a). The basin exhibits stable subsidence, depression, migration, and twisting. The Zhongtiao-Qinling, Lang-Daqing, Helan-Liupan, and Luliang mountains lie to the south, north, west, and east of the basin, respectively [38,39,40]. The tectonic evolution of the basin can be divided into five stages/periods [7,31,41]: (1) Archean to Early Proterozoic basin with basement formation; (2) rift development in the middle to Late Proterozoic; (3) sedimentation in the North China block during the Paleozoic to Early Mesozoic; (4) inland lake development in the Middle to Late Mesozoic in Ordos; and (5) basin reformation during the Cenozoic. The Indochina movement during the Late Permian to Triassic period caused substantial changes in the tectonic framework [39]. Currently, the Ordos Basin consists of six main structural units: Weibei and Yimeng uplifts, Jinxi flexural fold belt, western margin thrust belt, Tianhuan depression, and Yishan slope (Figure 1a). The Jiyuan area, located in the central–western section of the Yishan Slope, and the central part of the Tianhuan depression (Figure 1a), has a gentle structure and has no faults or anticlines in most of its area [39].
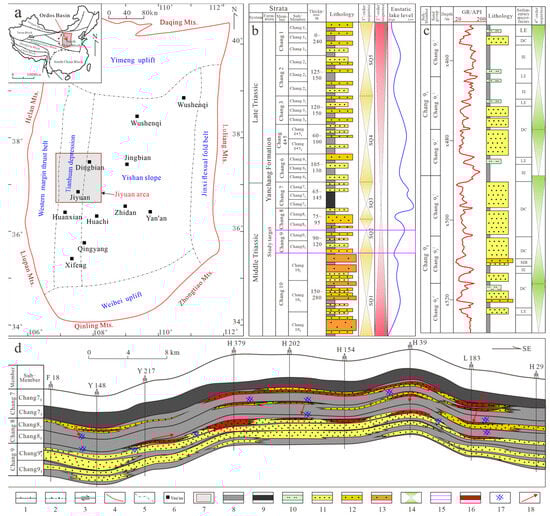
Figure 1.
Geological features of the study area: (a) Location of Jiyuan area and structural units of the Ordos Basin; (b) general regional stratigraphic sequence; (c) subdivisions of the Chang 9 Member; (d) cross section of the tight oil reservoir in the Yanchang Formation in the Jiyuan area (modified from [7,42]. Line types, symbols, and shading are numbered in the legend and described as follows: (1) major structures; (2) large nonstructural fold belts; (3) large strike–slip faults; (4) Ordos border; (5) tectonic unit boundary; (6) place name; (7) study area; (8) mudstone; (9) oil shale; (10) siltstone; (11) fine sandstone; (12) medium sandstone; (13) coarse sandstone; (14) cycles; (15) target layer; (16) tight oil; (17) fractures; (18) direction of migration of hydrocarbons.
During the Late Triassic period, two separate deltas filled into a basin from the north and southwest, forming stratigraphic successions that were 1000–3000 m thick in the Ordos Basin [43,44]. The Upper Triassic Yanchang Formation is divided into 10 members, named Chang 1 Member to Chang 10 Member in a top–down order (Figure 1b) [7,41,45]. The vertical lithofacies sequence of the Yanchang Formation comprises the following five third-order sequences, corresponding to three lake-level cycle periods [7,46]: (1) SQ1 (Chang 10) was deposited during the initial formation; (2) SQ2 (Chang 9–Chang 82) and SQ3 (Chang 81–Chang 7) were deposited during the rapid expansion; and (3) SQ4 (Chang 6–Chang 3) and SQ5 (Chang 2–Chang 1) were deposited during the shrinkage period. The sedimentary environment of the Chang 9 Member in the study area is classified as semi-deep lacustrine or deltaic, with microfacies mainly developing distributary channels and interdistributary bays [30,47,48]. The delta underwent rapid progradation and retrogradation due to the rise and fall of the lake level, resulting in the extensive development of tight sandstone characterized by horizontally contiguous and longitudinally superimposed sequences [38,41]. Based on sedimentary cycles, the Chang 9 Member is subdivided into sub-members Chang 91 and 92, allowing their further division into three sub-units, from bottom to top: Chang 923, Chang 922, Chang 921, Chang 913, Chang 912, and Chang 911 (Figure 1c). The thickness of the individual sand bodies varies from 1.8 to 32 m (average 6.8 m), while the width ranges from 10 to 30 km.
In the study area, the fractures and micro faults present in the Chang 8 and Chang 9 Members, together with the permeable sandstone, facilitated the downward migration of crude oil generated in the Chang 7 source rock (Figure 1d) [7,36]. Additionally, integration of trap types and migration dynamics revealed that the Chang 9 Member in the Jiyuan area mostly contained lithological oil reservoirs with different physical properties. The oil storage capacity is strongly influenced by the microscopic pore structure, macroscopic sand body architecture, and migration distance of the crude oil [7,36,37]. Since the natural productivity of an individual oil layer in this case is typically very low, hydraulic fracturing becomes an essential engineering technology to improve productivity [49]. In general, the examination of daily oil production from a single perforated section in the Jiyuan area mainly focuses on 0.1 to 40 barrels, with an average of 15 barrels.
3. Materials and Methods
3.1. Materials
In this study, 420 core plugs measuring 50 and 25 mm in length and diameter, respectively, were sampled along the horizontal direction from 890 m of cores from 15 wells in the Jiyuan area. The cores were drilled by Greatwall Drilling Company of China National Petroleum Corporation (CNPC). Additionally, 146 thin sections were collected from 15 wells to identify mineral components, distinguish pore types, and analyze grain size. To assess reservoir quality, a total of 320 data sets on porosity, permeability, and fluid saturation data were collected. Furthermore, conventional logging curves from 189 wells, production test results from 31 wells, and detailed stratigraphic data were used. Logging curves with a sampling interval of 0.125 m were measured using the EILOG-05 logging system of the CNPC logging company. Data include acoustic log (AC), density log (DEN), compensation neutron log (CNL), gamma ray log (GR), spontaneous potential log (SP), deep resistivity (RT) log, and shallow resistivity log (RS).
3.2. Experiment and Methods
A Carl Zeiss AG Axio Scope A1 polarized electron microscope was used to analyze thin sections following the Chinese national standard GB/T 18295-2001 [50]. The mineral components of the Chang 9 sandstone were determined based on the point-count results of over 350 grains per thin section. In addition, the grain sizes were calculated based on their planar pixel areas on the thin sections, with no less than 200 grains coming from each thin section [31,46].
The mineralogical constituents of the clay samples were identified using an X-ray diffraction (XRD) instrument operated at 100 mA and 40 kV with Cu-Kα radiation. The samples were air-dried, then saturated with ethylene glycol and heated at 550 ℃ for 2 h.
Field emission scanning electron microscopy (FE-SEM) was performed on 64 samples selected from the studied thin sections using a Zeiss Merlin Compact SEM coupled with an Xflash/30 energy dispersive spectrum (EDS) of X-rays to investigate the clay minerals and their respective geometries, pore types, and pore-filling cements [5]. The FE-SEM images were acquired with a working distance of 5–10 mm, an acceleration voltage of 20 kV, a current emission of 50–100 pA, and a SE2 detector.
High-pressure mercury injection (HPMI) experiments were conducted on 18 sandstone samples using an AutoPore IV 9500 mercury intrusion porosimetry in accordance with Chinese Petroleum Industrial Standard SY/T 5346-2005 [51]. The experiments were to obtain microscopic pore structure parameters, including the pore throat radius and its distribution, threshold pressure, and mercury intrusion saturation. After the displacement pressure was initially increased from 1 psi (0.008 MPa) to a maximum of 14,500 psi (100 MPa), corresponding to a pore throat radius of 4 μm–2 nm, the mercury gradually began to discharge from the pore throat. The pressure decreased gradually. HPMI provided both intrusion and extrusion curves.
The porosity of the samples was measured using a 3020-062 helium porosimeter, which was based on the helium expansion principle. The pressure pulse attenuation non-steady-state method was utilized to calculate the permeability using a GDS-90F permeameter. The distillation extraction method was employed to determine fluid saturation. Measurements of fluid saturation, porosity, and permeability were carried out in compliance with the Chinese National Standard GB/T 29172-2012 [52].
The Chinese Petroleum Industrial Standard SY/T 5788.3-2014 [53] assigns seven levels to the oil-bearing grades of the cores. The classification was based on six indices: percentage of oil-bearing area accounting for the total area of the core, oil saturation level, color, greasiness, odor, and wettability. The order of oil-bearing property from highest to lowest was full oil, rich oil, oil stain, oil patch, oil trace, fluorescence, and no oil show.
3.3. Conventional Logging Interpretation
Two analysis methods were applied to the conventional logging curves using the CIFLog 3.0 version of CNPC. The first method calculated the assessment parameters of the tight sandstone reservoir pointwise using mathematical models based on the response values of conventional logging curves [38]. These reservoir parameters include porosity (Por), shale content (Vsh), and root of variance of deviation (Dvr). Subsequently, a continuous longitudinal section of the calculated results was plotted. The average and cumulative values of these parameters were calculated. The second method, based on the variation in the logging curve values at different depths [13,54,55,56], identified the curve morphology of each reservoir interval with a thickness > 3 m. This type of variation is represented by the relative center of gravity (Rg). Through mathematical analyses of the conventional logs, the resulting computational models of these reservoir parameters were built (Equations (1) and (2)):
where Rg is the relative center of gravity; i is the sampling point in the reservoir interval (i = 1, 2, 3,..., N); and xi is the logging value of sampling point i.
where Dvr is the deviation root of variance; m is the interval of the sampling points, default value of 1; xi, xi+m, and xi−m are the log values of i-th, (i + m)-th, and (i − m)-th sampling points, respectively.
Based on Rg and Dvr, typical logging curve patterns were identified, which include massive, massive and serrated, fining upward, fining upward and serrated, and digitate architecture patterns. The detailed identification criteria are listed in Table 1.

Table 1.
Classification of sand body architectures in the Chang 9 Member of the Jiyuan area, Ordos Basin. A = massive architecture; B = massive and serrated architecture; C = fining upward architecture; D = fining upward and serrated architecture; E = digitate architecture; Rg = relative center of gravity of the GR curve; Dvr = deviation root of variance of the GR curve.
According to above materials and experimental methods, the daily oil production of tight sandstone reservoirs was accurately predicted based on the approaches of univariate analyses and multiple parameters integrated (Figure 2).
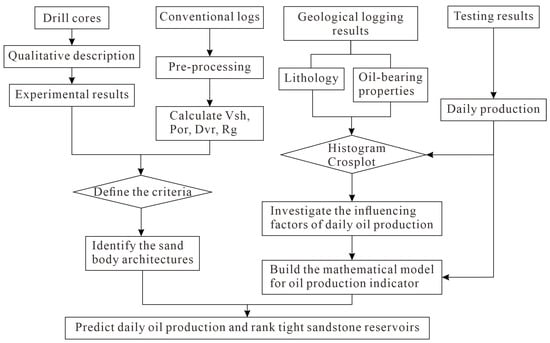
Figure 2.
Flow chart of daily oil production prediction method for tight sandstone reservoirs.
4. Results
4.1. Sedimentary Facies
In recent years, the sedimentary environment and genesis of Chang 9 tight sandstones have received significant attention [7,13,31,36,43]. The Chang 9 Member in the Jiyuan area is generally considered to have a braided-river delta sedimentary environment featuring rich sandstone patterns in the form of a braided-river delta plain, braided-river delta front, and shallow lacustrine sub-facies. Here, the sediments come from the Helan-Lang Mountains, northwest of the Ordos Basin, and these sedimentary sand formations mainly consist of multi-stage distributary channels, with a visible scoured surface and abundant boulder clay at the bottom (Figure 3a,m), followed by fewer levees and rarer mouth bars. Core observation revealed that the size of most sand grains gradually decreased upwards in the reservoir intervals from medium to coarse grained and from fine to very fine grained (Figure 3m). The sedimentary bedding transitioned upwards from large massive bedding to trough cross-bedding (Figure 3b,d,e,h), tabular cross-bedding (Figure 3c), parallel bedding (Figure 3f,g), oblique bedding (Figure 3i), wavy bedding (Figure 3l), sand ripple bedding (Figure 3j,k), and horizontal bedding (Figure 3m). These depositional features indicate that distributary channel sandstones are extensively present in the Chang 9 Member in the Jiyuan area.
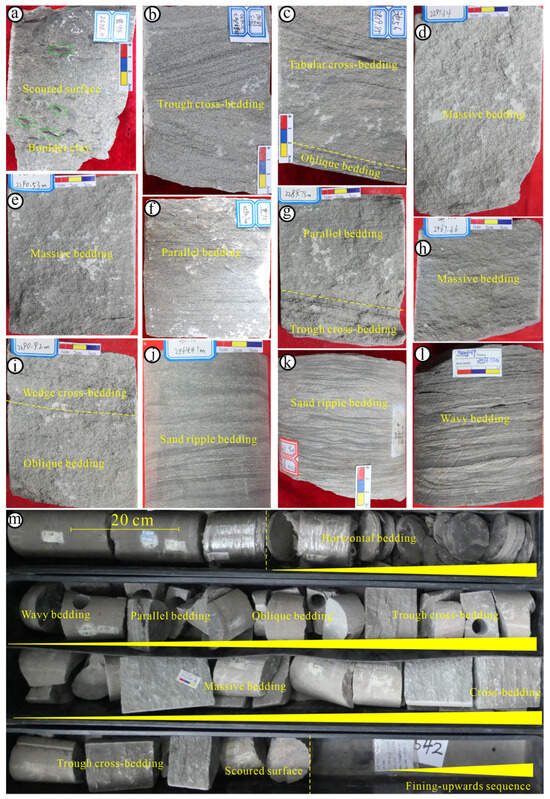
Figure 3.
Sedimentary bedding types and characteristics from the cores of the tight sandstones of Chang 9. (a) Coarse sandstone with a scoured surface and boulder clay shown in green circles, Well L95. (b) Medium–fine sandstone with trough cross-bedding, Well C81. (c) Fine sandstone with tabular cross-bedding and oblique bedding, Well C56. (d,e) fine sandstone showing massive bedding; the bottom showing oblique bedding, Well Z21. (f) Fine sandstone showing parallel bedding, Well L95. (g) Fine sandstone, the upper core showing parallel bedding, while the lower core is dominated trough cross bedding, Well Z21. (h) Fine sandstone showing massive bedding, Well C119. (i) Fine sandstone, the upper part core showing wedge-cross bedding, while the lower core is dominated by oblique bedding, Well Z21. (j) Siltstone with ripple bedding, Well C173. (k) Siltstone with ripple bedding, Well W57. (l) Siltstone with wavy bedding, Well H269. (m) Sequence of upward refinement and weakening of upward hydrodynamic force in a distributary channel creating differential bedding, Well H269.
4.2. Petrography
4.2.1. Detrital Components
Point-counting results from the thin sections indicated that the Chang 9 tight sandstone is composed mainly of lithic arkose, feldspar bearing litharenite, and arkose, according to Folk’s categorization of detrital components [57]. Sandstone contained an average volume proportion of 36.1% quartz (Q), 49% feldspar (F), and 14.9% rock fragments (R) (Figure 4a). In addition, mica, calcified debris, and other rock fragments were present in small quantities (Figure 4c). Overall, the compositional maturity of the Chang 9 sandstones was low. Within these rock fragments, the volume content of volcanic rock fragments (VRF) averaged 29.9% (Figure 5k,l) and primarily consisted of metamorphic rock, quartzite, schist, and phyllite. Metamorphic rock fragments (MRF) averaged 9.6% and mainly consisted of granite and acid-effusive rocks. However, sedimentary rock fragments (SRF) were scarce (Figure 4b).
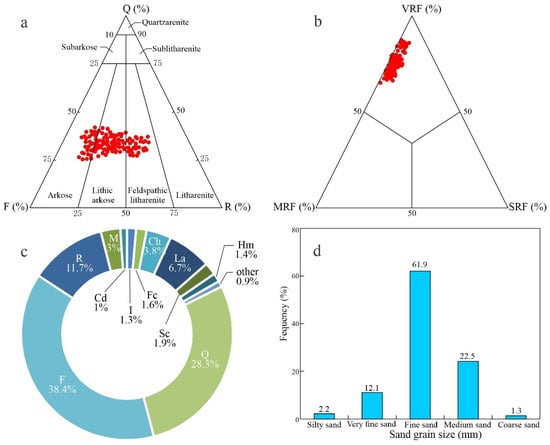
Figure 4.
Petrological feature of the Chang 9 tight sandstone: (a) Ternary diagram showing framework compositions. Q = quartz; F = feldspar; R = rock fragment. (b) Ternary plot showing rock fragment. VRF = volcanic rock fragments; MRF = metamorphic rock fragments; SRF = sedimentary rock fragments. (c) Average volume proportion of detrital and cement components. M = mica; La = Laumontite; Ch = chlorite; Hm = Hydromica; Fc = ferrocalcite; I = illite; Sc = siliceous cement; Cd = calcified debris. (d) Frequency distribution histogram of the grain size. Silty < 0.0625 mm; very fine = 0.0625–0.125 mm; fine = 0.125–0.25 mm; medium = 0.25–0.5 mm; coarse > 0.5 mm.
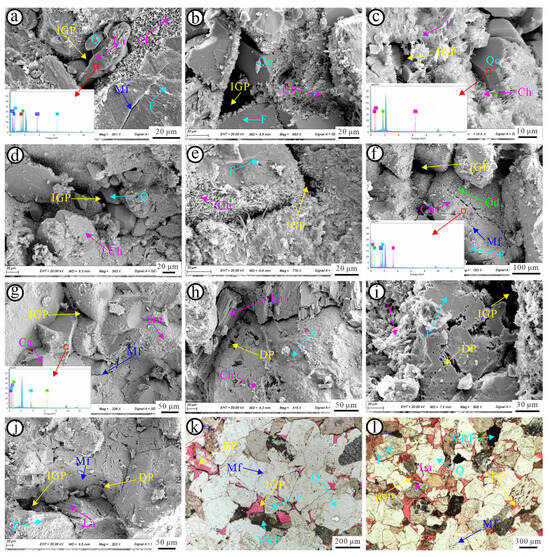
Figure 5.
Optical microscopy images, field emission scanning electron microscopy (FE-SEM) photos, and images showing the features of pores in the Chang 9 tight sandstone. (a) Preservation of intergranular pores using a continuous chlorite rim, showing the morphology of the intragranular microfracture, authigenic quartz, and laumontite formed between the pore spaces preserved by the chlorite rim. EDS confirmed laumontite; the energy spectrum is shown at the bottom left of the FE-SEM image. Well B42, 2495.18 m. (b) Preservation of intergranular pores with continuous chlorite rim; quartz overgrowth occurs where the chlorite rim is discontinuous. Well Y480, 2254.05 m. (c) Preservation of intergranular pores and inhibition of quartz overgrowth using continuous chlorite rim. EDS confirmed the quartz overgrowth; energy spectrum is seen at the bottom left of the FE-SEM image. Well Y480, 2247.70 m. (d) Preservation of intergranular pores and inhibition of quartz overgrowth with continuous chlorite rim. Well Y480, 2261.70 m. (e) Preservation of intergranular pores with a continuous chlorite rim. Well B42, 2492.90 m. (f) Preservation of intergranular pores with continuous chlorite rim, showing morphology of intragranular microfracture and many oil droplets. EDS confirmed feldspar grain; energy spectrum is noted at the bottom left of the FE-SEM image. Well Y480, 2237.68 m. (g) Calcite cement between grains; smectite mixed on the surface of grains; and residual intergranular pores and microfracture. EDS confirmed calcite cement; energy spectrum is noted in the bottom left of the FE-SEM image. Well Y480, 2232.16 m. (h) Laumontite interstitial material, chlorite rim, intragranular pores, and intragranular dissolved pores. Well C149, 2293.40 m. (i) Preservation of the intergranular pores with continuous chlorite rim and intragranular dissolved pores occurs in feldspar grains. Well B42, 2492.00 m. (j) Intragranular dissolved pores and microfracture occurs in laumontite interstitial material and residual intergranular pores. Well Y457, 2289.70 m. (k) Intergranular pores, dissolved pores using feldspar dissolution; intragranular microfractures, and volcanic rock fragments are common. Well C161, 2240.50 m. (l) Intergranular pores dissolved pores using feldspar dissolution; intragranular microfractures, laumontite interstitial material, and volcanic rock fragments are common. Well C169, 2548.47 m. Q = quartz; F = feldspar; VRF = volcanic rock fragments; Qo = quartz overgrowth; La = laumontite; Ch = chlorite; I = illite; Sm = smectite mixed layer; Od = oil droplet; IGP = intergranular pore; DP = dissolved pore; Mf = microfracture.
4.2.2. Texture
Grain size analysis showed that grain diameter in the Chang 9 sandstones varied slightly, with most grain diameters in the range of 0.1–0.7 mm (Figure 4d). Of these, 22.5%, 61.9%, and 12.1% of the samples were medium, fine, and very fine sandstones, respectively, corresponding to average grain diameters of 0.25–0.5 mm, 0.125–0.25 mm, and 0.0625–0.125 mm [42]. Siltstone and coarse sandstone accounted for 3.5% of the total samples and had an average grain diameter <0.0625 mm and more than 0.5 mm, respectively. These data indicated that the Chang 9 sandstones were predominantly very fine- to medium-grained and moderately to well sorted.
4.2.3. Interstitial Materials
Interstitial materials contribute to the consolidation and stabilization of clastic minerals while controlling to some extent the development of pore space and connectivity [31,58,59]. Thin section analysis and FE-SEM images revealed that the Chang 9 sandstones contain large amounts of silicates (e.g., laumontite, silica) cement, clay minerals (e.g., chlorite, illite, and kaolinite), and calcite (Figure 5a–j), which are widespread in intergranular pores, replacing rock fragments and feldspar grains. On average, the interstitial materials of the Chang 9 sandstones mainly included laumontite (6.7%) (Figure 5a,h,j,l), chlorite (3.8%) (Figure 5b–f), silica (1.9%), iron calcite (1.6%) (Figure 5g), hydromica (1.4%), and illite (1.3%) (Figure 5c) in order of decreasing volume fraction. Additionally, iron calcite and laumontite often filled the pores of a porphyry, while chlorite formed a coating (Figure 5).
4.3. Pore Space
Based on the observations of casting thin sections and FE-SEM images, the Chang 9 sandstones in the Jiyuan area contained five common pore types: primary intergranular pores, secondary dissolution pores (including intergranular and intragranular dissolved pores), intercrystalline pores, and microfractures (Figure 5).
Primary intergranular pores refer to the original sediment pore spaces that remained after compaction and diagenesis [60,61,62]. They were located among framework grains such as quartz, feldspar, and rock fragments (Figure 5a–g). These pores typically had triangular, quadrangular, or irregular polygonal shapes with clear boundaries and no grain dissolution. The Chang 9 sandstone commonly had pore linings composed of clay rims 3 to 5 μm, or even up to 10 μm thick. The average optical porosity of these pores was 5.26%, with a maximum of 14.5%.
Intergranular dissolution pores were primarily produced by grain dissolution at the edges of the feldspar and VRF or by the selective dissolution of carbonate cements (Figure 5k,l). The pores were often irregularly shaped and predominantly filled with laumontite, authigenic quartz, and carbonate cement, whereas the grain edges were characterized by hidden shapes.
Intragranular dissolution pores were secondary pores in grains, typically with irregular shapes (Figure 5h–l). These were frequently observed in grain debris, which may be filled with late-stage iron-bearing carbonate minerals. In the Chang 9 sandstone, these dissolution pores were predominantly formed in laumontite cement, followed by feldspar and rock fragments, and rarely in carbonate cements. The average optical porosity of this pore type was 0.32%, with a maximum of 5.9%.
Intercrystalline pores developed mainly in the clay aggregates of chlorite, illite, and kaolinite, and showed lower optical porosity. Microfractures primarily referred to microcracks with irregular distribution that intersected the framework grains and their adjacent intergranular pores (Figure 5f,k,l). These microfractures were also often observed in the laumontite cements of the Chang 9 sandstone in the study area.
Overall, the primary pore space within the Chang 9 sandstones in the study area comprised residual primary intergranular pores, accounting for 76.3% of the total pores. The intragranular and intergranular dissolution pores accounted for 12.9% and 7.3%, respectively. Conversely, the intercrystalline pores and microfractures made a relatively small contribution to the pore space.
4.4. Petrophysical Properties and Productivity
4.4.1. Porosity and Permeability
The measured porosity values of the core plug ranged from 1.2% to 17.45% (average 8.42%) (Figure 6a), and the absolute permeability ranged from 0.004 to 27.4 mD (average 0.21 mD) (Figure 6b). Notably, some individual samples with microfractures had absolute permeability values of up to 27.4 mD. In addition, the high level of uncertainty of laboratory permeability measurements was a common occurrence in tight sandstone reservoirs [63,64,65]. The plug porosity histogram of the Chang 9 sandstone showed a wide, asymmetrical, unimodal distribution, with a peak value between 6% and 8% with a mean of 6.73%. Similarly, the absolute permeability histogram of the samples exhibited a broad, unimodal distribution, centered between 0.1 and 1 mD with a mean of 0.07 mD. Simultaneously, the cross-plot analysis showed a positive exponential correlation between plug porosity and absolute permeability, with a reasonable correlation coefficient (R2 = 0.6482) (Figure 6d). The classification suggested by Bloch et al. (2002) [66] was used to classify Chang 9 tight sandstone reservoirs into three types (Figure 6a,b). Type I reservoirs, categorized as unusually high-porosity reservoirs, had porosity greater than 10% and absolute permeability greater than 1 mD, accounting for 27% of all samples. Type II reservoirs were low-porosity reservoirs with porosity ranging from 6% to 10% and absolute permeability between 0.1 and 1 mD, accounting for 28% of all samples. Type III reservoirs, known as ultra-low-porosity reservoirs, had a porosity of <6% and absolute permeability of <0.1 mD, accounting for 45% of all samples. The plug porosity and absolute permeability distributions suggest that there is significant macroscopic heterogeneity in the quality of the tight sandstone reservoir in the Chang 9 Member.
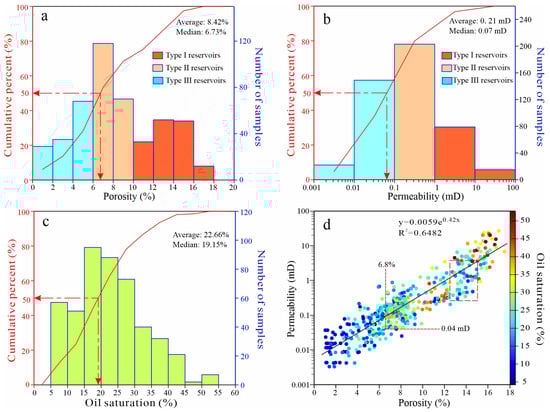
Figure 6.
Petrophysical properties of the Chang 9 tight sandstone reservoir. Distribution histogram of the measured reservoir physical parameters: (a) porosity, (b) permeability, and (c) oil saturation. (d) Diagram showing the correlation between porosity, permeability, and oil saturation.
4.4.2. Oil-Bearing Capacity
The Chang 9 tight sandstones exhibit strong oil-bearing heterogeneity. This means that oil-bearing property differs significantly in different sand bodies, even at different positions within the same sand body. The Chang 9 tight sandstones have oil-bearing grades, consisting mainly of oil patches and traces, accounting for 39.2% and 34.3% of the total cores, respectively. The distribution of crude oil on the core surface was uneven, often in an irregular band shape or in a porphyry manner (Figure 7). The experiment conducted on the Chang 9 tight sandstones revealed an oil saturation range of 5.8%–52.7%, with an average of 22.66% (Figure 6c). The oil saturation of the oil-patch sandstones was predominantly distributed in a bimodal pattern, with an average of 24.89% and a median of 21.57% (Figure 8a). The average oil saturation of the sandstones with oil trace was 24.43%, and the median was 21.32% (Figure 8a). Most non-oil sandstones had oil saturation < 20%, averaging 15.19% (Figure 8a). The aforementioned analysis indicates that the degree of crude oil charging is low in the Chang 9 tight reservoirs. Therefore, they are classified as weak-to-moderately saturated tight oil reservoirs.
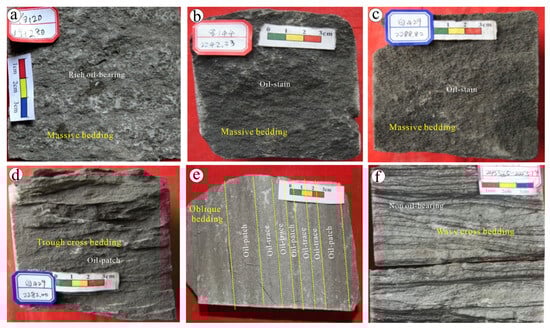
Figure 7.
Photographs showing varied oil content in Chang 9 tight sandstone with various bedding. (a) Massive bedded core showing rich oil-bearing, Well B120. (b) Massive bedded core showing oil-stain, Well L144. (c) Massive bedded core showing oil-stain, Well B429. (d) Crossing bedded core showing oil patch, Well B429. (e) Oblique bedded core showing varied oil-bearing property, Well L357. (f) Wavy cross-bedded core no oil bearing, Well C245.
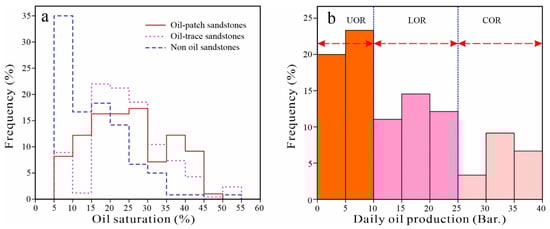
Figure 8.
Oil-bearing feature of the Chang 9 tight sandstone. (a) Distribution histogram of measured oil saturation in oil patches, oil traces, and non-oil sandstones. (b) Distribution histogram of tested daily oil production. A series of tight sandstone oil reservoirs are imported from the classification proposed by Changqing Oilfield. COR = commercially available tight oil reservoir; LOR = low-yielding tight oil reservoir; UOR = ultra-low-yielding tight oil reservoir.
4.4.3. Oil Productivity
Tight sandstone oil reservoirs generally exhibit ultra-low productivity under natural stratigraphic conditions. However, their productivity improved significantly after artificial stimulation, such as hydraulic fracturing. In China, the categorization of productivity for tight sandstone oil reservoirs varies by oilfield [7,49], depending on exploration costs. The tight sandstone oil reservoirs in the Chang 9 Member of the Ordos Basin were divided into three categories based on daily oil production after some period of hydraulic fracturing: commercial oil reservoirs (CORs) with daily oil production > 25 barrels; low-yielding oil reservoirs (LORs) with 10–25 barrels daily oil production; and ultra-low-yielding oil reservoirs (UORs) with <10 barrels daily oil production. In addition, several invalid, non-oil-producing reservoirs were present [7,29]. Figure 8b presents the daily oil production statistics for the Chang 9 tight oil reservoir from 30 post-hydraulic fracturing wells, which were mainly dominated by LORs (35%) and UORs (44%), with CORs accounting for only 21%.
4.5. Sand Body Architectures
Based on the core observations of lithology, sedimentary bedding, and sand body genesis analysis, combined with vertical morphological responses from the corresponding natural gamma logging curve [13,38,41,55,56,67], this study identified the following five different sand body architectures within the Chang 9 sandstones in the Jiyuan area: massive architecture, massive and serrated architecture, fining upward architecture, fining upward and serrated architecture, and digitate architecture (Figure 9 and Table 1).
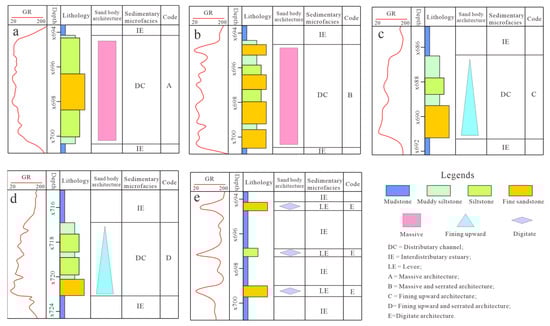
Figure 9.
Well curve morphology of different sand body architectures of the Chang 9 tight sandstones. (a) Massive architecture, Well C89. (b) Massive and serrated architecture, Well H49. (c) Fining upward architecture, Well C56. (d) Fining upward and serrated architecture, Well Y430. (e) Digitate architecture, Well N36.
4.5.1. Massive Architecture
The massive sand bodies are formed through single-stage distributary channel sedimentation. These sand bodies consist of fine sandstones with well-developed massive bedding (Figure 3d,e) and occasional argillaceous intercalation. Their grain size exhibited a slight upward trend, indicating sustained high-energy hydrodynamic forces and a continuous material supply. The natural gamma logging values of massive architecture showed a sudden increase at both the upper and lower boundaries of the layer, which appeared homogeneous, with minor differences in the internal logging values (Figure 9a). The thickness of each sand body varied from 3 to 15 m.
4.5.2. Massive and Serrated Architecture
The massive and serrated sand bodies are primarily composed of fine-to-siltstone containing argillaceous laminas. These depositional features are characterized by intermittent high-energy distributary channels, which develop large-scale trough cross-bedding (Figure 3b,c), as well as oblique and parallel bedding (Figure 3f,g). Conventionally, their logging shape is comparable to those of massive architecture sand bodies, while the appearance of sedimentary beddings in the sand body caused a local increase in the natural value of the GR curve, resulting in an abrupt kink in the logging values. As a result, the morphology of the GR curve was dominantly characterized by a weak–medium massive and serrated shape (Figure 9b).
4.5.3. Fining Upward Architecture
The fining upward sand bodies are characterized by distributed channel deposits under gradually decreasing energy conditions. These sand bodies are typically ~cm to ~m thick and have a gradational contact at the upper part and a sudden contact at the bottom. Massive bedding frequently occurred at the bottom of the sand body, with oblique and wavy bedding (Figure 3l) developing toward the top. Individual sand bodies showed a marked downward trend in grain size. The morphology of the natural gamma log curve for this sand body was, therefore, primarily defined by a fining upward shape (Figure 9c).
4.5.4. Fining Upward and Serrated Architecture
The fining upward and serrated sand bodies are comparatively finer than the fining upward sandstone and consist mainly of siltstone. The sand body has diverse, heterogeneous bedding and well-developed argillaceous beddings. Gradually upward, large-scale cross-bedding and parallel bedding give way to ripple bedding (Figure 3j,k) and horizontal bedding (Figure 3m), with a gradual reduction in the scale of bedding. Several abrupt internal bends appeared in the logging values, each of which represented a sedimentary interruption or a densely appearing bedding zone. Therefore, the GR curve morphology was dominantly exhibited by a weak to medium fining upward and serrated shape (Figure 9d).
4.5.5. Digitate Architecture
The digitate sand bodies are deposited under quiescent and low-energy sedimentary conditions. These sand bodies predominantly consist of argillaceous siltstone, siltstone, and very fine to fine sandstone. Horizontal bedding, small-scale cross bedding, and ripple bedding were commonly observed, with a typical thickness of <3 m. The log curve morphology was mainly characterized by high fluctuations, forming a finger-shaped curve (Figure 9e).
5. Discussion
5.1. Factors Controlling the Productivity of Tight Sandstone Oil Reservoirs
Generally, the production capacity of tight sandstone oil reservoirs is closely related to the reservoir characteristics, crude oil properties, production differential pressure, and the effectiveness of hydraulic fracturing [7,11,46,68,69]. For the target formation in a specific study area, the differences are of weak crude oil properties and in production differential pressure. Therefore, the geological features of tight sandstone oil reservoirs have a crucial impact on their hydraulic fracturing production capacity, which is reflected in their oil-bearing potential and the possibility of production improvement through artificial stimulation [25,37,70,71]. The oil-bearing capacity of tight sandstone oil reservoirs can be determined using several geological factors, such as porosity, oil saturation, and effective thickness, whereas the production enhancement is mainly related to the brittleness of the rock matrix and the extensive thickness of the pore–fracture networks formed through hydraulic fracturing.
5.1.1. Lithology
The Chang 9 tight sandstone oil reservoirs in the study area are distributed across the delta plain and front regions and are found extensively in fine and medium sandstone from the distributary channels [7,31,38,46], as well as siltstone and very fine and fine sandstone from the levees (Figure 10a). This study showed that tight oil reservoirs are predominantly found in fine and very-fine-sandstone reservoirs, accounting for 46.7% and 23.3% of the total number of oil reservoirs, respectively. Siltstone and medium-sandstone oil reservoirs were the third and fourth most frequently occurring, accounting for 20% and 10% of all oil reservoirs, respectively. Of these fine-sandstone oil reservoirs, 41.7% were CORs and 33.3% were LORs (Figure 10b). Only 25% of the fine-sandstone oil reservoirs had UORs, suggesting that fine-sandstone oil reservoirs with high production capacity were prevalent. Although there were relatively few medium-sandstone oil reservoirs in the study area, they generally had high production capacity (Figure 10b), as they were mostly composed of CORs and LORs. Very-fine-sandstone oil reservoirs were found in this study area, but they were predominantly composed of UORs and LORs (Figure 10b), accounting for 55.6% and 44.4% of the total number of very-fine oil reservoirs, respectively. However, only a few CORs have been identified. Furthermore, the grades of the tight siltstone oil reservoirs in the study area were similar to those of the oil reservoirs found in the very fine sandstone, with the UORs accounting for 83.3% of the total number of siltstone oil reservoirs (Figure 10b); however, they did not contain any CORs, and only a few LORs.
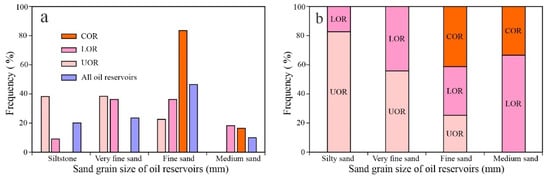
Figure 10.
Influence of sand grain size on daily oil production. (a) Distribution histogram of the series of tight sandstone oil reservoirs with varying grain sizes. (b) Different productivity compositions in tight sandstone oil reservoirs with different grain sizes. COR = commercially available tight oil reservoir; LOR = low-yielding tight oil reservoir; UOR = ultra-low-yielding tight oil reservoir.
This analysis shows that the lithology of tight sandstone oil reservoirs significantly impacts the production capacity. As the grain diameter of the tight sandstones increased, the proportion of CORs gradually increased, while the proportion of UORs decreased (Figure 10). This could be closely related to the fracturing effect of hydraulic fracturing treatments on reservoirs with varying mechanical properties. Previous experimental investigations have shown that tight sandstones with larger grain diameters have higher brittleness levels than those with smaller grain diameters [11,72,73]. Moreover, if the argillaceous mineral content of the tight sandstone increases and develops heterogeneous beddings, it can impede the longitudinal migration of petroleum and significantly reduce the effectiveness of hydraulic fracturing [31,40,74]. Therefore, the COR content in the siltstone and very-fine-sandstone oil reservoirs, which have a high shale content, is much lower than in the fine- and medium-sandstone oil reservoirs. In summary, the fine- and medium-sandstone oil reserves in the Chang 9 Member are the most favorable in the Jiyuan area and offer promising potential for exploration and development.
5.1.2. Physical Properties
Various factors such as genesis, composition, texture, and diagenetic evolution contribute to differences in the physical properties of tight sandstone oil reservoirs, which consequently affect the degree of oil charging and productivity [34,37,68,69,75]. The effects of the physical properties of tight sandstone oil reservoirs on their production capacity are mainly illustrated by their macroporosity, micropore structure, oil saturation, and longitudinal pore network scale.
Macroporosity refers specifically to the size of the reservoir space, while the microstructure primarily characterizes the size, distribution, and interconnectivity of the pores and necks. Typically, the greater the porosity of the oil reservoir, the easier the oil charging, the higher the oil saturation, and the larger longitudinal pore scale associated with hydraulic fracturing stimulation. However, contradictions are common in tight sandstone oil reservoirs, mainly because of their complex micropore structures and ultra-low porosity. Analysis of the experimental results revealed that oil saturation increases with increasing porosity and permeability (Figure 11). Nevertheless, the porosity and permeability values corresponding to the oil saturation have a wide range (pink dashed line in Figure 11), indicating a negative relationship between them.
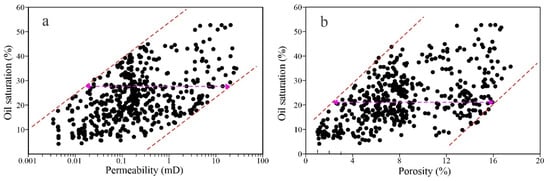
Figure 11.
Influence of porosity and permeability characteristics of the Chang 9 tight sandstone on oil saturation from experimental results. As (a) porosity and (b) permeability increase, the oil saturation increases slightly. The red dashed lines represent the (a) porosity and (b) permeability boundary.
Furthermore, the cross-plotting porosity, permeability, and oil saturation from experimental results showed that 78.7% of samples with porosity > 6.8% and permeability > 0.04 mD (Type II or Type I reservoirs) had oil saturation > 31.6% (Figure 6d). In these samples, the total oil saturation increased with increasing porosity and permeability; however, for samples with porosity in the range of 12.4–14.9% (Figure 6d, red dashed box), the oil saturation was significantly lower than the other samples. For tight sandstone samples with a porosity < 6.8%, most samples had oil saturation < 20%. It can be concluded that porosity and permeability affect the distribution trend of oil in tight sandstone reservoirs, which is consistent with previous studies [7,14,19,22,40,46].
To further investigate the influence of physical properties on reservoir productivity, cross-plots of porosity, deep resistivity curves, oil saturation, and daily oil production after hydraulic fracturing (Figure 12a, Figure 12b, and Figure 12c, respectively) were used. Cross plots were created from the interpretation of calibrated conventional logging curves and oil testing results. The log correlation coefficients of the cross-plot relationships between these physical properties and daily oil production after hydraulic fracturing were 0.3656, 0.4566, and 0.3481, respectively. Although a positive correlation was observed between these reservoir parameters and daily oil production, the monotonic correlation was poor and variable. These different correlations demonstrate that the productivity of tight sandstone deposits is not determined by individual deposit parameters but by their integrated influence [11,24,25,29,48]. Based on the logarithmic correlation coefficients between the reservoir parameters and daily oil production, it was found that the deep resistivity curve and the calculated porosity have a greater influence on the productivity of tight sandstone reservoirs than oil saturation. This is attributed to large errors in calculating oil saturation using conventional logging curves for tight, low, to ultra-low porosity reservoirs that do not meet Darcy flow conditions.
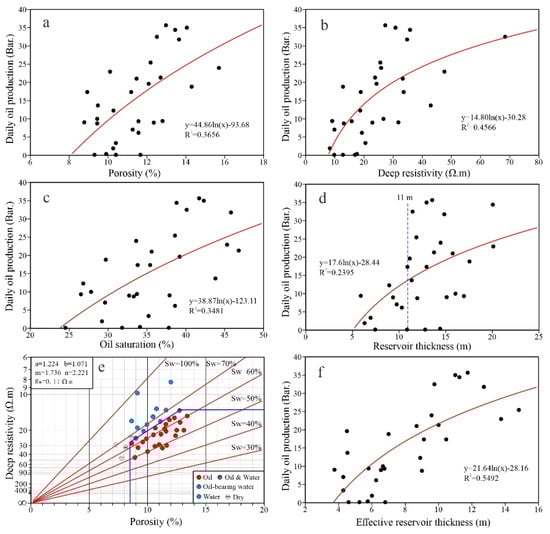
Figure 12.
Effects of reservoir parameters on daily oil production of tight sandstone oil reservoirs: (a) scatter plot of porosity; (b) deep resistivity; (c) oil saturation; (d) reservoir thickness; (f) effective reservoir thickness. (e) Cross plot of porosity and electrical resistivity of the Chang 9 tight sandstone reservoirs showing the identification criteria for effective reservoirs (from reservoir testing results).
5.1.3. Thickness of the Effective Reservoir
The thickness of the tight sandstone reservoir interval is significantly affected by the development scale and pore distribution characteristics [11,29,73,74,76]. After hydraulic fracturing operations, the pore scale and potential production capacity increased with the reservoir’s interval thickness. However, the correlation between the interpreted thickness-derived logging and test of oil production in 31 reservoir intervals examined was weak, with a low correlation coefficient of only 0.2395 (Figure 12d). Also, if the reservoir thickness is greater than 11 m, any further increase in reservoir thickness will not increase productivity and may even decrease production capacity. This is primarily due to the heterogeneity of physical properties in different reservoir intervals. As porosity calculated from logging curves is the most accurate measure for physical property parameters, other reservoir parameters can be derived indirectly from calculated porosity, including the commonly used permeability and oil saturation. This calculation could have a significant impact on the assessment of oil-bearing properties in tight sandstone reservoirs, leading to less effective logging-based interpretation of reservoir thickness and, consequently, a weaker correlation between reservoir thickness and productivity.
In this study, logging was used to accurately interpret the porosity, deep resistivity curves with reliable indications of oil saturation, and test results of the oil reservoirs and to define a lower-limit standard for effective tight sandstone reservoirs in the study area (Figure 12e). The detailed identification criteria for effective reservoirs are as follows: calculated porosity > 8.5%; deep resistivity > 13 Ω.m; and oil saturation > 35%. The lower-limit standard was then used to calculate the effective reservoir thickness. The computational workflow begins at the top of the reservoir interval and sequentially identifies the sampling points that meet the effective reservoir threshold. The total number of sampling points was multiplied by the sampling interval of 0.125 m to calculate the effective reservoir thickness. Based on the identification results, a cross-plot was constructed between the effective reservoir thickness and test of daily oil production (Figure 12f), with a logarithmic correlation coefficient of 0.5492. This comparison shows that the correlation between the effective thickness of the tight sandstone reservoir and daily test of oil production is substantially better than between reservoir thickness and daily test of oil production. Therefore, it can be concluded that the thickness of the effective reservoir has significant influence on the productivity of a tight sandstone reservoir compared with the commonly used reservoir thickness.
5.1.4. Macroscopic Sand Body Architecture
Macroscopic sand body architecture is a comprehensive material manifestation of all structural activities and sedimentary processes that occur during the formation of tight sandstone reservoirs [13,40,55,67]. It plays a significant role in controlling the wide distribution of reservoirs’ physical and oil-bearing properties and productivity. Generally, under stable structural settings, sedimentary factors macroscopically control the genesis, thickness, size, and spatial distribution of reservoirs, as well as the sediment composition, grain size, and interstitial materials of the sediments, impacting the evolution of diagenesis [32,38]. The study area consists of tight sandstones with the most common distributary channels and a few levees. Due to changes in the hydrodynamics of the sedimentary environment, various types of sedimentary beds have developed in these sandstones (Figure 3). These beds can be divided into homogeneously and heterogeneously bedded sandstones (HOS and HES, respectively). HOS are characterized by massive beds that are predominantly deposited in highly hydrodynamic environments and are characterized by good sorting and low shale content. It exhibited a smooth architecture on the logging curves (Figure 9a,c). HES are regularly distinguished by their cross-, oblique, parallel, and wavy beddings. They are mostly deposited intermittently in strong hydrodynamic environments or in weak hydrodynamic environments, and exhibit a toothed architecture on logging curves (Figure 9b,d). The HPMI curve reveals that the micropore structure in the HOS is better than that in the HES (Figure 13a). The threshold pressure in HES and HOS was 0.47 and 0.2 MPa, respectively. When the pressure was reduced to atmospheric pressure, the residual mercury saturations in HOS and HES were 80.02% and 78.7%, respectively. The main pore neck radius was in the range of 0.25–0.4 and 0.063–1.1 μm in the HOS and HES, respectively. Figure 13b illustrates the intersection plot of porosity and permeability in the Chang 9 tight sandstone, highlighting the differences in physical properties of sand bodies with different architecture types. Sand bodies with porosity > 9.2% and permeability > 0.07 mD were mainly composed of A and C sand bodies and a small amount of B and D sand bodies. Furthermore, the A sand bodies had slightly better physical properties (average porosity of 13.4%) than the C sand bodies (average porosity of 12.6%). The porosity of most serrated architectural sand bodies was below 9.2%. The average physical properties were 9.1% for the B sand bodies and 8.2% for the D sand bodies. Although in the study area most samples were selected from the sand bodies of the Chang 9 distributary channel, differences in sand body architecture can result in significant differences in physical properties, which is a clear expression of reservoir heterogeneity within the same sedimentary facies. In a given sedimentary facies, the primary porosity of the rocks has a considerable influence, whereas the sedimentary structure (particularly HES) exerts an extremely significant influence on permeability.
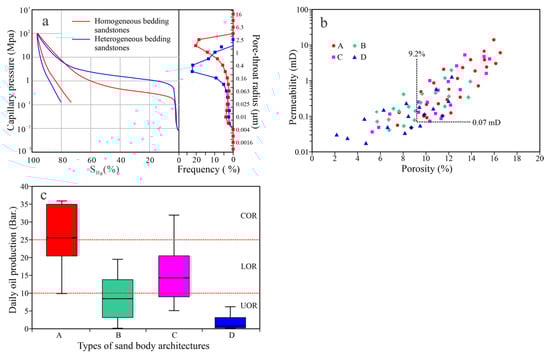
Figure 13.
Effects of sand body architecture on daily oil production of tight sandstone oil reservoirs. (a) Mercury intrusion and extrusion curves, and pore–throat distribution of the homogeneous bedding and heterogeneous bedding sandstones. (b) Diagram showing the correlation between porosity, permeability, and sand body architectures. (c) Distribution of daily oil production in different sand body architectures. A = massive architecture; B = massive and serrated architecture; C = fining upward architecture; D = fining upward and serrated architecture; COR = commercial tight oil reservoir; LOR = low-yielding tight oil reservoir; UOR = ultra-low-yielding tight oil reservoir.
Figure 7 presents the differences in oil-bearing properties across cores with sand bodies of various architectures. The oil-bearing properties of homogeneous massive tight sandstones are typically superior to those of heterogeneous tight sandstones. The cores revealed mechanisms that obstruct the flow of petroleum in diverse beddings, resulting in a striated allocation of petroleum between the beddings. A high degree of heterogeneous bedding frequently resulted in the absence of petroleum in the core. Besides primary porosity and permeability, notable variations were observed in the allocation of early changes, and intermediate changes were observed in distinct sand body architectures. Consequently, the differences in the evolution paths of reservoir heterogeneity were significantly influenced. For example, A and C sand bodies offer favorable pathways for geologic fluid flow, facilitating the formation of secondary pores and petroleum accumulation.
After studying the effects of sand body structure on reservoir physical properties and oil content, a further analysis was conducted on the production capacity of tight sandstone reservoirs relative to sand body structure (Figure 13c). Evidently, the production capacity of HOS, also known as reservoirs with smooth architecture and low shale content, was significantly higher than that of HES, referred to as serrated architecture sand body reservoirs with high shale content. The daily oil production of the A and C oil reservoirs is primarily between 20 and 35 barrels and 9 and 20 barrels, respectively. These reservoirs are considered the CORs and LORs. The daily oil production of the B oil reservoirs is primarily between 3 and 14 barrels, predominantly in the UORs and lower in the LORs. The D oil reservoirs are significantly lower than other sand body architecture types of oil reservoirs, with a maximum daily oil production of only six barrels, all of which were categorized as UORs. In addition, the daily oil production distribution was wide for all types of oil reservoirs with sand body architecture, especially for those with smooth architecture, where the difference between the highest and lowest daily oil production was 27 barrels. However, serrated oil reservoirs showed a relatively narrow range of daily oil production. Our analysis reveals that daily oil production is relatively high in oil reservoirs with smooth architectures, despite the fact that they show stronger productivity heterogeneity than their toothed counterparts. Under the current technological production conditions, these oil reservoirs can provide positive outcomes in terms of exploration and development for energy companies. In comparison, the production of toothed-architecture oil reservoirs is fairly limited and is primarily considered a UOR, resulting in comparatively minor exploration and development benefits.
5.2. Powerful Indicators for Productivity Prediction
Energy companies aim to quickly identify potential production intervals within an oil well and predict their post-drilling production capacity. Therefore, researchers have determined correlations between powerful indicators for predicting reservoir productivity to provide a foundation for productivity prediction in tight sandstone oil reservoirs [23,25,29,76,77]. A study of the factors controlling production capacity in the Chang 9 tight sandstone reservoirs in the Jiyuan area revealed that lithology, physical properties, oil-bearing properties, and effective reservoir thickness have different effects on production capacity. Fine-sandstone reservoirs with smooth sand body architecture were found to be the main economic reservoirs of tight sandstone. Furthermore, having high porosity and oil content are basic requirements for tight sandstone CORs, and the cumulative thickness of effective reservoirs serves as a crucial resource base for them.
The Rg and Dvr of the natural gamma curve enable the quantification and recognition of macroscopic sand body architectures [13,38]. Table 1 presents the specific criteria for the lithology in Chang 9 tight sandstone within the Jiyuan area using standardized natural gamma curves. A model for calculating the porosity was established using a calibrated density curve (Figure 14) with a linear correlation coefficient of 0.8459. Notably, the lower limit of porosity (8.5%) of the effective reservoir corresponds to a density value of 2.55 g/cm3 (Figure 14). For tight sandstone oil reservoirs, the calculation error of oil saturation is relatively high, resulting in low-yielding oil flow or no oil flow, although some oil reservoirs have higher oil saturation. Consequently, the present study replaced the oil saturation calculated through logging with a deep resistivity curve value to indicate oil bearing. Figure 12b,c reveal that the deep resistivity curve is more effective than oil saturation in indicating the oil-bearing capacity of tight sandstone oil reservoirs. The details of determining the effective reservoir thickness are discussed in Section 5.1.3.
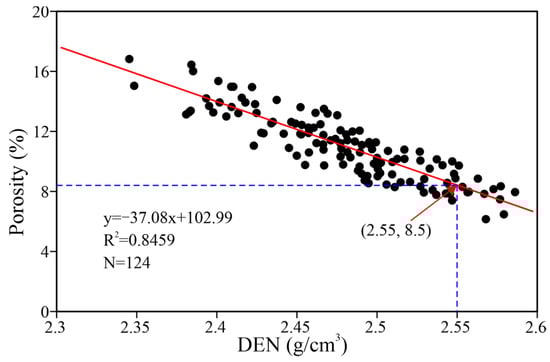
Figure 14.
Improved correlation between rock density and calibrated density curve value, demonstrated the porosity calculation model in the Chang 9 tight sandstone reservoir.
To achieve more accurate predictions of production capacity, this study examined the integrating effects of lithology, physical properties, and the development scale of effective reservoirs. Based on the analysis of a single factor, an integrated production capacity indicator (PEI) was created taking into account different geological factors and their impact characteristics. The resulting mathematical expressions are as follows:
where GRcut and DENcut are the GR and DEN thresholds of the effective reservoir and have values of 80 and 2.55 in this study, respectively; a is the regional experience coefficient (in this study, a = 4); i is the sampling point in the reservoir interval (i = 1, 2, 3,… N); GRi and DENi are the logging values of the sampling point i; and PIi is the petrophysical index value of the sampling point i.
where i is the sampling point (i = 1, 2, 3… N), PIi, RTi, and PEIi are the logging values of sampling point i in the given reservoir interval, and ERT is the effective reservoir thickness of the given reservoir interval.
In this scenario, the PEI curve was calculated pointwise for the tight sandstone reservoirs. Subsequently, the statistical relationship between the PEI and the tested daily oil production was used to predict the productivity of each oil reservoir based on the PEI curve (Figure 15), with a logarithmic correlation coefficient of 0.8111. Furthermore, daily oil production can be predicted well using the PEI parameter: when the average PEI value of oil reservoirs is <100, reservoirs are dominated by the UOR; when 100 < PEI < 500, they are dominated by the LOR; and if PEI > 500, they are dominated by CORs. Figure 16 shows the predicted results for Well C18, including sand body architecture, porosity, oil saturation, productivity parameters, and test results. The interval at 2433.9–2459.4 m was characterized by an Rg of 0.48 and a Dvr of 2.38, revealing that the reservoir interval is an A-type reservoir. Based on the effective reservoir thickness and petrophysical index calculated from the logging and deep resistivity curve values, the average PEI value of the perforated interval was 295. Using the Equations (3) and (4), the daily oil production is 20.1 barrels. Similarly, a UORs with a daily oil production of 0.38 barrel was predicted in the interval 2517.0–2527.2 m.
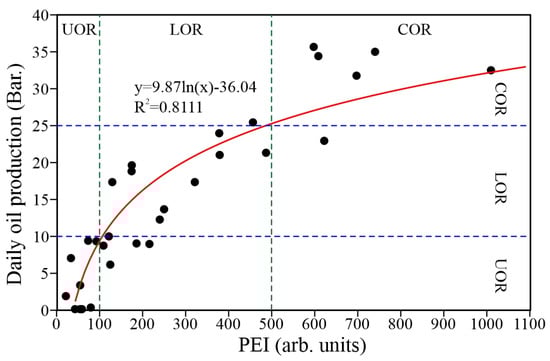
Figure 15.
Cross-plot showing a strong positive correlation between the integrated production capacity assessment indicator (PEI) through logging curves and daily oil production. COR = commercial tight oil reservoir; LOR = low-yielding tight oil reservoir; UOR = ultra-low-yielding tight oil reservoir.
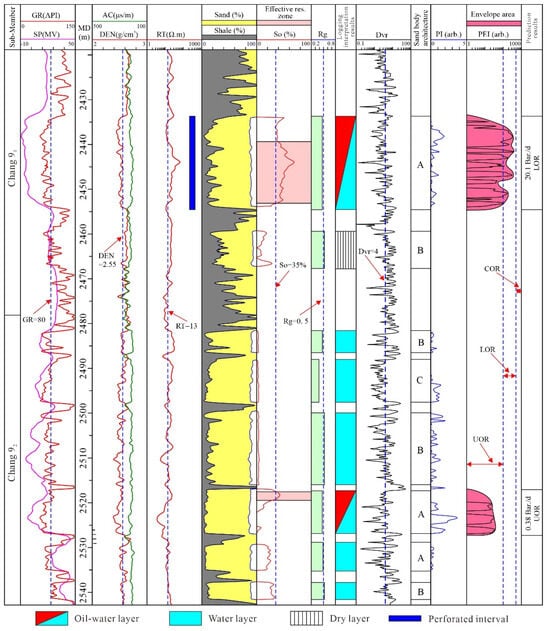
Figure 16.
Case of production capacity prediction from the Chang 9 tight sandstone oil reservoirs based on multivariate parameters in Well C18. Rg = relative center of gravity of logging curve; Dvr = deviation root of variance of logging curve; PI = petrophysical index; PEI = integrated evaluation indicator of productivity; A = massive architecture; B = massive and serrated architecture; C = fining upward architecture; COR = commercial tight oil reservoir; LOR = low-yielding tight oil reservoir; UOR = ultra-low-yielding tight oil reservoir.
5.3. Comparison of Productivity Prediction Methods for Tight Sandstone Oil Reservoirs
Recently, alongside the Ordos Basin, extensive tight sandstone oil reservoirs have been explored and developed in the Bohai Bay, Songliao, and Junggar basins in China [35,78,79,80]. These tight sandstone reservoirs are predominantly superimposed distributary channel sandstone reservoirs that exhibit low porosity, a complex pore structure, a large distribution area, abundant resources, and low natural productivity. Hydraulic fracturing is widely employed to increase production capacity [49,72].
Additionally, due to rising exploration and development costs, a number of energy companies have recently focused on assessing the production potential of tight sandstone oil reservoirs. Their efforts to optimize development intervals and conduct production capacity studies were aimed at increasing economic benefits. Common productivity prediction methods include empirical formulas [21,29,37,72], analytical and numerical simulations [81] and artificial intelligence optimization process methods [23,24,25]. Empirical methods include analyzing production capacity data from comparable tight sandstone oil reservoirs to develop empirical formulas suitable for specific conditions within the constraints of the reservoir parameters. Analytical methods directly derive a productivity formula for tight sandstone oil reservoirs through the analysis of fluid flow equations, with theoretical predictions being the focus. In contrast, numerical simulations involve a comprehensive approach based on numerical calculations that consider more complex reservoir properties, geofluid flow patterns, and other factors and require more reservoir parameters, making operations more difficult. The optimization methods using artificial intelligence focus on maintaining and increasing oil production during the development stage. However, they cannot be used as a reference for optimizing potential oil reserves before development. The method proposed in this study includes identifying oil reserves, predicting oil production, and optimizing the development interval based on logging curves after conducting open-hole logging, which makes it a more efficient method for productivity prediction. This method combines the advantages of empirical formulas and numerical simulation methods. This approach reflects the overall influence of geological factors, including lithology, microfacies, and sand body architecture, on reservoir productivity. This also highlights the broader influence of physical properties on productivity. Furthermore, this method accounts for the thickness scale of the effective reservoir, thereby improving the predictive capacity of the logging curve. Therefore, this comprehensive study advances existing research to significantly reduce the need for reservoir parameters in previous methods, streamline operations, and improve practical applications.
The method described in this study is based primarily on conventional logging curves. Therefore, the predictive capacity depends heavily on the potential of the curve values to characterize reservoir properties and vertical resolution. To examine the prediction results of the proposed methods, a cross-plot of the logging prediction and test results of the oil reservoirs was constructed (Figure 17). Notably, the intersection data points were distributed around 45° diagonal, and only a few samples in the red circle had larger errors. Therefore, the established production capacity prediction method for the production capacity of the Chang 9 tight sandstone oil reservoirs in the Jiyuan Area is reliable, and the prediction results are reasonable. The rankings of the oil reservoirs were highly consistent with the test results, with an accuracy rate of 86.7%. The misestimated oil reservoirs were located in neighboring ranks, which are typical examples in the green circle (Figure 17), with no evidence of rank skipping. To improve the accuracy of production capacity prediction for tight sandstone oil reservoirs, it is imperative to refine and extend the existing method by setting up additional interpretive logging parameters from other logging curves using more comprehensive techniques. The addition and combination of acoustic curves, shallow resistivity curves, and electrical image recording images could improve the evaluation indicators for oil production prediction in tight sandstone oil reservoirs.
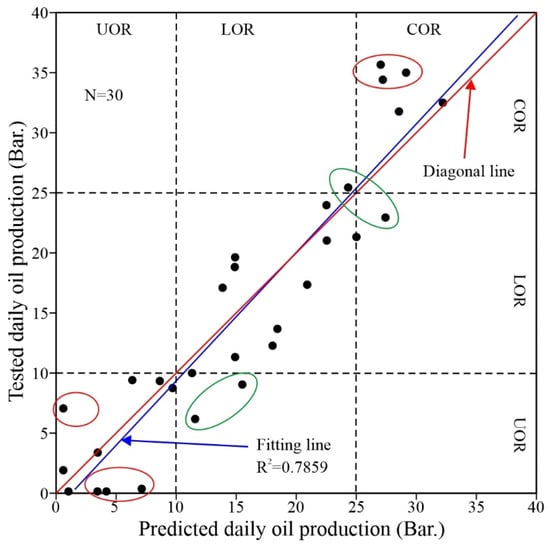
Figure 17.
Cross-plot shows good agreement between logging prediction results and tested daily oil production.
5.4. Significance for Petroleum Exploration and Development in Tight Sandstone
Analysis of geological and geophysical parameters, productivity assessment indicators, and daily oil production in the tested intervals revealed that a strong correlation between the productivity evaluation indicators was obtained using logging methods and the daily oil production of oil reservoirs. To further illustrate the significance of PEI parameters obtained from the conventional logging curves for the exploration and development of tight sandstone oil reservoirs, a PEI contour map was prepared employing the evaluation results of 139 wells in the Chang 9 Member of the Jiyuan area (Figure 18). The C 70–C 18 and C 328–C 290–C 141–C 50 Well areas located in the northwest and east of the study area, respectively, had high-values for the PEI parameter, consistent with the distribution area of commercial tight oil. Additionally, the isolated COR located in the C 190, C 142, C 119, C 38, C 193, and C 91 Well areas was also within the high range of PEI, reflecting, to some extent, the development potential. Therefore, based on the PEI contour map, it can be concluded that Wells C 195–C 44–C 124 are located in the southern part of the study area and C 189–C 121–C 48–C 79 are located in the northern part of the study area. The region features significant potential for contiguous commercial tight oil development. Therefore, efforts should be made to develop commercially viable tight oils from these wells in the future. The comparative results of the distribution of commercial tight oil and isolated well areas in the study area show that the PEI is a key parameter for predicting the production capacity of tight sandstone oil reservoirs and can serve as a reliable basis for optimizing production target areas. This is a powerful tool for energy companies to reduce development costs and improve their economic benefits.
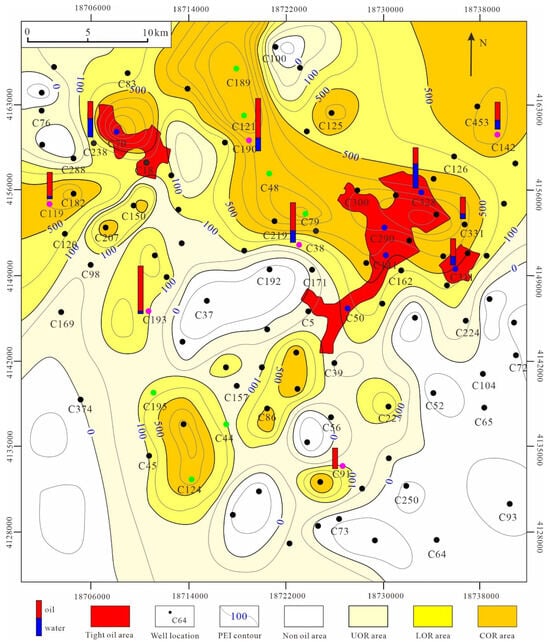
Figure 18.
PEI contour from logging calculation, the distribution of developed tight sandstone oil, and the predicted distribution for each of the three tight sandstone oil reservoirs of the Chang 911 unit, as well the study area is shown in Figure 1a. PEI = integrated evaluation indicator of productivity; COR = commercial tight oil reservoir; LOR = low-yielding tight oil reservoir; UOR = ultra-low-yielding tight oil reservoir.
6. Summary and Conclusions
The Chang 9 tight sandstone consists mainly of lithic feldspathic and feldspathic-lithic sandstones with interstitial laumontite and chlorite. The pore space consisted mainly of residual primary pores, and dissolution pores predominantly formed in the laumontite and feldspar grains. The average porosity and oil saturation of the tight sandstone reservoirs were 8.42% and 24.89%, respectively, indicating the development of typical tight oil reservoirs with low saturation.
Fine sandstone reservoirs with smooth sand body architecture were the main types of tight sandstone CORs. Furthermore, it was determined that having high porosity and oil bearing are fundamental requirements for tight sandstone commercial oil reservoirs, and the cumulative thickness scale of effective reservoirs serves as a crucial resource foundation for them.
This study proposes an effective and practical method for predicting productivity of tight sandstone oil reservoirs. Additionally, a comprehensive multivariate approach was assessed, incorporating deep resistivity, natural gamma, and density curves. In this regard, five geological parameters were proposed: relative center of gravity, root of variance of deviation, petrophysical index, effective reservoir thickness, and production capacity assessment indicator. Based on the longitudinal recognition of sand architecture for individual wells, the daily oil production and rank of tight sandstone oil reservoirs were predicted and evaluated by processing log data. The methods were applied to the Chang 9 Member and achieved presentable results worthy of popularization.
Author Contributions
Conceptualization, J.L.; methodology, Z.Z.; software, Z.L.; formal analysis, Z.L.; investigation, J.L.; data curation, Z.L.; writing—original draft preparation, Z.Z.; supervision, J.L.; project administration, Z.Z.; funding acquisition, Z.Z. All authors have read and agreed to the published version of the manuscript.
Funding
This research was funded by Initial Scientific Research Foundation of Xinjiang University for Doctors (Grant No. 620321016); the Research Foundation of Tianchi Outstanding Doctors (Grant No. 51052300560); and the Open Fund of Key Laboratory of Petroleum Resources Research, Gansu Province (Grant No. SZDKFJJ2023007).
Data Availability Statement
The data that support the findings in this study are available from the author, J.L., upon reasonable request.
Acknowledgments
We express our gratitude to the Editor-in-Chief of Processes, and anonymous reviewers, for their informative and constructive comments and suggestions, which have greatly improved the manuscript. The materials were supplied by the Exploration and Development Research Institute of the Changqing Oilfield, PetroChina.
Conflicts of Interest
Author Jianbo Liao and Zhiyong Li were employed by the Northwest Branch, Research Institute of Petroleum Exploration and Development, PetroChina. The remaining authors declare that the re-search was conducted in the absence of any commercial or financial relationships that could be construed as a potential conflict of interest.
References
- Schmitt, M.; Fernandes, C.P.; Wolf, F.G.; da Cunha Neto, J.A.B.; Rahner, C.P.; dos Santos, V.S.S. Characterization of Brazilian tight gas sandstones relating permeability and Angstrom-to micron-scale pore structures. J. Nat. Gas Sci. Eng. 2015, 27, 785–807. [Google Scholar] [CrossRef]
- Gaus, G.; Amann-Hildenbrand, A.; Krooss, B.M.; Fink, R. Gas permeability tests on core plugs from unconventional reservoir rocks under controlled stress: A comparison of different transient methods. J. Nat. Gas Sci. Eng. 2019, 65, 224–236. [Google Scholar] [CrossRef]
- Xie, R.C.; Zhou, W.; Liu, C.; Yin, S.; Radwan, A.E.; Lei, W.; Cai, W.L. Experimental investigation on dynamic and static rock mechanical behavior, failure modes, and sequences of frequent interbedded sand and shale reservoirs. Interpretation 2022, 10, 1–52. [Google Scholar] [CrossRef]
- Gilman, J.R.; Kazemi, H. Improvements in Simulation of Naturally Fractured Reservoirs. Soc. Pet. Eng. J. 1983, 23, 695–707. [Google Scholar] [CrossRef]
- Clarkson, C.; Freeman, M.; He, L.; Agamalian, M.; Melnichenko, Y.; Mastalerz, M.; Bustin, R.; Radliński, A.; Blach, T. Characterization of tight gas reservoir pore structure using USANS/SANS and gas adsorption analysis. Fuel 2012, 95, 371–385. [Google Scholar] [CrossRef]
- Huang, H.X.; Chen, L.; Sun, W.; Xiong, F.Y.; Ji, W.; Jia, J.K.; Tang, X.L.; Zhang, S.H.; Gao, J.W.; Luo, B. Pore-throat structure and fractal characteristics of shihezi formation tight gas sandstone in the Ordos basin, China. Fractals 2018, 26, 1840005. [Google Scholar] [CrossRef]
- Yao, J.L.; Zhao, Y.D.; Liu, G.L.; Qi, Y.L.; Li, Y.H.; Luo, A.X.; Zhang, X.L. Formation patterns of Chang 9 oil reservoir in Triassic Yanchang Formation, Ordos Basin, NW China. Pet. Explor. Dev. 2018, 45, 389–401. [Google Scholar] [CrossRef]
- Meyers, B.W.; Clinton, L.; Carlson, N.R. Productivity analysis of an East Texas gas well. In Proceedings of the SPWLA 25th Annual Logging Symposium, Oslo, Norway, 10–13 June 1984. [Google Scholar]
- Cheng, M.L.; Leal, M.A.; McNaughton, D. Productivity prediction from well logs in variable grain size reservoirs Cretaceous Qishn Formation, Republic of Yemen. Log Anal. 1999, 40, 24–34. [Google Scholar]
- Acharya, M.N.; Kabir, M.M.R.; Al-Ajmi, S.A.H. Flow capacity evaluation in a complex carbonate Reservoir: Key to understand reservoir productivity and stimulation effectiveness. In Proceedings of the SPE Technical Conference and Exhibition, San Antonio, TX, USA, 8–10 October 2012. [Google Scholar]
- Ren, J.H.; Zhang, L.; Ezekiel, J.; Ren, S.; Meng, S.Z. Reservoir characteristics and productivity analysis of tight sand gas in Upper Paleozoic Ordos Basin China. J. Nat. Gas Sci. Eng. 2014, 19, 244–250. [Google Scholar] [CrossRef]
- Farman, A.S.; Yeung, H. Experimental study of two-phase Air-water flow in large-diameter vertical pipes. Chem. Eng. Commun. 2015, 202, 823–842. [Google Scholar] [CrossRef]
- Wang, Q.; Xu, Y.; Li, S.T.; Su, L.; Wang, Y.; Yan, C.C.; Mou, W.W.; Li, Y. Dissolution simulation of Chang 8 tight reservoir in Jiyuan area of Ordos Basin, China and its influencing factors. J. Earth Sci. Environ. 2017, 39, 225–237. [Google Scholar]
- Thomas, F.; Shtepani, E.; Bennion, D.; Rushing, J. The Influence of Equilibrium Water on Gas-Well Productivity. J. Can. Pet. Technol. 2003, 42, 35–39. [Google Scholar] [CrossRef]
- Li, X.; Zhao, W.Z.; Zhou, C.C.; Wang, T.S.; Li, C.L. Dual-porosity saturation model of low-porosity and low-permeability clastic reservoirs. Pet. Explor. Dev. 2012, 39, 88–98. [Google Scholar] [CrossRef]
- Soto, B.R.; Perez, O.; Arteaga, D. A new reservoir classification based on pore types improves characterization. In Emu Official Organ of the Australasian Ornithologists Union; Australasian Ornithologists’ Union: Melbourne, Australia, 2012; Volume 83, pp. 59–65. [Google Scholar]
- Lai, B.T.; Miskimins, J.L. A new technique for accurately measuring two-phase relative permeability under non-Darcy flow conditions. J. Pet. Sci. Eng. 2015, 127, 398–408. [Google Scholar] [CrossRef]
- Hu, S.F.; Zhou, C.C.; Li, X.; Li, C.L.; Zhang, S.Q. A tight sandstone trapezoidal pore oil saturation model. Pet. Explor. Dev. 2017, 44, 876–886. [Google Scholar] [CrossRef]
- Nolte, S.; Fink, R.; Krooss, B.M.; Littke, R. Simultaneous determination of the effective stress coefficients for permeability and volumetric strain on a tight sandstone. J. Nat. Gas Sci. Eng. 2021, 95, 104186. [Google Scholar] [CrossRef]
- Li, G.X.; Liu, C.L.; Zhou, Y.N.; Wu, H.N.; Awan, R.S.; Shi, F.; Wu, Y.F.; Zang, Q.B.; Wu, Y.P. Controlling effects of pore-throat structure and fractal characteristics on the physical properties of ultra-low permeability sandstone reservoirs: A case study of the sixth member of the Yanchang Formation in the Xiaojiahe area, Ordos Basin. Geol. J. 2023, 58, 1945–1964. [Google Scholar] [CrossRef]
- Guo, Z.H.; Zhao, Y.C. Logging evaluation to tight gas reservoir in He-2 member of Daniudi Gas field. Nat. Gas Geosci. 2010, 21, 87–94. [Google Scholar]
- Zou, C.N.; Yang, Z.; Zhu, R.K.; Wu, S.T.; Fu, J.H.; Lei, D.W.; Hou, L.H.; Lin, S.H.; Pan, S.Q. Geologic significance and optimization technique of sweet sports in unconventional shale systems. J. Asian Earth Sci. 2019, 178, 97–112. [Google Scholar] [CrossRef]
- Oloso, M.S.; Khoukhi, A.; Abdulraheem, A.; Elshafei, M. Prediction of crude oil viscosity and gas/oil ratio curves using recent advances to neural networks. In Proceedings of the SPE/EAGE Reservoir Characterization and Simulation Conference, Abu Dhabi, United Arab Emirates, 19–21 October 2009. [Google Scholar]
- Alarifi, S.; Alnuaim, S.; Abdulraheem, A. Productivity index prediction for oil horizontal wells using different artificial intelligence techniques. In Proceedings of the SPE Middle East Oil & Gas Show and Conference, Manama, Bahrain, 8–11 March 2015; p. 172729. [Google Scholar]
- Zhang, Z.H.; Liao, J.B.; Li, Z.Y.; Zheng, X.M.; Di, J.; Yu, P.H. Fast prediction of productivity level of low permeability reservoirs based on multilayer perceptron: A case study of Chang 3, 4+5 reservoirs of Baibao, Nanliang areas in Ordos basin. Prog. Geophys. 2019, 34, 1962–1970. [Google Scholar]
- Rinaldi; Djauhari, H. Prediction of specific productivity index for Sihapas Formation in uncored wells of minas field using limited available core and log date. Soc. Pet. Eng. J. 1997, 38037. [Google Scholar] [CrossRef]
- Mao, Z. Method and models for productivity prediction of hydrocarbon reservoirs. Acta Pet. Sin. 2000, 21, 58–62. [Google Scholar]
- Tan, C.Q.; Ma, N.R. Model and method for oil and gas productivity prediction of reservoir. J. Earth Sci. Environ. 2004, 26, 42–46. [Google Scholar]
- Feng, C.; Lin, W.; Cheng, Z. Reservoir classification and productivity forecasting method for low porosity and permeability reservoir with log data. Well Logging Technol. 2012, 36, 308–313. [Google Scholar]
- Liu, J.L.; Liu, Z.Q.; Xiao, K.H.; Huang, Y.Q.; Jin, W.J. Characterization of favorable lithofacies in tight sandstone reservoirs and its significance for gas exploration and exploitation: A case study of the second Member of Triassic Xujiahe Formation in the Xinchang area, Sichuan Basin. Pet. Explor. Dev. 2020, 47, 1194–1205. [Google Scholar] [CrossRef]
- Qiao, J.C.; Zeng, J.H.; Jiang, S.; Wang, Y.N. Impacts of sedimentology and diagenesis on pore structure and reservoir quality in tight oil sandstone reservoirs: Implications for macroscopic and microscopic heterogeneities. Mar. Pet. Geol. 2020, 111, 279–300. [Google Scholar] [CrossRef]
- Liu, H.L.; Qiu, Z.; Xu, L.M.; Wang, F.Q.; Tong, Q.; Lin, J.H.; Yin, S.; Wang, W.Q. Distribution of shallow water delta sand bodies and the genesis of thick layer sand bodies of the Triassic Yanchang Formation, Longdong Area, Ordos Basin. Pet. Explor. Dev. 2021, 48, 123–135. [Google Scholar] [CrossRef]
- Liu, J.D.; Li, L.; Zhang, C.J.; Jiang, Y.L.; Swennen, R.; Zhao, C.J.; Hou, S. Identification and quantitative evaluation of pores and throats of a tight sandstone reservoir (Upper Triassic Xujiahe Formation, Sichuan Basin, China). Mar. Pet. Geol. 2022, 140, 105663. [Google Scholar] [CrossRef]
- Dong, X.X.; Meng, X.Z.; Pu, R.H. Impacts of mineralogy and pore throat structure on the movable fluid of tight sandstone gas reservoirs in coal measure strata: A case study of the Shanxi formation along the southeastern margin of the Ordos Basin. J. Pet. Sci. Eng. 2023, 220, 111257. [Google Scholar] [CrossRef]
- Chen, Y.H.; Liu, S.H.; Zhu, Z.W.; Wang, Z.; Sun, X.G.; Xu, T. Geochemical characteristics and sedimentary setting of chang 9 shale in the Upper Triassic Yanchang Formation of southeastern Ordos Basin (NW China). J. Pet. Sci. Eng. 2021, 196, 108081. [Google Scholar] [CrossRef]
- Cui, J.W.; Zhang, Z.Y.; Zhang, Y.; Liu, G.L.; Qi, Y.L. Oil and gas accumulation periods and charging path of continental lake basin: A case study of the Chang 9-Chang 10 oil reservoir in the Yanchang formation in the Ordos Basin. J. Pet. Sci. Eng. 2022, 219, 111136. [Google Scholar] [CrossRef]
- Feng, D.H.; Liu, C.L.; Feng, X.L.; Wang, X.P.; Awan, R.S.; Yang, X.Y.; Xu, N.; Wu, Y.F.; Wu, Y.P.; Zang, Q.B. Movable fluid evaluation of tight sandstone reservoirs in lacustrine delta front setting: Occurrence characteristics, multiple control factors, and prediction model. Mar. Pet. Geol. 2023, 155, 106393. [Google Scholar] [CrossRef]
- Zhang, Z.H.; Li, Z.Y.; Deng, X.Q.; Liao, J.B.; Zheng, X.M. Multi-parameters logging identifying method for sand body architectures of tight sandstones: A case from the Triassic Chang 9 Member, Longdong area, Ordos Basin, NW China. J. Pet. Sci. Eng. 2022, 216, 110824. [Google Scholar] [CrossRef]
- Yang, Y.T.; Li, W.; Ma, L. Tectonic and stratigraphic controls of hydrocarbon systems in the Ordos basin: A multicycle cratonic basin in central China. AAPG Bull. 2005, 89, 255–269. [Google Scholar] [CrossRef]
- Zhou, Y.; Ji, Y.L.; Xu, L.M.; Che, S.Q.; Niu, X.B.; Wan, L.; Zhou, Y.Q.; Li, Z.C.; You, Y. Controls on reservoir heterogeneity of tight sand oil reservoirs in Upper Triassic Yanchang Formation in Longdong Area, southwest Ordos Basin, China: Implications for reservoir quality prediction and oil accumulation. Mar. Pet. Geol. 2016, 78, 110–135. [Google Scholar] [CrossRef]
- Zhang, Z.H.; Li, Z.Y.; Deng, X.Q.; Liao, J.B.; Li, X.B. Quantitative characterization and distribution of petrologically superior sandbodies in a shallow-water delta: Chang 81 sub-member, Triassic Yanchang Formation, Longdong area, Ordos Basin, China. Arab. J. Geosci. 2022, 15, 733. [Google Scholar] [CrossRef]
- Li, Y.; Chang, X.C.; Yin, W.; Wang, G.W.; Zhang, J.L.; Shi, B.B.; Zhang, J.H.; Mao, L.X. Quantitative identification of diagenetic facies and controls on reservoir quality for tight sandstones: A case study of the Triassic Chang 9 oil layer, Zhenjing area, Ordos Basin. Mar. Pet. Geol. 2019, 102, 680–694. [Google Scholar] [CrossRef]
- Xie, X.Y. Provenance and sediment dispersal of the Triassic Yanchang Formation, southwest Ordos Basin, China, and its implication. Sediment. Geol. 2016, 335, 1–16. [Google Scholar] [CrossRef]
- Wang, G.W.; Chang, X.C.; Yin, W.; Li, Y.; Song, T.T. Impact of diagenesis on reservoir quality and heterogeneity of the Upper Triassic Chang 8 tight oil sandstones in the Zhenjing area, Ordos Basin, China. Mar. Pet. Geol. 2017, 83, 84–96. [Google Scholar] [CrossRef]
- Duan, Y.; Wang, C.Y.; Zheng, C.Y.; Wu, B.X.; Zheng, G.D. Geochemical study of crude oils from the Xifeng oilfield of the Ordos basin, China. J. Asian Earth Sci. 2008, 31, 341–356. [Google Scholar] [CrossRef]
- Liu, H.P.; Zhao, Y.C.; Luo, Y.; Xiao, G.J.; Meng, Y.J.; Zhou, S.B.; Shao, L.K. Origin of the reservoir quality difference between Chang 8 and Chang 9 Member sandstones in the Honghe Oil Field of the Southern Ordos Basin, China. J. Pet. Sci. Eng. 2020, 185, 106668. [Google Scholar] [CrossRef]
- Fu, J.H.; Liu, G.D.; Yang, W.W. A study of the accumulation periods of low permeability reservoir of Yanchang formation in Longdong area, Ordos Basin. Earth Sci. Front. 2013, 20, 125–131. [Google Scholar]
- Chen, S.J.; Lei, J.J.; Liu, C.; Yao, J.L.; Li, Y.; Li, S.X.; Su, K.M.; Xiao, Z.L. Factors controlling the reservoir accumulation of Triassic Chang 6 Member in Jiyuan-Wuqi area, Ordos Basin, NW China. Pet. Explor. Dev. 2019, 46, 253–264. [Google Scholar] [CrossRef]
- Zou, C.N.; Zhai, G.M.; Zhang, G.Y.; Wang, H.J.; Zhang, G.S.; Li, J.Z.; Wang, Z.M.; Wen, Z.X.; Ma, F.; Liang, Y.B.; et al. Formation, distribution, potential and prediction of global conventional and unconventional hydrocarbon resources. Pet. Explor. Dev. 2015, 42, 14–28. [Google Scholar] [CrossRef]
- GB/T 18295-2001; Analysis Method of Sandstone Sample of Petroleum and Gas Reservoir by Scanning Electron Microscope. Standardization Administration of China: Beijing, China, 2001; pp. 2–5.
- SY/T 5346-2005; Rock Capillary Pressure Measurement. National Development and Reform Commission of China: Beijing, China, 2005; pp. 6–8.
- GB/T 29172-2012; Practices for Core Analysis. Standardization Administration of China: Beijing, China, 2012; pp. 78–153.
- SY/T 5788.3-2014; Specifications for Geological Logging of Oil and Gas Well. National Energy Administration of China: Beijing, China, 2014; pp. 17–24.
- Allen, D.R. Chapter 7 identification of sediments—Their depositional environment and degree of compaction—From well logs. Dev. Sedimentol. 1975, 18, 349–401. [Google Scholar]
- Serra, O.; Abbott, H.T. The Contribution of Logging Data to Sedimentology and Stratigraphy. Soc. Pet. Eng. J. 1982, 22, 117–131. [Google Scholar] [CrossRef]
- Shi, Y.J.; Zhang, H.T.; Zhou, J.Y.; Ding, W.P.; Wang, C.S. Division of formation structure using conventional logging attributes analysis. Well Logging Technol. 2016, 40, 493–497. [Google Scholar]
- Folk, R. Petrology of Sedimentary Rocks; Hemphill Publishing Company: Austin, TX, USA, 1980. [Google Scholar]
- Morad, S.; Al-Ramadan, K.; Ketzer, J.M. Spatial and temporal distribution of diagenetic alterations in siliciclastic rocks: Implications for msaa transfer in sedimentary basins. Sedimentology 2010, 47, 95–120. [Google Scholar] [CrossRef]
- Nabawy, B.S.; Abudeif, A.M.; Masoud, M.M.; Radwan, A.E. An integrated workflow for petrophysical characterization, microfacies analysis, and diagenetic attributes of the Lower Jurassic type section in northeastern Africa margin: Implications for subsurface gas prospection. Mar. Pet. Geol. 2022, 140, 105678. [Google Scholar] [CrossRef]
- Rogers, J.J.W. Relationships between porosity, median size, and sorting coefficients of synthetic sands. J. Sediment. Petrol. 1961, 31, 467–470. [Google Scholar]
- Barbier, M.; Hamon, Y.; Callot, J.-P.; Floquet, M.; Daniel, J.-M. Sedimentary and diagenetic controls on the multiscale fracturing pattern of a carbonate reservoir: The Madison Formation (Sheep Mountain, Wyoming, USA). Mar. Pet. Geol. 2012, 29, 50–67. [Google Scholar] [CrossRef]
- Anovitz, L.; Cole, D.; Rother, G.; Allard, L.; Jackson, A.; Littrell, K. Diagenetic changes in macro- to nano-scale porosity in the St. Peter Sandstone: An (ultra) small angle neutron scattering and backscattered electron imaging analysis. Geochim. Cosmochim. Acta 2013, 102, 280–305. [Google Scholar] [CrossRef]
- Sander, R.; Pan, Z.; Connell, L.D. Laboratory measurement of low permeability unconventional gas reservoir rocks: A review of experimental methods. J. Nat. Gas Sci. Eng. 2017, 37, 248–279. [Google Scholar] [CrossRef]
- An, W.Q.; Yue, X.A.; Zou, J.R.; Zhang, L.J.; Yan, R.J. Measuring gas permeability in tight cores at high pressure: Insights into supercritical carbon dioxide seepage characteristics. Geoenergy Sci. Eng. 2023, 229, 212070. [Google Scholar] [CrossRef]
- Xie, L.Z.; Yuan, Z.R.; He, B.; Wang, R.X. Experimental and molecular dynamics studies on the multiscale permeability properties of various gases in salt rock. Energy 2024, 290, 130079. [Google Scholar] [CrossRef]
- Bloch, S.; Lander, R.H.; Bonnell, L.M. Anomalously high porosity and permeability in deeply buried sandstone reservoirs: Origin and predictability. AAPG Bull. 2002, 86, 301–328. [Google Scholar]
- Li, M.; Yao, J.L.; Guo, Y.H.; Li, Z.F.; Wang, H.C.; Song, X.J. Sandbody architecture types and diagenesis differences of quartz sandstone of the Member 23 of Permian Shanxi Formation, eastern Ordos Basin. J. Palaeogeogr. 2018, 20, 465–476. [Google Scholar]
- Chen, L.C.; Tan, J.Q.; Cui, H.S.; Ma, X.; Song, X.Q.; Yuan, Q.; Liu, J. Hydrocarbon generation mechanism of lamalginite- and telalginite-dominated source rocks in a saline lake basin: A case study of the Permian Lucaogou formation in the Jimusaer Sag, Junggar Basin. Energy Geosci. 2023, 4, 100191. [Google Scholar] [CrossRef]
- Lv, J.H.; Jiang, F.J.; Hu, T.; Zhang, C.X.; Huang, R.D.; Hu, M.L.; Xue, J.; Huang, L.L.; Wu, Y.P.; Xue, J.; et al. Control of complex lithofacies on the shale oil potential in ancient alkaline lacustrine basins: The Fengcheng Formation, Mahu Sag, Junggar Basin. Geoenergy Sci. Eng. 2023, 224, 211501. [Google Scholar] [CrossRef]
- Salih, N.M. The impact of hydrothermal fluids on porosity enhancement and hydrocarbon migration in Qamchuqa Formation, Lower Cretaceous, Kirkuk Oil Company. Minerals 2023, 13, 377. [Google Scholar] [CrossRef]
- Salih, N.M.; Al-Majmaie, S.M.; Muhammad, Z.A. The porous–permeable zones in heterogeneous carbonate reservoirs: A case study from Amara Oilfield, Iraq. Proceedings 2023, 87, 35. [Google Scholar]
- Yao, J.L.; Zeng, J.H.; Luo, A.X.; Yang, Z.F.; Deng, X.Q. Controlling effect of source-reservoir structure in tight reservoir on oil-bearing property: A case study of Chang 6—Chang 8 Members in Heshui area of Ordos Basin, China. J. Earth Sci. Environ. 2019, 41, 267–280. [Google Scholar]
- Nasehi, M.J.; Mortazavi, A. Effects of in-situ stress regime and intact rock strength parameters on the hydraulic fracturing. J. Pet. Sci. Eng. 2013, 108, 211–221. [Google Scholar] [CrossRef]
- Zhang, Z.H.; Yu, H.G.; Chen, H.Y.; Du, S.K.; Li, C. Quantitative characterization of fracture-pore distribution and effects on production capacity of weathered volcanic crust reservoirs: Insights from volcanic gas reservoirs of the Dixi area, Junggar Basin, Western China. Mar. Pet. Geol. 2022, 140, 105651. [Google Scholar] [CrossRef]
- Cui, X.Y.; Radwan, A. Coupling relationship between current in-situ stress and natural fractures of continental tight sandstone oil reservoirs. Interpretation 2022, 10, SF9–SF21. [Google Scholar] [CrossRef]
- Li, N.; Wang, K.W.; Zhang, G.; Wu, H.L.; Zhao, L.Z.; Wu, L.H.; Feng, Q.F.; Feng, Z. Prediction of gas production in carbonates based on CT analysis and nuclear magnetic response (NMR) logging. Pet. Explor. Dev. 2015, 42, 167–174. [Google Scholar] [CrossRef]
- Li, X.; Li, C.L.; Li, B.; Liu, X.F.; Yuan, C. Response laws of rock electrical property and saturation evaluation method of tight sandstone. Pet. Explor. Dev. 2020, 47, 214–224. [Google Scholar] [CrossRef]
- Zhang, L.; Bao, Z.D.; Dou, L.X.; Zang, D.S.; Mao, S.W.; Song, J.; Zhao, J.H.; Wang, Z.C. Sedimentary characteristics and pattern of distributary channels in shallow water deltaic red bed succession: A case from the Late Cretaceous Yaojia formation, southern Songliao Basin, NE China. J. Pet. Sci. Eng. 2018, 171, 1171–1190. [Google Scholar] [CrossRef]
- Zhang, L.; Bao, Z.D.; Lin, Y.B.; Chen, Y.M.; Lin, X.H.; Dou, L.X.; Kong, B. Genetic types and sedimentary model of sandbodies in a shallow-water delta: A case study of the first Member of Cretaceous Yaojia Formation in Qian’an area, south of Songliao Basin, NE China. Pet. Explor. Dev. 2017, 44, 727–736. [Google Scholar] [CrossRef]
- Wang, M.Q.; Xie, J.; Zhang, Q.; Wang, Y.J.; Duan, Y.J. Characteristics and sedimentary model of a reticular shallow-water delta with distributary channels: Lower member of the Neogene Minghuazhen Formation in the Bozhong area of the Huanghekou Sag, China. Arab. J. Geosci. 2019, 12, 760. [Google Scholar] [CrossRef]
- Wang, Q.; Tan, M.J.; Xiao, C.W.; Wang, S.Y.; Han, C.; Zhang, L.T. Pore-scale electrical numerical simulation and new saturation model of fractured tight sandstone. AAPG Bull. 2022, 106, 1479–1497. [Google Scholar] [CrossRef]
Disclaimer/Publisher’s Note: The statements, opinions and data contained in all publications are solely those of the individual author(s) and contributor(s) and not of MDPI and/or the editor(s). MDPI and/or the editor(s) disclaim responsibility for any injury to people or property resulting from any ideas, methods, instructions or products referred to in the content. |
© 2024 by the authors. Licensee MDPI, Basel, Switzerland. This article is an open access article distributed under the terms and conditions of the Creative Commons Attribution (CC BY) license (https://creativecommons.org/licenses/by/4.0/).